Abstract
This study highlights the increasing demand for battery-operated applications, particularly electric vehicles (EVs), necessitating the development of more efficient Battery Management Systems (BMS), particularly lithium-ion (Li-ion) batteries used in energy storage systems (ESS). This research addresses some of the key limitations of current BMS technologies, with a focus on accurately predicting the remaining useful life (RUL) of batteries, which is a critical factor for ensuring operational efficiency and sustainability. Real-time data are collected from sensors via an Internet of Things (IoT) device and processed using Arduino Nano, which extracts values for input into a Long Short-Term Memory (LSTM) model. This model employs the National Aeronautics and Space Administration (NASA) Li-battery dataset and current, voltage temperature, and cycle values to predict the battery RUL. The proposed model demonstrates significant forecasting precision, attaining a root mean square error (RMSE) of 0.01173, outperforming all comparative models. This improvement facilitates more effective decision-making in BMS, particularly in resource allocation and adaptability to transient conditions. However, the practical implementation of real-time data acquisition systems at a scale and across diverse environments remains challenging. Future research will focus on enhancing the generalizability of the model, expanding its applicability to broader datasets, and automating data ingestion to minimize integration challenges. These advancements are aimed at improving energy efficiency in both industrial and residential applications in accordance with the Sustainable Development Goals (SDGs) of the UN.
Keywords: Lithium-ion, Batteries, Battery management systems, Internet of things, LSTM, SoH
Subject terms: Electrical and electronic engineering, Computer science
Introduction
Over the last few years, an increasing number of battery-operated devices have hit the market, such as electric vehicles (EVs), which have experienced a tremendous global increase in the demand for energy storage technologies1. Li-ion batteries (LIBs) play a crucial role in modern energy systems, enabling several sectors such as transportation, telecommunications, and renewable integration, which rely on LIBs2. When these technologies are rapidly progressing, the dependability of and longevity provided by LIBs is more important than ever, accompanied by the need for sophisticated battery management systems (BMS) to control this technology in a way that maximizes performance while prolonging battery life. Although LIBs are versatile, they experience challenges associated with capacity fading over time, mainly attributed to complicated aging mechanisms during charge-discharge cycles. Batteries are conventionally considered to have reached their first application end of life (EOL) when the capacity falls below 70–80% of the rated output3. This loss of capacity is detrimental not only to the lifecycle performance of the battery but is also applied in use cases (for example, EVs and grid EES), which can significantly affect reliability and safety4. The above reasons have led to the fact that both battery failure risks can monitor battery health and determine the remaining useful life (RUL) of batteries as accurately as possible, thus being an important factor in the reduction. Control maintenance strategies for failures and their optima5.
For batteries, the state of health (SOH) is a key parameter for evaluating battery degradation and is given as a percentage of the original capacity. Thus far, SOH has generally been estimated indirectly, and it is not possible to directly measure its value6. Therefore, estimates based on factors such as counting charge and discharge cycles have come up with figures. The rated RUL, which is akin to the SOH, shows how many charge-discharge cycles are left to the battery before its performance falls below a satisfactory level. Regarding the requirements of transitions between SOH and RUL, it is critical for manufacturers or users who want to prolong battery life and reliability as well as reduce costs for their maintenance intervals7. Over the years, Internet of Things (IoT) technologies have evolved to the point where real-time data acquisition and remote monitoring have become fundamental features of standard BMS. The IoT enables continuous data streams from distributed battery systems, offering dynamic and instantaneous insights into battery performance, degradation, and health status8. This connectivity not only enhances the monitoring of critical parameters such as temperature, voltage, and current, but also makes predictive analytics feasible by integrating data-driven models9. The transition to IoT in a BMS enhances proactive maintenance, allowing the system to respond swiftly to battery health abnormalities, improve safety, and reduce operational variability10.
Precise and predictive observation of RUL allows for early maintenance, which is a major step towards contributing to sustainable energy solutions11. There are many methods used to predict the RUL, and they can be broadly classified as data-driven, model-based, or hybrid. In contrast, model-based approaches use mathematical and physical models to predict RUL from degradation behaviors, which inherently rely on a great deal of knowledge of the underlying electrochemical processes12. On the opposite side of the row, data-driven methods predict RUL using past data without a deep physical understanding. Such methods tend to use statistical and machine learning approaches to find degradation patterns from a massive amount of data13. There are pros and cons to both of these strategies, data that have high levels of noise will lead the model-strategies in the wrong direction, on the other hand, it takes time to collect large amounts of data for building a ‘good’ control model14.
By utilizing an IoT-enhanced BMS, the RUL of batteries can be accurately predicted through continuous monitoring and predictive models, reducing the likelihood of failures and increasing overall system reliability15. Recently, a trend of hybridization has been observed in the literature between model-based and data-driven approaches under the aegis of RUL prediction. These methods blend data-driven strategies with physics-based information to improve forecast performance and reliability and to understand the mechanisms underlying deterioration16.
The background of this study is presented in the second section. The third section discusses the hardware implementation for real-time data acquisition, the fourth section presents the RUL prediction framework, and the last section includes real-time data-based results and conclusions.
Background
The background section presents a brief overview of related work on battery health management and prediction methods, focusing mainly on common approaches for predicting the SOH and RUL of LIBs.
BMS is becoming increasingly important in battery-operated applications, such as EVs and renewable EES, and continues to become more widespread17. Energy LIBs and their energy storage efficiency make them indispensable for many applications; however, they also suffer from capacity fading and aging stimuli that substantially reduce their performance and reliability and contribute to the generation of safety hazards18. SOH and RUL represent important metrics for the evaluation of LIB performance and longevity; SOH quantifies battery degradation, whereas RUL indicates the remaining charge-discharge cycles before performance degrades to unacceptable levels19. By introducing IoT in a BMS, real-time data acquisition can be feasible to enable monitoring and remote control of important parameters such as voltage, current, and temperature. Consequently, this leads to more efficient battery usage of the entire battery life20. The reviewed studies also explored issues related to monitoring, measurement accuracy, and thermal management and cost requirements. To address these developments, wireless BMS (WBMS) and modular designs to improve reliability and efficiency are being created with more emphasis on industrial applications. It has also been suggested that future research directions must include the use of more advanced deep learning models to predict battery health and understand the material requirements for energy storage21.
In recent years, different types of prediction models have been developed, which can be broadly split into data-driven, model-based, and hybrid methodologies. Data-driven approaches use historical data to identify typical patterns of battery degradation and are rooted in statistical and machine learning methods22. In contrast, model-based methods predict the RUL from established physical and mathematical models based on the electrochemical behavior of batteries. Hybridization of these strategies has become popular because it benefits from both paradigms by improving the accuracy and strength of forecasting23. RUL prediction has recently gained importance with an increase in the need for sustainable energy solutions. This has been demonstrated in a review of the recent literature. Several studies have used Root Mean Square Error (RMSE) values to describe the prediction accuracy of different models. The growing use of Li-ion batteries in various applications highlights the need for Prognostic and Health Management (PHM) to guarantee their safety and reliability18–22.
This study24 introduced a hybrid attention-forgetting online sequential extreme learning machine (HA-FOSELM) optimized using the Hybrid Grey Wolf Optimizer (HGWO) and attention mechanism to enhance prediction accuracy. These values were 0.0135 and 0.0783 for the Long Short-Term Memory (LSTM) and RVM, respectively. The proposed HA-FOSELM method obtained a slightly higher RMSE of 0.098 compared to the traditional models, indicating room for further improvement in Li-ion battery RUL predictions. For Dataset 05, a previous study25 reported RMSE values of 0.0282, 0.0322, 0.0208, and 0.113 for MC-GRU, MC-SRU, MC-LSTM, and LSTM, respectively. Similarly, the RNN, RVM, and PA-LSTM models26 exhibited RMSEs of 0.1047, 0.0784, and 0.0937, respectively. Another study27 highlighted the development of a multichannel LSTM model that leveraged voltage, current, and temperature data, achieving an RMSE of 0.0166 using the ICC-CNN-LSTM model. The key contribution of this study is the refinement of the ICC-CNN-LSTM methodology for RUL prediction, which attained an RMSE of 0.0166 for the dataset, showing an improved prediction accuracy over other traditional methods. Table 1 presents the key contributions and RMSE values of the various models for Battery 05.
Table 1.
Key contribution and RMSE of models for battery 05.
| Author | Key contribution | Model | Battery 5 |
|---|---|---|---|
| 27 | Developed a multi-channel LSTM model leveraging voltage, current, and temperature data, achieving RMSE of 0.0166 significantly enhancing RUL prediction accuracy for Li-ion batteries. | LSTM | 0.0983 |
| CNN-LSTM | 0.0174 | ||
| ICC-LSTM | 0.0878 | ||
| ICC-CNN-LSTM | 0.0166 | ||
| RNN | 0.1051 | ||
| 24 | Introduced the Hybrid Attention Forgetting Online Sequential Extreme Learning Machine (HA-FOSELM), achieving superior RUL prediction accuracy with RMSE of, optimized through the Hybrid Grey Wolf Optimizer and attention mechanism. | LSTM | 0.0135 |
| RVM | 0.0783 | ||
| HA-FOSELM | 0.098 | ||
| MC-RNN | 0.0255 | ||
| 25 | RUL prediction result as baseline LSTM, SC-LSTM AND MC-LSTM | BL- LSTM | 0.0121 |
| SC-LSTM | 0.0245 | ||
| MC-LSTM | 0.0168 | ||
| Achieved RMSE of 0.0208 for LSTM in RUL predictions using a dataset, demonstrating the model’s comparative performance against MC-GRU, MC-SRU, and other methods. | MC-GRU | 0.0282 | |
| MC-SRU | 0.0322 | ||
| MC-LSTM | 0.0208 | ||
| LSTM | 0.113 | ||
| 26 | Reported RMSE of 0.0784 for PA-LSTM in RUL prediction, outperforming traditional RNN and RVM models. | RNN | 0.1047 |
| RVM | 0.0784 | ||
| PA-LSTM | 0.0937 |
The growing reliance on Li-ion batteries for mission-critical applications, such as EVs and renewable EES, has led to an immediate need for improved battery health and RUL prediction techniques28. Compromised predictive accuracy by being unable to account for the nuances of real world operational conditions (including dynamic charging profiles), existing models lead to compromised prediction accuracies and hence can impact safety and efficiency16,29. Thus, there exists an unprecedented urgency in developing next-generation predictive models that are not only highly accurate but can also be continuously adapted to real-time data, as we see with applications at scale today.
To address these challenges, this study proposes an improved RUL prediction framework based on LSTM networks and IoT data acquisition in real-time. Utilizing the National Aeronautics and Space Administration (NASA) Li-ion battery dataset, the model aims at better predictability with an expected RMSE that is far below the existing values reported. This research also contributes to sustainable development by optimizing battery lifecycles in alignment with the United Nations SDGs for energy efficiency and responsible consumption patterns. Important contributions of this study over the following years:
An advanced model was developed to predict the RUL of Li-ion batteries, improving the prediction accuracy compared to existing models, with the lowest RMSE of 0.01173. Keras with LSTM networks allows the accurate prediction of RUL, which is a challenge for predicting energy storage.
The model was validated to predict battery health using a comprehensive NASA dataset of many different types that were tested rigorously, meaning that the models were extensively tested against large amounts of data.
Real-time data logging for accurate RUL prediction would enable implementation in dynamic, practical environments, such as vehicles.
The study boosts carbon emission reduction by enhancing Li-ion batteries to be more efficient and last longer, aligning with the global clean energy goals for 2030.
Hardware implementation
Real-time data acquisition systems are being developed to ensure the continuous and precise monitoring of critical battery parameters, enabling accurate performance evaluation and data retention. This section explains the connections between IoT device components, such as microcontrollers, sensors, battery cells, and monitoring systems.
The system integrates an Arduino microcontroller with sensor modules to capture real-time data on the voltage, current, and temperature. The data are processed and stored, providing comprehensive insights into battery behavior under varying conditions. An 18,500 Li-ion rechargeable battery cell with 3.7 V and 2000 mAh capacity was used for the system21. With a C-rate of 1 C, the battery discharge rate makes it ideal for transmitter design, allowing for 2000 mA of charging or discharging. The cell weigh was 50.0 g and measured at 18 m. X 50 m.m30. It offers a life exceeding 500 cycles, thereby ensuring long-term reliability and high performance. a 3.7 V/1 Amp adapter was used for this setup. Voltage sensors (VCC < 25 V) were linked to the terminals of the adapter and battery to calculate voltages31. These sensors are capable of handling input voltages up to 25 V. In addition, two ACS712 modules for sensing the current were integrated to measure both the load and charging currents, delivering essential data on the flow of the current within the cell32. Each current sensor can measure up to 5 A. A DHT11 temperature sensor was also incorporated into the system to precisely monitor the temperature of the battery (measured in °C). Temperature is a crucial parameter that influences the optimal performance and safety of a cell during operation33.
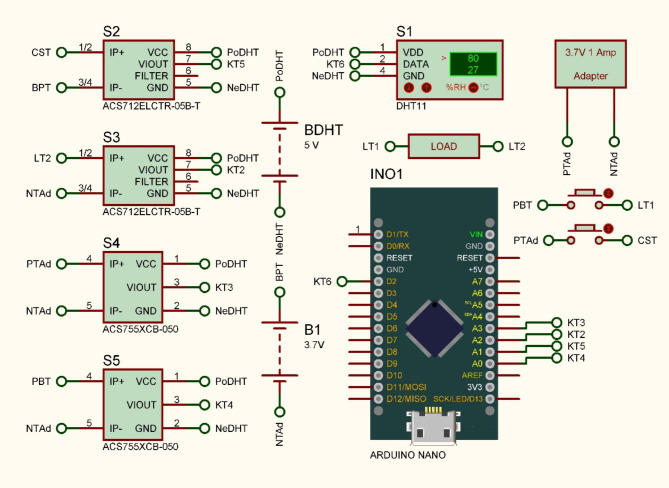
The configuration of the system pins and connections is shown in Fig. 1. The Adapter’s positive connection point (PTAd) is linked with the pin of the switch as represented in the figure, On the other hand, the current sensor (CS2) is connected with the second pin of the switch (CST). The anode of the battery (NTAd) and the ground connector of the adapter were connected. The connection pin of the current sensor is connected to the positive terminal (the). The positive terminal of the voltage sensor (S4) was connected to the adapter’s positive point, and its negative connection pin (NTAd) was connected to the negative terminal (NTAd) of the same adapter (PTAd). Comparably, the switch’s other pin is connected to the load’s pin (LT1), the load’s other pin (LT2) is connected to the current sensor (S3), and the anode of the battery (NTAd) is attached to the third terminal of the S3 sensor. The cathode (BPT) of battery B1 is linked to one connection pin of both the voltage sensor (S5) and the switch, whereas the anode (NTAd) is connected to the negative terminal of S5 (NTAd). The battery (B1) is on top of the battery (S1). The positive terminal of each sensor (S1–S5) is linked to a 5-volt power source (BDHT), whereas the negative terminal is grounded via (G2). The Arduino Nano BLE 33 Microcontroller Unit (MCU) having connections as the DATA terminal of S1 linked to KT6, the VIOUT terminal of S2 linked to KT5, the VIOUT terminal of S3 linked to KT2, the VIOUT terminal of S4 linked to KT4, and the VIOUT terminal of S5 linked to KT5.
Fig. 1.
Pin diagram of system.
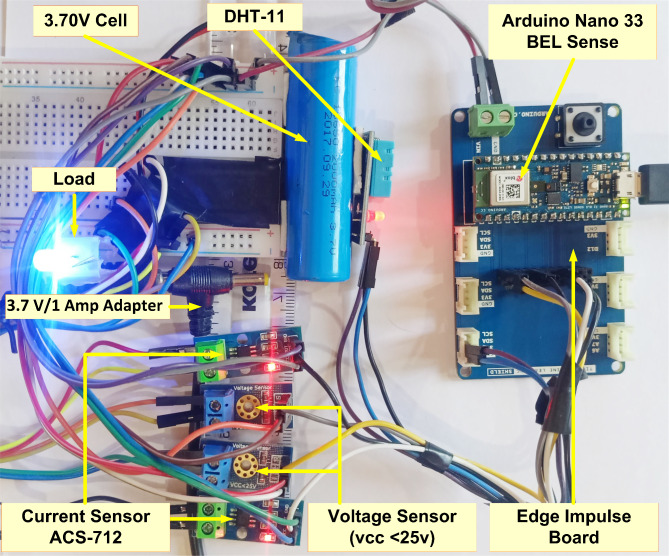
As noted in an earlier part of this study, the load, battery cell, and sensors are visible in the real hardware configuration of the setup, as shown in Fig. 2. To measure the battery voltage (charge and terminal) and current (load and charge), a circuit comprising current and voltage sensors was attached. The performance and health of the battery were determined by measuring the influence of temperature increases on other metrics obtained using the DHT11 temperature sensor. The behavior of the battery under typical usage settings was ascertained by measuring the current flow via a bulb as the load. The edge impulse board is used for connectivity with sensors and the conventional BMS and offers more precise fluctuations34.
Fig. 2.
Hardware setup.
In this implementation, sensor data are recorded in the CSV format to facilitate systematic data logging and analysis. The collected data are formatted into a comma-separated value (CSV) string for efficient output. The CSV structure includes readings from all sensors, and the arrangement order is terminal voltage, current, temperature, charge current, and voltage. For instance, a typical data string would be structured as “3.281393243, 4.02573204, 32.06460113, 4, 1.385, 218.953, 1.64508737, 3, 0.822543685,” corresponding to the absolute values of the parameters. The State of Charge (SOC), cycle, and SOH are calculated and sent on a serial monitor using the MCU.
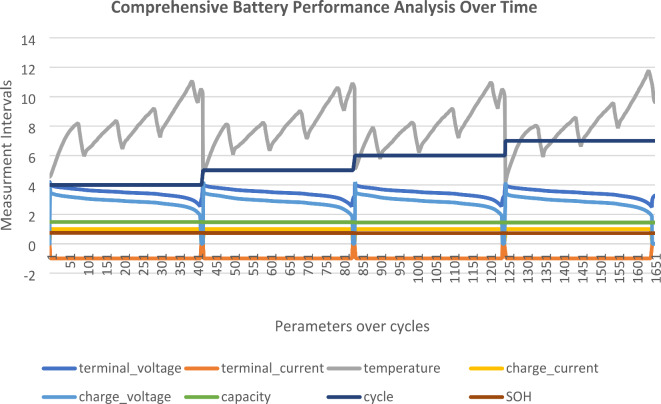
The formatted data are transmitted to the serial monitor using the Serial.print() and Serial.println() commands, facilitating real-time visualization of the sensor outputs. For subsequent data analysis, external software tools, particularly CoolTerm, are employed to log the serial output directly onto a host system in the CSV format. This methodology provides an efficient means for data storage and facilitates post-processing of sensor data35. Such an approach ensures a reliable and structured mechanism for acquiring real-time sensor data, thereby enabling a detailed analysis applicable across various research and industrial domains. A complete timeline of the battery, including multiple charge-discharge cycles with different measured parameters, is shown in Fig. 3. The x-axis is, “Parameters over cycles,” indicating the cycle count or sequenced measurement points in the battery’s operation, denoting each new charge–discharge cycle. Each line corresponds to a different metric, and the y-axis (with the label, “Measurement Intervals”) shows the values of the various battery performance indicators. Without loss of generality, the terminal voltage and charge voltage are measured in volts (V), and the terminal current and charge current are in amperes (A). The heading for another parameter, temperature, is Celsius (°C), cycle count refers to the number of cycles a battery has gone through, and SOH is a time-based parameter ranging from 0 to 100% used to measure how healthy or efficient a battery is. The graph visually elaborates how these parameters change over time; otherwise, they combine during the battery life cycle and provide insights into battery degradation, efficiency, and performance stability over a cycle.
Fig. 3.
Graph of data received from the sensors.
RUL prediction’s framework
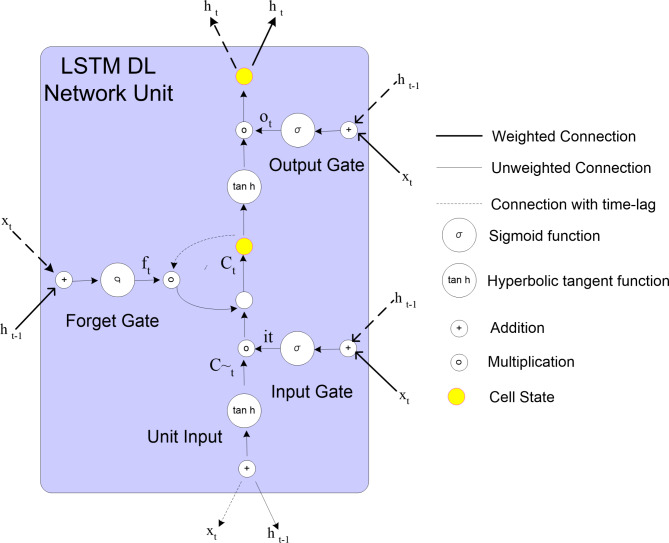
The optimal predictive power can be reliably assessed by integrating feature selection and validation techniques. For data processing, we selected one dataset from among various datasets. Data preparation included loading datasets, scrutinizing datasets, enumerating charge–‒discharge cycles, conducting correlation examinations, and eliminating highly interdependent characteristics. Insights can be visualized using statistical representations. The refined information is subsequently partitioned into two distinct groups, specifically for model development and model testing. The architectures employed for these predictive applications commonly incorporate recurrent neural networks with interconnected blocks of memory cells, known as LSTM units. Information flows through four such networks in series, with internal gates regulating the retention of important temporal patterns and relationships exposed in the training data over numerous charge-discharge cycles, as depicted in Fig. 4. The input, output, and forget gates are three crucial LSTM gates as follows36.
Fig. 4.
LSTM model.
Forget gate
An LSTM forget gate37 selects the components of the memory cell that should be discarded. It considers both the prior hidden state and the present input. Weights and biases are applied to these inputs before they undergo sigmoid activation, generating outputs between zero and one for each element of the memory cell. This forget gate output is then multiplied elementwise with the previous cell state to remove information deemed outdated. Moreover, the input and hidden states undergo separate weight-bias transformations before the current cell state is formulated through addition and sigmoid activation, generating new candidate values. Thus, through precise modulation, the forget gate allows the memory cell to retain long-term dependencies while updating the elements as required at each time step. The equations for the forget gate are given by Equations I and II.
 |
1 |
 |
2 |
Here, it represents the output of the forget gate. The bias and weight matrices for the forget gate are denoted by bf and wf, respectively. The timestamp before it has a concealed state of ht − 1. the input at the timestamp, represented by xt. where denotes the activation function (σ ) of the sigmoid function. Multiplication of elements is indicated by ⊙.
Input gate
The volatile input gate38 combines the relevant data with the state of the cell, allowing for certain information and blocking others. It filters intelligence through the hyperbolic tangent activation function (tanh) and modulates it via the sigmoid function, allowing for fleeting views and prolonged closure. The input gate equations are presented in Sections III, IV, and V.
 |
3 |
 |
4 |
 |
5 |
Where it is the yield of the input gate. The input gate is associated with specific weight matrices and bias terms denoted as WC, Wi, BC, and bi. The updated potential values for the cell condition are represented by C t and the hyperbolic tangent activation effort is given by tanh.
Output gate
The output gate39extracts meaningful data from the cell’s internal memory at that moment. It shapes a vector using tanh, determines what to allow using a sigmoid, and filters the wheat from the chaff. This filtered output is then presented while the internals are shielded from the prying eyes. Weights and biases tune what passes the output-gate inspections, converting hidden workings into observable exterior traces. Hidden states are shaped and shepherded by these sentinels along highways. Equations VI and VII are used for the output gate as follows.
 |
6 |
 |
7 |
In this context, ot represents the output of the gate. The output gate’s weight matrix and bias are denoted by letters wo and bo, respectively. This was the output of the LSTM unit. The hyperbolic tangent activation function is represented by tan, which artfully manipulates the LSTM to discard or selectively maintain information across fluctuating time intervals, assisting in the skillful application and capture of extended dependencies in sequential data. The enhanced LSTM archetype was trained using the coaching information set and fitted via characterized epochs within the applied model module. Upon preparation, the model conserved the design and weight of the disk. Model training and loss computations are required by the testing module. To forecast the remaining helpful lifespan framework, the performance exploitation of the errors, such as the MASE, RMSE, and many others, is assessed, and the prediction of the SOH exploitation, genuine vs. prediction, is visualized40.
Artificial intelligence algorithm implementation
AI and other sciences have led to transformations in many fields, including energy storage and management being it one. This is a major step in the application of AI to BMS data using various algorithms. The idea is to address the inefficiencies caused by overly complex modern solutions for energy storage. In this section, we discuss the LSTM-based deep learning approach for the RUL prediction of batteries. Keras (a sequential model) was used to implement the advanced architecture of the LSTM. Combining deep learning techniques, such as machine learning, to deliver an accurate estimation of RUL leads to predictive maintenance, thus increasing the lifespan of the BMS batteries41.
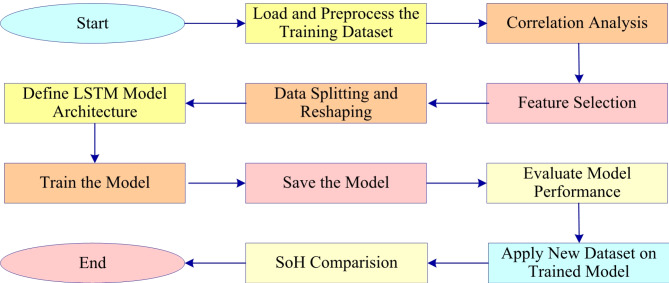
The NASA dataset is based on the impedance discharging and charging profile of a battery obtained at ambient temperature. In this public battery dataset library, many battery discharge datasets are available in csv format, such as 05,07,18,33,34,46,47, and 48. Here, dataset 05 was used for implementation. This charging method follows the constant-voltage-constant-current method and provides a 1.5 Amp charge for the charging process until the final stages at which it transitions to 4.2 V and meets there, being held for all times current drops to 20 mA. Battery statistics were conducted at ambient temperature. The initial capacity of the battery was 1.86 Ah, which decreased to 73.0% of its original value over time42. Entity Discovery Fig. 5 provides a schematic to explore prior work on Li-ion battery lifetime distribution prediction based on a machine learning model with an enhanced LSTM. First, the process consists of obtaining Li-ion Battery Aging Datasets that will be processed during Data Preprocessing. Loading and viewing the dataset, battery cycle counting using correlation analysis, and dropping highly correlated features, where the pre-processed data is now divided between Training and Testing Sets with reshaping to match the model requirements. Data Visualization helps in comprehending hidden trends within the raw battery dataset, thereby offering insights for analysis.
Fig. 5.
Flow chart of the entire process.
Subsequently, the next phase of the Model Application with the enhanced LSTM model was covered. In the training and fit model, the model was trained and saved for future reference. During the Testing and Validation phases, the model architecture and load-trained weights checked the model performance for both types of data (training and real time). After evaluation, the accuracy of the model depends on key metrics, such as the Mean Absolute Error (MAE), RMSE, and Mean Absolute Percentage Error (MAPE). Diagram X also shows the Prediction of RUL and compares it with the real vs. predicted SoH. Complete preprocessing, model estimation, and performance evaluation form a data scientific pipeline for predicting the representative battery health.
Keras is used to set up the core of the proposed model through a sequential model that allows the building of simple models in a layer of a linear stack. This configuration has a 16-unit LSTM layer. The model that was developed is based on its data properties and the complexity level of the 16 units used28. The compilation method is used to compile the model after defining it. During the training stage, the model was optimized by providing an input loss function.
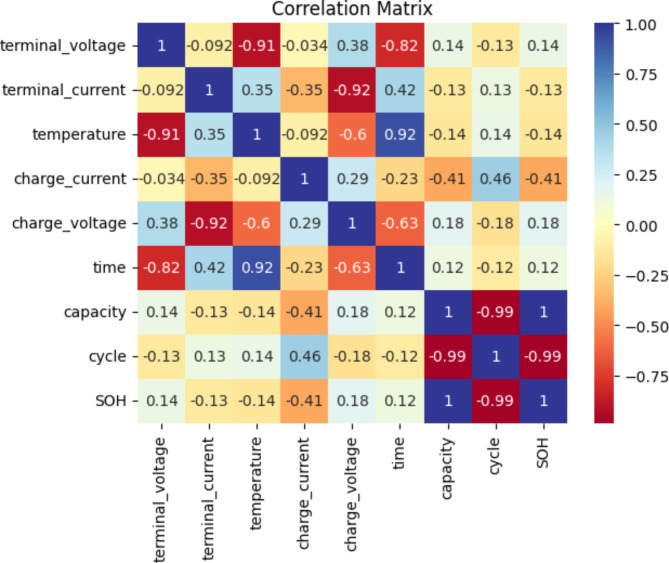
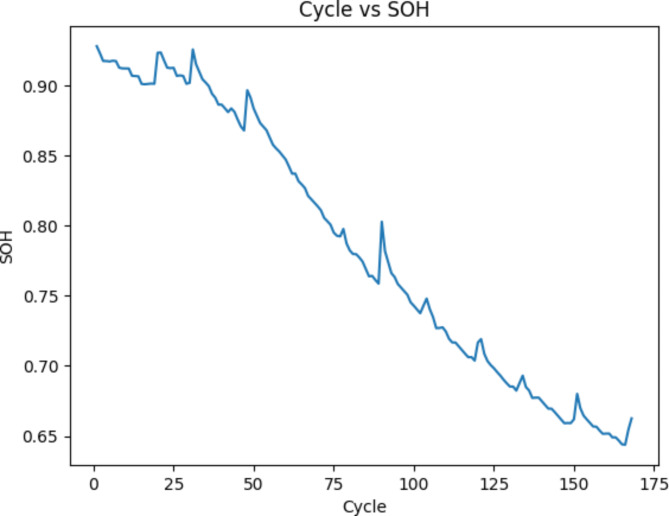
To build the model, some essential libraries and packages, such as Keras, numpy, matplotlib, TensorFlow, and pandas, were utilized for initial data processing, model creation, training, and assessment43. This includes steps such as loading the dataset, preprocessing ( reading input features and target variables, including the current and voltage at the terminal, charge, cycle, and SoH) to make it usable for scale, splitting it into training and test sets, and reshaping it into LSTM inputs. The interrelationship between the two variables quantified from − 1 to 1 can reveal a thoroughly positive, negative, or lack of connection. As evidenced by the correlation matrix, that is, heatmap (represented in Fig. 6), the capacity had a correlation value of 1.0, the number of cycles was − 0.97, and the SOH was 1.0. At the other end of this spectrum, according to Fig. 6, it can be observed that the capacity and Soh have a positive correlation. Thus, a more informed scenario provides useful insights into feature selection from our dataset. This cleaning of the data enhanced the accuracy of the datasets to be analyzed. Therefore, this will increase the tested datasets to be more acceptable and robust. Figure 7 shows the cycle number versus SoH of the dataset. An LSTM network was utilized in the machine-learning system to predict the RUL of the cell. The customized LSTM architecture was built using the sequential model available in Keras, which is a Python-based neural network framework, as described in step five of the workflow.
Fig. 6.
Correlation matrix between the parameters (Heatmap).
Fig. 7.
Cycle vs. SoH.
The titular technique at the heart of this is no other than the sequential model in Keras, which helps sequentially stack the layers. An LSTM layer with 16 units was selected because of the nature of the data and the desired level of complexity for this model. Added a dense model with a single unit for regression output, which takes the loss function and optimizer at the training time.
Some important settings need to be preconfigured before the model can be trained as part of the model compilation. In Keras, a function-like compile defines the loss function and optimizer. As an example, the optimizer is Adam, and loss is mae. Loss is the performance measurement of your model, and weights are just a way for you to know what should be adjusted by the optimizer to reduce this loss, since this is where our two variables are verified. Then, the data are split into input and target divides before training, so a sequence is added, which is a helper function for doing that. This guarantees that the model obtains appropriate input-output associations. It must be trained and tested well. The training-testing ratio was 70 − 30. Next, we prepared input sequences in the desired format for each layer. The input data must be organized in a three-dimensional format when utilizing the LSTM layers in Keras. These processes ensured the successful development of the model. The fit method is used to train the model, and it applies during the model training, which ties up all other functions of the library provided with Python _Model. The model will see the training data, batch by batch, and 32 samples at a time. In this case, training was performed over 60 epochs of the model with the actual training data. The diffusive parameter is set to 1 by default, which in turn updates the progress during training, where the data is not going to shuffle during each batch and maintains the order itself of this specific dataset.
The LSTM model was saved as a JSON file through the to_json() method provided by Keras. The model architecture is serialized into a JSON string; thus, it is easily loadable. Next, the save_weights() method was used to save the learned weights of this model in an H5 file format. Every time the trained model’s outputs are saved so that for each record to the pre-trained model, this can be any weight trained, but it ensures that all the trained parameters created during training are preserved and thus can be used again when evaluating the test set or in the update of the model. The model structure was imported from a JSON file through the Keras model_from_json reading into the path of the saved architecture point, as previously described. The original structural design is defined as follows. In addition, the trained weights are imported using the load_weights method to obtain all valuable knowledge collected during different iterations of learning from the HDF5 file.
The integration of these elements was sufficient to revive the model, patching its a priori building blocks with the knowledge collected during the training. The architecture was then further empowered to perform the tasks for which it had been trained using both this established knowledge and the new variations that were taught throughout. Therefore, the model architecture (along with any weights saved when training the LSTM network for this task) was successfully saved and loaded. The trained model, along with the associated parameters and architecture, is preserved for future use in any other new applications, which, if deployed, will simply be deployed in a pre-existing system, thereby encapsulating all past work.
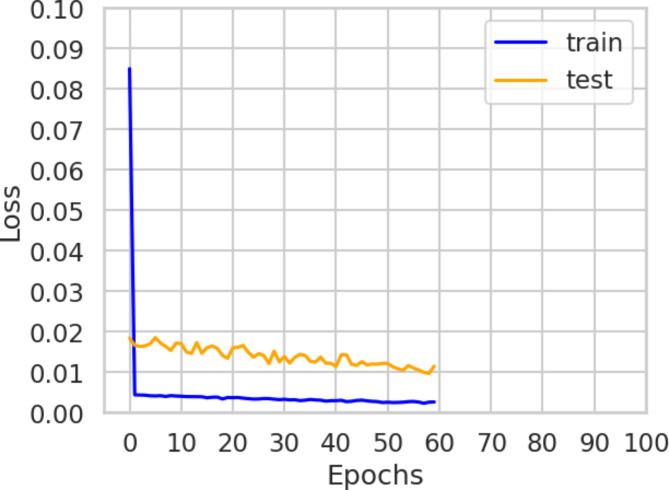
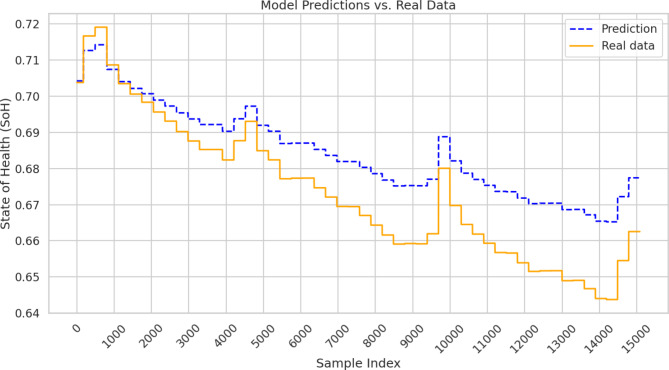
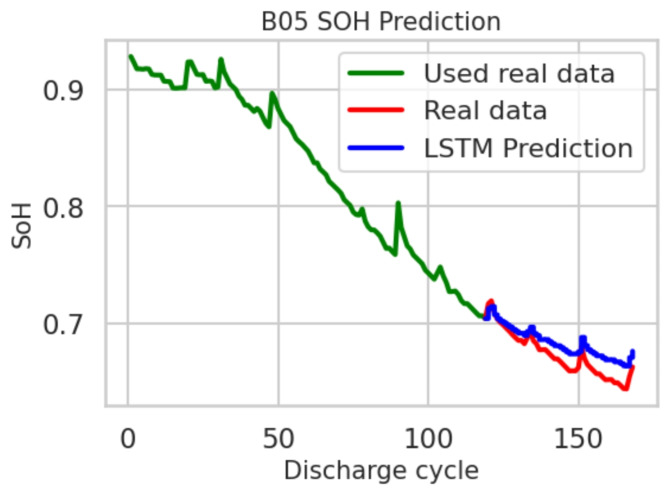
The prediction line shows the series of values estimated by the model, yet “real data” portrays the actual target y in the test data. Figure 8 shows the training and validation curves drawn over the epochs based on history. history. history[‘val_loss’] and history[‘loss’] to see against testY. In addition, two lines are drawn jointly on the same plot with a legend that distinguishes them. A graph of the predicted and real data is presented in Fig. 9. A graph of the projected SOH values along with the actual values generated by Matplotlib demonstrated how well the model grasped the general form of the relationships underlying the information. The calculated RMSE was 0.01173. Furthermore, brief sentences interspersed with more complex sentences help convey concepts for understanding model performance with a greater variety. While the proximity between forecasted and actual outcomes signifies how well the design has grasped the connection between inputs and consequences, enormous deviations indicate inefficiency. Figure 10 displays the real SoH and LSTM predictions used to assess forecast accuracy.
Fig. 8.
Training and validation curves.
Fig. 9.
Graph of prediction vs. real data.
Fig. 10.
Used Real data, Real data, and LSTM prediction.
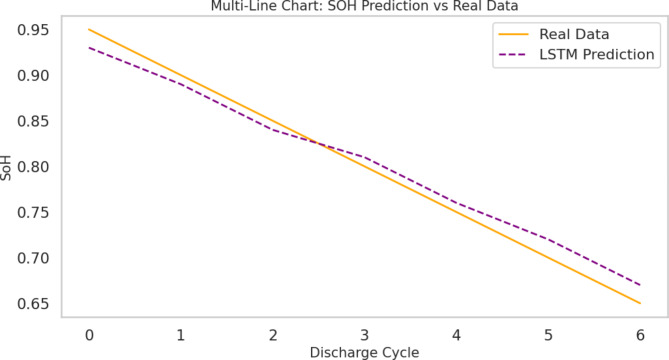
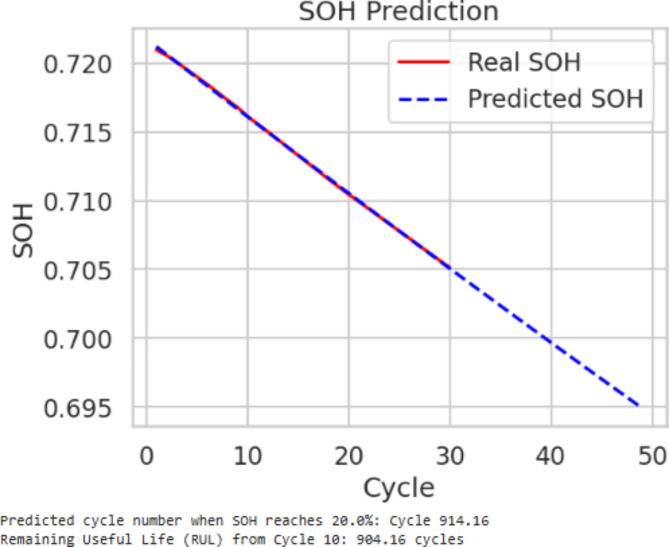
Figures 11, 12 illustrates the saved trained model tested using real-time data received from the IoT device. The graph compares the State of Health (SoH) of a battery across discharge cycles, plotting both the real SoH values (solid orange line) and the predictions made by the LSTM model (dashed purple line). Initially, the real SoH started at approximately 0.95, whereas the LSTM model predicted a slightly lower value of approximately 0.92. As the discharge progressed, particularly between cycles 2 and 3, the gap widened, with real SoH values decreasing to approximately 0.85, while the model predicted a value of approximately 0.83, indicating a slight underestimation. Interestingly, the prediction of the model converges with the real SoH around cycle 4, where both align near 0.80, showing the model’s ability to capture the SoH trend accurately at this point. For the final discharge cycles (5 and 6), the real SoH dropped to approximately 0.70, whereas the model slightly over-predicted at approximately 0.72. Despite minor deviations, the LSTM model successfully tracked the overall SoH decline, validating its effectiveness for real-time battery health prediction, although further tuning could improve precision in certain sections.
Fig. 11.
SoH prediction on real time dataset.
Fig. 12.
SoH prediction of real time dataset over 50 cycles.
Therefore, the predicted cycle in which the SOH reaches the critical threshold (20%) is approximately Cycle 914. Cycle 10 From Result from RUL Calculation, 904 cycles remain, which proves that polynomial regression can be an efficient approach for modelling the degradation characteristics of the battery with respect to the cycle number. SOH predictions describe future performance and the RUL of the asset and can be used for maintenance scheduling and battery management, and to extend the operational lifespan of energy storage based on historical SOH data.
Results and discussion
In this study, effective LSTM predictive models were developed to forecast the RUL of lithium batteries by employing methods for selecting features and validating models to enhance the performance. Initial processing involves loading the dataset, exploring the datasets, and removing strongly interdependent variables. The visualizations helped me make sense of the likely frequencies of the data. The LSTM architecture employed a gate mechanism for efficient memory control. The LSTM model was presented with an improvement and batch size of 16 using Keras. The evaluation of the model was performed on the trained model as it made estimates over the test data. In this study, the RMSE was 0.01173 and the MAE was 0.01034. The mean of the percentage differences for all models is a useful metric for grasping performance overall. Such calculations offer enhanced insights into the average performance of the models across different architectures. The Proposed LSTM Model performed considerably better than the other models by significantly reducing the prediction errors44. The formula for the percentage difference is given in Eq. 8.
 |
8 |
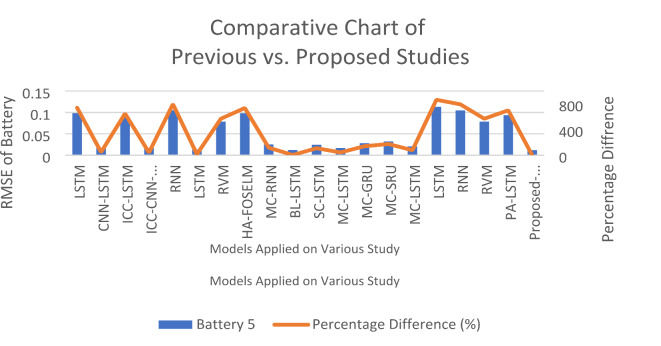
Where yi represents the actual value, yip denotes the value of proposed model (which is 0.01173) for the proposed LSTM model) and ∣ yi− yip ∣ is the absolute difference between the actual exist model’s RMSE value and proposed model’s RMSE values. This formula was used to evaluate the performance of Battery 05, and the percentage difference between all models was calculated and compared using the formula. It should be noted that all calculations of the percentage change are verified and match those in Table 2. The table compares the various models (LSTM, CNN-LSTM, RNN, etc.) used for battery prediction across different studies, highlighting their RMSE values and percentage differences. The Proposed-LSTM model achieved the lowest RMSE (0.01173), indicating a superior performance over the other models.
Table 2.
Percentage difference between previous vs. proposed studies.
| Author | Model | Battery 5 | Percentage Difference (%) |
|---|---|---|---|
| 27 | LSTM | 0.0983 | 738.02 |
| CNN-LSTM | 0.0174 | 48.34 | |
| ICC-LSTM | 0.0878 | 648.51 | |
| ICC-CNN-LSTM | 0.0166 | 41.52 | |
| RNN | 0.1051 | 795.99 | |
| 24 | LSTM | 0.0135 | 15.09 |
| RVM | 0.0783 | 567.52 | |
| HA-FOSELM | 0.098 | 735.46 | |
| MC-RNN | 0.0255 | 117.39 | |
| 25 | BL-LSTM | 0.0121 | 3.15 |
| SC-LSTM | 0.0245 | 108.87 | |
| MC-LSTM | 0.0168 | 43.22 | |
| MC-GRU | 0.0282 | 140.41 | |
| MC-SRU | 0.0322 | 174.51 | |
| MC-LSTM | 0.0208 | 77.32 | |
| LSTM | 0.113 | 863.34 | |
| 26 | RNN | 0.1047 | 792.58 |
| RVM | 0.0784 | 568.37 | |
| PA-LSTM | 0.0937 | 698.81 | |
| Proposed-LSTM | 0.01173 | 0 | |
The Proposed LSTM Model is the benchmark in this analysis as it has an error rate of 0.01173, indicating that it performs much better than all the models represented in Fig. 13. that have higher error rates at an important level. It is a reference baseline for preparing subsequent comparisons against the Proposed LSTM Model to quantify its enhancement in predictive accuracy.
Fig. 13.
Comparative chart of previous vs. proposed studies.
Conclusion
This study introduces an innovative architecture enabled by IoT for the accurate real-time prediction of the RUL of Li-ion batteries. The proposed LSTM model reached a benchmark error rate of 0.01173 when evaluated with the NASA Li-battery datasets, indicating that the proposed model outperformed other machine learning models with lower error rates. The objectives of the research, and hence, a contribution to the BMS, as well as a considerable solution for monitoring battery aging, were met. This study has shown that adopting cutting-edge machine learning together with IoT technologies for battery RUL prediction is effective, thus contributing to the proposed LSTM model as a significant step forward in this domain. The results obtained provide directions for new areas of energy storage solutions to be explored using smart grid monitoring systems to ensure adequate power life and reliability. Despite this, the dataset used in this study has some limitations in terms of generalizability across different operational conditions. Therefore, future work may need to extend the dataset such that the model can adapt to different types of batteries and more scenarios.
Acknowledgements
This work was supported by King Saud University, Riyadh, Saudi Arabia, through Researchers Supporting Project number RSP2024R498.
Author contributions
Gopal Krishna: Conceptualization; Data curation; Formal analysis; Methodology; Writing - original draft; Software.Rajesh Singh: Investigation; Methodology; Writing - original draft; Writing - review & editing.Anita Gehlot: Validation; Investigation; Writing - review & editing. Ahmad Almogren: Project administration; Investigation; Methodology; Writing - review & editing.Ayman Altameem: Writing - review & editing; Software; Resources; Methodology.Ateeq Ur Rehman: Writing - review & editing; Methodology; Conceptualization.Seada Hussen: Validation; Investigation; Writing - review & editing.
Data availability
The dataset used in this study is publicly available at https://data.nasa.gov/dataset/Li-ion-Battery-Aging-Datasets/uj5r-zjdb/about_data.
Declarations
Competing interests
The authors declare no competing interests.
Footnotes
Publisher’s note
Springer Nature remains neutral with regard to jurisdictional claims in published maps and institutional affiliations.
Contributor Information
Ateeq Ur Rehman, Email: 202411144@gachon.ac.kr.
Seada Hussen, Email: seada.hussen@aastu.edu.et.
References
- 1.Liu, W., Placke, T. & Chau, K. T. Overview of batteries and battery management for electric vehicles. Energy Rep.8, 4058–4084. 10.1016/J.EGYR.2022.03.016 (2022). [Google Scholar]
- 2.Chen, Y. et al. A review of lithium-ion battery safety concerns: The issues, strategies, and testing standards. J. Energy Chem.59, 83–99. 10.1016/J.JECHEM.2020.10.017 (2021). [Google Scholar]
- 3.Saxena, S., Le Floch, C., Macdonald, J. & Moura, S. Quantifying EV battery end-of-life through analysis of travel needs with vehicle powertrain models. J. Power Sources282, 265–276. 10.1016/J.JPOWSOUR.2015.01.072 (2015). [Google Scholar]
- 4.Carnovale, A. & Li, X. A modeling and experimental study of capacity fade for lithium-ion batteries. Energy AI2, 100032. 10.1016/J.EGYAI.2020.100032 (2020). [Google Scholar]
- 5.Hu, J. et al. Health factor analysis and remaining useful life prediction for batteries based on a cross-cycle health factor clustering framework. J. Energy Storage50, 104661. 10.1016/J.EST.2022.104661 (2022). [Google Scholar]
- 6.Fan, Z., Zi-xuan, X. & Ming-hu, W. State of health estimation for Li-ion battery using characteristic voltage intervals and genetic algorithm optimized back propagation neural network. J. Energy Storage57, 106277. 10.1016/J.EST.2022.106277 (2023). [Google Scholar]
- 7.Wang, D., Yang, F., Zhao, Y. & Tsui, K. L. Battery remaining useful life prediction at different discharge rates. Microelectron. Reliab.78, 212–219. 10.1016/J.MICROREL.2017.09.009 (2017). [Google Scholar]
- 8.González, I., Calderón, A. J. & Folgado, F. J. IoT real time system for monitoring lithium-ion battery long-term operation in microgrids. J. Energy Storage51, 104596. 10.1016/J.EST.2022.104596 (2022). [Google Scholar]
- 9.Obuli Pranav, D. et al. Enhanced SOC estimation of lithium ion batteries with RealTime data using machine learning algorithms. Sci. Rep.14(1), 1–17. 10.1038/s41598-024-66997-9 (2024). [DOI] [PMC free article] [PubMed] [Google Scholar]
- 10.Thomas, J. K., Crasta, H. R., Kausthubha, K., Gowda, C. & Rao, A. Battery monitoring system using machine learning. J. Energy Storage40, 102741. 10.1016/J.EST.2021.102741 (2021). [Google Scholar]
- 11.Shin, W., Han, J. & Rhee, W. AI-assistance for predictive maintenance of renewable energy systems. Energy221, 119775. 10.1016/J.ENERGY.2021.119775 (2021). [Google Scholar]
- 12.Reza, M. S. et al. Recent advancement of remaining useful life prediction of lithium-ion battery in electric vehicle applications: A review of modelling mechanisms, network configurations, factors, and outstanding issues. Energy Rep.11, 4824–4848. 10.1016/J.EGYR.2024.04.039 (2024). [Google Scholar]
- 13.Khaleghi, S., Hosen, M. S., Van Mierlo, J. & Berecibar, M. Towards machine-learning driven prognostics and health management of Li-ion batteries. A comprehensive review. Renew. Sustain. Energy Rev.192, 114224. 10.1016/J.RSER.2023.114224 (2024). [Google Scholar]
- 14.Gao, T., Li, Y., Huang, X. & Wang, C. Data-driven method for predicting remaining useful life of bearing based on Bayesian theory. Sensors21(1), 182. 10.3390/S21010182 (2020). [DOI] [PMC free article] [PubMed] [Google Scholar]
- 15.Haldar, S., Gol, S., Mondal, A. & Banerjee, R. IoT-enabled advanced monitoring system for tubular batteries: Enhancing efficiency and reliability. e-Prime Adv. Electr. Eng. Electron. Energy9, 100709. 10.1016/J.PRIME.2024.100709 (2024). [Google Scholar]
- 16.Qu, X. et al. Insights and reviews on battery lifetime prediction from research to practice. J. Energy Chem.94, 716–739. 10.1016/J.JECHEM.2024.03.013 (2024). [Google Scholar]
- 17.Shahed, M. T. & Ur Rashid, A. B. M. H. Battery charging technologies and standards for electric vehicles: A state-of-the-art review, challenges, and future research prospects. Energy Rep.11, 5978–5998. 10.1016/J.EGYR.2024.05.062 (2024). [Google Scholar]
- 18.Wang, Y. W. & Shu, C. M. Energy generation mechanisms for a Li-ion cell in case of thermal explosion: A review. J. Energy Storage55, 105501. 10.1016/J.EST.2022.105501 (2022). [Google Scholar]
- 19.Yu, Q., Nie, Y., Liu, S., Li, J. & Tang, A. State of health estimation method for lithium-ion batteries based on multiple dynamic operating conditions. J. Power Sources582, 233541. 10.1016/J.JPOWSOUR.2023.233541 (2023). [Google Scholar]
- 20.Panicker, D., Kapoor, D. & Kamthe, M. A. IoT based smart battery management system. Int. Res. J. Eng. Technol.http://www.irjet.net (2022).
- 21.Krishna, G. et al. IoT-based real-time analysis of battery management system with long range communication and FLoRa. Results Eng.23, 102770. 10.1016/J.RINENG.2024.102770 (2024). [Google Scholar]
- 22.He, J., Tian, Y. & Wu, L. A hybrid data-driven method for rapid prediction of lithium-ion battery capacity. Reliab. Eng. Syst. Saf.226, 108674. 10.1016/J.RESS.2022.108674 (2022). [Google Scholar]
- 23.Tamilselvi, S. et al. A review on battery modelling techniques. Sustainability13(18), 10042. 10.3390/SU131810042 (2021). [Google Scholar]
- 24.Fan, J., Fan, J., Liu, F., Qu, J. & Li, R. A novel machine learning method based approach for Li-ion battery prognostic and health management. IEEE Access7, 160043–160061. 10.1109/ACCESS.2019.2947843 (2019). [Google Scholar]
- 25.Park, K., Choi, Y., Choi, W. J., Ryu, H. Y. & Kim, H. LSTM-based battery remaining useful life prediction with multi-channel charging profiles. IEEE Access8, 20786–20798. 10.1109/ACCESS.2020.2968939 (2020). [Google Scholar]
- 26.Qu, J., Liu, F., Ma, Y. & Fan, J. A neural-network-based method for RUL prediction and SOH monitoring of lithium-ion battery. IEEE Access7, 87178–87191. 10.1109/ACCESS.2019.2925468 (2019). [Google Scholar]
- 27.Rincón-Maya, C., Guevara-Carazas, F., Hernández-Barajas, F., Patino-Rodriguez, C. & Usuga-Manco, O. Remaining useful life prediction of lithium-ion battery using ICC-CNN-LSTM methodology. Energies16(20) 10.3390/en16207081 (2023).
- 28.dos Reis, G., Strange, C., Yadav, M. & Li, S. Lithium-ion battery data and where to find it. Energy AI5, 100081. 10.1016/J.EGYAI.2021.100081 (2021). [Google Scholar]
- 29.Xie, W. & Zeng, Y. A knowledge distillation based cross-modal learning framework for the lithium-ion battery state of health estimation. Complex Intell. Syst.10(4), 5489–5511. 10.1007/S40747-024-01458-4/TABLES/11 (2024). [Google Scholar]
- 30.14500 18500 Battery 18650 Battery Cell Wholesale 18650 14500 21700 18500 Rechargeable Lithium Battery - Battery and Cell. https://hcctop.en.made-in-china.com/product/HFMGeWvDZRAl/China-14500-18500-Battery-18650-Battery-Cell-Wholesale-18650-14500-21700-18500-Rechargeable-Lithium-Battery.html (Accessed 03 Oct 2024).
- 31.Interfacing 0-25V DC Voltage Sensor with Arduino. https://how2electronics.com/interfacing-0-25v-dc-voltage-sensor-with-arduino/ (Accessed 03 Oct 2024).
- 32.Hall-Effect-Based Linear Current Sensor IC - ACS712 | Allegro MicroSystems. https://www.allegromicro.com/en/products/sense/current-sensor-ics/zero-to-fifty-amp-integrated-conductor-sensor-ics/acs712 (Accessed 03 Oct 2024).
- 33.DHT11 Sensor Pinout, Features, Equivalents & Datasheet. https://components101.com/sensors/dht11-temperature-sensor (Accessed 03 Oct 2024).
- 34.Krishna, G. et al. IoT-based real-time analysis of battery management system with long range communication and FLoRa. Results Eng.10.1016/j.rineng.2024.102770 (2024). [Google Scholar]
- 35.Krishna, G., Singh, V., Pandey, D., Krishna, K. H., Joshi, K. & Gupta, T. Power trading framework of cloud-edge computing in the artificial intelligence market. In 2024 4th International Conference on Advance Computing and Innovative Technologies in Engineering, ICACITE 2024, 1910–1918 10.1109/ICACITE60783.2024.10617344 (2024).
- 36.Chen, Z., Chen, L., Shen, W. & Xu, K. Remaining useful life prediction of lithium-ion battery via a sequence decomposition and deep learning integrated approach. IEEE Trans. Veh. Technol.71(2), 1466–1479. 10.1109/TVT.2021.3134312 (2022). [Google Scholar]
- 37.Gers, F. A., Schmidhuber, J. & Cummins, F. Continual prediction using LSTM with Forget Gates. 133–138. 10.1007/978-1-4471-0877-1_10 (1999).
- 38.Greff, K., Srivastava, R. K., Koutnik, J., Steunebrink, B. R. & Schmidhuber, J. LSTM: a search space odyssey. IEEE Trans. Neural Netw. Learn. Syst.28(10), 2222–2232. 10.1109/TNNLS.2016.2582924 (2017). [DOI] [PubMed] [Google Scholar]
- 39.Yao, K., Cohn, T., Vylomova, K., Duh, K. & Dyer, C. Depth-Gated LSTM. (2015) https://arxiv.org/abs/1508.03790v4 (Accessed 03 Oct 2024).
- 40.Chicco, D., Warrens, M. J. & Jurman, G. The coefficient of determination R-squared is more informative than SMAPE, MAE, MAPE, MSE and RMSE in regression analysis evaluation. PeerJ Comput. Sci.7, 1–24. 10.7717/PEERJ-CS.623/SUPP-1 (2021). [DOI] [PMC free article] [PubMed] [Google Scholar]
- 41.Ardeshiri, R. R., Liu, M. & Ma, C. Multivariate stacked bidirectional long short term memory for lithium-ion battery health management. Reliab. Eng. Syst. Saf.224, 108481. 10.1016/J.RESS.2022.108481 (2022). [Google Scholar]
- 42.Krishna, G. et al. An imperative role of studying existing battery datasets and algorithms for battery management system. Rev. Comput. Eng. Res.10(2), 28–39 (2023). [Google Scholar]
- 43.Krishna, G., Singh, R., Gehlot, A. & Akram, S. V. An IoT-based predictive model for improved battery management system using advanced LSTM model. J. Energy Storage101, 113694. 10.1016/J.EST.2024.113694 (2024). [Google Scholar]
- 44.Ijaz, K. et al. A novel temporal feature selection based lstm model for electrical short-term load forecasting. IEEE Access10, 82596–82613. 10.1109/ACCESS.2022.3196476 (2022). [Google Scholar]
Associated Data
This section collects any data citations, data availability statements, or supplementary materials included in this article.
Data Availability Statement
The dataset used in this study is publicly available at https://data.nasa.gov/dataset/Li-ion-Battery-Aging-Datasets/uj5r-zjdb/about_data.


