Abstract
In the present work, the oxidation mechanism of di-t-butyl-hydroxytoluene (BHT) was studied in an aqueous medium through different approaches to have a thorough vision of the physical chemistry: experiments with cyclic voltammetry (CV), quantum chemical calculations, and simulations of CV. Calculations of thermodynamic parameters, such as pKa and standard oxidation potential (Eox°), were used to analyze and rationalize the CV experiments. Subsequently, different pathways of the mechanism were constructed, and the most thermodynamically favorable one was selected. Numerical simulations were then used to model this mechanism and compare it with the experimental data. The results show that the oxidation process is due to the coupled loss of an electron and a proton in the first instance, followed by an irreversible second electron-transfer process without loss of protons, mainly due to the adsorption of the products of the first oxidation on the electrode surface. The effect of different pH values on this oxidative mechanism was also analyzed, with alkaline pH of 12 as a medium where changes in reactivity were observed as the appearance of a new peak in the second voltammetric sweep, the interpretation of this peak is also provided.
Keywords: di-t-butyl-hydroxytoluene, cyclic voltammetry, oxidation mechanism, synthetic antioxidant, DFT
1. Introduction
Phenols have a wide range of applications, from the food industry to biological functions. The antioxidant activity of phenols is related to their ability to donate electrons to a substrate. Under oxidative conditions, phenols may react to yield a large variety of products including quinones, biphenyl quinones, etc., depending on the structure of the parent phenol and experimental conditions. Butylated hydroxytoluene (BHT) is a synthetic phenol used as food, polymer, and oil additives whose function is to prevent the damage done by free radicals.1 Also, BHT has been documented in thousands of scientific articles and patents which mainly discussed the role of BHT as a key substrate in food and feed chemistry, pharmaceuticals, and pharmacology.1
The oxidation of BHT is a complicated process, and controversy in its mechanistic pathway exists in the literature. One report shows that BHT oxidation presents two oxidative waves in cyclic voltammetry (CV) experiments in a mixture of acetonitrile/water medium but lacks analysis at alkaline pH.2 Even the electrochemical BHT oxidation was studied in organic solvents such as acetonitrile and methylene chloride.3,4 In addition, linear sweep voltammetry experiments were carried out in an acidic aqueous solution of BHT reporting only one oxidative wave;5 a similar observation was made with voltammetric experiments with modified glassy carbon electrodes.6,7 These reports, among others,8−11 pursue the quantification of BHT in different matrixes and not the final oxidation mechanism elucidation. In conclusion, a systematic study of the oxidation mechanism of BHT has not been done yet.
CV is a powerful technique to study the electrochemistry of redox reactions since it involves both thermodynamic and kinetic information. Therefore, they have been used for decades to explore the mechanism of redox species. In recent studies,12−14 some of us have demonstrated a methodology to reveal the mechanism of two antioxidants, butylated hydroxyanisole and betanidin, by incorporating CV experimental data, density functional theory (DFT) calculations, and CV simulations. This has proven to be a very useful methodology since it incorporates different approaches to the same problem to have a global picture of the system behavior.
Electrochemical impedance spectroscopy (EIS) is one of the most widely used techniques for characterizing electrochemical behaviors. In EIS, a current signal is measured in response to an applied AC potential at varying frequencies. The resulting data for the electrode/solution interface typically exhibit frequency dispersion—a phenomenon that, while not fully understood, is commonly attributed to the dispersion of capacitance. This behavior is often modeled using a constant-phase element (CPE),15,16 an empirical construct designed to fit simulated impedance spectra to experimental observations. The use of a CPE has become widely accepted within the electrochemical community as a means to replicate the behavior of the electrical double layer, which cannot be accurately described by a pure capacitor. However, it is important to recognize that the CPE simplifies the complex nature of dispersion phenomena into a single element without providing a detailed explanation of the underlying physical processes. While it is generally acceptable to employ a CPE when a detailed physical explanation is not the primary concern, its use should be approached with caution. Careful consideration is needed to ensure that the simplification does not obscure significant aspects of the electrochemical behavior being studied.
The nature of the reactions present in the mechanism of oxidation on some phenols has been studied using different techniques.17−21 Nevertheless, this paper presents a novel approach to the study of the oxidation mechanism and the electrochemistry of phenols in general. The main goal of this report is to study the oxidation mechanism of BHT in an aqueous solution using voltammetric experiments, DFT calculations, and CV simulations, to discern the reaction pathways and the impact of secondary reactions. Experiments have been carried out at different pH values to study the influence of the medium on the mechanism under study. To the best of our knowledge, the literature lacks an approach such as the one presented here.
2. Methodology
2.1. Experimental Details
2.1.1. Reagents and Solutions
All reagents were of analytical grade. BHT was from Sigma Chemical Co., St. Louis, MO. KCl (≥99.9%, Sigma-Aldrich) was used as a supporting electrolyte. Acetonitrile (ACN, HPLC grade) was purchased from Sintorgan. Then, the peptide was used without further purification. BHT stock solution (1 × 10⁻³ M) was prepared in ACN, protected from light, and kept in the refrigerator. Working solutions were prepared daily by transferring the appropriate aliquots of the stock solution to 10.0 mL final volume with 20% ACN in solutions of Britton–Robinson buffer of different pH values (2–12). KCl was added to all solutions to a final concentration of 0.1 M to maintain a constant ionic strength. The final BHT concentration was 3.3 × 10⁻⁵ M (33 μM) in all the experiments.
2.1.2. Apparatus and Software
Voltammetric and impedimetric measurements were performed with a PalmSens4 potentiostat, using the manufacturer’s electrochemical analysis software. The working electrode was a 3.0 mm diameter glassy carbon disk electrode with a platinum wire as the auxiliary electrode and a Ag/AgCl (KCl 3 M) BAS, RE-5B as the reference electrode. The glassy carbon electrode surface was polished manually with a 1, 0.3, and 0.05 μm alumina/water slurry on felt pads followed by rinsing with ultrapure water. Then, the electrode was sonicated in water for 10 s and dried with a stream of nitrogen. All measurements were carried out at room temperature.
In CV, the scan rate, v, was varied from 5 to 250 mV/s in a potential range from −0.2 to 1.2 V. EIS measurements were performed in the blank solution. The applied potential was varied from 0.0 to 0.8 V. The amplitude of the sinusoidal perturbation was 5 mV. The AC frequency was varied from 20 kHz to 0.01 Hz. The impedance spectra were fitted using the manufacturer’s electrochemical analysis software.
Double potential step chronoamperometry was used to determine the diffusion coefficient of BHT, taking into account that the electron transfer process undergoes an adsorption/diffusion-controlled process. Thus, the time-dependent current responses were recorded after applying an initial potential (where the faradaic process does not occur) for 5 s to a final potential (where the electrochemical reaction occurs at the maximum possible rate, for the first oxidation peak), during 20 s. The choice of final potential depends on the pH. The data obtained were analyzed through the Anson equation (eq 1).22
| 1 |
where n = number of electrons transferred/molecule, F = Faraday’s constant (96,500 C mol–1), A = electrode area (cm2), C = concentration (mol cm–3), D = diffusion coefficient (cm2 s–1), Γo is the surface concentration of adsorbed species (mol cm–2), and Qdl double-layer charging.
2.2. Computational Details
The methodology used in the present article is adapted and modified from prior studies.12−14 The computational methods described below allow for obtaining the thermodynamic parameters in very good agreement with the experimental data and performing simulations of CV to contrast the theoretical predictions with the voltametric experiments.
2.2.1. DFT Calculations
The calculations were performed by Gaussian 09 Rev. E01 series of programs using the hybrid density functional B3LYP, 6-31+G(d,p) as a basis set and the SMD implicit solvation model.23,24 Geometries were fully optimized in an aqueous solution. Harmonic frequencies were calculated to confirm that the structures were minima on the potential energy surface and to obtain thermal and entropic contributions to the free energies.
The pKa calculation was based on the use of the direct approach, given by the proton dissociation reaction shown in eq 2:25,26
| 2 |
The pKa of molecule HA was calculated according to eq 3:
| 3 |
In this equation, G*aq,A– and G*aq,HA are the standard free energies of deprotonated and protonated species, respectively, calculated directly in aqueous solution at 298.15 K as follows:
where Eel is the electronic energy for A– or HA obtained by structure optimization, ZPVE is the zero-point vibrational energy in solution, and ΔGcorr is the electronic and thermal free energy correction. The Gibbs free energy of a proton in the aqueous phase is calculated using the following equation:25,26
| 4 |
where  at 298 K,26
 is the aqueous-phase solvation free energy
of the proton, taken from the literature,27 and ΔG1atm→1M = RT(24.46) = 1.89 kcal/mol is a correction term for the change
in standard state from 1 atm to 1 mol/L. The symbols * and °
denote the standard states of 1 mol/L and 1 atm, respectively.
For a reduction reaction
| 5 |
The standard reduction potential is
| 6 |
where ΔGred(aq)* is the Gibbs free energy of the reduction in standard conditions, n is the number of electrons transferred in the reduction process, F is Faraday’s constant [23.06 kcal (mol V)−1], and SHE is the absolute potential of the standard hydrogen electrode (4.281 V).27,28 The Gibbs free energy for reduction is
| 7 |
where G°g(e–) is the gas-phase free energy of one electron. At 298 K, the gas-phase Gibbs energy of an electron is G°g(e–) = 0.867 kcal/mol and is obtained from the literature values of H°g(e–) = 0.752 kcal/mol and S°g(e–) = 5.434 kcal/(mol K).29
In addition, to improve the calculation of solvation effects, which are important in charged structures, the inclusion of two explicit water molecules directly hydrogen-bonded to the OH group (site with acid–base behavior) was carried out. For each intermolecular hydrogen bond, several orientations of the added water were considered, and only the lowest energy structure was used. For optimal cancellation of errors in the calculations, the water molecule was hydrogen-bonded to the same site in the molecule and its deprotonated form. Typical arrangements of water near the protonation/deprotonation site are shown in Figure 1. All pKa and E° calculations are summarized in an Excel file in the Supporting Information.
Figure 1.
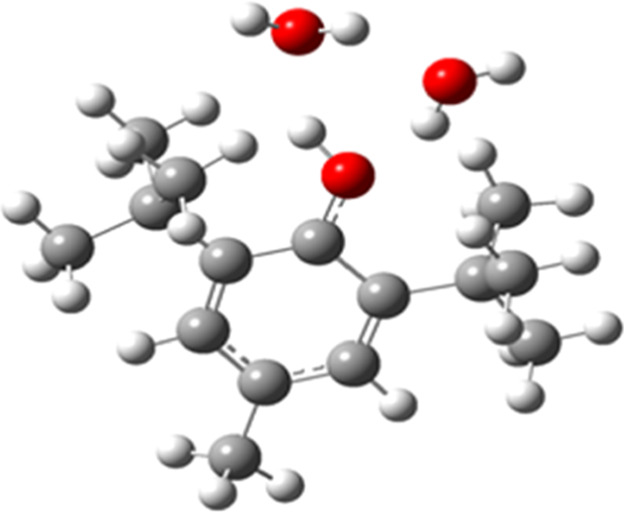
Explicit water molecules location in BHT.
2.2.2. CV Simulations
All voltammetry simulations were performed using an ad hoc code written in the C++ programming language. Eigen library was implemented to solve linear algebra equations.30 Fick’s law equations for species i in one dimension were considered for simulating the diffusion of the species from/to the bulk solution to/from the electrode surface (eq 8):
| 8 |
where Ci is the concentration, Di is the diffusion coefficient, t is the time, x is the distance from the electrode (x = 0) to the bulk of the solution ( , where ttotal is the total time of the experiment), and Si is a chemical reaction that can consume
or produce molecules of species i. These differential
equations were solved numerically using finite differences methods.31 Migration and convection were negligible, assuming
a stationary solution with a high concentration of the electrolyte.
The total current It was calculated as the summation of the faradaic and nonfaradaic contributions (eq 9):
| 9 |
The faradaic current flowing through the electrode/solution interface, If, was calculated with the Butler–Volmer equation (eq 10):
| 10 |
The summation in this equation considers that more than one redox reaction (N redox reactions in this case) contributes to the total faradaic current. For each j redox reaction, k0j corresponds to the heterogeneous rate constant, Cred,j is the concentration of reductive species at the electrode surface, Cox,j is the concentration of oxidative species at the electrode surface, αj is the transfer coefficient, which was considered the same for all reactions, E0j is the formal potential, and Eact is the actual potential applied to the electrode, given by eq 11:
| 11 |
in which RΩ is the internal resistance and Eapp is the applied potential. F, R, and T have their usual meanings. For If, both diffusion and adsorption phenomena were considered.
The nonfaradaic (capacitive) current, Ic, was simulated with an R-CPE circuit, according to the approach developed by Charoen-amornkitt et al.32,33 For the complete derivation of the equation, please visit the referenced literature; we provide here a brief explanation.
The CPE impedance, in the Laplace domain, can be expressed as
| 12 |
where Y0 is the pseudocapacitance, s is the Laplace variable, and γ is the CPE exponent. The nonfaradaic current Ic in the Laplace domain can be written as follows:
| 13 |
where  is the potential deviation from the initial
condition. Applying the inverse Laplace transformation to eq 13 and integrating by uniformly
discretizing the time interval into n subintervals32 yields
| 14 |
where Δt is the time step for the n subintervals and t is the time for the interval k. The term A(x) is a function, such that
| 15 |
In this equation, Γ is the gamma function.
It is important to highlight the relevance of this nonfaradaic current approach since few studies have focused on modeling the voltammetric response of CPEs. In the present work, we considered Y0 and γ as constant values over the voltage window.
The rate for adsorption and desorption of species was considered with a Langmuir isotherm34
| 16 |
| 17 |
where kads,i is an adsorption constant for species i, kdes,i is a desorption constant, Ci(0,t) is the surface concentration at time t, Γmax is the maximum surface coverage, which in this work is the same for all species, and Γi is the surface coverage in mol/cm2. On the other side, the formal potentials for the charge transfer of the adsorbed species depend on the following relationship34
| 18 |
where species j is the product of the oxidation of i.
In all cases, we considered as the initial condition a situation where the only species present in the solution is BHT (CBHT), and also the surface was free of adsorbed species.
To solve the total current, Eact is first guessed. Using Brent’s method,35 the converged Eact is obtained, and Ic is calculated. Applying the obtained Eact and Ic to the Butler–Volmer equation for different reactions, concentrations can be obtained by solving a matrix equation with Eigen.30
3. Results and Discussion
3.1. Experimental Measurements
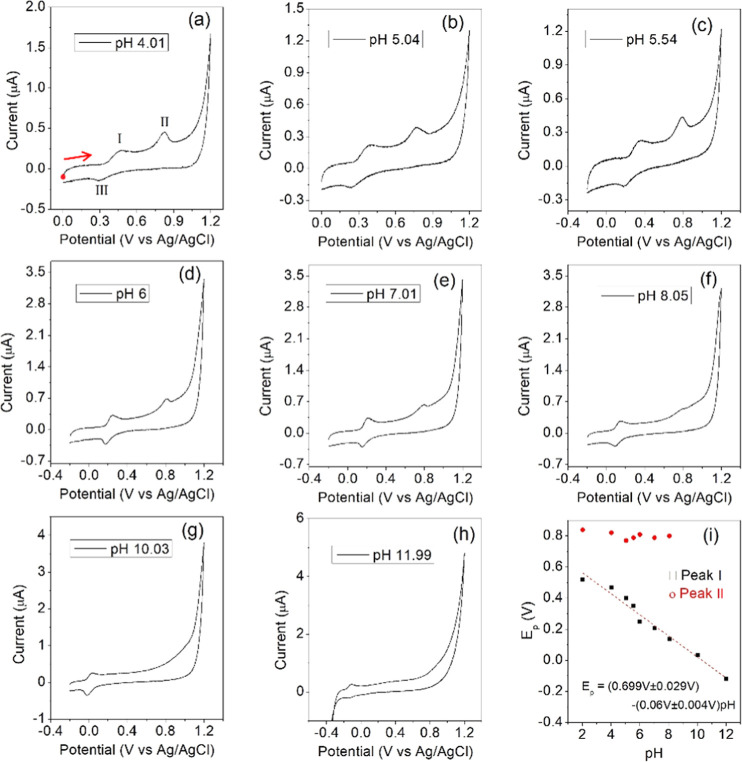
The set of voltammograms in Figure 2a–h shows the current response for BHT at different pH values for a sweep rate of 10 mV/s. This scan rate was chosen since, as observed in Figure S1, the system approaches the thermodynamic equilibrium between 5 and 15 mV/s. At sweep rates of >50 mV/s, several peaks disappear. In almost all cases, two oxidative peaks (I and II) and one reductive peak (III) are observed. However, up to pH = 8, the oxidative peak II begins to disappear. The voltammogram for pH = 2 is shown in Figure S2, where an extra reductive peak appears next to 1.1 V vs Ag/AgCl. This figure shows that the appearance of this spurious current does not affect the reaction since, if the potential window is lowered below 1.2 V, the reaction is not altered at all. The reaction of the medium is observed in all cases, approximately above 1.0 V and below −0.3 V, as the continuous current increases and decreases, respectively, until reaching the reverse potential.
Figure 2.
(a–h) Cyclic voltammograms at room temperature for BHT 33 μM at different pH values in 10.0 mL of solution containing 20% ACN in Britton–Robinson buffer of different pH values (2–12), sweep rate of 10 mV/s. The working electrode was a glassy carbon disk electrode with a platinum wire as the auxiliary electrode and a Ag/AgCl (KCl 3 M) as the reference electrode. (i) Potential peak vs pH for peaks I and II, dashed line corresponds to the linear fit of the data. The result of the fitting and the estimated errors are detailed in the figure. The CV IUPAC convention was implemented. An anodic scan was performed from the starting point in all voltammograms, as marked in (a) with a red dot and arrow.
The low oxidation potential observable for peak I of BHT indicates very strong reduction properties, similar to those exhibited by other phenols.36 Also, analogous to other phenolic compounds, a shift of the oxidation potential (from 600 to 300 mV) affected by the pH change (from 3 to 8) is observed (Table 1 and Figure 2h). A linear relationship with a slope of 67 mV, that is, close to 59 mV, is evidenced in this figure, which shows the occurrence of both an electron and a proton-transfer (PT) during the oxidation of BHT. Peak II does not have such a clear behavior as the first one and practically disappears up to pH 8. Also, Figure 2i suggests that the potential peak for II is almost constant over the pH range where the peak is present; this is related to an isolated electron transfer.
Table 1. Current Peak for Peaks I, II, and III at Different pH Values.
| first
redox reaction |
second redox reaction | ||
|---|---|---|---|
| pH | peak I (μA) | peak III (μA) | peak II (μA) |
| 2.02 | 0.207 | –0.083 | 0.225 |
| 4.01 | 0.161 | –0.107 | 0.151 |
| 5.04 | 0.135 | –0.099 | 0.131 |
| 5.54 | 0.171 | –0.096 | 0.189 |
| 6.00 | 0.236 | –0.273 | 0.210 |
| 7.00 | 0.248 | –0.249 | 0.167 |
| 8.05 | 0.183 | –0.177 | 0.0357 |
| 10.03 | 0.174 | –0.249 | |
| 12.00 | 0.137 | –0.0587 | |
It is also important to note in Figure 2a–h that below pH = 5.5 and above pH = 6, the current responses observed present different behaviors (Table 1). Below pH = 5.5, the peaks are wider and present lower current peaks compared to voltammograms above pH = 6. The first redox reaction (pair I–III) is more reversible in alkaline mediums compared to acid ones, and the second oxidation peak II progressively disappears as pH increases. Peak II is always present at acid pH. Also, peak III is smaller compared to peak I in acid medium and seems to decrease as the acidity increases for the full potential window (0–1.2 V vs Ag/AgCl). However, as observed in Figure S2a for pH = 2, if the potential window is reduced to a value where peak II is not formed, the electrochemical behavior of the couple peak I–III is reversible. Another remarkable result is that peak III is practically absent at pH = 12. The same potential range variation as Figure S2a was applied to observe the behavior of the current for pH = 10, Figure S2b. In this case, the reaction is reversible for all potential windows considered, and peak II is not formed. Another remark is that peak I seems unaltered while peak III is reduced when increasing the potential window.
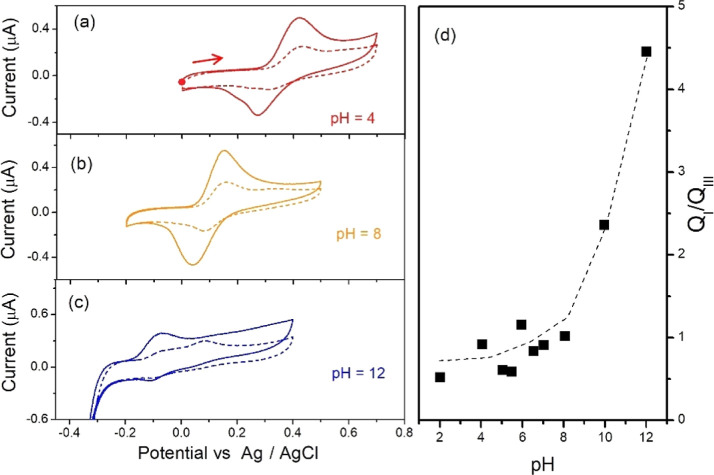
Different experiments were carried out to explore the dissimilarities described previously between the voltammetric responses of BHT under acidic and alkaline conditions. One logical approach is to study the behavior of the first reaction (pairs I–III) at different pH values. This is shown in Figure 3 for three representative pH values: 4 (a), 8 (b), and 12 (c). An appreciable decrease in current is observed in the second cycle, in all cases, which suggests the formation of a product that passivates the surface of the electrode. The same passivation is observed in consecutive cycles after the first one for the larger potential window (0–1.2 V vs Ag/AgCl), as shown in Figure S3. The reaction I–III is reversible for pH 4 and 8, but this is not the case for pH 12. Figure 3d shows the charge relationship, QI/QIII, considering the reduced potential window for all pH values. This set of voltammograms is shown in Figure S4. The dashed line was added to guide the eye. As noticed, a slightly increasing relationship is observed until pH 10, and then, QI/QIII increases drastically and reaches a maximum value of 4.5 at pH = 12. This means that the peak III disappearing is greater for pH > 8. Another feature to highlight in the second cycle is the formation of a peak after the first one in the most basic medium; it is not evident at the other pH values. In fact, this new peak presents a larger signal than peak I for pH 12.
Figure 3.
(a–c) Two cycles of cyclic voltammograms at room temperature for BHT 33 μM at different pH values in 10.0 mL of solution containing 20% ACN in Britton–Robinson buffer in a small potential window to avoid peak II formation. The solution contains pH values of 4 (a), 8 (b), and 12 (c). Sweep rate of 10 mV/s. The working electrode was a glassy carbon disk electrode with a platinum wire as the auxiliary electrode and a Ag/AgCl (KCl 3 M) as the reference electrode. The second cycle is shown in dashed line. (d) Charge ratio for peaks I and III vs pH. The CV IUPAC convention was implemented. An anodic scan was performed from the starting point in all voltammograms, as marked in (a) with a red dot and arrow.
3.2. DFT Calculations
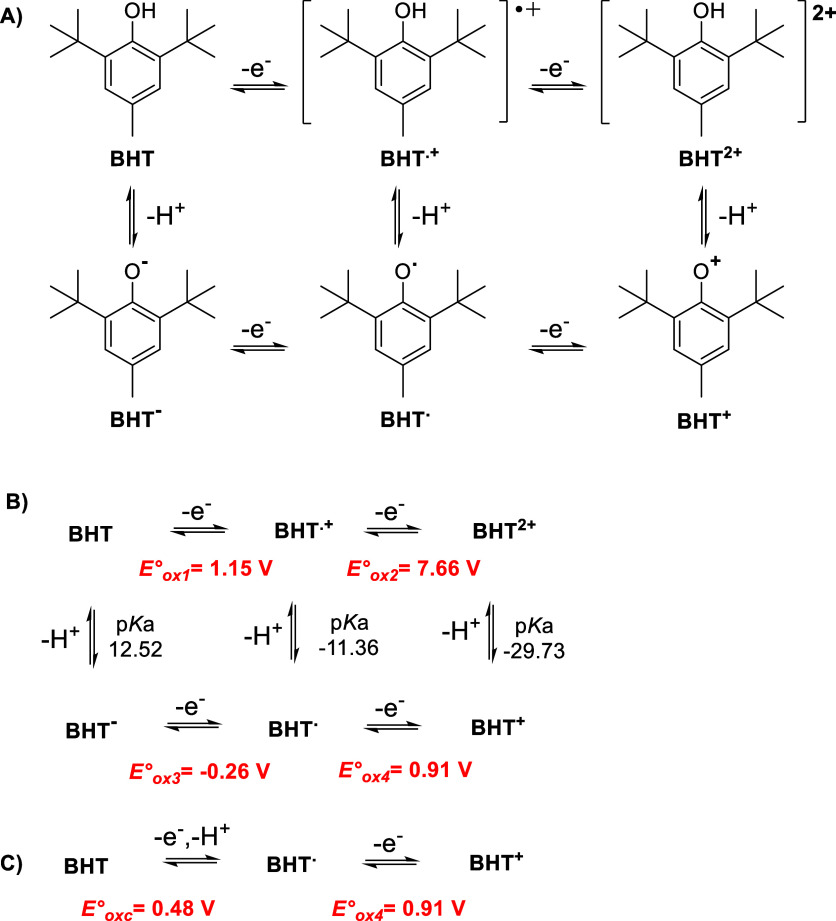
In the present study, all of the possible BHT oxidation paths were analyzed. For this purpose, a series of possible consecutive electron-transfer and PT reactions associated with this oxidation path were described by the electrochemical “square-scheme” mechanism, as shown in Scheme 1A. In this scheme, the single electron-transfer (SET) reactions are drawn horizontally, and the PT reactions are given vertically for the oxidation of BHT to form BHT+. Moreover, other side reactions, such as dimerization of the radicals or electrophilic attack of the cations on nucleophiles, may take place and are discussed below.
Scheme 1. (A) Generalized Electrochemical “Square-Scheme” Mechanism for the Oxidation of BHT to Form BHT+, with Electron-Transfer Reactions Drawn Horizontally and PT Reactions Given Vertically; (B) Sequential Electron and PT Mechanism; (C) Proposed Mechanism in Which the First Step Is a Coupled Electron–Proton Transfer.
Oxidation steps for BHT at pH ∼ 0 were computed using B3LYP/6-31+G(d,p)/SMD with explicit water molecules. The standard oxidation potentials (Eox°) are expressed in units of V vs Ag/AgCl electrode.
The oxidation of BHT starts with one SET to the electrode to form a cation radical, BHT+ (Eox1° = 1.15 V vs Ag/AgCl, Scheme 1B). The spin density of this radical is distributed in the hydroxyl group and the aromatic ring (Figure S5). Because of that, a second electron transfer (SET) process to form BHT2+ requires a higher potential (Eox2° = 7.66 V vs Ag/AgCl). At this point, to gain stabilization, BHT+ could lose a proton giving BHT· (Scheme 1B). Then, after a new SET process (Eox4°), BHT+ is formed (Scheme 1B).
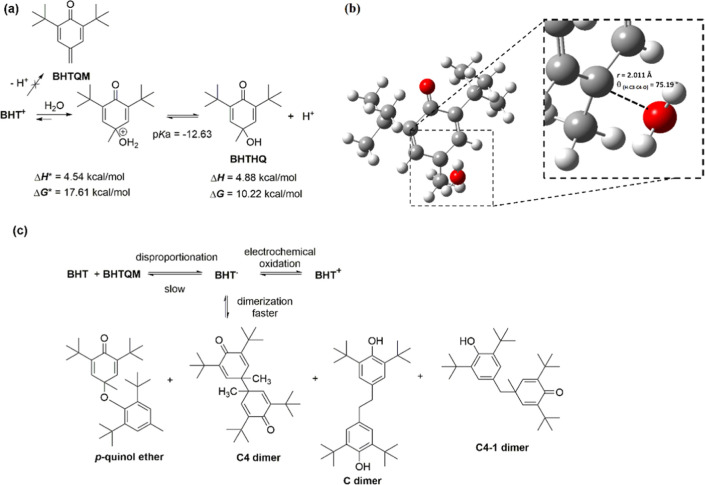
In addition, it could be postulated that the one-electron-transfer and one-proton-transfer processes are coupled (CPET) due to the PT reaction having negative pKa (thermodynamically favored; Scheme 1C). It can be observed that the potential of the coupled transference (Eoxc°) is lower than the oxidation potential in consecutive steps (Eox1°). This phenomenon is in good agreement with the experimental results in Figure 2, which show the decrease of the potential of peak I with the increase of pH values and the reversibility of the process (presence of peak III). On the contrary, the potential peak II remains practically without alterations with the pH changes according to one SET stated in the experimental section and the computed Eox4°. This electrochemical process is not reversible because BHT+ reacts with a water molecule to give the corresponding 2,6-di-tert-butyl-4-hydroxy-4-methylcyclohexa-2,5-dien-1-one, BHTHQ (Figure 4a).
Figure 4.
Formation of the hydroxyquinone (BHTHQ). (a) Mechanism with computed thermodynamic parameters. (b) Transition-state structure. (c) Alternative reactions of BHT.
The formation of this secondary product was described for 2,4,6-tri-tert-butylphenol, 2,6-di-tert-butyl-4-isopropylphenol and BHT.4,37,38 In this way, dealkylation of BHTHQ is unprovable because a primary radical should be formed in the process. In addition, the hydrolysis reaction was studied deeply using computational methods; the thermodynamic parameters calculated are in good agreement with the plausible formation of BHTHQ in the experimental conditions; the equilibrium constant K for this reaction estimated from Δ G° is 0.0024 (Figure 4a). At this point, it is necessary to remark that due to the potential of peak II having no dependency with the medium pH, the formation of the quinone methide (BHTQM) from BHT+ is discarded (Figure 4a). In the same way, the disproportion reaction of BHT· to give BHT and BHTQM is not considered because it is too slow to occur in the times of voltammetric assays (Figure 4c).37 Recently, the energy profile required for the methoxylation reaction of BHT using DFT calculations and methanol as the solvent was reported. They observed that the methoxylation processes had a similar energy than reported here having this reaction a transition enthalpy of 6.2 kcal/mol.39 This is in good agreement with the fact that methanol and water act as nucleophiles. In addition, the formation of this product through BHTQM was discarded by the authors because of its large energetic requirement, a fact which is under our previous statement.39
Until this point, the voltammetric behavior of BHT in an acidic pH aqueous medium is explained. On the other hand, according to the increase of the medium pH being higher the formation of BHT– takes place (BHT pKa = 12.52). According to the pH value being closer to the pKa, the oxidation of this anion gives BHT· (Eox3° = −0.26 V vs Ag/AgCl; Figure 4a). As was described in the Experimental Section, peak I becomes more reversible, and peak II disappears as pH increases. This fact could be attributed to the reversible dimerization reaction of BHT· to form other compounds (Figure 4c). While all dimerization products were isolated from electrochemical reactions, it was proposed that the main product formed in the voltammetric time is the p-quinol ether derivative (Figure 4c).37
In this system, there is a balance between the kinetics of the long life of the radical of BHT due to the substitution in ortho and para positions, in comparison with other phenols, and the chemical instability of the mentioned phenoxyl radicals toward dimerization in aqueous solution.36
Finally, to remark on the excellent consistency between the theoretical and experimental results, a Pourbaix diagram is presented in Figure 5. The behavior of experimental EpI corresponds to the computed potentials for the CPET mechanism. There are small differences because the CPET mechanism is constructed based on standard potentials, and the experimental data correspond to peak potentials. Also, the second potential peak, EpII, is described perfectly by the computed SET mechanism. The CPET conditions were described for phenol and 2,4,6-tri-t-butylphenol in water previously, in which systems only present one voltammetric peak.17,18 These reports could not describe properly systems with electrode adsorption or secondary reactions and denote the necessity of the DFT studies in order to get a new mechanism perspective.17
Figure 5.
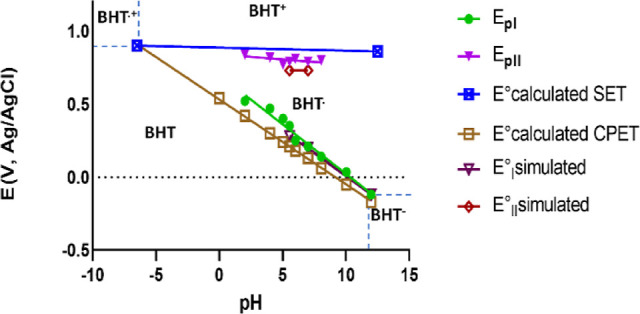
Pourbaix diagram for BHT.
3.3. CV Simulations
Once the thermodynamics of the mechanism have been analyzed, voltammetry simulations incorporate the kinetics of the process to contrast the experimental measurements with those of the proposed mechanistic model. This stage allows us not only to corroborate the proposed oxidation pathway but also to obtain quantitative kinetic information on the considered reactions. The usual notation was implemented: Ei to symbolize a redox reaction “i” and Cj to describe a homogeneous chemical reaction “j”. Adsorbed species parameters were labeled with the subindex “ads”, while the adsorption/desorption process was described with the symbol Ak to describe the adsorption “k”. It is important to note that, in the present simulations, the passivation effect produced by the adsorbed oxidation products was not considered, but it is expected for these species to partially block charge transfer, diminishing the charge-transfer rate and so decreasing the current response.
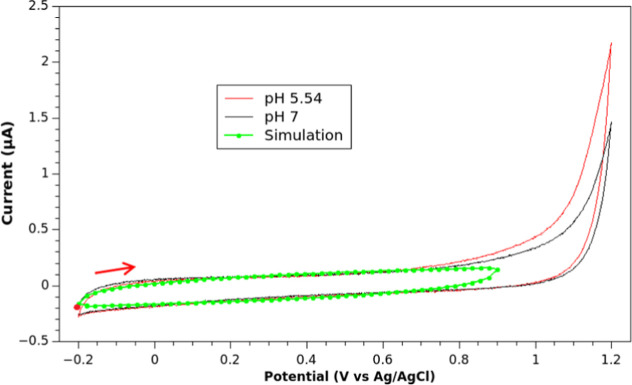
Before analyzing the faradaic current, we first started by modeling the background (nonfaradaic) current of the electrochemical cell, with eq 14. Figure 6 shows the experimental background current for pH 5.54 and 7. As observed, the experimental voltammograms are quite similar until 0.7 V, where there is no reaction of the solvent (observed in the experimental measurements as a current increase). The nonfaradaic current was simulated and fitted with a Nelder–Mead simplex.40 The result of the simulation is shown in Figure 6 using the fitted parameters RΩ = 55 Ω, Y0 = 2.97 μF·s1−γ, and γ = 0.61. This set of parameters was also obtained with EIS data for two different pH values. Figure S6 and Tables S1 and S2 show that average values of RΩ, Y0, and γ for different pH values are in concordance with the fitted data, showing small ohmic resistances RΩ < 100 Ω, Y0 < 4 μF·s1−γ and γ close to 0.8. As observed, despite some differences in the values of γ, the fitting and experimental parameters match quite well. This is so, to obtain a curve that more exactly matches the voltammetric measurements, we used the parameters from the fitting.
Figure 6.
Experimental nonfaradaic current (no BHT additioned) for 10 mL of solution containing 20% ACN in Britton–Robinson buffer at pH 5.54 and 7. Sweep rate is 10 mV/s. The working electrode was a glassy carbon disk electrode with a platinum wire as the auxiliary electrode and a Ag/AgCl (KCl 3 M) as the reference electrode. A simulation of the nonfaradaic current, applying eq 14, is shown in green. RMSE = 0.0947 μ A. The CV IUPAC convention was implemented. An anodic scan was performed from the starting point in all voltammograms, as marked with a red dot and arrow.
The proposed mechanism for BHT oxidation in a voltammetric framework is shown in Figure 7 and was constructed from the results described in the DFT section, Scheme 1C, and also considering hydrolysis of BHT+ (Figure 4a) and dimerization of BHT· (Figure 4c). For convenience, potentials Eoxc° and Eox4° of Scheme 1C are now labeled as E10 and E20, respectively. The mechanism can be described in two different pathways, one EC that ends with the formation of the dimer after the formation of the radical BHT·, and an EEC pathway, that ends with the hydrolysis product of BHT+. Furthermore, as observed in Figure 7, redox reactions can occur either in solution, next to the electrode surface, or on the electrode surface (adsorbed species). So, when necessary, it is required to distinguish between parameters in the solution (for example, E10) and adsorbed ones (E1,ads0), as will be seen below.
Figure 7.
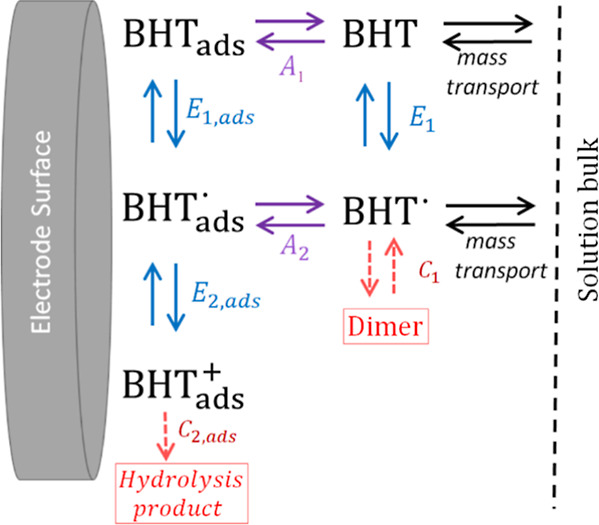
BHT oxidation mechanism, designed for voltammetry simulations. The meaning of the symbols is detailed in the main text.
As detailed in Figure 7, the following assumptions were considered for voltammetric simulations:
Mass transport phenomena for BHT and BHT· was considered to be regulated by the same diffusion coefficient, DBHT. BHT+ is not considered a diffusive species.
As a buffered solution was used in experiments, the mass transport of protons, and so the impact on the current response, was considered negligible.
BHT and BHT· can be adsorbed/desorbed to/from the electrode surface. These are processes labeled with A1 and A2 in Figure 7, respectively. The rates of adsorption/desorption of BHT and BHT· are regulated by constants kads,1/kdes,1 (A1) and kads,2/kdes,2 (A2), respectively.
The redox couple BHT/BHT· presents a heterogeneous reaction in solution, i.e., non-adsorbed, (symbol E1) with parameters E01 and k01.
Adsorbed redox reactions of couples BHTads/BHT·ads and BHT·ads/BHTads+ are represented with symbols E1,ads, and E2,ads, respectively. For E1,ads, k01,ads and E01,ads are the adsorbed parameters, E01,ads is calculated with eq 18. For E2,ads, adsorbed parameters E02,ads and k02,ads should be defined.
Reaction C1 considers the dimerization of the radical BHT· and the respective backward reaction. These processes are regulated by rate constants kf1 and kb1, respectively. Dimerization was considered a second-order reaction while the backward reaction was taken as a first-order one. The reaction C2 is the hydrolysis of the final oxidation product, BHT+, and this was tacked as an irreversible and first-order reaction controlled by kf2,ads.
The nonfaradaic current behaves as an R-CPE circuit, where the CPE parameters and the ohmic resistance do not vary with the potential of the electrode.
The fouling of the surface after the BHT oxidation and the reaction of the medium were omitted.
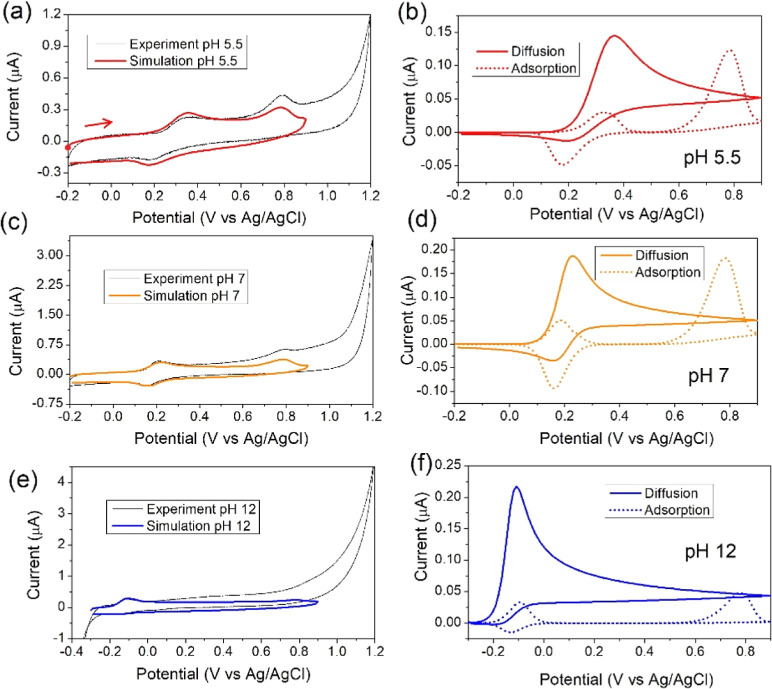
Three representative pH cases were taken for simulations: pH = 5.54, 7, and 12. The voltammograms for these pH values are shown in Figure 8a,c,e. The complete set of mathematical equations can be found in the Supporting Information. The values of quantities used in the model were estimated by an exploration of the parameters and are detailed in Table 2. For this, a bibliographic search of phenolic compounds has served as reference values.14,19,41−43 Chronocoulometry measurements were performed to calculate the diffusion coefficient of BHT with Anson’s equation (eq 1). Calculated diffusion coefficients were DBHT = 1.04 × 10⁻⁵ cm2 s–1 for pH 5.54 and 1.2 × 10⁻⁵ cm2 s–1 for pH 8. As these values are practically the same, we worked with DBHT = 1.04 × 10⁻⁵ cm2 s–1 for all simulations. The electrochemical surface area was calculated as 7.68 × 10⁻² cm2, and the geometrical area was 7.07 × 10⁻² cm2, so we can safely use surface areas ranging between these two values, considering that the electrode surface is regenerated by polishing before each measurement due to the formation of the passivation film during the experiments.
Figure 8.
(a,c,e) Experimental and simulated voltammograms at a sweep rate of 10 mV/s with solutions containing pH 5.5 (a), 7 (b), and 12 (c) at 10 mV/s. Experimental CVs were performed at room temperature in a three-electrode cell consisting of a glassy carbon working electrode, a platinum wire auxiliary electrode, and a Ag/AgCl (KCl 3 M) reference electrode. The 10 mL of solution contained BHT 33 μM and 20% ACN in Britton–Robinson buffer. Corresponding contributions of diffusion and adsorption to the simulated faradaic are detailed in figures (b,d,f) for the indicated pH values. The CV IUPAC convention was implemented. An anodic scan was performed from the starting point in all voltammograms, as marked with a red dot and arrow in (a).
Table 2. Parameters Used for Numerical Simulations of Voltammetry at Different pH Values.
| parameter | pH = 5.54 | pH = 7.0 | pH = 12.0 |
|---|---|---|---|
| A [cm2] | 0.0707 | 0.0768 | 0.0707 |
| CBHT [mol/cm3] | 3.29 × 10⁻¹⁰ | 3.29 × 10⁻¹⁰ | 3.29 × 10⁻¹⁰ |
| DBHT [cm2/s] | 1.04 × 10⁻⁵ | 1.04 × 10⁻⁵ | 1.04 × 10⁻⁵ |
| T [K] | 298 | 298 | 298 |
| α | 0.5 | 0.5 | 0.5 |
| E01, E02,ads [V vs Ag/AgCl] | 0.28, 0.73 | 0.2, 0.73 | –0.12, 0.73 |
| k01 [cm/s] | 7.00 × 10⁻⁴ | 7.00 × 10⁻¹ | 7.00 × 10⁻¹ |
| k01,ads, k02,ads [s–1] | 1.0, 8 × 10⁻² | 1 × 10,1 8 × 10⁻² | 1 × 10,1 8 × 10⁻² |
| kads,1, kads,2 [cm2/mol·s] | 8.00 × 10², 3.00 × 10³ | 1.00 × 10³, 3.00 × 10³ | 1.00 × 10³, 1.00 × 10³ |
| kdes,1, kdes,2 [s–1] | 3.00 × 10⁻², 1.00 × 10⁻⁴ | 4.00 × 10⁻², 1.00 × 10⁻⁴ | 4.00 × 10⁻², 1.00 × 10⁻⁴ |
| kf1 [cm3/mol·s] | 4.00 × 10⁶ | 1.00 × 10⁶ | 1.00 × 10⁶ |
| kb1 [s–1] | 100 | 100 | 100 |
| kf2,ads [s–1] | 5.0 | 5.0 | 5.0 |
| kf3 [cm3/mol·s] | 0.0 | 0.0 | 1 × 10⁸ |
As observed, despite the differences with the experiment, the simulated voltammograms match well with the experimental ones (Figure 8a,c,e). This is an important main result because it shows that the mechanism predicted with DFT calculations properly explains the oxidation pathway of BHT in different pH mediums. As working with such small currents (hundreds of nA), the current was intentionally reduced from simulations until it matched the experimental ones, subtracting all simulated curves an approximate value of 5 × 10⁻⁸ A from the total current. As expected, there are differences where the solvent begins to react, however, the zone of electrochemical relevance in each pH agrees with the experimental measurement. Also, another source of discrepancy is the formation of a film on the surface of the electrode, which is common in phenolic compounds.44,45 As mentioned in the experimental section, successive cycles show a strong decrease in current due to the fouling of the electrode surface because fouling causes a potential drop with time.46 This phenomenon is more pronounced on peak II if this peak is further from peak I because there is more time for film formation on the surface.
The discussion will start with the analysis of pH 5.5 and 7. Figure 8b,d presents the partial currents of diffusion and adsorption at pH 5.5 and 7, respectively. The first difference that can be noted is that the redox pair I/III is kinetically slower for pH 5.5 than that for 7. This is why a wider peak I is observed at the acid medium compared with alkaline ones. In both cases, a mixed diffusion/adsorption contribution to the current is observed in peak I, with diffusional being more important. This is so that at the beginning of the simulation, there is no adsorbed BHT on the surface. This initial condition was intentionally kept since experimental measurements were run as soon as the electrode was immersed in the solution. Regarding cathodic peak III, the source of the current presents also a mixed diffusion/adsorption behavior, being diffusion less important in this case compared to peak I. Moreover, diffusional contribution in an acid medium seems minor than that in the alkaline case; behavior is linked to a higher dimerization rate (kf1) at acid pH values. A higher rate of dimer formation is expected at a more acidic pH, according to ref (47). The height of peak II is similar in these cases, being completely due to adsorption. The adsorptive character of the oxidation of BHT in 5% of acetonitrile was reported previously.2
Figure 9 provides an explanation for the model presented in Figure 7 in which peak current II is due exclusively to the adsorbed radical. This figure presents the experimental current from which the background current has been subtracted for the oxidative sweep, together with two simulations: one in which the faradaic current is due to a mix of adsorptive and diffusional current and another in which it is purely diffusional. For the last case, the same parameters were used, with the exception that all adsorption constants were set to zero and kf1 = 6.00 × 104 cm3/mol. Also, two new parameters were implemented for the couple BHT·/BHT+, for the reaction in solution next to the electrode surface, k02 = 1.0 × 10⁻³ cm/s and E02 = 0.73 V vs Ag/AgCl. Both simulations accurately explain the occurrence of peak I, but the situation regarding peak II is different. There is a clear correspondence between the model where adsorption is regulating peak II (green current) and the experimental counterpart, until the potential where the fouling of the surface causes differences with the background current (gray shaded area). In the case of pure diffusion behavior, marked differences are observed with respect to the experiment and with the adsorptive simulated current peak II. A shaded area in magenta was added to highlight the difference between both simulated curves due to the presence of a characteristic diffusional tail, absent in the adsorptive peak II.
Figure 9.
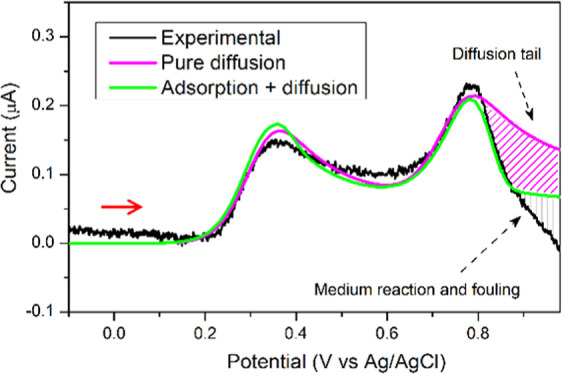
Experimental oxidative current (background current subtracted) for pH = 5.5 at 10 mV/s. Simulated voltammograms for the same conditions as the experimental case and with two distinct scenarios: a current totally dependent on diffusion phenomena and that of the model shown in Figure 7, where a mixed diffusion and adsorption is considered. The experimental voltammogram was performed at room temperature in a three-electrode cell consisting of a glassy carbon working electrode, a platinum wire auxiliary electrode, and a Ag/AgCl (KCl 3 M) reference electrode. The 10 mL of solution contained BHT 33 μM and 20% ACN in Britton–Robinson buffer. The CV IUPAC convention was implemented. An anodic scan was performed in the direction of the red arrow from the starting point (not shown in the figure).
The case of pH 12 is a special one. The behavior for this pH is different from that of the rest. At this medium, there are no protons in the solution, then the energetics of electron-transfer reactions involve the phenolate ions (BHT–) and the phenoxyl radicals (BHT·) in aqueous solutions, being this process straightforward (one electron transfer). According to the increasing of the radical formation, the secondary product formation is favored and could be present in the CV experiments after a second cycle experiment (Figure 3c). This is why we considered another reaction in this case, regulated by the rate constant kf3. This new reaction considers the BHT radical consumed in solution to form this secondary product. This is why peaks II and III are absent because there is no more radical available to react (or there is, but at a very low quantity). Moreover, it was reported that at pH 12, the oxidation is caused by oxygen-centered radicals such as OH• generated at high potentials, and this reaction could be responsible for the formation of secondary products.48
In this instance, we can recall the results at the reduced potential window of Figure 3, just to observe the redox pair I/III. As was noted, the charge ratio of these peaks (QI/QIII) was constant below pH lower than 10, where the ratio grew abruptly. This is consistent with the previous discussion. As pH increases, after 8, the rate kf3 rapidly increases, reaching a maximum of pH 12.
Finally, the obtained values of E01 and E02,ads for different pH values were inserted in the Pourbaix diagram of Figure 5, named E0Isimulated and E0IIsimulated, respectively. E0Isimulated falls between the experimental potential peaks and the calculated potentials. E0IIsimulated is close to the experimental and calculated data. This shows the correlation of the three different instances of the present approach.
4. Conclusions
The oxidation mechanism of BHT in aqueous solution was studied through experiment and theory at different pH values, which is of great relevance in many areas, such as food and feed chemistry, pharmaceuticals, and pharmacology. DFT calculations showed that the first oxidation reaction is due to a coupled loss of one electron and one proton (CPET), followed by a SET process without a loss of protons. The correspondence between these calculations and the experimental data was shown with a Pourbaix diagram. Secondary (nonelectroactive) reactions such as dimerization of BHT radical and hydrolysis of BHT cation were also studied with DFT.
The mechanism proposed for voltammetric simulations consisted of two different pathways: an EC path that ends with the formation of the dimer after the formation of the radical through the CPET reaction, and an EEC where the radical is oxidized in a PET reaction and the product is then hydrolyzed irreversibly. This mechanism, with the consideration of the reversible adsorption of BHT and its radical on the electrode surface and also that the cation is an adsorbed species, satisfactorily explained the CV responses observed in experiments at different pH values, modeling it with numerical simulations. It was also shown that adsorption is an important phenomenon in the electrochemistry of BHT in an aqueous solution, especially to explain the nature of the current of the second oxidation reaction. Simulations also revealed that the CPET reaction (formation of the radical) occurs with a faster kinetics in the basic medium than that in the acid medium. Furthermore, at pH = 12, a third lateral reaction may be relevant at high alkaline pH values, diminishing the radical concentration available to react. The product of this reaction was observed as the formation of a new peak in the second scan of the experiment. To the best of our knowledge, this voltammetric peak and its interpretation were not informed previously.
Finally, a novel approach for the study of the oxidation mechanism and electrochemistry of phenolic compounds has proven to be satisfactory. This shows its potential use in analyzing other molecules of interest, whose mechanism is not well-understood.
Acknowledgments
This work used computational resources from CCAD-UNC, which is part of SNCAD-MinCyT, Argentina. R.D.A. thanks CONICET for the doctoral fellowship.
Data Availability Statement
The data underlying this study are available in the published article and will be provided upon request to the authors.
Supporting Information Available
The Supporting Information is available free of charge at https://pubs.acs.org/doi/10.1021/acsorginorgau.4c00067.
Agencia Nacional de Promoción Científica y Tecnológica PICT 2021-I-INVI-00485 and PICT 2022-2022-03-00534.
The authors declare no competing financial interest.
Special Issue
Published as part of ACS Organic & Inorganic Auspecial issue“Electrochemical Explorations in Organic and Inorganic Chemistry”.
Supplementary Material
References
- Yehye W. A.; Rahman N. A.; Ariffin A.; Abd Hamid S. B.; Alhadi A. A.; Kadir F. A.; Yaeghoobi M. Understanding the Chemistry behind the Antioxidant Activities of Butylated Hydroxytoluene (BHT): A Review. Eur. J. Med. Chem. 2015, 101, 295–312. 10.1016/j.ejmech.2015.06.026. [DOI] [PubMed] [Google Scholar]
- Galeano Diaz T.; Guiberteau Cabanillas A.; Alexandre Franco M. F.; Salinas F.; Viré J. C. Voltammetric Behavior and Simultaneous Determination of the Antioxidants Propyl Gallate, Butylated Hydroxyanisole, and Butylated Hydroxytoluene in Acidic Acetonitrile-Water Medium Using PLS Calibration. Electroanalysis 1998, 10 (7), 497–505. . [DOI] [Google Scholar]
- Parker V. D.; Ronlán A. Anodic Oxidation of Phenolic Compounds. I. On the Mechanism of the Anodic Oxidation of 2,6-Di-Tert-Butyl-p-Cresol. J. Electroanal. Chem. Interfacial Electrochem. 1971, 30 (3), 502–505. 10.1016/0368-1874(71)87034-X. [DOI] [Google Scholar]
- Ronlán A.; Parker V. D. Anodic Oxidation of Phenolic Compounds. Part II. Products and Mechanism of the Anodic Oxidation of Hindered Phenols. J. Chem. Soc. C 1971, 3214–3218. 10.1039/J39710003214. [DOI] [Google Scholar]
- Ni Y.; Wang L.; Kokot S. Voltammetric Determination of Butylated Hydroxyanisole, Butylated Hydroxytoluene, Propyl Gallate and Tert-Butylhydroquinone by Use of Chemometric Approaches. Anal. Chim. Acta 2000, 412 (1–2), 185–193. 10.1016/S0003-2670(00)00720-0. [DOI] [Google Scholar]
- Lin X.; Ni Y.; Kokot S. Glassy Carbon Electrodes Modified with Gold Nanoparticles for the Simultaneous Determination of Three Food Antioxidants. Anal. Chim. Acta 2013, 765, 54–62. 10.1016/j.aca.2012.12.036. [DOI] [PubMed] [Google Scholar]
- Freitas K. H. G.; Fatibello-Filho O. Simultaneous Determination of Butylated Hydroxyanisole (BHA) and Butylated Hydroxytoluene (BHT) in Food Samples Using a Carbon Composite Electrode Modified with Cu3(PO4)2 Immobilized in Polyester Resin. Talanta 2010, 81 (3), 1102–1108. 10.1016/j.talanta.2010.02.004. [DOI] [PubMed] [Google Scholar]
- Jakubczyk M.; Michalkiewicz S. Electrochemical Behavior of Butylated Hydroxyanisole and Butylated Hydroxytoluene in Acetic Acid Solutions and Their Voltammetric Determination in Pharmaceutical Preparations. Int. J. Electrochem. Sci. 2018, 13 (5), 4251–4266. 10.20964/2018.05.76. [DOI] [Google Scholar]
- dos Santos Raymundo M.; Marques da Silva Paula M.; Franco C.; Fett R. Quantitative Determination of the Phenolic Antioxidants Using Voltammetric Techniques. LWT--Food Sci. Technol. 2007, 40 (7), 1133–1139. 10.1016/j.lwt.2006.07.001. [DOI] [Google Scholar]
- Ng K. L.; Tan G. H.; Khor S. M. Graphite Nanocomposites Sensor for Multiplex Detection of Antioxidants in Food. Food Chem. 2017, 237, 912–920. 10.1016/j.foodchem.2017.06.029. [DOI] [PubMed] [Google Scholar]
- Blandon-Naranjo L.; Alaniz R. D.; Zon M. A.; Fernández H.; Granero A. M.; Robledo S. N.; Pierini G. D. Development of a Voltammetric Electronic Tongue for the Simultaneous Determination of Synthetic Antioxidants in Edible Olive Oils. Talanta 2023, 261, 124123. 10.1016/j.talanta.2022.124123. [DOI] [PubMed] [Google Scholar]
- Gavilán-Arriazu E. M.; Rodriguez S. A. Elucidating the Complete Oxidation Mechanism of Betanidin in an Aqueous Solution. Phys. Chem. Chem. Phys. 2023, 25 (9), 6891–6901. 10.1039/D2CP05708E. [DOI] [PubMed] [Google Scholar]
- Gavilán-Arriazu E. M.; Rodriguez S. A. Study of the Electrochemical Betanidin Oxidation Path Using Computational Methods. Phys. Chem. Chem. Phys. 2022, 24 (32), 19269–19278. 10.1039/D2CP02053J. [DOI] [PubMed] [Google Scholar]
- Tapia Mattar V.; Gavilán-Arriazu E. M.; Rodriguez S. A. Study of Electrochemical Mechanisms Using Computational Simulations: Application to Phenol Butylated Hydroxyanisole. J. Chem. Educ. 2022, 99 (2), 1044–1052. 10.1021/acs.jchemed.1c01230. [DOI] [Google Scholar]
- Gateman S. M.; Gharbi O.; Gomes de Melo H.; Ngo K.; Turmine M.; Vivier V. On the Use of a Constant Phase Element (CPE) in Electrochemistry. Curr. Opin. Electrochem. 2022, 36, 101133. 10.1016/j.coelec.2022.101133. [DOI] [Google Scholar]
- Zoltowski P. On the Electrical Capacitance of Interfaces Exhibiting Constant Phase Element Behaviour. J. Electroanal. Chem. 1998, 443 (1), 149–154. 10.1016/S0022-0728(97)00490-7. [DOI] [Google Scholar]
- Costentin C.; Louault C.; Robert M.; Savéant J. M. The Electrochemical Approach to Concerted Proton—Electron Transfers in the Oxidation of Phenols in Water. Proc. Natl. Acad. Sci. U.S.A. 2009, 106 (43), 18143–18148. 10.1073/pnas.0910065106. [DOI] [PMC free article] [PubMed] [Google Scholar]
- Costentin C. Electrochemical Approach to the Mechanistic Study of Proton-Coupled Electron Transfer. Chem. Rev. 2008, 108 (7), 2145–2179. 10.1021/cr068065t. [DOI] [PubMed] [Google Scholar]
- Costentin C.; Robert M.; Savéant J. M. Concerted Proton--Electron Transfers in the Oxidation of Phenols. Phys. Chem. Chem. Phys. 2010, 12 (37), 11179–11190. 10.1039/c0cp00063a. [DOI] [PubMed] [Google Scholar]
- Enache T. A.; Oliveira-Brett A. M. Phenol and Para-Substituted Phenols Electrochemical Oxidation Pathways. J. Electroanal. Chem. 2011, 655 (1), 9–16. 10.1016/j.jelechem.2011.02.022. [DOI] [Google Scholar]
- Caruso F.; Rossi M.; Kaur S.; Garcia-Villar E.; Molasky N.; Belli S.; Sitek J. D.; Gionfra F.; Pedersen J. Z.; Incerpi S. Antioxidant Properties of Embelin in Cell Culture. Electrochemistry and Theoretical Mechanism of Scavenging. Potential Scavenging of Superoxide Radical through the Cell Membrane. Antioxidants 2020, 9 (5), 382. 10.3390/antiox9050382. [DOI] [PMC free article] [PubMed] [Google Scholar]
- Anson F. C.; Osteryoung R. A. Chronocoulometry: A Convenient, Rapid and Reliable Technique for Detection and Determination of Adsorbed Reactants. J. Chem. Educ. 1983, 60 (4), 293. 10.1021/ed060p293. [DOI] [Google Scholar]
- Frisch M. J.; Trucks G. W.; Schlegel H. B.; Scuseria G. E.; Robb M. A.; Cheeseman J. R.; Scalmani G.; Barone V.; Mennucci B.; Petersson G. A.; Nakatsuji H.; Caricato M.; Li X.; Hratchian H. P.; Izmaylov A. F.; Bloino J.; Zheng G.; Sonnenberg J. L.; Frisch M. J.; Trucks G. W.; Schlegel H. B.; Scuseria G. E.; Robb M. A.; Cheeseman J. R.; Scalmani G.; Barone V.; Mennucci B.; Petersson G. A.; Nakatsuji H.; Caricato M.; Li X.; Hratchian H. P.; Izmaylov A. F.; Bloino J.; Zheng G.; Sonnenberg J. L.; Hada M.; Ehara M.; Toyota K.; Fukuda R.; Hasegawa J.; Ishida M.; Nakajima T.; Honda Y.; Kitao O.; Nakai H.; Vreven T.; Montgomery J. A. Jr.; Peralta J. E.; Ogliaro F.; Bearpark M.; Heyd J. J.; Brothers E.; Kudin K. N.; Staroverov V. N.; Kobayashi R.; Normand J.; Raghavachari K.; Rendell A.; Burant J. C.; Iyengar S. S.; Tomasi J.; Cossi M.; Rega N.; Millam J. M.; Klene M.; Knox J. E.; Cross J. B.; Bakken V.; Adamo C.; Jaramillo J.; Gomperts R.; Stratmann R. E.; Yazyev O.; Austin A. J.; Cammi R.; Pomelli C.; Ochterski J. W.; Martin R. L.; Morokuma K.; Zakrzewski V. G.; Voth G. A.; Salvador P.; Dannenberg J. J.; Dapprich S.; Daniels A. D.; Farkas O. ¨.; Foresman J. B.; Ortiz J. V.; Cioslowski J.; Fox D. J.. Gaussian 09, Revision E. 01; Gaussian, 2009.
- Marenich A. V.; Cramer C. J.; Truhlar D. G. Performance of SM6, SM8, and SMD on the SAMPL1 Test Set for the Prediction of Small-Molecule Solvation Free Energies. J. Phys. Chem. B 2009, 113, 4538–4543. 10.1021/jp809094y. [DOI] [PubMed] [Google Scholar]
- Ho J. Are Thermodynamic Cycles Necessary for Continuum Solvent Calculation of PK a s and Reduction Potentials?. Phys. Chem. Chem. Phys. 2015, 17, 2859–2868. 10.1039/C4CP04538F. [DOI] [PubMed] [Google Scholar]
- Thapa B.; Schlegel H. B. Improved PKa Prediction of Substituted Alcohols, Phenols, and Hydroperoxides in Aqueous Medium Using Density Functional Theory and a Cluster-Continuum Solvation Model. J. Phys. Chem. A 2017, 121, 4698–4706. 10.1021/acs.jpca.7b03907. [DOI] [PubMed] [Google Scholar]
- Isse A. A.; Gennaro A. Absolute Potential of the Standard Hydrogen Electrode and the Problem of Interconversion of Potentials in Different Solvents. J. Phys. Chem. B 2010, 114 (23), 7894–7899. 10.1021/jp100402x. [DOI] [PubMed] [Google Scholar]
- Truhlar D. G.; Cramer C. J.; Lewis A.; Bumpus J. A. Molecular Modeling of Environmentally Important Processes: Reduction Potentials. J. Chem. Educ. 2004, 81 (4), 596. 10.1021/ed081p596. [DOI] [Google Scholar]
- Bartmess J. E. Thermodynamics of the Electron and the Proton. J. Phys. Chem. 1994, 98 (25), 6420–6424. 10.1021/j100076a029. [DOI] [Google Scholar]
- Guennebaud G.; Jacob B.. Eigen, 2010. http://eigen.tuxfamily.org (accessed on 19/04/2024).
- Britz D.; Strutwolf J.. Digital Simulation in Electrochemistry. Monographs in Electrochemistry; Springer International Publishing: Cham, 2016. [Google Scholar]
- Charoen-amornkitt P.; Suzuki T.; Tsushima S. Ohmic Resistance and Constant Phase Element Effects on Cyclic Voltammograms Using a Combined Model of Mass Transport and Equivalent Circuits. Electrochim. Acta 2017, 258, 433–441. 10.1016/j.electacta.2017.11.079. [DOI] [Google Scholar]
- Charoen-amornkitt P.; Suzuki T.; Tsushima S. Effects of Voltage-Dependence of the Constant Phase Element and Ohmic Parameters in the Modeling and Simulation of Cyclic Voltammograms. J. Electrochem. Soc. 2020, 167 (16), 166506. 10.1149/1945-7111/abbe5d. [DOI] [Google Scholar]
- Compton R. G.; Laborda E.; Ward K. R.. Understanding Voltammetry: Simulation of Electrode Processes; Scientifi W., Ed.; World Scientific: Singapore, 2013. [Google Scholar]
- Brent R. P.Algorithms for Minimization without Derivatives; Courier Corporation, 2013; . [Google Scholar]
- Li C.; Hoffman M. Z. One-Electron Redox Potentials of Phenols in Aqueous Solution. J. Phys. Chem. B 1999, 103 (32), 6653–6656. 10.1021/jp983819w. [DOI] [Google Scholar]
- Evans D. H.; Jimenez P. J.; Kelly M. J. Reversible Dimerization of Phenoxyl Radicals Formed by Anodic Oxidation of Phenolates: A Quantitative Study by Cyclic Voltammetry. J. Electroanal. Chem. Interfacial Electrochem. 1984, 163 (1–2), 145–157. 10.1016/S0022-0728(84)80048-0. [DOI] [Google Scholar]
- Richards J. A.; Evans D. H. Electrochemical Oxidation of 2,6-Di-Tert-Butyl-4-Isopropylphenol. J. Electroanal. Chem. Interfacial Electrochem. 1977, 81 (1), 171–187. 10.1016/S0022-0728(77)80369-0. [DOI] [Google Scholar]
- Tomczyk I.; Kalek M. Electrochemical Dearomatizing Methoxylation of Phenols and Naphthols: Synthetic and Computational Studies. Chem. - Eur. J. 2024, 30 (20), e202303916 10.1002/chem.202303916. [DOI] [PubMed] [Google Scholar]
- Nelder J. A.; Mead R. A Simplex Method for Function Minimization. Comput. J. 1965, 7 (4), 308–313. 10.1093/comjnl/7.4.308. [DOI] [Google Scholar]
- Costentin C.; Louault C.; Robert M.; Savéant J. M. Evidence for Concerted Proton-Electron Transfer in the Electrochemical Oxidation of Phenols with Water as Proton Acceptor. Tri-Tert-Butylphenol. J. Am. Chem. Soc. 2008, 130 (47), 15817–15819. 10.1021/ja8064914. [DOI] [PubMed] [Google Scholar]
- García G.; García C. D.; Ortiz P. I.; De Pauli C. P. Reflectometry Applied to Electrochemically Generated Phenoxy Radical Adsorption Monitoring. J. Electroanal. Chem. 2002, 519, 53–59. 10.1016/s0022-0728(01)00721-5. [DOI] [Google Scholar]
- Neta P.; Grodkowski J. Rate Constants for Reactions of Phenoxyl Radicals in Solution. J. Phys. Chem. Ref. Data 2005, 34 (1), 109–199. 10.1063/1.1797812. [DOI] [Google Scholar]
- Wang J.; Martinez T.; Yaniv D. R.; McCormick L. D. Scanning Tunneling Microscopic Investigation of Surface Fouling of Glassy Carbon Surfaces Due to Phenol Oxidation. J. Electroanal. Chem. Interfacial Electrochem. 1991, 313 (1–2), 129–140. 10.1016/0022-0728(91)85176-P. [DOI] [Google Scholar]
- Ferreira M.; Varela H.; Torresi R. M.; Tremiliosi-Filho G. Electrode Passivation Caused by Polymerization of Different Phenolic Compounds. Electrochim. Acta 2006, 52 (2), 434–442. 10.1016/j.electacta.2006.05.025. [DOI] [Google Scholar]
- Yang X.; Kirsch J.; Fergus J.; Simonian A. Modeling Analysis of Electrode Fouling during Electrolysis of Phenolic Compounds. Electrochim. Acta 2013, 94, 259–268. 10.1016/j.electacta.2013.01.019. [DOI] [Google Scholar]
- Das T. N. Oxidation of Phenol in Aqueous Acid: Characterization and Reactions of Radical Cations Vis-à-Vis the Phenoxyl Radical. J. Phys. Chem. A 2005, 109 (15), 3344–3351. 10.1021/jp050015p. [DOI] [PubMed] [Google Scholar]
- Bensalah; Gadri; Cañizares P.; Cañizares P.; Sáez C.; Lobato J.; Rodrigo M. A. Electrochemical Oxidation of Hydroquinone, Resorcinol, and Catechol on Boron-Doped Diamond Anodes. Environ. Sci. Technol. 2005, 39 (18), 7234–7239. 10.1021/es0500660. [DOI] [PubMed] [Google Scholar]
Associated Data
This section collects any data citations, data availability statements, or supplementary materials included in this article.
Supplementary Materials
Data Availability Statement
The data underlying this study are available in the published article and will be provided upon request to the authors.


