

Abstract
Elexacaftor/tezacaftor/ivacaftor (ETI) has had a substantial positive impact for people living with cystic fibrosis (pwCF). However, there can be substantial variability in efficacy, and we lack adequate biomarkers to predict individual response. We thus aimed to identify transcriptomic profiles in nasal respiratory epithelium that predict clinical response to ETI treatment. We obtained nasal epithelial samples from pwCF before ETI initiation and performed a transcriptome-wide analysis of baseline gene expression to predict changes in forced expiratory volume in 1 second (ΔFEV1), year’s best FEV1 (ΔybFEV1), and body mass index (ΔBMI). Using the top differentially expressed genes, we generated transcriptomic risk scores (TRSs) and evaluated their predictive performance. The study included 40 pwCF ≥6 years of age (mean, 27.7 [SD, 15.1] years; 40% female). After ETI initiation, FEV1 improved by ≥5% in 22 (61.1%) participants, and ybFEV1 improved by ≥5% in 19 (50%). TRSs were constructed using top overexpressed and underexpressed genes for each outcome. Adding the ΔFEV1 TRS to a model with age, sex, and baseline FEV1 increased the area under the receiver operating characteristic curve (AUC) from 0.41 to 0.88, the ΔybFEV1 TRS increased the AUC from 0.51 to 0.88, and the ΔBMI TRS increased the AUC from 0.46 to 0.92. Average accuracy was thus ∼85% in predicting the response to the three outcomes. Results were similar in models further adjusted for F508del zygosity and previous CFTR modulator use. In conclusion, we identified nasal epithelial transcriptomic profiles that help accurately predict changes in FEV1 and BMI with ETI treatment. These novel TRSs could serve as predictive biomarkers for clinical response to modulator treatment in pwCF.
Keywords: cystic fibrosis, CFTR modulators, elexacaftor/tezacaftor/ivacaftor, predictive biomarkers, transcriptomics
Cystic fibrosis (CF) is a progressive, multisystem genetic disease. Although CF is a monogenic disorder, there is wide variation in phenotype and disease severity, even among individuals from the same family who share genotype, environment, and pathogen exposures. Modifier genes and pathways contribute substantially to phenotypic variability in CF (1, 2). Non-CFTR heritability has been estimated to be as high as 54–80% for CF lung disease (2, 3), with similar estimates for nutritional status (4), CF-related diabetes (5), and other phenotypes (6). Yet studies focused exclusively on genotype yield an incomplete view of disease pathobiology, as genetic polymorphisms do not change and are thus poorly suited to predict an individual’s varying risk of poor outcomes over time. As gene expression reflects both genetic susceptibility (from known and unknown genes) and the environmental factors to which an individual is exposed, transcriptomic studies are uniquely positioned to identify dynamic biomarkers of disease severity, activity, and treatment response.
Triple CFTR modulator therapy with elexacaftor, tezacaftor, and ivacaftor (ETI; Trikafta; Vertex Pharmaceuticals) was approved by the U.S. Food and Drug Administration in 2019. Although the clinical trials that led to Food and Drug Administration approval were extremely encouraging, there was significant variability in treatment response: the mean increase in forced expiratory volume in 1 second (FEV1) was 10–14%, but ∼20–30% of subjects had only relatively small changes (similar to those seen in the respective control arms), and a few even showed decreases from baseline (7, 8). Similarly, some subjects had Cystic Fibrosis Questionnaire–Revised scores that failed to improve or worsened. Moreover, up to ∼20% reported adverse events related to the drug, some of which led to temporary treatment holds (8). Real-world studies of ETI efficacy have also described variation in clinical outcomes such as lung function (9–11), weight gain (12), and exercise capacity (13).
Despite this wide variability, we currently lack biomarkers to predict response to CFTR modulators and other treatments for CF. These compounds are selected for their effects on CFTR, so any large differences in response are likely driven by non-CFTR pathways. We hypothesized that analyzing transcriptomic profiles in CF respiratory epithelium would allow us to identify biomarkers that predict response to modulator treatment. We further hypothesized that analyzing gene expression associated with suboptimal response would help us to better understand underlying CF pathways and to identify novel potential drug targets. Although not the main motivation for our approach, given medication costs, it will be important to identify patients who are more likely to benefit and those at higher risk of adverse events. Some of the results of this study have been previously reported as an American Thoracic Society International Conference abstract (14).
Methods
Study Population
Participants were recruited from the adult and pediatric Cystic Fibrosis Center at the University of Pittsburgh and the University of Pittsburgh Medical Center Children’s Hospital of Pittsburgh between November 2019 and October 2021. Inclusion criteria were 1) people living with CF (pwCF) who were clinically eligible for ETI treatment on the basis of their CFTR genotype and age and 2) age ≥ 6 years to ensure adequate lung function testing for our analyses. Exclusion criteria were 1) sinus infection or sinus surgery in the previous month and 2) treatment for a CF pulmonary exacerbation in the previous month. The study was approved by the Institutional Review Board at the University of Pittsburgh. Informed consent was obtained from all participants before participation in the study; for participants <18 years of age, consent was obtained from their parents, together with assent from the children as developmentally appropriate. Data extracted from the electronic health record included age and sex, CFTR genotype (homozygous vs. heterozygous), previous use of other CFTR modulators, and clinical characteristics before and after ETI initiation, including FEV1, weight, and body mass index (BMI). Spirometry was obtained in accordance with American Thoracic Society guidelines as part of clinical standard of care, and FEV1 was expressed as percentage of predicted (FEV1%pred) on the basis of Global Lung Function Initiative equations (15).
Clinical Outcomes
We focused on three relevant clinical outcomes: 1) change in FEV1%pred (ΔFEV1), 2) change in year’s best FEV1%pred (ΔybFEV1), and 3) change in BMI (ΔBMI). On the basis of clinical relevance and previous literature, we classified participants into “responders” and “nonresponders” using the following cutoffs: for ΔFEV1 and ΔybFEV1, responders were subjects whose FEV1 improved by ≥5% after the initiation of ETI compared with their pre-ETI baseline, and nonresponders were those whose lung function improved by <5% (including subjects in whom lung function did not improve or declined). For ΔFEV1, we compared the latest stable FEV1%pred (i.e., not taken during a pulmonary exacerbation) before ETI initiation with the first stable FEV1%pred after at least one month of ETI therapy; for ΔybFEV1, we compared the best FEV1 in the 12 months before ETI with the best FEV1 in the year after initiation. For BMI, we defined responders as subjects whose ΔBMI was above the median of the cohort after at least one month of ETI therapy, and nonresponders were those whose ΔBMI was below the median (including subjects whose BMI did not improve or declined).
Nasal Epithelial Samples, RNA Sequencing, and Data Preprocessing
Nasal epithelial samples were collected from the inferior turbinate using a cytology brush, and samples were processed to extract high-quality RNA, following the same protocols we have used in previous studies (16, 17). Baseline nasal samples were obtained for all participants, and follow-up samples were obtained when participants returned to the clinic; the initial plan was to obtain samples and follow-up data 3–6 months after ETI initiation, but because of the coronavirus disease (COVID-19) pandemic, we extended this window to <10 months. Bulk mRNA sequencing was performed at the University of Pittsburgh Medical Center Genome Center, following standard protocols. Library preparation was done using the TruSeq Stranded Total RNA Library Prep Kit with the Ribo-Zero Gold High Throughput Kit (Illumina), which removes both cytoplasmic and mitochondrial ribosomal RNA, according to the manufacturer’s protocol. Libraries were run on the Illumina NextSeq 500 platform, with paired-end 75 cycles and 80 million reads per sample. RNA sequencing (RNA-seq) quality control was conducted using FastQC (18) and summarized with MultiQC (19). All 3′ adapters and low-quality reads were trimmed using Trim Galore! (https://github.com/FelixKrueger/TrimGalore) and Cutadapt (20). Trimmed reads were aligned to the latest human reference genome, hg38, with the STAR RNA-seq aligner (21) and annotated using RSEM (22). Samples with poor overall quality and those with low alignment rates were excluded from analysis. Subsequently, genes with low expression (mean count < 2), low variation (SD of count < 0.1), sex chromosomes, mitochondrial genes, and duplicated genes were all removed from downstream analyses. After quality control, preprocessing, and filtering, a total of 19,550 genes were retained for analysis.
Transcriptome-Wide Differential Gene Expression Analysis
First, we performed a transcriptome-wide analysis on the changes in nasal epithelium gene expression profiles before versus after the initiation of ETI, using a negative binomial regression framework in DESeq2 (23) adjusting for the paired design. Next, to identify transcriptomic biomarkers that predict clinical response to ETI, we analyzed baseline gene expression profiles associated with good response (vs. nonresponse) in lung function and BMI. The transcriptomic analysis for each clinical outcome was performed using DESeq2 and was adjusted for relevant covariates and potential confounders including age, sex, F508del zygosity (homozygous vs. heterozygous), previous use of other CFTR modulators, sample processing protocol, and the baseline measure of each outcome (i.e., baseline FEV1, ybFEV1, or BMI before starting ETI), as a patient’s pre-ETI status might influence how much they improve with treatment. As a sensitivity analysis, given the relatively small size of the cohort, we also evaluated “reduced” models adjusted only for age, sex, and baseline measures. To control for multiple testing, adjusted P values for each gene were calculated using the Benjamin-Hochberg false discovery rate (FDR) procedure (24). No similar cohorts have been described to date, so to further validate our findings, we compared our results with previous reports of blood transcriptomics in response to ivacaftor (25) and ivacaftor/lumacaftor (I/L) (26). Finally, to investigate the underlying biological processes triggered by ETI treatment, we performed pathway enrichment analysis using Ingenuity Pathway Analysis (Qiagen) (27) and string-db protein enrichment analysis (28), including the top differentially expressed genes (DEGs) in each model.
Transcriptome-Wide Prediction Analysis
We constructed transcriptome-wide risk scores using the top 15 genes with the largest positive and the 15 genes with the largest negative fold-change values for each clinical outcome, among all genes whose P values were <0.01 in the transcriptome-wide analyses. These outcome-specific TRSs were calculated as the weighted averages of log2-transformed TPM values, using the log2-transformed fold change as the weight:
where βk is the log2 fold change of selected gene k, and δ = 0.1 is a prespecified offset to avoid numerical null. Among selected genes, upregulated genes had a “preventive” effect on the outcome, whereas the downregulated genes had a “risk” effect on the outcome.
The TRSs were then used to build logistic regression predictive models with age, sex, and the baseline measure of each clinical outcome (e.g., the predictive model for the change in FEV1%pred was ΔFEV1 = TRS + age + sex + baseline FEV1). We evaluated TRS performance using leave-one-out cross-validation and calculated the area under the receiver operating characteristic curve (AUC) and the corresponding performance or confusion matrices. Finally, we performed additional sensitivity analyses using fully adjusted models that included age, sex, the baseline measure of each outcome, F508del zygosity (homozygous vs. heterozygous), previous use of other CFTR modulators, and sample processing protocol.
Results
The main characteristics of the cohort (n = 40) are shown in Table 1. Mean age was 27.7 years (range, 6–64 yr), and 40% of participants were female; 47.5% of participants were F508del homozygous, and 42.5% had previously used other modulators before ETI (11 tezacaftor/ivacaftor, 5 ivacaftor, and 1 lumacaftor/ivacaftor). Median intervals were as follows: 0.5 months (interquartile range [IQR], 0.2–0.93 mo) between baseline samples and ETI initiation; 5.4 months (IQR, 2.8–6.7 mo) between ETI initiation and follow-up outcomes; and, overall, 5.9 months (IQR, 3.2–7.7 mo) between baseline and follow-up measurements. After starting ETI, there was a reduction in the proportion of subjects with cultures growing Pseudomonas or methicillin-resistant Staphylococcus aureus, as well as a nonsignificant reduction in the number of hospitalizations per year (Table 1).
Table 1.
Characteristics of the Study Cohort (n = 40)
| Baseline | On ETI | Change (Δ) | |
|---|---|---|---|
| Age, yr, mean (SD) | 27.7 (15.1) | — | — |
| Age, yr, median (IQR) | 26.5 (15.5–38.5) | — | — |
| Sex, male, n (%) | 24 (60.0) | — | — |
| F508del, n (%) | — | — | |
| Homozygous | 19 (47.5) | ||
| Heterozygous | 21 (52.5) | ||
| Previous modulator, n (%) | — | — | |
| No | 23 (57.5) | ||
| Yes* | 17 (42.5) | ||
| Months from baseline to ETI initiation, median (IQR) | 0.5 (0.2–0.93) | — | — |
| Months on ETI at the time of follow-up, median (IQR) | — | 5.4 (2.8–6.7) | — |
| Hospitalizations for CF, n (%)† | 8 (21.1) | 1 (2.6) | — |
| Culture results, n (%)‡ | |||
| Pseudomonas | 17 (42.5) | 11 (27.5)§ | — |
| MRSA | 17 (42.5) | 13 (32.5)§ | — |
| FEV1%pred, mean (SD) | 78.6 (22.8) | 87.42 (20.9) | 7.9 (8.8)§ |
| ΔFEV1 ≥ 5%, n (%) | — | — | 22 (61.1) |
| Year’s best FEV1%pred, mean (SD) | 85.7 (22.1) | 91.0 (24.3) | 4.1 (10.2)§ |
| ΔybFEV1 ≥ 5%, n (%) | — | — | 19 (50) |
| BMI, kg/m2, mean (SD) | 22.9 (3.4) | 24.07 (4.1) | 1.1 (1.7)§ |
| ΔBMI above median, n (%) | — | — | 18 (48.7) |
Definition of abbreviations: BMI = body mass index; CF = cystic fibrosis; ETI = elexacaftor/tezacaftor/ivacaftor; FEV1 = forced expiratory volume in 1 second; IQR = interquartile range; MRSA = methicillin-resistant Staphylococcus aureus; %pred = percentage of predicted; ybFEV1 = year’s best forced expiratory volume in 1 second.
Bold significance values are indicated P < 0.05.
Previous modulators included Symdeko (Vertex Pharmaceuticals) (n = 11), Orkambi (Vertex Pharmaceuticals) (n = 1), and Kalydeco (Vertex Pharmaceuticals) (n = 5).
Number of subjects with hospitalizations for CF in the 12-month period before or after ETI initiation.
Number of subjects with positive cultures in the 12-month period before or after ETI initiation.
P < 0.01 (paired t test).
Mean baseline FEV1 was 78.6% (range, 41–129%), and mean ybFEV1 was 85.7% (range, 41–137%). After starting ETI treatment, mean ΔFEV1 was 7.9% (SD, 8.8%), and mean ΔybFEV1 was 4.1% (SD, 10.2%) (Table 1). In the cohort, 26 subjects ≥20 years of age had BMI values available for analysis; their mean baseline BMI was 22.9 kg/m2 (range, 16.5–30.1 kg/m2), and mean ΔBMI on ETI was 1.1 kg/m2 (SD, 1.9 kg/m2). Overall, 22 (61.1%) participants were FEV1 responders (i.e., ΔFEV1 ≥ 5% on ETI compared with baseline), 19 (50%) were ybFEV1 responders (ΔybFEV1 ≥ 5%), and 18 (48.7%) were BMI responders (ΔBMI above the median for the cohort). Therefore, 38.9%, 50%, and 51.3%, respectively, were classified as nonresponders. Clinical factors associated with response for each outcome are shown in Table E1 and Figure E1 in the data supplement.
Change in Nasal Epithelial Gene Expression with ETI Treatment
We first performed a paired pre/post analysis with data from subjects who had nasal samples and clinical data both before and 2–12 months after ETI initiation (n = 28). Although principal-component analysis (PCA) showed no clear clustering (Figure 1A), the paired pre/post analysis identified 136 DEGs at an FDR P value <0.05 with |log2 fold-change| > 2.0 (Figure 1B). The top 20 DEGs with FDR P values <0.01 are shown in Table 2, and the full list is included in Table E2. Pathway analysis including all DEGs at an FDR P value <0.05 identified 27 significantly enriched pathways (see Table E3). We did not find clear clustering in the PCA stratified by sex or by prior modulator use (see Figure E2). Top pathways included cytokine storm signaling, IL-12 signaling, and pulmonary fibrosis idiopathic signaling, showing potential biological plausibility to the changes observed in patients with CF receiving ETI treatment. String-db analysis (28) showed enrichment for collagen trimerization, assembly of collagen fibrils, and collagen degradation pathways.
Figure 1.

Change in nasal epithelium gene expression with elexacaftor/tezacaftor/ivacaftor treatment. (A) Top: PCA showing no clear pre/post clustering pattern. Blue, pre; red, post. (B) Bottom: volcano plot showing −log10 (nominal P values) versus log2 (post vs. pre, fold change). Red, |log2 fold-change| > 2 and FDR P < 0.05; blue, FDR P < 0.05 but fold-change less than |log2 fold-change| threshold; green, |log2 fold change| > 2 but P value less than significance threshold. FDR = false discovery rate; PC = principal component; PCA = principal-component analysis.
Table 2.
Top Changes in Nasal Epithelium Gene Expression with Elexacaftor/Tezacaftor/Ivacaftor Treatment
| Gene | Name | Log2FC | P Value | FDR P Value |
|---|---|---|---|---|
| SCN8A | Sodium voltage-gated channel α subunit 8 | −1.173 | 4.44 × 10⁻⁹ | 8.01 × 10⁻⁵ |
| CPVL | Carboxypeptidase vitellogenic like | −1.191 | 1.75 × 10⁻⁸ | 1.33 × 10⁻⁴ |
| GAL3ST4 | Galactose-3-O-sulfotransferase 4 | −0.909 | 2.21 × 10⁻⁸ | 1.33 × 10⁻⁴ |
| MTMR11 | Myotubularin related protein 11 | −0.547 | 9.70 × 10⁻⁷ | 4.38 × 10⁻³ |
| SQSTM1 | Sequestosome 1 | 0.397 | 1.29 × 10⁻⁶ | 4.67 × 10⁻³ |
| COL12A1 | Collagen type XII α 1 chain | −1.024 | 1.64 × 10⁻⁶ | 4.94 × 10⁻³ |
| FCGR1A | Fc fragment of IgG receptor Ia | −1.966 | 2.88 × 10⁻⁶ | 7.43 × 10⁻³ |
| ALKBH1 | AlkB homolog 1, histone H2A dioxygenase | 0.179 | 3.56 × 10⁻⁶ | 8.04 × 10⁻³ |
| COL1A2 | Collagen type I α 2 chain | −2.129 | 4.42 × 10⁻⁶ | 8.87 × 10⁻³ |
| SPG11 | SPG11 vesicle trafficking associated, spatacsin | −0.253 | 5.44 × 10⁻⁶ | 9.82 × 10⁻³ |
| GBGT1 | Globoside α-1,3-N-acetylgalactosaminyltransferase 1 | −0.786 | 6.24 × 10⁻⁶ | 9.92 × 10⁻³ |
| ANKRD20A5P | Ankyrin repeat domain 20 family member A5, pseudogene | −0.962 | 6.60 × 10⁻⁶ | 9.92 × 10⁻³ |
| DCT | Dopachrome tautomerase | −1.789 | 7.6 × 10⁻⁶ | 0.0106 |
| RETREG2 | Reticulophagy regulator family member 2 | 0.149 | 8.8 × 10⁻⁶ | 0.0106 |
| CREB5 | cAMP responsive element binding protein 5 | −1.086 | 9.4 × 10⁻⁶ | 0.0106 |
| FMNL3 | Formin like 3 | −0.596 | 9.4 × 10⁻⁶ | 0.0106 |
| TGFBI | Transforming growth factor β induced | −0.766 | 1.1 × 10⁻⁵ | 0.0111 |
| PMPCA | Peptidase, mitochondrial processing subunit α | 0.135 | 1.3 × 10⁻⁵ | 0.0134 |
| COL6A3 | Collagen type VI α 3 chain | −1.109 | 1.5 × 10⁻⁵ | 0.0138 |
| KNTC1 | Kinetochore associated 1 | −0.256 | 1.6 × 10⁻⁵ | 0.0145 |
Definition of abbreviations: DEG = differentially expressed gene; FDR = false discovery rate; Log2FC = log2 fold change.
Top 20 DEGs from the paired analysis before versus after the initiation of elexacaftor/tezacaftor/ivacaftor treatment. Table E1 shows all 136 DEGs at FDR P < 0.05.
Analysis of Differential Gene Expression Associated with ETI Clinical Response
We then evaluated baseline (pre-ETI) gene expression profiles associated with clinical response to ETI treatment (Figure 2). At a nominal P value <0.01, we found 223 genes whose expression was associated with FEV1 response, 376 DEGs for ybFEV1 response, and 265 DEGs for BMI response (see Table E4). Among those, we identified three DEGs associated with FEV1 response at an FDR P value <0.05 (RNU1-2, ACTRT3, and NFATC3), two DEGs associated with ybFEV1 response (GPRC6A and VCAM1), and six DEGs associated with BMI response (PADI6, loc100996517, loc102723584, EVC2, VPREB3, and FAM124A) (Table 3). In the sensitivity analysis using a reduced model (see Table E5), there were 262, 185, and 363 DEGs associated with ΔFEV1, ΔybFEV1, and ΔBMI, respectively, at a nominal P value <0.01, including 4 DEGs associated with ΔFEV1 at an FDR P value <0.05 (RNU1-2, ELOVL3, ACTRT3, and C10orf105) and four for ΔBMI (GOLGA6L1, LINC00668, VPREB3, and GPRC6A).
Figure 2.
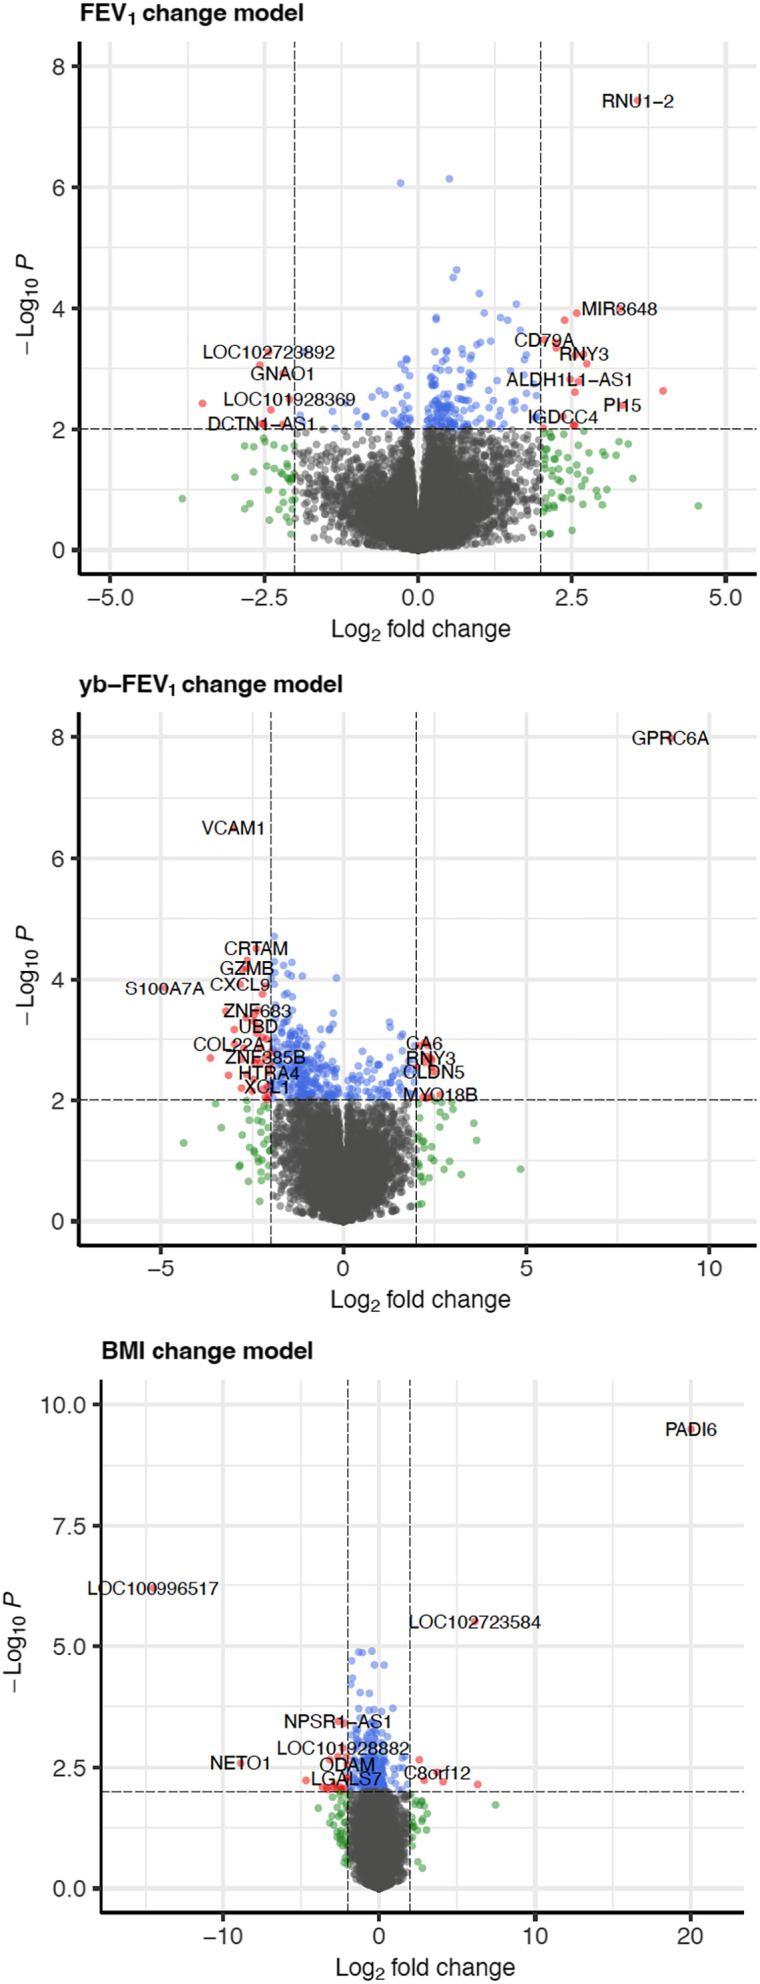
Baseline nasal epithelium gene expression associated with elexacaftor/tezacaftor/ivacaftor clinical response. Volcano plots showing −log10 (nominal P values) versus log2 (post/pre, fold change) for forced expiratory volume in 1 second (FEV1) percentage predicted (top), yb-FEV1 percentage predicted (middle), and BMI (bottom). Notice the different axis scales for each outcome. Red, |log2 fold-change| > 2 and P < 0.01; blue, P < 0.05 but fold change less than |log2 fold-change| threshold; green, |log2 fold change| > 2 but P value less than significance threshold. BMI = body mass index; yb-FEV1 = year’s best forced expiratory volume in 1 second.
Table 3.
Top Baseline Differentially Expressed Genes Associated with Elexacaftor/Tezacaftor/Ivacaftor Response
| Gene | Name | Log2FC | P Value | FDR P Value |
|---|---|---|---|---|
| FEV1 improvement ≥5% on ETI treatment | ||||
| RNU1-2 | RNA, U1 small nuclear 2 | 3.57 | 3.65 × 10⁻⁸ | 7.13 × 10⁻⁴ |
| ACTRT3 | Actin-related protein T3 | 0.509 | 7.25 × 10⁻⁷ | 5.54 × 10⁻³ |
| NFATC3 | Nuclear factor of activated T cells 3 | −0.282 | 8.50 × 10⁻⁷ | 5.54 × 10⁻³ |
| CLDN15 | Claudin 15 | 0.628 | 2.32 × 10⁻⁵ | 1.13 × 10⁻¹ |
| KLHL17 | Kelch like family member 17 | 0.571 | 3.11 × 10⁻⁵ | 1.21 × 10⁻¹ |
| LOC729732 | — | 0.997 | 5.73 × 10⁻⁵ | 1.87 × 10⁻¹ |
| LOC102724192 | — | 1.598 | 8.54 × 10⁻⁵ | 2.06 × 10⁻¹ |
| MIR3648 | MicroRNA 3648 | 3.275 | 1.03 × 10⁻⁴ | 2.06 × 10⁻¹ |
| BREA2 | Breast cancer estrogen-induced apoptosis 2 | 1.076 | 1.20 × 10⁻⁴ | 2.06 × 10⁻¹ |
| ELOVL3 | ELOVL fatty acid elongase 3 | 2.581 | 1.21 × 10⁻⁴ | 2.06 × 10⁻¹ |
| ybFEV1 improvement ≥5% on ETI treatment | ||||
| GPRC6A | G protein–coupled receptor class C group 6 member A | 8.945 | 1.05 × 10⁻⁸ | 2.06 × 10⁻⁴ |
| VCAM1 | Vascular cell adhesion molecule 1 | −3.014 | 3.19 × 10⁻⁷ | 3.12 × 10⁻³ |
| DLGAP1-AS5 | DLGAP1 antisense RNA 5 | −1.909 | 1.95 × 10⁻⁵ | 1.15 × 10⁻¹ |
| CRTAM | Cytotoxic and regulatory T-cell molecule | −2.399 | 3.08 × 10⁻⁵ | 1.15 × 10⁻¹ |
| GZMH | Granzyme H | −2.646 | 4.82 × 10⁻⁵ | 1.15 × 10⁻¹ |
| CD8A | CD8a molecule | −1.907 | 5.04 × 10⁻⁵ | 1.15 × 10⁻¹ |
| MFNG | MFNG O-fucosylpeptide 3-β-N-acetylglucosaminyltransferase | −1.428 | 5.20 × 10⁻⁵ | 1.15 × 10⁻¹ |
| SH2D2A | SH2 domain containing 2A | −1.652 | 5.82 × 10⁻⁵ | 1.15 × 10⁻¹ |
| GZMB | Granzyme B | −2.65 | 6.51 × 10⁻⁵ | 1.15 × 10⁻¹ |
| KLRC3 | Killer cell lectin like receptor C3 | −2.777 | 6.81 × 10⁻⁵ | 1.15 × 10⁻¹ |
| BMI improvement above the median on ETI treatment | ||||
| PADI6 | Peptidyl arginine deiminase 6 | 20.04 | 3.22 × 10⁻¹⁰ | 6.29 × 10⁻⁶ |
| LOC100996517 | Vesicle-trafficking protein SEC22b | −14.508 | 6.37 × 10⁻⁷ | 6.23 × 10⁻³ |
| LOC102723584 | Cell division cycle protein 27 homolog | 6.132 | 3.11 × 10⁻⁶ | 2.02 × 10⁻² |
| EVC2 | EvC ciliary complex subunit 2 | −0.458 | 1.28 × 10⁻⁵ | 4.45 × 10⁻² |
| VPREB3 | V-set pre–B-cell surrogate light chain 3 | −1.309 | 1.33 × 10⁻⁵ | 4.45 × 10⁻² |
| FAM124A | Family with sequence similarity 124 member A | −1.072 | 1.37 × 10⁻⁵ | 4.45 × 10⁻² |
| CLDN11 | Claudin 11 | −1.756 | 2.02 × 10⁻⁵ | 5.38 × 10⁻² |
| CPQ | Carboxypeptidase Q | −0.3 | 2.46 × 10⁻⁵ | 5.38 × 10⁻² |
| IFNAR2 | IFN α and β receptor subunit 2 | 0.32 | 2.47 × 10⁻⁵ | 5.38 × 10⁻² |
| ADAMTS19 | ADAM metallopeptidase with thrombospondin type 1 motif 19 | −1.714 | 4.58 × 10⁻⁵ | 8.96 × 10⁻² |
Table shows the top 10 DEGs for each clinical outcome, including those significant at FDR P < 0.05. Table E4 shows all DEGs at a nominal P value <0.01.
Bold significance values are indicated P < 0.05.
As with the pre/post analysis, we performed pathway analyses for each of the clinical outcomes (see Table E6). For ΔFEV1, the most relevant enriched pathways at an FDR P value <0.05 included neuregulin signaling, natural killer (NK) cell signaling, and PI3K/AKT signaling. Among pathways significantly enriched in our ΔybFEV1 model, several immune response–related pathways appear at the top, including the pathogen-induced cytokine storm pathways, the T-helper cell type 1 (Th1) and Th2 activation pathway, Th1, and Th2 activation pathway, NK cell, and IL-10 signaling. Similarly, string-db analysis of the top genes in Table 3 showed significant enrichment for pathways, including mixed antigen recognition proteins and NK cell regulation.
Predicting Clinical Response to ETI
Our main goal was to evaluate the clinical utility of the nasal transcriptome as a predictive biomarker for treatment response in CF. We thus constructed TRSs using the genes with the highest and lowest fold-change differential expression for each clinical outcome (see Table E7). Clinical prediction models using age, sex, and baseline (pre-ETI) values of the corresponding clinical measures (e.g., baseline FEV1, ybFEV1, or BMI), but without our TRS, achieved AUCs of 0.41 for ΔFEV1, 0.51 for ΔybFEV1, and 0.46 for ΔBMI (Figure 3). When the respective TRSs were added to those models, the AUCs increased significantly to 0.88 for ΔFEV1, 0.88 for ΔybFEV1, and 0.92 for ΔBMI (Figure 3). Similarly, classification performance markedly improved with the addition of the TRS: overall accuracy of the models to identify patients who would have good clinical response in FEV1 improved from 56% to 83%, from 61% to 87% for ybFEV1 response, and from 43% to 86% for BMI response (Figure 3). Prediction accuracy for the three outcomes increased on average by ∼1.64-fold by adding the TRS, from ∼53% to ∼85%. PCA for the TRS genes showed good separation between responders and nonresponders for each clinical outcome (see Figure E3). Fully adjusted predictive models yielded similar accuracy improvements, with average accuracy increasing from ∼55% to ∼85% (see Figure E4).
Figure 3.
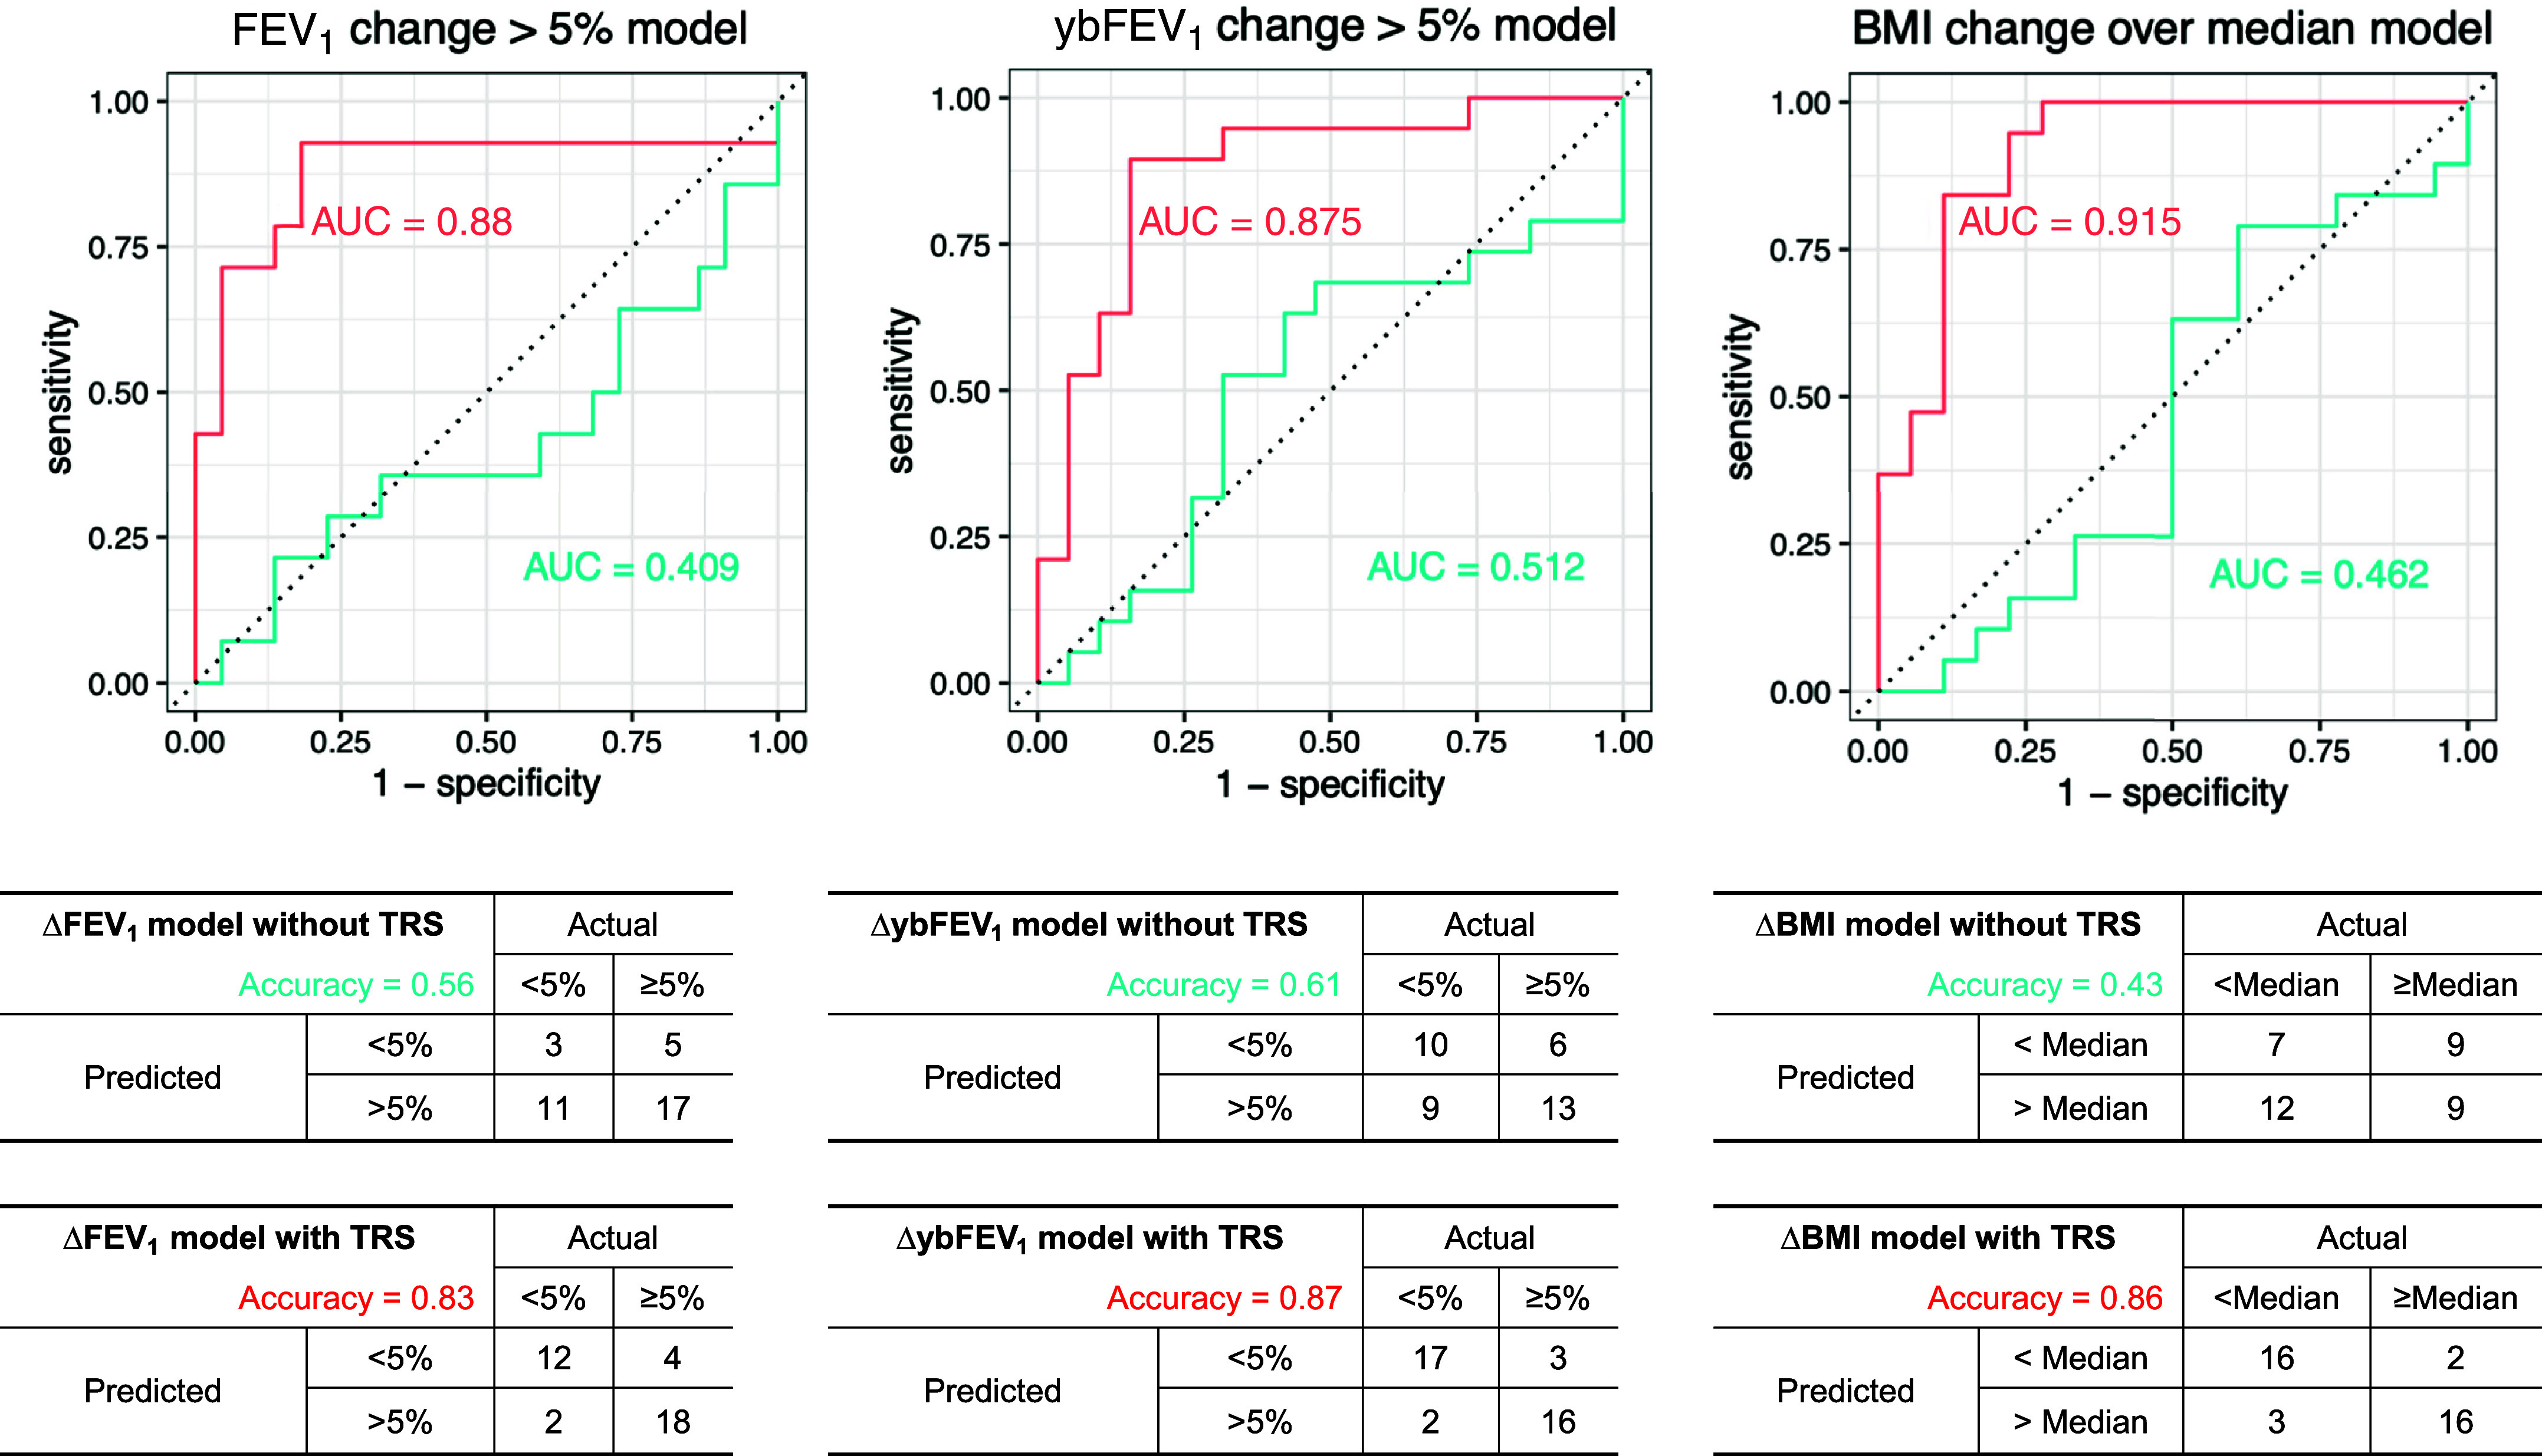
Performance of the nasal epithelium transcriptomic risk score (TRS) for the prediction of ETI clinical response. Top: area under the receiver operating characteristic curve (AUC) for models including age, sex, and pre-ETI clinical measures (blue) or with the addition of the TRS (red): the AUC improves to 0.88 for change in FEV1 (ΔFEV1), 0.88 for change in year’s best FEV1 (ΔybFEV1), and 0.92 for change in BMI (ΔBMI). Bottom: performance or confusion matrices for each outcome, showing improvement of classification accuracy from 56% to 83% for ΔFEV1, from 61% to 87% for ΔybFEV1, and from 43% to 86% for ΔBMI. ETI = elexacaftor/tezacaftor/ivacaftor.
Comparison with Previously Reported Differential Gene Expression with CFTR Modulators
Sun and colleagues (25) previously evaluated gene expression changes in blood in response to ivacaftor, reporting 102 DEGs in peripheral blood mononuclear cells (PBMCs) before versus after ivacaftor treatment. Of those, 19 were in our list of 136 pre/post DEGs with nominal P values <0.05 and the same effect direction in our pre/post ETI analysis in nasal epithelium, corresponding to an overlap of 18.6% (19 of 102) of their PBMC DEGs or 13.9% (19 of 136) of our nasal DEGs. Sun and colleagues also reported 4,219 DEGs in PBMCs associated with clinical response to ivacaftor, defined on the basis of composite changes in FEV1, BMI, and symptom scores. Of those 4,219 DEGs, we found 75, 102, and 78 genes that had nominal P values <0.05 and the same effect direction in our respective analyses of ΔFEV1, ΔybFEV1, and ΔBMI (only ∼6% overlap between the DEGs in the two studies). Potentially relevant common genes included TLR4 (Toll-like receptor 4) and IL10.
Similarly, there was little overlap between our results and those reported by Kopp and colleagues (26), who evaluated gene expression changes in blood in response to I/L in a cohort of 20 pwCF. Kopp and colleagues reported 104 DEGs in blood before versus after I/L initiation; of those, none overlapped with our pre/post ETI analysis in nasal epithelium, and only one gene overlapped with our list of DEGs associated with clinical outcomes (TTN, associated with ΔybFEV1). Kopp and colleagues also compared pwCF on I/L versus non-CF control subjects and reported 191 DEGs; of those, 1 gene (LMNB1) was on our list of DEGs pre/post ETI, 3 genes (KCNG2, ANO9, and RECQL4) were on our list of DEGs associated with ΔFEV1, 4 genes (IFNG, FCRL6, ITGA1, and CST7) were on our list for ΔybFEV1, and 3 genes (MARC1, TLR5, and SLC22A17) were on our list for ΔBMI. Finally, Kopp and colleagues reported five DEGs associated (at FDR P < 0.10) with clinical response on I/L; overlap with our results included only one gene (SAP25, associated with ΔFEV1 and ΔBMI in our analysis).
Discussion
In this prospective cohort analysis, we report significant differences in nasal epithelial gene expression after ETI initiation, compared with pre-ETI baseline expression. Furthermore, we build TRSs that serve as significant predictive biomarkers, markedly improving accuracy in identifying pwCF whose lung function and nutritional status went on to improve after the initiation of ETI. To our knowledge, this is the first such report of transcriptome-wide predictive biomarkers for ETI clinical response in CF.
Various studies have reported factors associated with ETI efficacy, such as age, sex, CFTR genotype or F508del zygosity, prior modulator use, and baseline lung function (9, 12, 29). Our initial analysis using those factors was only modestly accurate in identifying individuals in our cohort who would go on to have good versus poor response. For FEV1, accuracy ranged from 56% in the reduced model to 67% in the full model; when we incorporated the TRS, these increased to 83% and 97%, respectively. Our fully adjusted TRS model accurately predicted FEV1 response in 35 of 36 participants. Similarly, our TRS models were able to accurately predict ybFEV1 response in 87% of subjects and BMI response in 86%. Improving prediction accuracy in clinical practice could have important implications: patients predicted to have reduced response to ETI could consider initiating a different modulator (or remaining in their current one), as well as simultaneously increasing other therapies. On the other hand, prediction of poor response might rebalance the decision-making process in patients who are experiencing more significant treatment side effects. If validated, extending this approach to other and new CFTR modulators could eventually help clinicians decide which therapies to try for specific patients or identify candidates for inclusion in trials of new therapies.
In our cohort, average increase in FEV1 after five months on ETI was ∼8%, and ∼39% of participants were nonresponders. This range of ΔFEV1 is comparable with other real-world analyses (9), such as the U.S. Cystic Fibrosis Foundation Registry or the RECOVER (Real World Clinical Outcomes With Novel Modulator Therapy Combinations in People With CF) study in the United Kingdom and Ireland, which reported average ΔFEV1 of ∼9% after 6–12 months of ETI (30, 31). Using the same cutoff of ΔFEV1 ≥ 5%, a recent study in individuals with advanced CF lung disease reported that 36% were nonresponders (11). On the other hand, a recent meta-analysis reported mean improvements in FEV1 of 9.2% at 4 weeks and 12.5% after 24 weeks, although those estimates pooled the results from observational studies with those from randomized controlled trials (32). In terms of nutritional outcomes, median ΔBMI in our sample was 1.1 kg/m2, comparable with improvements described by others (12, 29, 31, 32). Although many pwCF on ETI achieve meaningful weight gains, in up to half of them, weight changes can be minor, while 5–15% might even become overweight (12). These and other reports highlight the variability in efficacy and therefore the importance of identifying pwCF who are more (or less) likely to respond.
Our analyses identified several biologically plausible genes. Among genes present in most of the models, PAPP-A in sputum has been associated with eosinophilic asthma and chronic obstructive pulmonary disease (33, 34). Pathways from the pre/post analysis include neutrophil extracellular trap signaling, chemokine signaling, IL-12 signaling, and collagen metabolism. Pathways from the clinical response models include NK cell signaling, PI3K/AKT and NF-κB activation, several Th1 and Th2 immune pathways, IL-4 and IL-10 signaling, and others. A recent single-cell RNA-seq study in 13 children before and after starting ETI (35) identified several genes that were also significant in our different models, mainly for ΔFEV1 and ΔybFEV1. Such genes included STAT1, IRF1, GBP1, GBP4, IFIT3, IFI6, IFITM1, and ISG15, which were reported by Loske and colleagues to be associated with pathogen sensing and IFN responses, driven mostly by ciliated respiratory cells, goblet cells, and club cells when comparing ETI with baseline (35). Similarly, IL1B, IL1R2, STAT1, CCL3, CCL4, and CXCL2 were significant in our models and were reported by Loske and colleagues to drive IL-1 response in macrophages and neutrophils in children with CF on ETI compared with baseline.
When we compared our DEGs in nasal epithelium with those reported by Sun and colleagues when analyzing PBMC transcriptomics in response to ivacaftor (25), we found CF modifier genes in common, such as TLR4 and IL10, but otherwise, there was little gene overlap. We also found very few results in common with Kopp and colleagues (26), who evaluated PBMC transcriptomics in response to I/L, although several overlapping DEGs might be biologically relevant (e.g., KCNG2, ANO9, IFNG, FCRL6, CST7, TLR5). These differences should of course be interpreted cautiously, given the different CFTR modulators and definitions of “response,” but they suggest a role for incorporating biomarkers from different tissues. Future studies should investigate the value of “multimodal multitissue” omics analysis, incorporating for instance both respiratory and blood transcriptomics to determine whether this approach further improves prediction accuracy or target identification. Furthermore, future studies using sweat chloride changes to define a more “proximal” response to ETI would allow us to elucidate whether these findings are more closely related to direct changes in CFTR function or also encompass other pathways and factors that contribute to clinical disease outcomes.
The present study has several strengths. Our prospective cohort included both children and adults living with CF, as well as a broad phenotypic variation, with baseline FEV1 ranging from ∼40% to ∼130% and BMI categories ranging from underweight to overweight. We obtained high-quality RNA-seq data from respiratory epithelium cells, following protocols we have successfully used in large-scale studies of asthma and atopy (16, 36). We used both recent stable FEV1 and ybFEV1 to ensure that our approach was robust to the timing of the phenotype measurements. Finally, the predictive performance and accuracy of our TRS were comparable using both simplified models and models adjusted for several potential confounders, including F508del zygosity and previous modulator use.
At the same time, we acknowledge several limitations. Many eligible patients started Trikafta within the first year of the COVID-19 pandemic, hindering our ability to recruit patients, obtain samples, and gather baseline and follow-up information on a larger cohort. Because of the unique nature of the cohort and the transcriptomic data needed, we lack external replication to validate our findings. However, we used statistical cross-validation to reduce overfitting and minimize estimate bias. Given budget and other restrictions, we lacked healthy control subjects, disease control subjects (e.g., non-CF, such as asthma), and drug control subjects (i.e., pwCF not taking ETI). As ETI is now approved for patients ≥2 years of age, future replication studies should include younger children. The goal of our analysis was to identify transcriptomic biomarkers that could be useful in clinical practice; although elucidating underlying mechanisms is beyond the scope of our study, future research could pursue experimental validation of the reported genes to assess potential underlying mechanisms. Finally, the analysis was based on a single-center cohort, although mean ΔFEV1 and ΔBMI suggest that changes are representative of what others have reported.
Conclusions
Using transcriptome-wide data from nasal respiratory epithelium, we were identified biomarkers that were accurate predictors of ETI clinical effectiveness. If validated, this approach could help understand the mechanism for heterogeneous responses and aid clinical decision making in pwCF. Future research should focus on independent validation of our TRS and on experimental interrogation of potential underlying mechanisms.
Supplemental Materials
Footnotes
Supported with funds from the Department of Pediatrics at the University of Pittsburgh and University of Pittsburgh Medical Center Children’s Hospital of Pittsburgh and in part by National Heart, Lung, and Blood Institute grant HL149693 (E.F.). Research coordinator effort was supported in part by a Cystic Fibrosis Foundation Research Development Program grant to the University of Pittsburgh. The funding agencies had no role in the design or execution of the study, the writing of the report, or the decision to submit the manuscript for publication.
Author Contributions: E.F., W.C., and D.J.W. contributed to the study conception and design; M.Y., D.J.W., C.M.Q., M.L.M., M.M.M., J.M.P., and J.C.C. contributed to the data acquisition or analysis or the interpretation of the study results; M.Y. and E.F. drafted the initial version of the manuscript; and all authors revised the manuscript critically for important intellectual content. All authors approved the final version of the manuscript submitted for publication.
This article has a data supplement, which is accessible at the Supplements tab.
Originally Published in Press as DOI: 10.1165/rcmb.2024-0103OC on July 19, 2024
Author disclosures are available with the text of this article at www.atsjournals.org.
References
- 1. Sharma N, Cutting GR. The genetics and genomics of cystic fibrosis. J Cyst Fibros . 2019;19:S5–S9. doi: 10.1016/j.jcf.2019.11.003. [DOI] [PMC free article] [PubMed] [Google Scholar]
- 2. O’Neal WK, Knowles MR. Cystic fibrosis disease modifiers: complex genetics defines the phenotypic diversity in a monogenic disease. Annu Rev Genomics Hum Genet . 2018;19:201–222. doi: 10.1146/annurev-genom-083117-021329. [DOI] [PubMed] [Google Scholar]
- 3. Vanscoy LL, Blackman SM, Collaco JM, Bowers A, Lai T, Naughton K, et al. Heritability of lung disease severity in cystic fibrosis. Am J Respir Crit Care Med . 2007;175:1036–1043. doi: 10.1164/rccm.200608-1164OC. [DOI] [PMC free article] [PubMed] [Google Scholar]
- 4. Bradley GM, Blackman SM, Watson CP, Doshi VK, Cutting GR. Genetic modifiers of nutritional status in cystic fibrosis. Am J Clin Nutr . 2012;96:1299–1308. doi: 10.3945/ajcn.112.043406. [DOI] [PMC free article] [PubMed] [Google Scholar]
- 5. Blackman SM, Hsu S, Vanscoy LL, Collaco JM, Ritter SE, Naughton K, et al. Genetic modifiers play a substantial role in diabetes complicating cystic fibrosis. J Clin Endocrinol Metab . 2009;94:1302–1309. doi: 10.1210/jc.2008-2186. [DOI] [PMC free article] [PubMed] [Google Scholar]
- 6. Green DM, Collaco JM, McDougal KE, Naughton KM, Blackman SM, Cutting GR. Heritability of respiratory infection with Pseudomonas aeruginosa in cystic fibrosis. J Pediatr . 2012;161:290–295.e1. doi: 10.1016/j.jpeds.2012.01.042. [DOI] [PMC free article] [PubMed] [Google Scholar]
- 7. Middleton PG, Mall MA, Dřevínek P, Lands LC, McKone EF, Polineni D, et al. VX17-445-102 Study Group Elexacaftor-tezacaftor-ivacaftor for cystic fibrosis with a single Phe508del allele. N Engl J Med . 2019;381:1809–1819. doi: 10.1056/NEJMoa1908639. [DOI] [PMC free article] [PubMed] [Google Scholar]
- 8. Heijerman HGM, McKone EF, Downey DG, Van Braeckel E, Rowe SM, Tullis E, et al. VX17-445-103 Trial Group Efficacy and safety of the elexacaftor plus tezacaftor plus ivacaftor combination regimen in people with cystic fibrosis homozygous for the F508del mutation: a double-blind, randomised, phase 3 trial. Lancet . 2019;394:1940–1948. doi: 10.1016/S0140-6736(19)32597-8. [DOI] [PMC free article] [PubMed] [Google Scholar]
- 9. Schutz K, Pallenberg ST, Kontsendorn J, DeLuca D, Sukdolak C, Minso R, et al. Spirometric and anthropometric improvements in response to elexacaftor/tezacaftor/ivacaftor depending on age and lung disease severity. Front Pharmacol . 2023;14:1171544. doi: 10.3389/fphar.2023.1171544. [DOI] [PMC free article] [PubMed] [Google Scholar]
- 10. Bermingham B, Rueschhoff A, Ratti G, Nesmith A, Goodwin D, Gray S, et al. Short-term effect of elexacaftor-tezacaftor-ivacaftor on lung function and transplant planning in cystic fibrosis patients with advanced lung disease. J Cyst Fibros . 2021;20:768–771. doi: 10.1016/j.jcf.2021.05.009. [DOI] [PubMed] [Google Scholar]
- 11. Djavid AR, Thompson AE, Irace AL, Gusman E, Altman K, DiMango EA, et al. Efficacy of elexacaftor/tezacaftor/ivacaftor in advanced cystic fibrosis lung disease. Ann Am Thorac Soc . 2021;18:1924–1927. doi: 10.1513/AnnalsATS.202102-220RL. [DOI] [PubMed] [Google Scholar]
- 12. Gramegna A, Majo F, Alicandro G, Leonardi G, Cristiani L, Amati F, et al. Heterogeneity of weight gain after initiation of elexacaftor/tezacaftor/ivacaftor in people with cystic fibrosis. Respir Res . 2023;24:164. doi: 10.1186/s12931-023-02451-0. [DOI] [PMC free article] [PubMed] [Google Scholar]
- 13. Causer AJ, Shute JK, Cummings MH, Shepherd AI, Wallbanks SR, Pulsford RM, et al. Elexacaftor-tezacaftor-ivacaftor improves exercise capacity in adolescents with cystic fibrosis. Pediatr Pulmonol . 2022;57:2652–2658. doi: 10.1002/ppul.26078. [DOI] [PMC free article] [PubMed] [Google Scholar]
- 14. Yue M, Weiner DJ, Rosser F, Gaietto K, Myerburg MM, Pilewski JM, et al. Transcriptomic prediction of clinical response to Trikafta in patients with cystic fibrosis [abstract] Am J Respir Crit Care Med . 2023;207:A6093. [Google Scholar]
- 15. Quanjer PH, Stanojevic S, Cole TJ, Baur X, Hall GL, Culver BH, et al. ERS Global Lung Function Initiative Multi-ethnic reference values for spirometry for the 3-95-yr age range: the global lung function 2012 equations. Eur Respir J . 2012;40:1324–1343. doi: 10.1183/09031936.00080312. [DOI] [PMC free article] [PubMed] [Google Scholar]
- 16. Forno E, Zhang R, Jiang Y, Kim S, Yan Q, Ren Z, et al. Transcriptome-wide and differential expression network analyses of childhood asthma in nasal epithelium. J Allergy Clin Immunol . 2020;146:671–675. doi: 10.1016/j.jaci.2020.02.005. [DOI] [PMC free article] [PubMed] [Google Scholar]
- 17. Xu Z, Forno E, Acosta-Perez E, Han YY, Rosser F, Manni ML, et al. Differential gene expression in nasal airway epithelium from overweight or obese youth with asthma. Pediatr Allergy Immunol . 2022;33:e13776. doi: 10.1111/pai.13776. [DOI] [PMC free article] [PubMed] [Google Scholar]
- 18.Babraham Bioinformatics. Cambridge, UK: Babraham Bioinformatics; 2019. FastQC: a quality control tool for high throughput sequence data.http://www.bioinformatics.babraham.ac.uk/projects/fastqc [Google Scholar]
- 19. Ewels P, Magnusson M, Lundin S, Kaller M. MultiQC: summarize analysis results for multiple tools and samples in a single report. Bioinformatics . 2016;32:3047–3048. doi: 10.1093/bioinformatics/btw354. [DOI] [PMC free article] [PubMed] [Google Scholar]
- 20. Martin M. Cutadapt removes adapter sequences from high-throughput sequencing reads. EMBnet J . 2011;17:3. [Google Scholar]
- 21. Dobin A, Davis CA, Schlesinger F, Drenkow J, Zaleski C, Jha S, et al. STAR: ultrafast universal RNA-seq aligner. Bioinformatics . 2013;29:15–21. doi: 10.1093/bioinformatics/bts635. [DOI] [PMC free article] [PubMed] [Google Scholar]
- 22. Li B, Dewey CN. RSEM: accurate transcript quantification from RNA-seq data with or without a reference genome. BMC Bioinformatics . 2011;12:323. doi: 10.1186/1471-2105-12-323. [DOI] [PMC free article] [PubMed] [Google Scholar]
- 23. Love MI, Huber W, Anders S. Moderated estimation of fold change and dispersion for RNA-seq data with DESeq2. Genome Biol . 2014;15:550. doi: 10.1186/s13059-014-0550-8. [DOI] [PMC free article] [PubMed] [Google Scholar]
- 24. Benjamini Y, Hochberg Y. Controlling the false discovery rate: a practical and powerful approach to multiple testing. J R Stat Soc B . 1995;57:289–300. [Google Scholar]
- 25. Sun T, Sun Z, Jiang Y, Ferguson AA, Pilewski JM, Kolls JK, et al. Transcriptomic responses to ivacaftor and prediction of ivacaftor clinical responsiveness. Am J Respir Cell Mol Biol . 2019;61:643–652. doi: 10.1165/rcmb.2019-0032OC. [DOI] [PMC free article] [PubMed] [Google Scholar]
- 26. Kopp BT, Fitch J, Jaramillo L, Shrestha CL, Robledo-Avila F, Zhang S, et al. Whole-blood transcriptomic responses to lumacaftor/ivacaftor therapy in cystic fibrosis. J Cyst Fibros . 2020;19:245–254. doi: 10.1016/j.jcf.2019.08.021. [DOI] [PMC free article] [PubMed] [Google Scholar]
- 27. Kramer A, Green J, Pollard J, Jr, Tugendreich S. Causal analysis approaches in Ingenuity Pathway Analysis. Bioinformatics . 2014;30:523–530. doi: 10.1093/bioinformatics/btt703. [DOI] [PMC free article] [PubMed] [Google Scholar]
- 28. Szklarczyk D, Gable AL, Lyon D, Junge A, Wyder S, Huerta-Cepas J, et al. STRING v11: protein-protein association networks with increased coverage, supporting functional discovery in genome-wide experimental datasets. Nucleic Acids Res . 2019;47:D607–D613. doi: 10.1093/nar/gky1131. [DOI] [PMC free article] [PubMed] [Google Scholar]
- 29. Sutharsan S, Dillenhoefer S, Welsner M, Stehling F, Brinkmann F, Burkhart M, et al. German CF Registry of the Mukoviszidose e.V. and Participating CF Sites Impact of elexacaftor/tezacaftor/ivacaftor on lung function, nutritional status, pulmonary exacerbation frequency and sweat chloride in people with cystic fibrosis: real-world evidence from the German CF Registry. Lancet Reg Health Eur . 2023;32:100690. doi: 10.1016/j.lanepe.2023.100690. [DOI] [PMC free article] [PubMed] [Google Scholar]
- 30. McNally P, Lester K, Stone G, Elnazir B, Williamson M, Cox D, et al. RECOVER Study Group Improvement in lung clearance index and chest computed tomography scores with elexacaftor/tezacaftor/ivacaftor treatment in people with cystic fibrosis aged 12 years and older—the RECOVER trial. Am J Respir Crit Care Med . 2023;208:917–929. doi: 10.1164/rccm.202308-1317OC. [DOI] [PubMed] [Google Scholar]
- 31. Bower JK, Volkova N, Ahluwalia N, Sahota G, Xuan F, Chin A, et al. Real-world safety and effectiveness of elexacaftor/tezacaftor/ivacaftor in people with cystic fibrosis: interim results of a long-term registry-based study. J Cyst Fibros . 2023;22:730–737. doi: 10.1016/j.jcf.2023.03.002. [DOI] [PubMed] [Google Scholar]
- 32. Xu W, Wu T, Zhou Z, Zuo Z. Efficacy and safety profile of elexacaftor-tezacaftor-ivacaftor triple therapy on cystic fibrosis: a systematic review and single arm meta-analysis. Front Pharmacol . 2023;14:1275470. doi: 10.3389/fphar.2023.1275470. [DOI] [PMC free article] [PubMed] [Google Scholar]
- 33. Bulut I, Ozseker ZF, Coskun A, Serteser M, Unsal I. Pregnancy-associated plasma protein-A (PAPP-A) levels in patients with severe allergic asthma are reduced by omalizumab. J Asthma . 2018;55:1116–1121. doi: 10.1080/02770903.2017.1396471. [DOI] [PubMed] [Google Scholar]
- 34. Asamoah K, Chung KF, Zounemat Kermani N, Bodinier B, Dahlen SE, Djukanovic R, et al. U-BIOPRED Study Group Proteomic signatures of eosinophilic and neutrophilic asthma from serum and sputum. EBioMedicine . 2024;99:104936. doi: 10.1016/j.ebiom.2023.104936. [DOI] [PMC free article] [PubMed] [Google Scholar]
- 35. Loske J, Voller M, Lukassen S, Stahl M, Thurmann L, Seegebarth A, et al. Pharmacological improvement of CFTR function rescues airway epithelial homeostasis and host defense in children with cystic fibrosis. Am J Respir Crit Care Med . 2024;209:1338–1350. doi: 10.1164/rccm.202310-1836OC. [DOI] [PMC free article] [PubMed] [Google Scholar]
- 36. Forno E, Wang T, Qi C, Yan Q, Xu CJ, Boutaoui N, et al. DNA methylation in nasal epithelium, atopy, and atopic asthma in children: a genome-wide study. Lancet Respir Med . 2019;7:336–346. doi: 10.1016/S2213-2600(18)30466-1. [DOI] [PMC free article] [PubMed] [Google Scholar]
Associated Data
This section collects any data citations, data availability statements, or supplementary materials included in this article.