

Abstract
Fetal membrane (amniochorion), the innermost lining of the intrauterine cavity, surround the fetus and enclose amniotic fluid. Unlike unidirectional blood flow, amniotic fluid subtly rocks back and forth, and thus, the innermost amnion epithelial cells are continuously exposed to low levels of shear stress from fluid undulation. Here, we tested the impact of fluid motion on amnion epithelial cells (AECs) as a bearer of force impact and their potential vulnerability to cytopathologic changes that can destabilize fetal membrane functions. A previously developed amnion membrane (AM) organ-on-chip (OOC) was utilized but with dynamic flow to culture human fetal amnion membrane cells. The applied flow was modulated to perfuse culture media back and forth for 48 hours to mimic fluid motion. A static culture condition was used as a negative control, and oxidative stress (OS) condition was used as a positive control representing pathophysiological changes. The impacts of fluidic motion were evaluated by measuring cell viability, cellular transition, and inflammation. Additionally, scanning electron microscopy (SEM) imaging was performed to observe microvilli formation. The results show that regardless of the applied flow rate, AECs and AMCs maintained their viability, morphology, innate meta-state, and low production of pro-inflammatory cytokines. E-cadherin expression and microvilli formation in the AECs were upregulated in a flow rate-dependent fashion; however, this did not impact cellular morphology or cellular transition or inflammation. OS treatment induced a mesenchymal morphology, significantly higher vimentin to cytokeratin 18 (CK-18) ratio, and pro-inflammatory cytokine production in AECs, whereas AMCs did not respond in any significant manner. Fluid motion and shear stress, if any, did not impact AEC cell function and did not cause inflammation. Thus, when using an amnion membrane OOC model, the inclusion of a dynamic flow environment is not necessary to mimic in utero physiologic cellular conditions of an amnion membrane.
Keywords: Fetal membrane, amniotic fluid, shear stress, microphysiological system, organ-on-chip, preterm birth, dynamic flow cell culture
Graphical Abstract

1. Introduction
Human fetal membrane (amniochorion) lines the intra-amniotic cavity during pregnancy (Menon, Richardson et al. 2019). This membrane is composed of chorion trophoblast cells, amnion mesenchymal cells, and amnion epithelial cells, and plays a significant role in maintaining pregnancy and fetal development (Menon, Richardson et al. 2019, Richardson, Kim et al. 2020). The fetal membrane surrounds the fetus, encloses amniotic fluid, and protects the fetus during gestation from mechanical and pathological alterations, such as stress, stretch, infection, and inflammation (Manabe, Himeno et al. 1991, Verbruggen, Oyen et al. 2017). The amniotic fluid bathes the innermost amnion epithelial layer and is a shock absorber during fetal movement and growth (1970, Schmidt 1992). Unlike unidirectional blood flow (Martin 1965, Yang 1998, Prefumo, Campbell et al. 2019), amniotic fluid subtly rocks back and forth, and thus, amnion epithelial cells are constantly exposed to shear stress from fluid undulation, but at a very low level (Gilbert and Brace 1993, Modena and Fieni 2004). The ripple effect may impact cells of the amnion membrane. However, amniotic fluid is enriched in growth factors and other nutrients needed for cell survival and growth; hence, any aberrations impacted by the fluid are likely repaired to avoid any disruption in the membrane function (Borgida, Mills et al. 2000). Nevertheless, fluid motion may impact shear stress in conditions like polyhydramnios or oligohydramnios due to abnormal fluid volume impacting membrane functions (Sherer 2002, Rabie, Magann et al. 2017). Prior to testing the impact of pathologic fluid volume changes and its motion effect on the amnion membrane, a normal baseline understanding of changes that can be induced by fluid motion is needed.
In the human body, physiological shear stress plays an important role in regulating cell differentiation, modulating phenotypes (i.e., epithelial, or mesenchymal), and cellular functionalities (i.e., tight junction expression) based on its frequency, duration, and intensity (Colgan, Ferguson et al. 2007, Anderson and Van Itallie 2009, Cucullo, Hossain et al. 2011, Delon, Guo et al. 2019). During pregnancy, the innermost epithelial cell layer of the fetal membrane is continuously exposed to the amniotic fluid that gently fluctuates by fetal movements (Brace 1997, Brace and Cheung 2011, Brace, Anderson et al. 2014), inducing non-uniform levels of shear flow and stress unlike directional blood flow. However, no in vitro model systems have tested the impact of amniotic fluid shear stress on amnion cells.
For the past decades, microphysiological system (MPS), also known as organ-on-chip (OOC), has been developed, validated, and utilized as more physiologically relevant in vitro models than conventional 2-dimensional (2D) cell culture platforms, such as well plate or trans-well platforms (Kang, Park et al. 2021, Cao, Zhang et al. 2023). MPS allows better cell-to-cell communications for understanding human physiology and pathophysiology, as well as testing drug efficacy and toxicity. They can also be used to test potential harmful effects of environmental toxicants. Moreover, OOC platforms often integrate microchannels, micropillars, or pneumatic valves to provide biomechanical cues to the cell culture systems such as shear stress, stretch, or contraction that cannot be easily applied in conventional 2D platforms (Cao, Zhang et al. 2023).
In our previously developed amnion membrane (AM) OOC model, using standard culture conditions, we investigated cellular transitions under normal (physiologic) and oxidatively stressed (pathologic) conditions (Richardson, Jeong et al. 2019). The AM-OOC model contained human fetal membrane amnion epithelial cells (hFM_AECs) and amnion mesenchymal cells (hFM_AMCs) separated by type IV collagen-filled microchannels modeling the amnion basement membrane, recreating the amnion membrane during human pregnancy. These microchannel arrays allow for the biochemical transportation of signaling molecules from one chamber to another while preventing initial cell mixing between chambers, enabling co-culture of multiple different types of cells. However, these channels are still large enough to allow for active cell migration between chambers due to epithelial-to-mesenchymal transition (EMT). This design also allows biochemicals such as drugs or environmental toxicants to propagate between cell layers, modeling physiological pharmacokinetics of stimulants. The use of this platform led to several new findings previously: 1) amnion membrane cells can migrate (non-reversible) through the microchannels, exhibiting EMT and vice versa (mesenchymal-to-epithelial transition [MET]), integrating themselves into the emigrated cell compartment; 2) oxidative stress (OS) induces EMT or MET but inhibits migration of cells and pro-inflammatory environment; 3) inhibition of OS by antioxidants and functional inhibitors of stress signaler p38 mitogen-activated protein kinase (MAPK) restore the migration property, suggesting that OS and p38 MAPK downstream signaling could regulate cellular migration. This study only focused on visualizing cellular transition and migration; thus, further studies have been proposed such as conducting flow culture to fill the knowledge gap regarding the remodeling of the fetal membrane. Here, we evaluated the effect of amniotic fluid motion on the AM-OOC device in modeling fetal membrane to glean better insight into in utero pathology and pathophysiology.
2. Methods
2.1. Human fetal membrane cell lines for OOC experiment
We used established immortalized human fetal membrane cell lines as reported in our prior publications (Richardson, Jeong et al. 2019, Richardson, Kim et al. 2020, Richardson, Kim et al. 2020, Radnaa, Richardson et al. 2021, Tantengco, Richardson et al. 2021, Menon and Richardson 2022, Richardson, A et al. 2022, Richardson, Kammala et al. 2023) in our microfluidic in vitro model. AECs were cultured in Keratinocyte serum-free medium (KSFM) (17005042, ThermoFisher Scientific, Waltham, MA, USA) supplemented with bovine pituitary extract (30 μg/mL), epidermal growth factor (0.1 ng/mL), CaCl2 (0.4 mM), and primocin (0.5 mg/mL). AMCs were cultured in Dulbecco’s modified eagle medium/nutrient mixture F-12 (DMEM/F12) (MT10092CV, ThermoFisher Scientific, Waltham, MA, USA) supplemented with 5% FBS, 10% penicillin/streptomycin, and 10% amphotericin B. All cells were grown at 37°C and 5% CO2 until they reached 80-90% confluency. Immortalized cells have been validated against primary cells previously (Radnaa, Urrabaz-Garza et al. 2022). Only cells under passage 25 were used for experiments.
2.2. Microfluidic OOC model design, fabrication, and experimental setup
OOC design and fabrication:
To model the amnion membrane (Fig. 1), the AM-OOC device previously developed, tested, and validated to mimic the in utero tissue (Richardson, Jeong et al. 2019, Richardson, Emezienna et al. 2022) was slightly modified. Briefly, the device is composed of two cell culture compartments (250 μm height; outer compartment for AECs and inner compartment for AMCs) interconnected by 24 microchannels (5 μm in height, 30 μm in width, 600 μm in length) (Fig. 2a) to allow cell-to-cell communication during cultivation and localized biochemical treatment to each compartment, and also to prevent the movement of cells between the compartments during the initial cell loading process. The device also contains an on-chip reservoir block where each reservoir compartment is aligned on top of the inlets and outlets of the cell culture chambers. The designed platform was fabricated in polydimethylsiloxane (PDMS; Sylgard 184, 1:10 mixture, DowDuPont, Midland, MI, USA) using a two-step photolithography master mold fabrication process, followed by soft lithography process of replica molding (Park, Jang et al. 2009). To improve bonding of the PDMS layer onto the glass substrate, the PDMS layers were treated with oxygen plasma (Harrick Plasma, Ithaca, NY, USA) for 90 s. This process was repeated for the PDMS reservoir bonding onto the PDMS cell culture layer already bonded to a glass substrate.
Fig. 1.

Fetal membrane of the feto-maternal interface and the intraamniotic cavity it surrounds. a Illustration of the anatomical structure and cellular components of fetal membrane depicting three fetal cell layers and one maternal cell layer. The highlighted amnion membrane is composed of the amnion epithelial layer and the amnion mesenchymal layer. Amnion mesenchymal cells secret type I and III collagen, creating an extracellular matrix layer, as well as organized collagen in the fibroblast layer (tightly packed fibrillar collagen in the spongy layer) and loose collagen of the reticular layer. The basement membrane is attached to the underlying chorion trophoblast cells. b Amnion membrane lines the human intrauterine cavity that supports fetus development during gestation. During the entire pregnancy, fetus is continuously exposed to the amniotic (shear) fluid surrounded by the amniotic sac and protected from external changes.
Fig. 2.
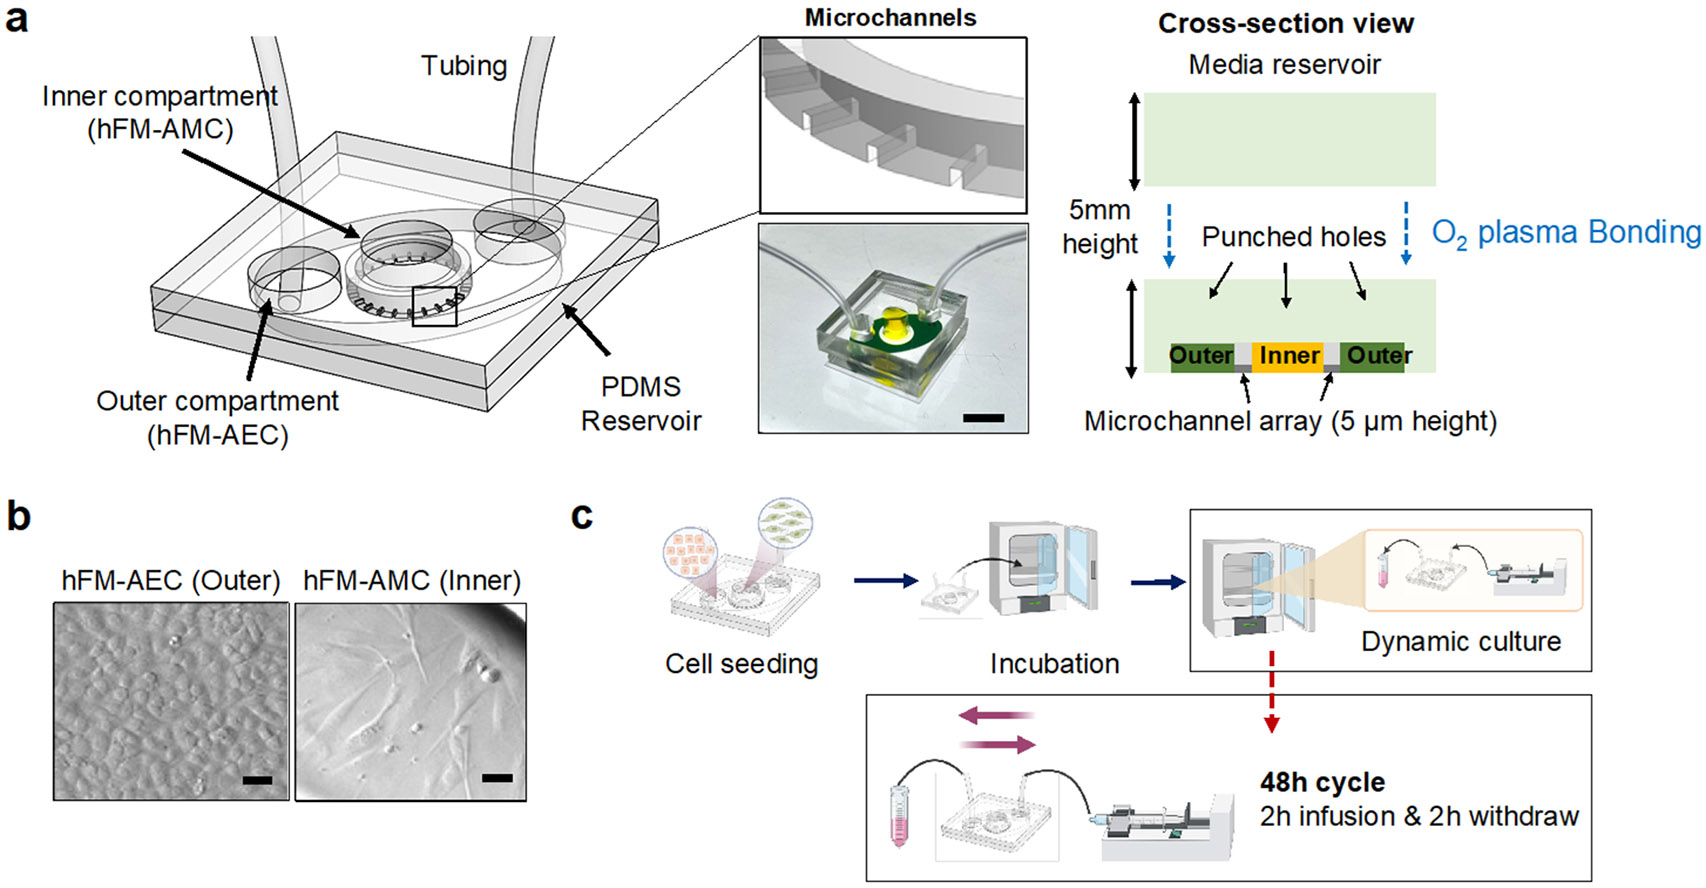
The dynamic flow amnion membrane organ-on-chip (AM-OOC) used for modeling the impact of amniotic fluid motion on cells. a Illustration of the dynamic flow AM-OOC and image of a device ready for testing. It consists of two cell culture chambers and a media reservoir. The two bottom cell culture chambers are interconnected by an array of microchannel. The top reservoir block is punched to match with inlets and outlet of the bottom cell culture chamber. Scale bar = 1 cm. b The two amnion membrane cells (hFM_AECs and hFM_AMCs) cultured in the AM-OOC, observed using bright field microscopy. Scale bar = 25 μm. c The experiment flow of creating in vitro amniotic fluid flow that mimics the in vivo condition. Syringe pumps and control units are connected to the AM-OOC device, where the device is incubated for cell co-culture while the dynamic flow condition is applied.
OOC device basement membrane coating:
Before cells were loaded into the chip, the microchannels were coated with collagen to mimic the basement membrane of the amnion. Before using the AM-OOC, the devices were washed with 70% ethanol for 15 min for sterilization, washed three times with warm DMEM/F12 media to transit the culture compartment to appropriate culture condition, and then the microchannels were filled with 25% type IV collagen (Corning® Matrigel® Basement Membrane Matrix, Corning, Corning, NY, USA), dissolved in complete DMEM/F12 through an active vacuum suctioning process. The devices were then incubated for 4 – 12 h at 37°C and 5% CO2 environment.
Collection of primary amnion collagen:
Methods for obtaining and preparing cell-free collagen from amniotic membrane extracellular matrix (ECM) follow our previously reported procedure (Richardson, Kim et al. 2020, Radnaa, Richardson et al. 2021, Kim, Richardson et al. 2022, Richardson, A et al. 2022).
Cell seeding in the AM-OOC:
After Matrigel coating of the microchannels, the devices were washed two times with complete DMEM/F12 media before cell seeding. Immortalized AECs and AMCs (Fig. 2b) were trypsinized and loaded into the AM-OOC device (250,000 AECs for outer chamber, 45,000 AMCs cells + 20% primary collagen (Menon, Radnaa et al. 2020) + 25% Matrigel for inner chamber), mimicking the concentration ratios seen in utero.
2.3. Creating simulated amniotic fluid movement in AM-OOC
To create a simulated amniotic fluid movement environment in the outer compartment of the AM-OOC where AECs are being cultured, a syringe pump controller with 4 independent syringe control units were utilized (HAPC, Harvard Apparatus, Holliston, MA, USA). To mimic the dynamic fluid motion as expected in amniotic cavity (Brace 1997, Modena and Fieni 2004) , the pump was programmed to infuse culture media initially from 0 μl/h to a target flow rate (i.e., 50 μl/h and 200 μl/h), and then maintained at that flow rate for 2 h. Then, the flow gradually decreased to 0 μl/h within 2 min. Once infusion flow stops, flow starts back in the opposite direction, the same target flow rate maintained for another 2 h, then continue this cycle throughout the 48 h culture period (Fig. 2c). Flow rate in the outer compartment was converted to shear stress level using the Navier-Stokes equation (1),
| (1) |
where, is the shear stress, is the volumetric flow rate, is the dynamic fluidic viscosity, and indicate the width and height of the channel, respectively.
2.4. Creating an oxidative stress (OS) model as pathological positive control
To identify how fluid movement may affect PTB-associated signaling pathways, cigarette smoke extract (CSE)-dissolved media was used as a positive control to create a pathological condition. A single cigarette (Camel; R. J. Reynolds Tobacco, Winston Salem, NC, USA) was vacuumed into a filtering flask containing 25 mL of hFM_AECs media to obtain 100% CSE. Then, the stock CSE solution was filtered using a 0.22 μm sterile flip filter (SCP00525, Millipore Sigma, Burlington, MA, USA) and diluted at 1:25 ratio in the culture media before use. CSE was previously validated as a reproducible OS inducer in our OOC models (Menon, Boldogh et al. 2013, Bredeson, Papaconstantinou et al. 2014, Menon 2014, Menon, Boldogh et al. 2014, Polettini, Richardson et al. 2018, Richardson, Kammala et al. 2023), and is a major known risk factor of PTB. After cells have reached 70-80% confluency in the AM-OOC, culture media in the reservoir layer was removed and refilled with CSE in the AEC compartment, then incubated for 72 h to model OS condition.
2.5. Evaluating the effect of flow culture
The overall effect of flow culture in the AEC and AMC layers was examined by monitoring for the following cellular changes at each culture condition: (1) lactate dehydrogenase (LDH) cytotoxicity assay, (2) immunocytochemical staining of vimentin, cytokeratin 18 (CK-18), and junction protein E-cadherin, (3) vimentin/CK-18 intensity ratio, (4) cell shape index, (5) cytokine production, and (6) scanning electron microscope (SEM) imaging.
2.6. Cytotoxicity assessment
To assess the cytotoxic effect of flow culture on the amnion epithelial cells cultured in the AM-OOC, a LDH cytotoxicity detection kit (ab197004, Abcam, Cambridge, UK) was used. Cell culture media from the cell culture chamber and reservoir in the AM-OOC was collected after the 48 h flow culture experiment. Approximately 5 μL of supernatant were used to perform the cytotoxicity assay according to the manufacturer’s protocol. Briefly, 2 μL of Developer Mix I/LDH Substrate Mix, 4 μL of Pico Probe III/Pico Probe, and 89 μL of LDH Assay buffer were mixed and then added to 5 μL of the collected supernatant in a 96-well plate. The assay plate was incubated at room temperature in the dark for 10 min. The control culture media was used as a negative control, expecting low level of cytotoxicity. Supernatant from cell culture in the AM-OOC was treated with Lysis buffer II/Cell Lysis Solution and incubated for 30 min to ensure lysis of cell membranes as Lysate control. LDH positive control buffer was mixed with 95 μL of prepared LDH Reaction Mix solution to provide positive cytotoxicity. Fluorescence was measured at 535 nm for excitation and 587 nm for emission.
2.7. Immunocytochemistry analysis
Immunocytochemical staining for vimentin (1:300; ab92547, Abcam, Cambridge, UK), CK-18 (1:800; ab668, Abcam, Cambridge, UK), and Epithelial (E)-cadherin (1:300; 24E10, Cell Signaling, Danvers, MA, USA) were used to monitor epithelial to mesenchymal transition (EMT) and tight junction expression. Antibodies were titrated to determine the appropriate dilutions to ensure specific and uniform staining. After 48 h, cells were fixed with 4% paraformaldehyde (PFA), permeabilized with 0.5% Triton-X, and blocked with 3% bovine serum albumin in 1X phosphate buffer silane (PBS), before incubation with primary antibodies overnight. Cells were washed three times in 1X PBS and then incubated with species-specific secondary antibodies (1:1000; Goat Anti-Rabbit IgG H&L Alexa Fluor 488, ab150073; Goat Anti-Mouse IgG H&L Alexa Fluor 594, ab150116; Donkey Anti-Rabbit IgG H&L Alexa Fluor 488, ab150073, Abcam, Cambridge, UK) for 1 h. The AM-OOC devices were washed with 1X PBS and then treated with NucBlue® Fixed Ready Probes Reagent (R37606, Thermo Fisher Scientific, Waltham, MA, USA) to stain the nucleus. The concentrations of primary and secondary antibodies were validated based on our previous AM-OOC-based study (Richardson, Jeong et al. 2019).
2.8. Microscopy
After 48 h of static and flow culture in the AM-OOC devices, bright field microscopy was performed (BZ-X800E microscope; 4x, 10x, and 20x magnification, Keyence, Osaka, Osaka, Japan) to determine cell morphology, intermediate filament expression, and tight junction formation.
Fluorescence image analysis:
Five random regions (N=5) of interest per device and per chamber were used to determine overall vimentin, CK-18, and E-cadherin expression. Laser settings, brightness, contrasts, exposure times, and collection settings were uniform for all images collected. Images were not modified (brightness, contrast, and smoothing) for intensity analysis. Image J software was used to measure fluorescent intensity.
Cell shape index (CSI) analysis:
CSI was determined for AECs and AMCs by evaluating one frame from each experiment (total of five images) per culture condition for cell circularity using the Image J software. CSI was calculated using the following formula: CSI = 4π x area/perimeter2, which is an established method that was originally reported to determine vascular cell shape (Schutte and Taylor 2012). A circle would have a CSI of 1; a straight line would have a CSI of 0.
2.9. Scanning electron microscope (SEM) imaging
Cells were fixed by 4% PFA at room temperature for 15 min after 48 h cultivation in static or flow culture condition. Glass substrates were then detached from the PDMS chamber layer and rinsed with 1X PBS three times. A dehydration step was first performed using graded ethanol concentrations: 20%, 30%, 40%, 60%, 70%, 80%, 90%, 95%, and 100%. Cells were immersed in each concentration once for 5 min and twice for 100% ethanol. Samples were gradually transferred to ethanol/hexamethyldisilane (HMDS) mixture in ratios of 3:1, 1:1, 1:3 with 30 min immersion for each step. Samples were then replenished with pure HMDS three times and dried in a chemical fume hood for at least 1 day. A thin gold layer was deposited on samples using a sputter coater (108 Manual Sputter Coater, Cressington, Watford, UK) and imaged with SEM (MIRA 3 Scanning Electron Microscope, TESCAN, Brno, Czechia).
2.10. Multiplex assays for inflammatory cytokine markers analysis using Luminex
To assess the changes in inflammatory mediators, interleukin (IL)-6, IL-8, IL-10, and tumor necrosis (TNF)-alpha (α) were analyzed from the cell supernatants in the AM-OOC after 48 h of static or flow cultivation. Supernatants were collected from the reservoir of the device using a pipette. Standard curves were developed with duplicate samples of known quantities of recombinant proteins that were provided by the manufacturer. Sample concentrations were determined by relating the fluorescence values that were obtained to the standard curve by linear regression analysis.
2.11. Statistical analysis
All data were analyzed using Prism 8 software (GraphPad Software, La Jolla, CA, USA). Ordinary one-way ANOVA analysis of variance followed by Tukey’s multiple comparison test was used to compare normally distributed data with at least three means. Data are shown as mean ± standard error of mean. Asterisks denote p values as follows: *p<.05; **p<.01; ***p<.001; ****p<.0001.
3. Result
3.1. Modeling amniotic fluid movement within the AM-OOC
Fetus drifts in the amniotic fluid during gestation, where the fetal membrane surrounding the fetus supports fetal organ development and protects the fetus from bacterial infection and environmental alterations such as temperature change (Shamsnajafabadi and Soheili 2022). The membrane and amniotic fluid also allows the movement of fetus, which permits the musculoskeletal development (Fitzsimmons and Bajaj 2023). Unlike other flow in vivo as summarized in Table 1, amniotic fluid can be influenced by various situations, such as reduction of the amount of amniotic fluid through swallowing (Ross and Nijland 1997) and absorbance (Brace and Cheung 2011) of fetus, or maternal abdomen trauma. We established an experimental setup to apply fluid motion to the AM-OOC by utilizing programmed syringe pumps to generate two distinctive flow conditions, one representing a moderate flow (i.e., 50 μl/h = 5.3 dyne/cm2) and another one representing a much higher flow condition (i.e., 200 μl/h = 22 dyne/cm2). Specifically, after the cells have reached 70-80% confluency in the AM-OOC, a 3 mL syringe (Luer Lock, BD, Franklin Lakes, NJ, USA) containing culture media was placed on the syringe control unit and tubing (EW-06420, Tygon, Irvine, CA, USA) was connected to both syringe and device for media perfusion. The tubing, connected to the outlet of the device, was immersed in 15 mL conical tube containing media to avoid air bubbles coming into the device during the entire flow culture condition. This experimental setup is shown in Fig. 2c.
Table 1.
Summary of in vivo shear flow in human body
| Organ/tissue | Fluid shear stress (dyne/cm2) |
Ref. |
|---|---|---|
| Brain arterial vessels | 10-70 | (Wang, Xu et al. 2020) |
| Brain capillary network | 5-23 | (Wang, Xu et al. 2020) |
| Renal | 0.3-1.2 2-4 |
(Ross, Gordon et al. 2021) (Wang, Gust et al. 2022) |
| Glomerular tubule | 30-50 5-20 |
(Wang, Gust et al. 2022) (Ballermann, Dardik et al. 1998) |
| Podocyte slit diaphragm | 80 | (Wang, Gust et al. 2022) |
| Alveolar | 0.5-3 | (Denise C. Fernandes 2018) |
| Intestinal tract | 0.002-0.08 | (Denise C. Fernandes 2018) |
| Large veins | <1 | (Ballermann, Dardik et al. 1998) |
| Small arterioles | 60-80 | (Ballermann, Dardik et al. 1998) |
| Placenta | 0.04-0.2 | (Lee, Moulvi et al. 2023) |
3.2. Low levels of shear stress do not induce AEC cytotoxicity
AEC and AMC viability was assessed by calcein acetoxymethyl (AM) (Live; green fluorescence) and ethidium homodimer (EthD)-1 (Dead; red fluorescence) staining after 48 h of on-chip cultivation. Both cell types showed good viability and proper cell morphology (i.e., AEC – cuboidal; AMC – fibroblastoid) (Fig. 3a). AECs had low levels of cytotoxicity (<20%) under both static and fluid flow conditions, while OS induced significant levels of cytotoxicity, while AMCs showed no significant change (Fig. 3b). These results confirmed that the applied flow and associated shear stress did not induce cytotoxicity, whereas the control experiment with OS induced cytotoxicity only in AECs, as expected.
Fig. 3.
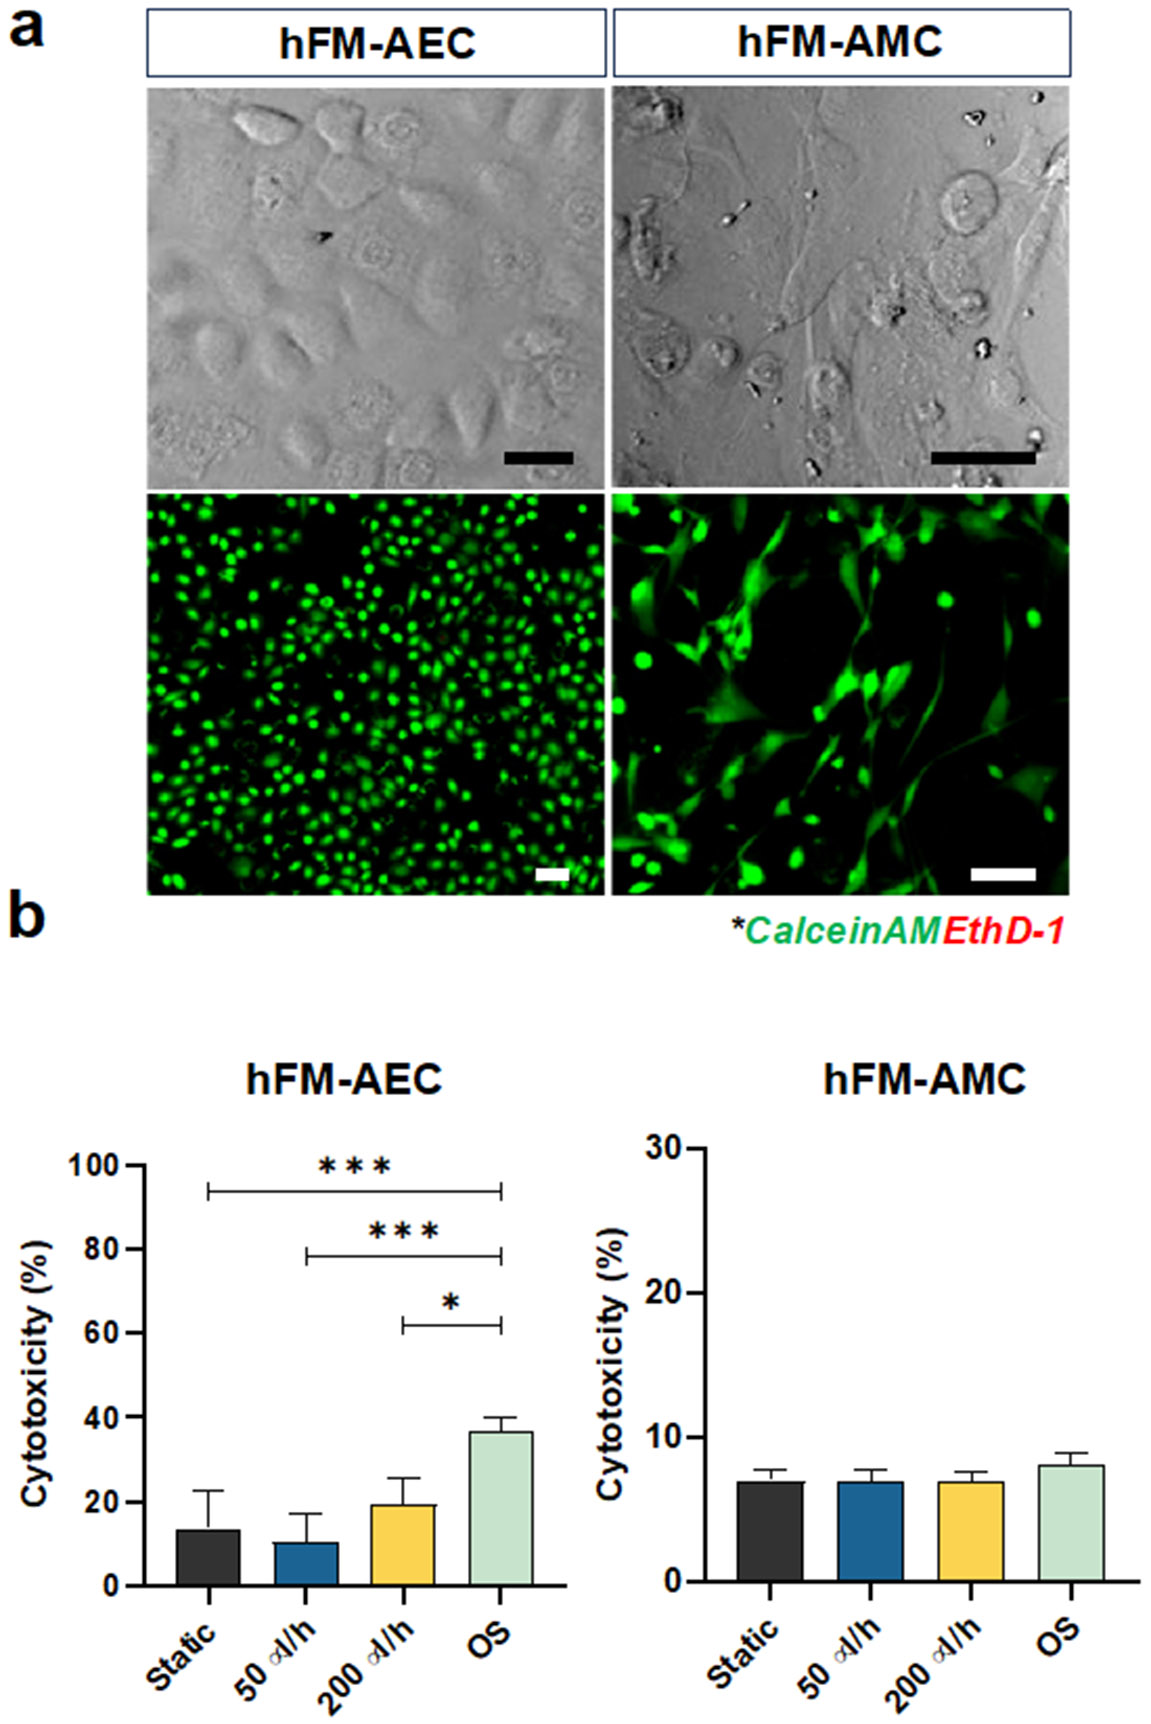
Characterization of amnion membrane cells cultured by different flow conditions for 48 h in the AM-OOC. a Bright field and fluorescent microscopy showing normal condition of amnion cells in the AM-OOC with high viability. Scale bar = 10 μm. b LDH cytotoxicity assay result showing the level of LDH production from AECs and AMCs in the AM-OOC after 48 h culture (AEC - static vs. OS: p=0.0004; 50 μl/h vs. OS: p=0.0004; 200 μl/h vs. OS: p=0.0269) Data are shown as mean ± SEM (N=5). *p<.05; **p<.01; ***p<.001; ****p<.0001.
3.3. Flow does not affect the epithelial nature of AECs but does induce microvilli formation
Highly elastic (due to rich presence of elastin) AECs protect the fetus by forming a watertight barrier between the amniotic fluid and the distal cellular layers (Shamsnajafabadi and Soheili 2022, Truong, Menon et al. 2023). This occurs through its maintenance of epithelial characteristics such as intermediate filament organization, tight junction regulation, and microvilli expression (Anderson and Van Itallie 2009, Kobayashi, Kadohira et al. 2010).
After 48 h of static and flow culture conditions, intermediate filament expressions (vimentin for mesenchymal characteristics; CK-18 for epithelial characteristics) and localization in AECs and AMCs were evaluated by immunocytochemistry. AECs under all conditions co-expressed both vimentin and CK-18, highlighting that they were in “meta state”, an in-between state of cellular transition that is an innate characteristic of AECs in utero (Martin, Richardson et al. 2018) (Fig. 4a: vimentin = green; CK-18 = red; DAPI = blue;). Static and flow culture conditions did not affect vimentin or CK-18 expression, as seen by vimentin/CK-18 ratios remaining unchanged (Fig. 4b). However, OS treatment did induce vimentin re-localization toward the leading edge of cells (white arrow) and a significant increase in vimentin/CK-18 ratio compared to all other conditions (Fig. 4a and 4b). None of the culture conditions affected intermediate filament expression and localization in AMCs. Morphological changes of AECs and AMCs evaluated by cell shape index (CSI) analysis (Fig. 4c), confirmed the findings of no changes in intermediate filament expression, suggesting that fluid flow does not induce cellular transitions (i.e., EMT) in AECs. In contrast, OS treatment for 48 h (positive control) does induce vimentin re-localization, increase in vimentin/CK-18 ratio, and increase in fibroid morphology (high CSI), therefore indicating EMT in AECs. This confirmed our prior report where we showed that CSE-induced OS in AECs can cause EMT (Richardson, Jeong et al. 2019).
Fig. 4.
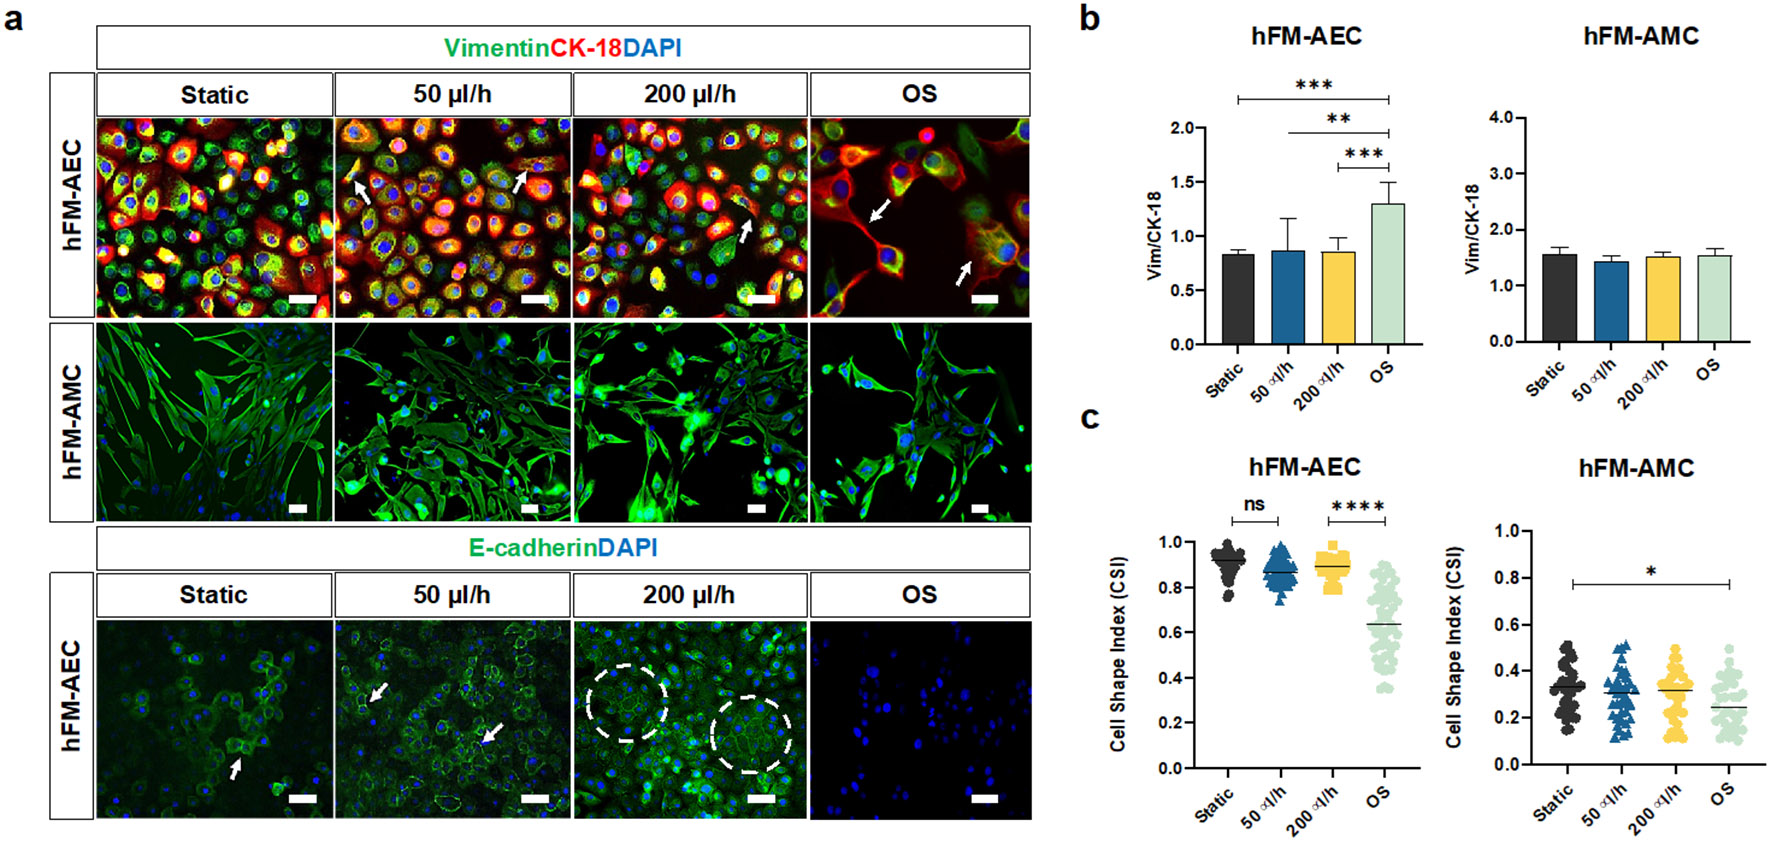
Evaluating the impact of amniotic fluid motion on amnion membrane cells in the AM-OOC. a Fluorescence microscopy showing the expression of in utero amnion membrane cell-specific markers after 48 h culture. These measurements included cytoskeletal marker (vimentin = green, cytokeratin-18 [CK-18] = red) of AECs and AMCs (top row) and cell-to-cell junction protein marker (E-cadherin = green) of AECs (bottom row). The scale bar is 10 μm. b Fluorescence intensity analysis of cell-specific markers showed minimal changes in their expression under the 48 h flow condition (AEC - static vs. OS: p=0.0008; 50 μl/h vs. OS: p = 0.0013; 200 μl/h vs. OS: p = 0.0008). Data are shown as mean ± SEM (N=5). c Amnion membrane cell morphological changes and cellular transition were determined by cell shape index analysis. AECs under static culture condition had cell shape index of 0.9 correlated to its cuboidal nature, while AECs under OS condition had a significantly lower cell shape index. AMCs did not show significant morphological changes under the dynamic flow culture (AEC - static vs. OS: p = 0.0001; 50 μl/h vs. OS: p = 0.0001; 200 μl/h vs. OS: p = 0.0001, AMC - static vs. OS: p = 0.02142). Data are shown as mean ± SEM (N=5).
E-cadherin was evaluated by immunocytochemistry to measure barrier function and tight junction expression between AECs in the AM-OOC. AECs under static and flow culture conditions stained positive for E-cadherin (green) but not under the OS condition, and increased E-cadherin expression was observed from groups of epithelial morphologies than individuals (Fig. 4a, E-cadherin = green, DAPI = blue).
Microvilli expression on-chip was assessed by SEM. Microvilli are expressed in adsorptive epithelial cells and their appearance in a flow environment is an expected phenomenon. After 48 h culture, static culture did not induce microvilli formation, while fluid flow induced microvilli expression on the apical surface of the AECs (Fig. 5), as seen in utero (Basile, Centurione et al. 2023) and also seen in typical epithelial cells as well (Zhao, Chien et al. 2001, Miura, Sato et al. 2015), indicating that the applied flows support innate cellular characteristics regardless of the flow rates. The degree of microvilli formation was not further characterized here.
Fig. 5.
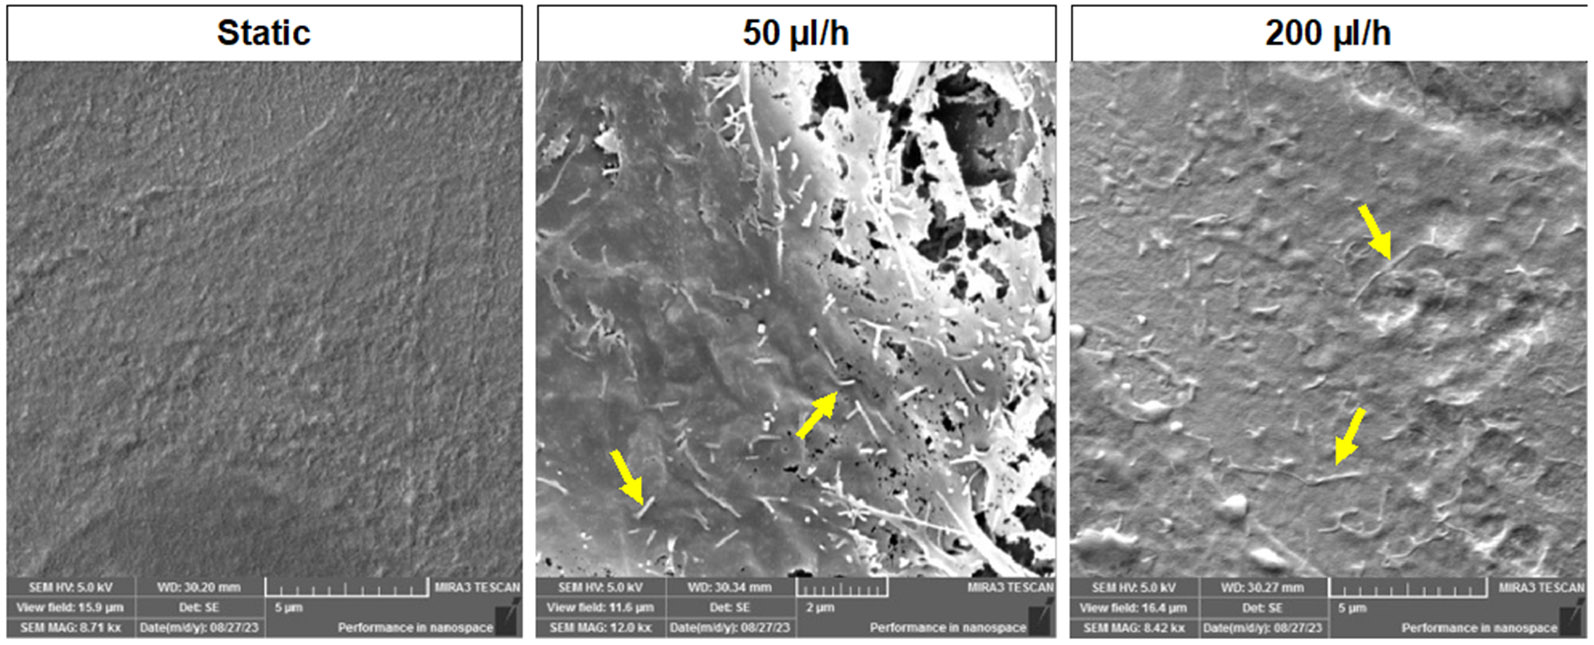
Scanning electron microscopy (SEM) images of hFM_AECs after 48 h of culture. Microvilli formation was observed from flow culture while static culture condition did not show any changes after 48 h culture in the AM-OOC.
In summary, these results indicate that fluid flow does not affect AEC’s epithelial properties (i.e., cuboidal morphology [high CSI], meta state [no change in Vim/CK-18 ratio], and tight junction expression [E-cadherin]) but resulted in microvilli formation in AECs.
3.4. AECs do not change cytokine production due to fluid flow rate
Pro- and anti-inflammatory cytokines (IL-6, IL-8, TNF-α and IL-10) were measured after 48 h to determine if fluid flow induced a pro-inflammatory status in AECs (Fig. 6). Similar to our previous study (Richardson, Jeong et al. 2019), AECs within the AM-OOC expressed higher cytokine levels than 2D culture, likely due to the presence of AMCs in proximity (Fig. 6). Neither low (50 μl/h) nor high (200 μl/h) levels of fluid flow significantly increased IL-6, IL-8, TNF-α, and IL-10 production compared to static culture, while OS treatment significantly increased the production of pro- and anti-inflammatory cytokines compared to static and fluid flow conditions. Together, these results confirm that fluid flow does not induce pathologic inflammatory imbalance within AM-OOC cultures.
Fig. 6.

Production of inflammatory mediators by different culture conditions in the AM-OOC. Interleukin [IL]-6 showed flow-dependent inflammation (IL-6: static vs. OS: p = 0.0001; 50 μl/h vs. OS: p = 0.0005; 200 μl/h vs. OS: p = 0.0073) and IL-8 from AM-OOC showed increased inflammatory responses compared to 2D condition (IL-8: static vs. OS: p = 0.0001; 50 μl/h vs. OS: p = 0.0001; 200 μl/h vs. OS: p = 0.0001), but not significant. TNF-α and IL-10 did not show any changes among all conditions (TNF-α: static vs. OS: p = 0.0008; 50 μl/h vs. OS: p = 0.0238; 200 μl/h vs. OS: p = 0.0052). (IL-10: static vs. OS: p = 0.0001; 50 μl/h vs. OS: p = 0.0001; 200 μl/h vs. OS: p=0.0003). Regardless of the culture condition (static vs. flow) and flow rate (50 μl/hr vs. 200 μl/hr), amnion epithelial cells do not produce inflammatory mediators for 48 h culture compared to 2D control static culture (p>.05) and OS condition (p=0.00001). Data are shown as mean ± SEM (N=5).
4. Discussion
Human body consists of up to 60% water, which circulates inside and outside cells by constituting intracellular and extracellular fluid. Blood circulates human body and acts on the endothelial surface of blood vessels by inducing shear stress. This mechanical phenomenon impacts various biological functions and processes. Thus, various types of in vitro models have been developed with flow-based cultures to recreate organ- or tissue-specific phenomenon and conditions that better mimic the in vivo environment. However, amniotic fluid behaves differently compared to blood flow, and its role and impact in microphysiological system of feto-maternal interfaces have not been previously studied. Amniotic fluid fluctuates during gestation from 1-1.5 ml in the first week to 1.5 L at term. The maintenance of fetal and fetal organ growth as well as amnion cell nourishing is performed by the nutrient and growth factor enriched in amniotic fluid. Too low (oligohydramnios) or too high (polyhydramnios) levels of amniotic fluid volume is pathologic and associated with pregnancy-associated adverse pregnancy outcomes such as growth restrictions and preterm birth (Fortunato, Menon et al. 2004, Kacerovsky, Musilova et al. 2014). Under these conditions, the flow, motion and stress are expected to differ, which can contribute to cytopathologic changes in amniotic cells.
Amniotic epithelial cells undergo multitudes of changes during pregnancy, which include senescence, EMT, and autophagy. All these changes are natural and physiologic processes required for membrane integrity. However, premature senescence, terminal state of EMT (i.e., lack of MET to recycle cells), and accumulation of autophagosome complexes or incomplete autophagy are pathologic processes that destabilize membranes and predispose them to adverse events. Stress, stretch, scratch, and senescence can all cause changes in amnion functions, inducing inflammation. The impact of fluid and its motion is aiding membrane function; however, under pathologic environment, the impact of fluid motion on amnion cells and fetal responses are unknown due to difficulties in studying such phenomenon in vivo.
The study presented here established an in vitro experimental model to recreate amniotic fluid motion and assessed the effect of amniotic fluid motion on fetal epithelial layer. We utilized a syringe pump to provide a sequential back-and-forth flow to mimic the rocking movement, recapitulating amniotic fluid motion for the first time in an organ-on-a-chip model. The use of this model provided better insight into fetal membrane homeostasis during pregnancy. We report that shear stress has minimal impact on amniotic epithelial cells. Specifically, regardless of the flow rate, AECs did not undergo cytotoxic changes, exhibited expected morphology and metastatic status, absence of overabundance of transitioning cells with mesenchymal morphology, and did not result in inflammation. Although not measured, lack of inflammation is also indicative of absence of senescence-associated secretory phenotype (SASP), an inflammatory signature associated with amnion epithelial cell senescence. These data are reassuring that the motion induced by amniotic fluid is not expected to cause any cytopathic changes in AECs.
Using the microfluidic OOC platform enabled overcoming the limitations of conventional cell culture platform, such as lack of multi-cellular communication and inadequate physiologic environment. Incorporating flow dynamics into the OOC platform helped us better understand endothelial and epithelial cell behavior. Here, amniotic fluid rocking motion was established through a syringe pump system by programming the infusion and withdraw function (sequential 2 h back and forth cycle for 48 h) with different shear stress levels. One of the challenges in this study was that the actual level of amniotic fluid motion is unknown, as in utero this motion is primarily affected by the movement of fetus and not well characterized. Therefore, it fluctuates all the time, which is difficult to exactly mimic. In addition, in this study we have used regular AEC culture media instead of that more closely mimicking amniotic fluid. Thus, changes in amniotic fluid constituents under normal and pathologic events and fetal movement under hostile intrauterine environment was not adequately replicated in this model. These factors may impact AECs functions not studied in this work, leaving such studies to be conducted in the future.
In conclusion, we established an easy and simple amniotic fluid motion organ-on-a-chip model by applying moderate to high level of shear flow to the amnion epithelial layer and monitored their cellular responses. Within the AM-OOC device, AECs maintained their phenotypic expressions without cellular transition under all flow culture conditions and did not show inflammatory responses commonly seen in pathologic condition. This indicates that pregnancy maintenance and fetal development is not affected by mechanical stimulations induced by fluid motion in the intrauterine environment under normal circumstances. Furthermore, this study provides evidence that an inclusion of shear flow within amnion layers is not a requirement when recapitulating the layer in vitro or studying amniochorion functions using OOC systems.
Acknowledgements
We would like to thank the National Institutes of Health (NIH) / National Center for Advancing Translational Sciences (NCATS) grant UG3TR003283/UH3TR003283, National Institute of Environmental Health Sciences (NIEHS) grant P42ES027704, and National Institute of Child Health and Human Development (NICHD) grant 1R01HD100729 to Drs. Han and Menon. The content of the information does not necessarily reflect the position or the policy of the Government, and no official endorsement should be inferred.
Footnotes
Conflict of interest The authors declare no conflict of interest.
Data availability statement
The data that support the findings of this study are available on request from the corresponding author.
Reference
- (1970). "Amniotic fluid: its physiology and pathology." J Reprod Med 5(6): 221–241. [PubMed] [Google Scholar]
- Anderson JM and Van Itallie CM (2009). "Physiology and function of the tight junction." Cold Spring Harb Perspect Biol 1(2): a002584. [DOI] [PMC free article] [PubMed] [Google Scholar]
- Ballermann BJ, Dardik A, Eng E and Liu A (1998). "Shear stress and the endothelium." Kidney Int Suppl 67: S100–108. [DOI] [PubMed] [Google Scholar]
- Basile M, Centurione L, Passaretta F, Stati G, Soritau O, Susman S, Gindraux F, Silini A, Parolini O and Di Pietro R (2023). "Mapping of the Human Amniotic Membrane: In Situ Detection of Microvesicles Secreted by Amniotic Epithelial Cells." Cell Transplant 32: 9636897231166209. [DOI] [PMC free article] [PubMed] [Google Scholar]
- Borgida AF, Mills AA, Feldman DM, Rodis JF and Egan JF (2000). "Outcome of pregnancies complicated by ruptured membranes after genetic amniocentesis." Am J Obstet Gynecol 183(4): 937–939. [DOI] [PubMed] [Google Scholar]
- Brace RA (1997). "Physiology of amniotic fluid volume regulation." Clin Obstet Gynecol 40(2): 280–289. [DOI] [PubMed] [Google Scholar]
- Brace RA, Anderson DF and Cheung CY (2014). "Regulation of amniotic fluid volume: mathematical model based on intramembranous transport mechanisms." Am J Physiol Regul Integr Comp Physiol 307(10): R1260–1273. [DOI] [PMC free article] [PubMed] [Google Scholar]
- Brace RA and Cheung CY (2011). "Amniotic fluid volume and composition after fetal membrane resection in late-gestation sheep." J Am Assoc Lab Anim Sci 50(6): 939–942. [PMC free article] [PubMed] [Google Scholar]
- Bredeson S, Papaconstantinou J, Deford JH, Kechichian T, Syed TA, Saade GR and Menon R (2014). "HMGB1 promotes a p38MAPK associated non-infectious inflammatory response pathway in human fetal membranes." PLoS One 9(12): e113799. [DOI] [PMC free article] [PubMed] [Google Scholar]
- Cao UMN, Zhang Y, Chen J, Sayson D, Pillai S and Tran SD (2023). "Microfluidic Organ-on-A-chip: A Guide to Biomaterial Choice and Fabrication." Int J Mol Sci 24(4). [DOI] [PMC free article] [PubMed] [Google Scholar]
- Colgan OC, Ferguson G, Collins NT, Murphy RP, Meade G, Cahill PA and Cummins PM (2007). "Regulation of bovine brain microvascular endothelial tight junction assembly and barrier function by laminar shear stress." Am J Physiol Heart Circ Physiol 292(6): H3190–3197. [DOI] [PubMed] [Google Scholar]
- Cucullo L, Hossain M, Puvenna V, Marchi N and Janigro D (2011). "The role of shear stress in Blood-Brain Barrier endothelial physiology." BMC Neurosci 12: 40. [DOI] [PMC free article] [PubMed] [Google Scholar]
- Delon LC, Guo Z, Oszmiana A, Chien CC, Gibson R, Prestidge C and Thierry B (2019). "A systematic investigation of the effect of the fluid shear stress on Caco-2-cells towards the optimization of epithelial organ-on-chip models." Biomaterials 225: 119521. [DOI] [PubMed] [Google Scholar]
- Fernandes Denise C., T. L. S. A., Laurindo Francisco R.M., Tanaka Leonardo Y. (2018). Chapter 7 - Hemodynamic Forces in the Endothelium: From Mechanotransduction to Implications on Development of Atherosclerosis. Endothelium and Cardiovascular Diseases. [Google Scholar]
- Fitzsimmons ED and Bajaj T (2023). Embryology, Amniotic Fluid. StatPearls. Treasure Island (FL). [PubMed] [Google Scholar]
- Fortunato SJ, Menon R, Ahmed NU, Bourgeois M and Dildy GA (2004). "Amniotic fluid concentrations of collagenase-1 and collagenase-3 are increased in polyhydramnios." J Perinat Med 32(2): 122–125. [DOI] [PubMed] [Google Scholar]
- Gilbert WM and Brace RA (1993). "Amniotic fluid volume and normal flows to and from the amniotic cavity." Semin Perinatol 17(3): 150–157. [PubMed] [Google Scholar]
- Kacerovsky M, Musilova I, Andrys C, Drahosova M, Hornychova H, Rezac A, Kostal M and Jacobsson B (2014). "Oligohydramnios in women with preterm prelabor rupture of membranes and adverse pregnancy and neonatal outcomes." PLoS One 9(8): e105882. [DOI] [PMC free article] [PubMed] [Google Scholar]
- Kang S, Park SE and Huh DD (2021). "Organ-on-a-chip technology for nanoparticle research." Nano Converg 8(1): 20. [DOI] [PMC free article] [PubMed] [Google Scholar]
- Kim S, Richardson L, Radnaa E, Chen Z, Rusyn I, Menon R and Han A (2022). "Molecular mechanisms of environmental toxin cadmium at the feto-maternal interface investigated using an organ-on-chip (FMi-OOC) model." J Hazard Mater 422: 126759. [DOI] [PMC free article] [PubMed] [Google Scholar]
- Kobayashi K, Kadohira I, Tanaka M, Yoshimura Y, Ikeda K and Yasui M (2010). "Expression and distribution of tight junction proteins in human amnion during late pregnancy." Placenta 31(2): 158–162. [DOI] [PubMed] [Google Scholar]
- Lee TC, Moulvi A, James JL and Clark AR (2023). "Multi-scale Modelling of Shear Stress on the Syncytiotrophoblast: Could Maternal Blood Flow Impact Placental Function Across Gestation?" Ann Biomed Eng 51(6): 1256–1269. [DOI] [PMC free article] [PubMed] [Google Scholar]
- Manabe Y, Himeno N and Fukumoto M (1991). "Tensile strength and collagen content of amniotic membrane do not change after the second trimester or during delivery." Obstet Gynecol 78(1): 24–27. [PubMed] [Google Scholar]
- Martin CB Jr. (1965). "Uterine Blood Flow and Placental Circulation." Anesthesiology 26: 447–459. [DOI] [PubMed] [Google Scholar]
- Martin L, Richardson L and Menon R (2018). Characteristics, Properties, and Functionality of Fetal Membranes: An Overlooked Area in the Field of Parturition. Encyclopedia of Reproduction (Second Edition). Skinner MK. Oxford, Academic Press: 387–398. [Google Scholar]
- Menon R. (2014). "Oxidative stress damage as a detrimental factor in preterm birth pathology." Front Immunol 5: 567. [DOI] [PMC free article] [PubMed] [Google Scholar]
- Menon R, Boldogh I, Hawkins HK, Woodson M, Polettini J, Syed TA, Fortunato SJ, Saade GR, Papaconstantinou J and Taylor RN (2014). "Histological evidence of oxidative stress and premature senescence in preterm premature rupture of the human fetal membranes recapitulated in vitro." Am J Pathol 184(6): 1740–1751. [DOI] [PubMed] [Google Scholar]
- Menon R, Boldogh I, Urrabaz-Garza R, Polettini J, Syed TA, Saade GR, Papaconstantinou J and Taylor RN (2013). "Senescence of primary amniotic cells via oxidative DNA damage." PLoS One 8(12): e83416. [DOI] [PMC free article] [PubMed] [Google Scholar]
- Menon R, Radnaa E, Behnia F and Urrabaz-Garza R (2020). "Isolation and characterization human chorion membrane trophoblast and mesenchymal cells." Placenta 101: 139–146. [DOI] [PMC free article] [PubMed] [Google Scholar]
- Menon R and Richardson L (2022). "Organ-on-a-chip for perinatal biology experiments." Placenta Reprod Med 1. [PMC free article] [PubMed] [Google Scholar]
- Menon R, Richardson LS and Lappas M (2019). "Fetal membrane architecture, aging and inflammation in pregnancy and parturition." Placenta 79: 40–45. [DOI] [PMC free article] [PubMed] [Google Scholar]
- Miura S, Sato K, Kato-Negishi M, Teshima T and Takeuchi S (2015). "Fluid shear triggers microvilli formation via mechanosensitive activation of TRPV6." Nat Commun 6: 8871. [DOI] [PMC free article] [PubMed] [Google Scholar]
- Modena AB and Fieni S (2004). "Amniotic fluid dynamics." Acta Biomed 75 Suppl 1: 11–13. [PubMed] [Google Scholar]
- Park ES, Jang D, Lee J, Kim YJ, Na J, Ji H, Choi JW and Kim GT (2009). "Maskless optical microscope lithography system." Rev Sci Instrum 80(12): 126101. [DOI] [PubMed] [Google Scholar]
- Polettini J, Richardson LS and Menon R (2018). "Oxidative stress induces senescence and sterile inflammation in murine amniotic cavity." Placenta 63: 26–31. [DOI] [PMC free article] [PubMed] [Google Scholar]
- Prefumo F, Campbell S and Jauniaux E (2019). "Maternal blood flow to the placenta." BJOG 126(8): 972. [DOI] [PubMed] [Google Scholar]
- Rabie N, Magann E, Steelman S and Ounpraseuth S (2017). "Oligohydramnios in complicated and uncomplicated pregnancy: a systematic review and meta-analysis." Ultrasound Obstet Gynecol 49(4): 442–449. [DOI] [PubMed] [Google Scholar]
- Radnaa E, Richardson LS, Sheller-Miller S, Baljinnyam T, de Castro Silva M, Kumar Kammala A, Urrabaz-Garza R, Kechichian T, Kim S, Han A and Menon R (2021). "Extracellular vesicle mediated feto-maternal HMGB1 signaling induces preterm birth." Lab Chip 21(10): 1956–1973. [DOI] [PMC free article] [PubMed] [Google Scholar]
- Radnaa E, Urrabaz-Garza R, Elrod ND, de Castro Silva M, Pyles R, Han A and Menon R (2022). "Generation and characterization of human Fetal membrane and Decidual cell lines for reproductive biology experimentsdagger." Biol Reprod 106(3): 568–582. [DOI] [PMC free article] [PubMed] [Google Scholar]
- Richardson L, Jeong S, Kim S, Han A and Menon R (2019). "Amnion membrane organ-on-chip: an innovative approach to study cellular interactions." FASEB J 33(8): 8945–8960. [DOI] [PMC free article] [PubMed] [Google Scholar]
- Richardson L, Kim S, Menon R and Han A (2020). "Organ-On-Chip Technology: The Future of Feto-Maternal Interface Research?" Front Physiol 11: 715. [DOI] [PMC free article] [PubMed] [Google Scholar]
- Richardson LS, K. K. A, Costantine MM, Fortunato SJ, Radnaa E, Kim S, Taylor RN, Han A and Menon R (2022). "Testing of drugs using human feto-maternal interface organ-on-chips provide insights into pharmacokinetics and efficacy." Lab Chip 22(23): 4574–4592. [DOI] [PMC free article] [PubMed] [Google Scholar]
- Richardson LS, Emezienna N, Burd I, Taylor BD, Peltier MR, Han A and Menon R (2022). "Adapting an organ-on-chip device to study the effect of fetal sex and maternal race/ethnicity on preterm birth related intraamniotic inflammation leading to fetal neuroinflammation." Am J Reprod Immunol 88(6): e13638. [DOI] [PMC free article] [PubMed] [Google Scholar]
- Richardson LS, Kammala AK, Kim S, Lam PY, Truong N, Radnaa E, Urrabaz-Garza R, Han A and Menon R (2023). "Development of oxidative stress-associated disease models using feto-maternal interface organ-on-a-chip." FASEB J 37(7): e23000. [DOI] [PMC free article] [PubMed] [Google Scholar]
- Richardson LS, Kim S, Han A and Menon R (2020). "Modeling ascending infection with a feto-maternal interface organ-on-chip." Lab Chip 20(23): 4486–4501. [DOI] [PMC free article] [PubMed] [Google Scholar]
- Ross EJ, Gordon ER, Sothers H, Darji R, Baron O, Haithcock D, Prabhakarpandian B, Pant K, Myers RM, Cooper SJ and Cox NJ (2021). "Three dimensional modeling of biologically relevant fluid shear stress in human renal tubule cells mimics in vivo transcriptional profiles." Sci Rep 11(1): 14053. [DOI] [PMC free article] [PubMed] [Google Scholar]
- Ross MG and Nijland MJ (1997). "Fetal swallowing: relation to amniotic fluid regulation." Clin Obstet Gynecol 40(2): 352–365. [DOI] [PubMed] [Google Scholar]
- Schmidt W. (1992). "The amniotic fluid compartment: the fetal habitat." Adv Anat Embryol Cell Biol 127: 1–100. [DOI] [PubMed] [Google Scholar]
- Schutte SC and Taylor RN (2012). "A tissue-engineered human endometrial stroma that responds to cues for secretory differentiation, decidualization, and menstruation." Fertil Steril 97(4): 997–1003. [DOI] [PMC free article] [PubMed] [Google Scholar]
- Shamsnajafabadi H and Soheili ZS (2022). "Amniotic fluid characteristics and its application in stem cell therapy: A review." Int J Reprod Biomed 20(8): 627–643. [DOI] [PMC free article] [PubMed] [Google Scholar]
- Sherer DM (2002). "A review of amniotic fluid dynamics and the enigma of isolated oligohydramnios." Am J Perinatol 19(5): 253–266. [DOI] [PubMed] [Google Scholar]
- Tantengco OAG, Richardson LS, Medina PMB, Han A and Menon R (2021). "Organ-on-chip of the cervical epithelial layer: A platform to study normal and pathological cellular remodeling of the cervix." FASEB J 35(4): e21463. [DOI] [PMC free article] [PubMed] [Google Scholar]
- Truong N, Menon R and Richardson L (2023). "The Role of Fetal Membranes during Gestation, at Term, and Preterm Labor." Placenta Reprod Med 2. [DOI] [PMC free article] [PubMed] [Google Scholar]
- Verbruggen SW, Oyen ML, Phillips AT and Nowlan NC (2017). "Function and failure of the fetal membrane: Modelling the mechanics of the chorion and amnion." PLoS One 12(3): e0171588. [DOI] [PMC free article] [PubMed] [Google Scholar]
- Wang D, Gust M and Ferrell N (2022). "Kidney-on-a-Chip: Mechanical Stimulation and Sensor Integration." Sensors (Basel) 22(18). [DOI] [PMC free article] [PubMed] [Google Scholar]
- Wang X, Xu B, Xiang M, Yang X, Liu Y, Liu X and Shen Y (2020). "Advances on fluid shear stress regulating blood-brain barrier." Microvasc Res 128: 103930. [DOI] [PubMed] [Google Scholar]
- Yang GZ (1998). "Exploring in vivo blood flow dynamics." IEEE Eng Med Biol Mag 17(3): 64–72, 104. [DOI] [PubMed] [Google Scholar]
- Zhao Y, Chien S and Weinbaum S (2001). "Dynamic contact forces on leukocyte microvilli and their penetration of the endothelial glycocalyx." Biophys J 80(3): 1124–1140. [DOI] [PMC free article] [PubMed] [Google Scholar]
Associated Data
This section collects any data citations, data availability statements, or supplementary materials included in this article.
Data Availability Statement
The data that support the findings of this study are available on request from the corresponding author.