Abstract
Background: Collagen, a primary protein component of the extracellular matrix (ECM), undergoes a notable series of alterations concomitant with the growth of the tumor. Procollagen-lysine,2-oxoglutarate 5-dioxygenase 3 (PLOD3) is involved in the synthesis of collagen and has been associated with a variety of cancers. However, it is unclear how PLOD3 functions in esophageal squamous cell carcinoma (ESCC). Methods: Differentially expressed genes between ESCC and adjacent normal tissues were identified using proteomic and transcriptomic analyses. These genes were then subjected to survival analysis to identify prognostic markers. Immune cell infiltration in the two subgroups was evaluated. Spearman’s correlation analysis was performed to examine the correlation between PLOD3 and RBM15 expression in TCGA-ESCC database. shRNA-mediated approach was used to knockdown RBM15 in ESCC cells. The effects of RBM15 knockdown on PLOD3 expression were assessed by real-time PCR and Western blot. Moreover, COX algorithm was employed to construct a prognostic signature. Results: PLOD3 was found to be highly expressed in ESCC patients and correlated with a favorable prognosis. Immune cell infiltration estimation indicated tumor-infiltrating CD4+ T cell was increased in PLOD3-high group. Correlation analysis revealed that PLOD3 was associated with RBM15 and was closely related to CD4+ T cell infiltration. Moreover, loss-of-function approaches showed that depletion of RBM15 attenuated PLOD3 expression in ESCC cells. Following univariate and multivariate Cox regression analyses, PLOD3 and RBM15 were identified as a two-gene prognostic signature for ESCC. Conclusion: RBM15 enhances tumor-infiltrating CD4+ T Cell abundance in ESCC by regulating PLOD3. Two new independent prognostic factors, PLOD3 and RBM15, may be useful in predicting the prognosis of ESCC.
Keywords: Esophageal squamous cell carcinoma, RBM15, PLOD3, tumor microenvironment, tumor infiltrating cells
Introduction
Esophageal cancer is the seventh most common malignancy worldwide, accounting for 3.1% of all new cancers in 2020 with 604,000 new cases. It is the sixth leading cause of cancer-related mortality, with 544,000 deaths worldwide in 2020 [1]. Esophageal cancer can be categorized into two main histological subtypes with significant regional differences in incidence: esophageal squamous cell carcinoma (ESCC) and esophageal adenocarcinoma (EAC) [2]. ESCC is the predominant histological type of esophageal carcinoma in the “Asian esophageal cancer belt” [3]. Currently available ESCC treatment options include radiation therapy, chemotherapy, surgery, molecular targeted therapy, and combinations of these [4]. Despite advances in treatment, prognosis remains poor, with a five-year overall survival rate below 20% [5]. Elucidation of the precise molecular events underlying ESCC development and progression and identification of efficient therapeutic targets are urgently required to improve treatment and prognosis.
The tumor microenvironment (TME) is important in the pathobiology of cancer and may have a pro- or anti-tumor effect [6]. The TME is composed of various cell types, including infiltrating immune cells, fibroblasts, and extracellular matrix (ECM) [7]. In tissues and organs, ECM is a highly dynamic structure of cross-linked proteins [8]. The ECM primarily comprises collagen, and changes in collagen deposition may be associated with cancer development and progression [9,10]. There has been evidence in previous studies that collagen degradation plays a direct role in ESCC cell invasion, migration, and proliferation [11]. Moreover, collagen is also involved in tumor-associated immune infiltration [12]. In 3D culture assays, as a result of a collagen matrix of high density, T-cell migration was inhibited and collagen fibers were not able to guide T-cells during migration [13]. As a result of these findings, collagen appears to play an important role in cancer development.
Several processes and enzymatic modifications, including lysine hydroxylation, occur in the rough endoplasmic reticulum following the collagen precursor’s synthesis [14]. Hydroxylation is a critical step in collagen synthesis, and usually occurs at the Y position of repeating Gly-X-Y (X and Y represent proline or hydroxyproline) motifs [15]. Various forms of diseases are known to be caused by the destruction of collagen by aberrant hydroxylation, including cancer [16]. The Procollagen-Lysine,2-Oxoglutarate 5-Dioxygenase (PLOD) family catalyzes lysine hydroxylation in collagen-like peptides to form hydroxylysine [17]. The three lysyl hydroxylase (LH) enzyme isoforms that the PLOD genes encode are LH1, LH2a/b, and LH3. These enzymes use Fe2+, 2-oxoglutarate (2-OG), ascorbate, and molecular oxygen to catalyze lysine hydroxylation of collagens [18]. Procollagen telopeptides are specifically hydroxylated by PLOD2, but collagen triple helices are specifically hydroxylated by PLOD1 and PLOD3 [17]. The enzyme PLOD3 is a multifunctional enzyme that can perform lysyl hydroxylase, collagen galactosyltransferase, and glucosyltransferase functions [19]. Emerging evidence has associated PLOD3 with tumorigenesis, immune cell infiltration, and genomic instability in various types of cancer [20]. PLOD3 is highly expressed in ovarian cancer, hepatocellular carcinoma, and lung adenocarcinoma, and may represent a diagnostic marker for these cancers [15,17]. PLOD3 knockdown induced caspase-dependent apoptosis by modulating the PKC-delta signaling pathway in human lung cancer cells [21]. An increase in PLOD3 expression in colon adenocarcinomas was associated with decreased immune regulatory expression and increased tumor-propagating activity [20]. Although PLOD3 expression is associated with tumor prognosis in many cancers, how PLOD3 expression is modulated in ESCC remains elusive.
It has been found that m6A methylation is the most prevalent modification in eukaryotic mRNA, and it is closely linked to tumor progression [22]. As a key regulator in m6A methylation modification, RBM15 has been confirmed to be involved in cancer progression [23,24]. It interacts with other proteins to form a complex called the “m6A writer complex”, which is responsible for depositing m6A marks onto RNA molecules. Previous studies have shown that laryngeal squamous cell carcinoma (LSCC) was characterized by an overexpression of RBM15, which regulated the stability of m6A-based TMBIM6 mRNA and facilitated LSCC progression [23]. In this study, PLOD3 expression characteristics were analyzed in esophageal tumor tissues in order to investigate its role in ESCC. Here we found high PLOD3 expression was associated with increased CD4+ T cell levels and a favorable prognosis. Moreover, we demonstrated that RBM15 regulates PLOD3 expression in ESCC. Our findings may provide novel prognostic biomarkers and therapeutic targets for ESCC.
Materials and methods
Patient information and tissue samples
Samples of tumor tissues and adjacent non-cancerous tissues were collected from nineteen ESCC patients who underwent surgery with curative intent at the Affiliated Huai’an No. 1 Hospital of Nanjing Medical University. All resected specimens were formalin-fixed and paraffin-embedded for subsequent immunohistochemistry (IHC) analysis. Written informed consent was provided by all enrolled subjects, and the study protocol was approved by the Huai’an No. 1 People’s Hospital’s Committee (No. YX-2021-078-01). A clinical summary is given in Supplementary Table 1.
Cell culture
HEK293T and human ESCC cell lines, including Kyse-30, Kyse-150 and TE1, were acquired from the Chinese Type Culture Collection. DMEM supplemented with 10% fetal bovine serum FBS and 1% penicillin/streptomycin was used for cell culture at 37°C in humidified air with 5% CO2. All cells were tested negative for the presence of mycoplasma.
Vector construction
Short hairpin RNA (shRNA) sequences targeting PLOD3 and RBM15, synthesized by Genscript, were cloned into the lentivirus shRNA expression plasmid pLVshRNA-puro (Inovogen Tech). The expression vector pCDNA3.1-PLOD3 (Youbio) containing the PLOD3 cDNA was used to subclone PLOD3 into the lentiviral vector pLenti-EFs-BSD for overexpression. To knockdown RBM15 in Kyse150 cells, which had previously been transduced with Cas9-expressing lentivirus, small guide RNAs (sgRNAs) targeting exon regions of the RBM15 gene were designed and synthesized. The sgRNA sequences were then inserted into the LentiGuide-Puro vector, which allows for sgRNA expression under the U6 promoter. In Table 1, the primer sequences were listed.
Table 1.
Primers used for plasmid construction and Realtime PCR
| Primer | Sequence (5’-3’) |
|---|---|
| shScramble-forward | GATCGGGTTCTCCGAACGTGTCACGTTTCCGAAGAAACGTGACACGTTCGGAGAATTTTTC |
| shScramble-reverse | AATTGAAAAATTCTCCGAACGTGTCACGTTTCTTCGGAAACGTGACACGTTCGGAGAACCC |
| shPLOD3-2-forward | GATCGGGGGATCTTTCAGAACCTCAACGCGAACGTTGAGGTTCTGAAAGATCCTTTTTC |
| shPLOD3-2-reverse | AATTGAAAAAGGATCTTTCAGAACCTCAACGTTCGCGTTGAGGTTCTGAAAGATCCCCC |
| shPLOD3-3-forward | GATCGGGGGTGTGTGGAATGTACCATACCGAAGTATGGTACATTCCACACACCTTTTTC |
| shPLOD3-3-reverse | AATTGAAAAAGGTGTGTGGAATGTACCATACTTCGGTATGGTACATTCCACACACCCCC |
| shRBM15-1-forward | GATCGGGCGCGGAATACAAGACTCTGAACGAATTCAGAGTCTTGTATTCCGCGTTTTTC |
| shRBM15-1-reverse | AATTGAAAAACGCGGAATACAAGACTCTGAATTCGTTCAGAGTCTTGTATTCCGCGCCC |
| shRBM15-2-forward | GATCGGGGCAAGCTAGAAGAAGAACACACGAATGTGTTCTTCTTCTAGCTTGCTTTTTC |
| shRBM15-2-reverse | AATTGAAAAAGCAAGCTAGAAGAAGAACACATTCGTGTGTTCTTCTTCTAGCTTGCCCC |
| RBM15-RT-forward | TCCCACCTTGTGAGTTCTCC |
| RBM15-RT-reverse | GTCAGCGCCAAGTTTTCTCT |
| sgRBM15-1-forward | CACCGCGACGACCCGCAACAATGAA |
| sgRBM15-1-reverse | AAACTTCATTGTTGCGGGTCGTCGC |
| sgRBM15-2-forward | CACCGAGCCGCGAGTATGATACCGG |
| sgRBM15-2-reverse | AAACCCGGTATCATACTCGCGGCTC |
| sgNS-forward | CACCGTGCGAATACGCCCACGCGAT |
| sgNS-reverse | AAACATCGCGTGGGCGTATTCGCAC |
Quantitative proteomics using liquid chromatography tandem mass spectrometry (LC-MS/MS)
The protein extraction kit was used to extract the proteins (Thermo Fisher). The DDA spectrum library was built. For DDA and DIA mode analysis, LC-MS/MS was employed. DDA and DIA data were assessed using the R statistical framework, Biognosys Spectronaut version 9.0, and Proteome Discoverer 2.2 (PD 2.2, Thermo) platform. The PD program (version 2.2) was used to analyze the DDA MS raw files, and peak lists were compared to the protein database. The MS proteomics data were uploaded using the iProX partner repository and the dataset number PXD020230 to the ProteomeXchange Consortium (http://proteomecentral.proteomexchange.org).
Western blot
Total proteins were isolated from cells using Radioimmunoprecipitation assay (RIPA). Equal amounts of the protein samples were added to 4-12% SDS-PAGE gels to separate the proteins and then transferred to 0.45 μm PVDF membranes. After blocking with 5% no-fat milk in TBST for 1 h, primary antibodies were performed overnight at 4°C, followed by incubation with appropriate secondary antibodies for 1 h. The results were visualized on ChemiDoc XRS+ system (Bio-Rad). The antibodies used in this study are as follows: PLOD3 (1:1000, Proteintech), RBM15 (1:2000, Proteintech), GAPDH (1:50000, Proteintech).
Immunohistochemistry
Paraffin-embedded blocks from ESCC tumor and para-cancerous tissues were sectioned into slices placed on pre-coated slides. After deparaffinization, antigen retrieval, and blocking, the samples were washed with PBS. They were then incubated with the PLOD3 antibody (1:25000, Proteintech) at 4°C overnight, and with the secondary antibody at room temperature for 2 h. Subsequently, DAB chromogen and hematoxylin staining were applied to visualize Immunoreactivity. IHC staining was quantified using histochemical scoring (H-score) evaluation, which considered staining intensity (i) as well as the proportion of stained cells at each intensity level (Pi), which ranged from 0 to 300. There were four values for the i values: 0 for negative positive, 1 for low positive, 2 for positive, and 3 for high positive. To evaluate Pi, IHC profiler for ImageJ system was used and the percentage of stained intensity was displayed on the interface visually. The total of i multiplied by Pi yields the final H-score, as seen by the equation below: H-score = (0×P0) + (1×P1) + (2×P2) + (3×P3) [25].
Immunofluorescence staining
As described previously, after deparaffinization, antigen retrieval, and blocking, the sections were incubated with the primary antibody at 4°C overnight. The following day, the sections were washed three times in PBS for 5 minutes each. Fluorescently labeled secondary antibodies were then applied at 37°C for 1 hour in the dark. The slides were again washed with PBS three times for 5 minutes each. To stain the nuclei, the sections were mounted using a DAPI-containing mounting medium (Beyotime), ensuring light protection. Finally, images were captured using a confocal fluorescence microscope, and fluorescence intensity was quantified using ImageJ software. The antibodies used in this study are as follows: PLOD3 (1:500, Proteintech), RBM15 (1:500, Proteintech), CD4 (1:500, Abcam).
Transwell invasion assays
For transwell invasion assays, 2×10⁴ ESCC cells were resuspended in serum-free DMEM and added to the upper chamber, then DMEM containing 10% serum was added to the lower chamber. After 48 hours of incubation at 37°C, cells in the upper chamber were gently erased with cotton buds, fixed with 4% paraformaldehyde and stained with 0.1% crystal violet solution. The number of invasive cells was quantified using the ImageJ system.
Wound healing assays
ESCC cells were seeded into 6-well cultural plates, and when 80% confluency was reached, artificial wounds were scratched with 10 μL pipette tips. Subsequently, serum-free DMEM was added after three washes with PBS. Cells were observed and photographed using a microscope at 0, 12, 24, and 36 hours, and the average width was calculated using the Image J system to compare cell migration rates.
Cloning formation assays
For the clone formation assays, 2×10³ cells were seeded per well in 6-well plates in triplicate. The medium was changed every 2 days during cell growth. After 2-week incubation, cells in plates were fixed with 4% paraformaldehyde and stained with 0.1% crystal violet. In the end, the Image J system was used for counting.
Cell proliferation assays
MTT Cell Proliferation and Cytotoxicity Assay Kit (Beyotime) was used for cell proliferation ability. 2×10³ cells were seeded into 96-well plates in five replicates. After 2 h, MTT solution was added. After continued incubation for 4 h at 37°C, Formazan solution was added. As mentioned above, MTT reagent and Formazan solution were added daily for 4 consecutive days. The plates were placed at 37°C for at least 4 h after the last addition of Formazan solution. Finally, absorbance was detected at 570 nm.
Data acquisition and treatment
The gene expression matrix (HTSEQ-Counts, HTSEQ-FPKM, npatients=82, nnormal=11), clinical survival data (n=82) and the phenotype data (n=82) for ESCC were acquired from Genomic Commons Data Portal GDC (https://portal.gdc.cancer.gov/) of The Cancer Genome Atlas (TCGA) database. The data were pretreated and integrated using “tidyverse” R package. The matrix including gene expression, survival, and clinical index was used to perform the nomogram Cox model.
Construction of cox risk model
PLOD3-related DEGs in the 82 ESCC samples were used for univariate and multivariate cox regression. A correlation between expression of each gene and overall survival (OS) was calculated using the “Survival” R package. The final screening of independent prognostic variables (prognostic characteristic genes) was performed using multivariate cox regression analysis. The risk score was calculated as the follow: risk score = (exp-gene1 * coef-gene1) + ... (exp-gene n * coef-gene n). Based on the median risk score, patients were divided into high- and low-risk groups.
Survival prediction was assessed using time-dependent receiver operating characteristic (ROC) curves, an area under the ROC curve (AUC) value was calculated using the Time ROC package in R to measure prognosis and predict accuracy.
DEGs associated with PLOD3 and functional enrichment analysis
The 82 ESCC samples were divided into PLOD3-high and PLOD3-low subgroups, according to the median of PLOD3 expression level. The DEGs between the two groups were then determined using “Deseq 2” R package, and visualized via volcano plot and heatmap. The threshold we referred to here is fold change > 2 and P-value < 0.05. “ClusterProfiler” R package was used to perform the Gene Ontology (GO) and pathway Kyoto Encyclopedia of Genes and Genomes (KEGG) enrichment enriched by the DEGs, and the results were visualized by bubble diagram.
Identification of PLOD3-related hub genes
Protein-protein interaction networks (PPI) were constructed using STRING (https://cn.string-db.org/), and visualized using Cytoscape (v3.7.2). According to CytoHubba, each gene in the network is ranked by its contribution to the network. In the following analysis, we selected the 50 top hub genes.
Immune microenvironment estimate analysis
For reliable immune score assessment, the RNA sequencing and clinical data were used, and the infiltrating proportion of six types of immune cells infiltration were calculated by tumor immune estimation resource (TIMER) algorithm using ImmunedeconV R software. The distribution of the immune cell infiltration in each sample were showed by heatmap. The correlation of gene expression and the abundance of infiltrated immune cells were analyzed using spearman’s correlation, P < 0.05 was considered statistically significant (*P < 0.05).
Statistical analysis
GraphPad Prism v6 and SPSS 19.0 were used for statistical analysis. Data were initially evaluated with a normal distribution using the Shapiro-Wilk method and homogeneity of variance using the Levene method. One-way analysis of variance (ANOVA) with post hoc Tukey’s test or two-tail Student t test was applied to analyze quantitative data, while the nonparametric χ2 test was used to analyze qualitative data. When the data did not fit to the criteria of homogeneity of variance or normal distribution, non-parametric tests such as Mann-Whitney and Kruskal-Wallis were used. Statistical significance was defined P < 0.05 (*P < 0.05, **P < 0.01, ***P < 0.001).
Results
PLOD3 is highly expressed in ESCC
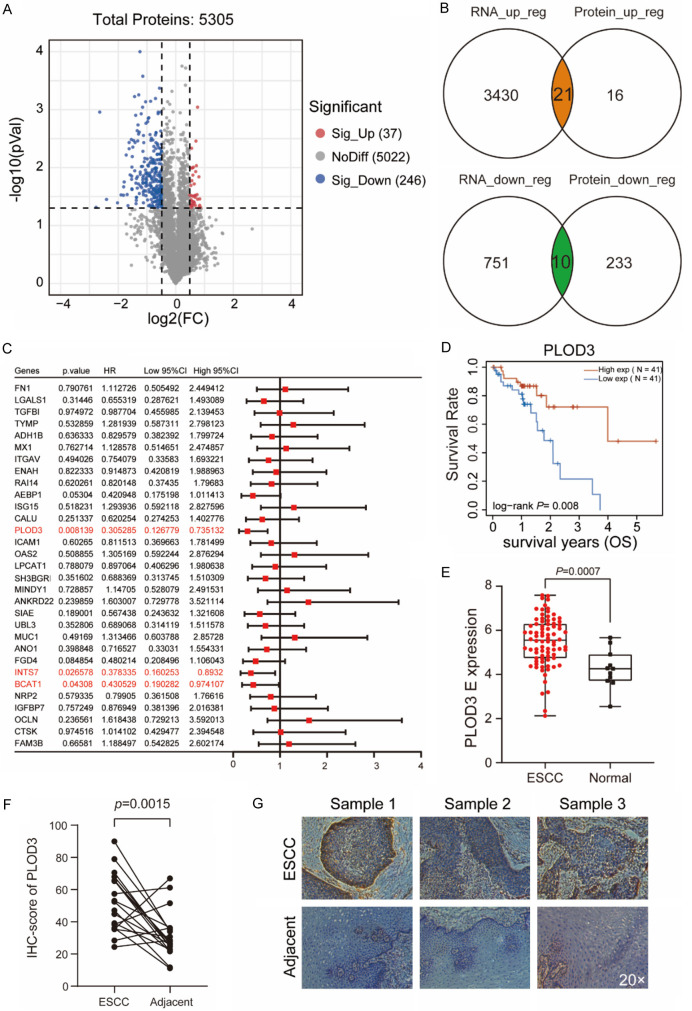
Using LC-MS/MS, we analyzed the protein profiles of ESCC tissues with the adjacent normal tissues to identify proteins that were differentially expressed in ESCC. A total of 5,305 proteins were detected, 283 of which were differentially expressed between ESCC and adjacent non-tumor tissues (Figure 1A). GO molecular function analysis indicated that the differentially expressed proteins were associated with cadherin binding, cell adhesion molecule binding, extracellular matrix structural constituents, and other important functions (Supplementary Figure 1A). KEGG pathway and Gene Set Enrichment Analysis (GSEA) analyses also suggested that cell adhesion molecule, adherens junction, and focal adhesion pathways were enriched (Supplementary Figure 1B, 1C). Further, by overlapping proteome data with transcriptome data from TCGA-ESCC, we identified 31 genes with transcriptome alterations reflecting their proteome dysregulation (Figure 1B).
Figure 1.
PLOD3 highly expressed in ESCC and correlated with favorable prognosis. A. Using LC-MS/MS, a volcano plot demonstrating the proteins that differ in expression between tumor specimens and surrounding tissue is displayed. Volcano plot presents the log2 fold change (x-axis) and significance (-log10*adjusted p-value; y-axis) with significantly downregulated and upregulated proteins shown in blue and red, respectively (adjust P < 0.05 and |log2FC| > 0.5). B. Venn diagram showing the overlapping genes identified by proteome data and transcriptome data. C. Forest showing the prognosis of the DEGs in ESCC. D. The overall survival (OS) curve of high- and low-PLOD3 groups in TCGA ESCC data set. E. The expression level (TPM) of PLOD3 in ESCC compared to adjacent normal samples. F. IHC score for PLOD3 in ESCC tumor and adjacent tissue. Paired, two-tailed Student’s t-test. G. Representative IHC images (Magnification, ×20) for PLOD3 in ESCC tumor and adjacent tissue.
Next, we analyzed the correlation of these genes with prognosis and found that the expression of PLOD3, INTS7, and BCAT1 was significantly associated with favorable prognosis (Figure 1C). PLOD3 exhibited the most pronounced prognostic value in ESCC, so we focused on its biological functions in subsequent analyses. The prognostic value of PLOD3 expression in ESCC was validated by gene expression profiling interactive analysis (GEPIA) and the Kaplan-Meier Plotter Database, revealing that elevated expression of PLOD3 indicated longer OS in ESCC (Figure 1D and Supplementary Figure 1D). Compared to adjacent non-tumor tissues, PLOD3 was more highly expressed at both RNA and protein levels in ESCC tissues (Figure 1E and Supplementary Figure 1E). Immunohistochemistry analysis showed that PLOD3 staining intensity was higher in tumor tissues than in adjacent non-tumor tissues (Figure 1F, 1G).
PLOD3 knockdown inhibits ESCC cell proliferation, migration and invasion
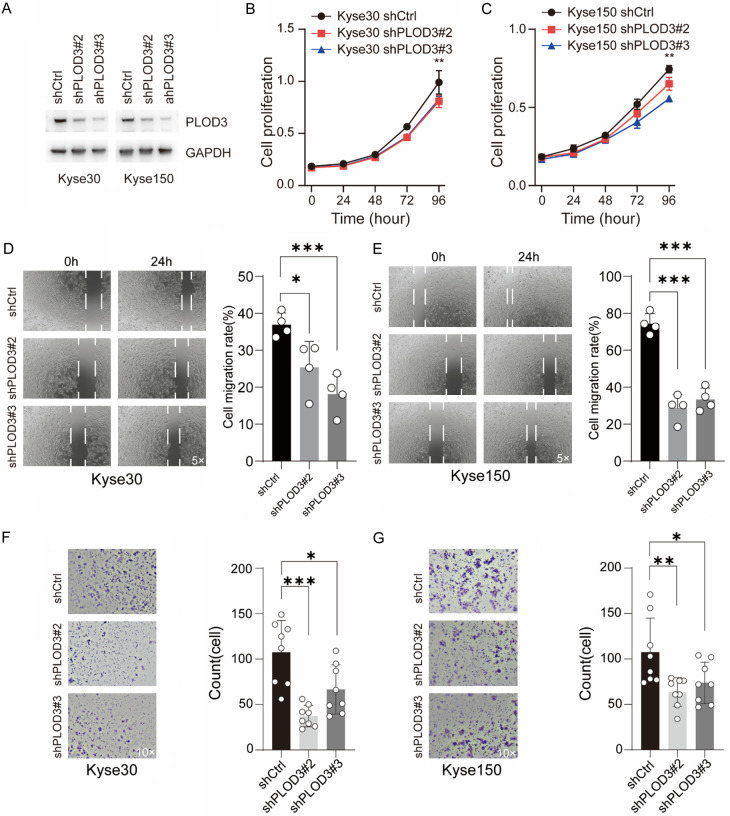
To investigate its function in ESCC cells, we silenced PLOD3 in Kyse30 and Kyse150 cells using shRNA lentivirus (Figure 2A). First, we found that PLOD3 knockdown reduced the proliferation of ESCC cells (Figure 2B, 2C). Next, we confirmed the stemness of cells after PLOD3 knockdown using a colony formation assay and found that knockdown decreased the colony formation ability of Kyse30 cells, but caused no significant effects in Kyse150 cells (Supplementary Figure 2A, 2B). Furthermore, to investigate the migration capacity, transwell and wound healing assays were conducted. We found that PLOD3 knockdown significantly inhibited the migration and invasion of ESCC cells (Figure 2D-G). Taken together, our results suggested that PLOD3 altered the proliferation, migration, and invasion of ESCC cells.
Figure 2.
Effects of PLOD3 on ESCC cells. (A) Western blot was used to assess the knockdown efficiency of two different shRNAs that targeted PLOD3 in Kyse30 and Kyse150 cells. (B, C) MTT proliferation assay in ESCC cells. (D, E) Wound healing assay was utilized to determine the cell migration in Kyse30 (D) and Kyse150 (E) cells. Representative images (magnification, ×5) and statistical plots are shown; (F, G) The effect of PLOD3 knockdown on the invasiveness of Kyse30 (F) and Kyse150 (G) cells. Six distinct microscopic fields (magnification, ×10) from a minimum of three separate experiments were analyzed for the invasion assay. *P < 0.05, **P < 0.01, ***P < 0.001.
Immune microenvironment evaluation between PLOD3-high and -low subgroups
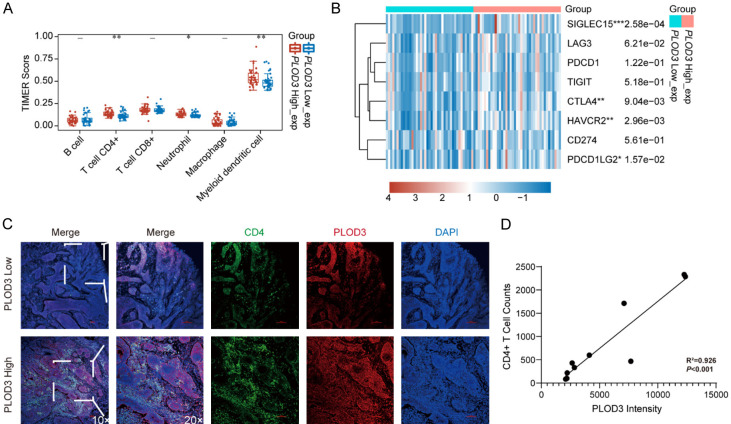
Immune microenvironment dysregulation impacts the anti-tumor immune response and thus affects overall survival in human cancer. To further explore the connection between high PLOD3 expression and favorable outcome in ESCC, the infiltrated immune cells in the TME were assessed using the TIMER algorithm. The abundance of infiltrating CD4+ T cells, neutrophils, and myeloid dendritic cells was significantly higher in the PLOD3-high subgroup (Figure 3A). Further, in the PLOD3 subtypes, we identified immune checkpoint genes including CD274 (PD-L1), PDCD1 (PD-1), LAG3 (CD223), HAVCR2, CTLA4, PDCD1LG2, SIGLEC15, and TIGIT. The findings demonstrated that the PLOD3-high group had greater expression levels of SIGLEC15, HAVCR2, CTLA4, and PDCD1LG2 than the PLOD3-low group (Figure 3B). There was no difference in other genes between the two groups (Figure 3B). These results demonstrate that PLOD3 was associated with immune cell infiltration, especially of CD4+ T cells, neutrophils, and myeloid dendritic cells. To validate the infiltration of CD4+ T cells in tumor tissues with high and low PLOD3 expression in vivo, immunofluorescence staining was performed on tumor tissue sections. PLOD3 was labeled in red, and CD4+ T cells were labeled in green to assess their distribution and expression levels within the tumor tissues. The results demonstrated a strong positive correlation between PLOD3 expression and CD4+ T cell infiltration. Linear regression analysis indicated a strong correlation with a coefficient of determination (R2=0.926), signifying a good fit of the regression line. The p-value was less than 0.001, indicating statistical significance. These findings suggest that high PLOD3 expression may be associated with enhanced CD4+ T cell infiltration in the tumor microenvironment (Figure 3C, 3D).
Figure 3.
Analysis of the PLOD3-mediated immune microenvironment. A. Immune cell infiltration analysis of PLOD3 in ESCC. B. Analysis of immune check loci in high- and low-PLOD3 groups. C. Representative IF images (Magnification, ×10, ×20) for CD4+ T cells infiltration in high- and low-PLOD3 groups. D. Correlation between PLOD3 intensity and CD4+ T cell counts. *P < 0.05, **P < 0.01, ***P < 0.001.
Identification of PLOD3-related DEGs in ESCC
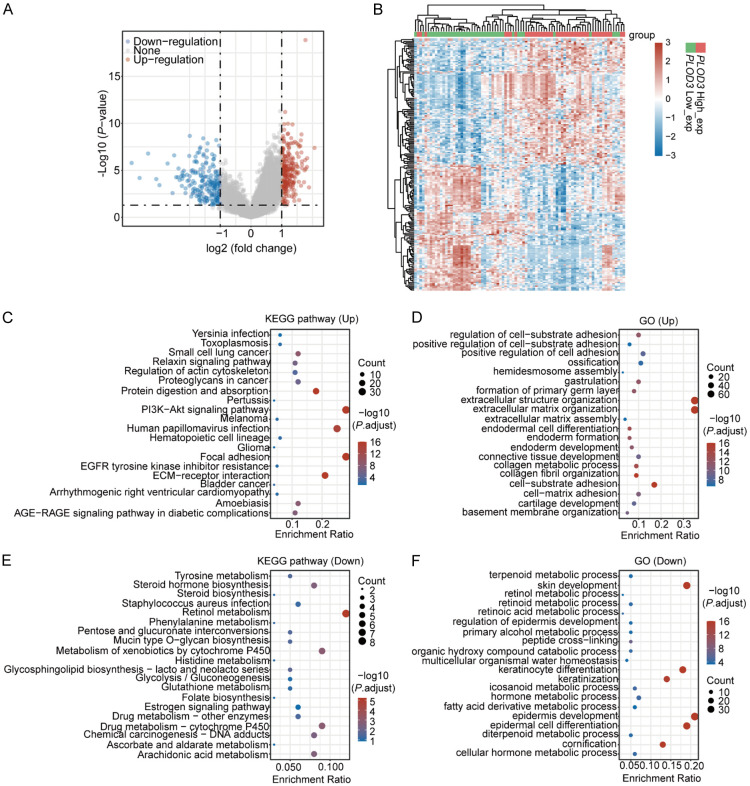
To further study the impact of PLOD3 in the process of ESCC progression, tumor tissue samples were divided into PLOD3-high and -low subgroups according to the median of the expression PLOD3, and the DEGs in the PLOD3-high vs. -low group were assessed with a threshold of fold change > 2 and P < 0.05. We identified 227 significantly highly expressed genes in the PLOD3-high subgroup and 194 in the PLOD3-low subgroup (Figure 4A, 4B; Supplementary Table 2). KEGG analysis showed that genes in the PLOD3-high group were mainly related to PI3K-Akt signaling, focal adhesion, and human papillomavirus infection pathways (Figure 4C; Supplementary Table 3), along with the biological processes of extracellular matrix organization, extracellular structure organization, and cell-substrate adhesion (Figure 4D; Supplementary Table 3). These findings indicated that PLOD3-high patients exhibited higher levels of ECM and cell adhesion-related genes than those in the PLOD3-low group. Furthermore, genes highly expressed in the PLOD3-low subgroup were predominantly enriched in retinol metabolism pathways (Figure 4E) and in the biological processes of epidermis development, epidermal cell differentiation, and skin development (Figure 4F).
Figure 4.
Identification of DEGs associated with PLOD3 differential expression. (A) Volcano Plot of DEGs in the PLOD3-high vs. PLOD3-low group comparison. (B) Heatmap showing the differential genes in PLOD3-high vs. PLOD3-low. (C-F) KEGG (C, E) and GO (D, F) analysis of up-regulated and down-regulated differentially expressed genes.
Determination of PLOD3-related hub genes
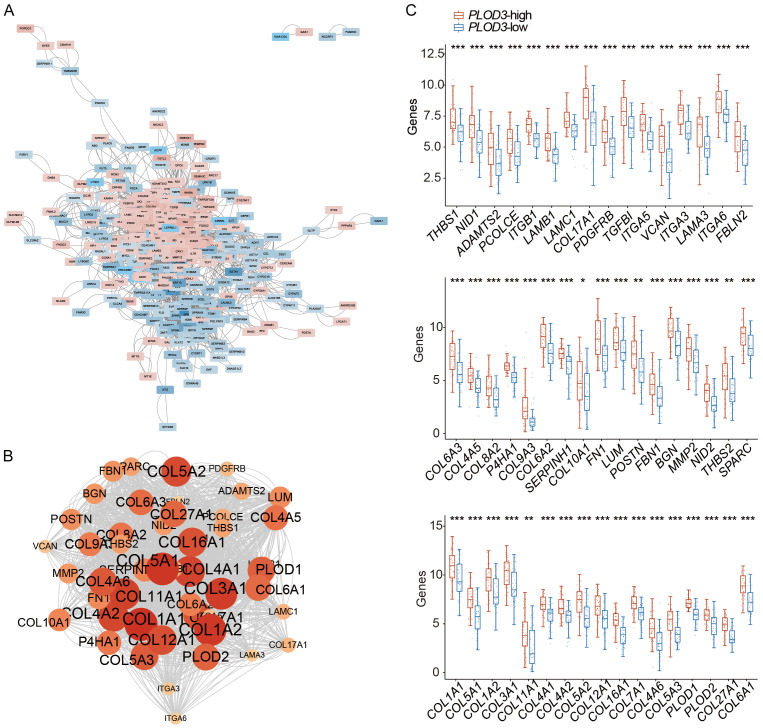
We analyzed the hub genes associated with PLOD3 among the 421 DEGs identified in Figure 3. A PPI network was first constructed using these 421 DEGs, and the results revealed two obvious subnetworks among the upregulated and downregulated genes in the PPI network (Figure 5A). The rank of each protein was calculated using cytoHubba, and the top 50 hub genes were identified (Figure 5B; Supplementary Table 4). These hub genes were highly expressed in the PLOD3-high group (Figure 5C; Supplementary Table 4). According to the previous section GO results (Supplementary Table 3), these hub genes were primarily ECM- and focal adhesion-related.
Figure 5.
PPI network and hub genes of PLOD3 associated DEGs in ESCC. A. PPI network. B. Hub genes identification based on cytoHubba. Circles represent genes, and lines represent interaction among DEGs. C. The mRNA expression of 50 hub-genes in PLOD3-high group.
RBM15 modulates PLOD3 expression in ESCC cells
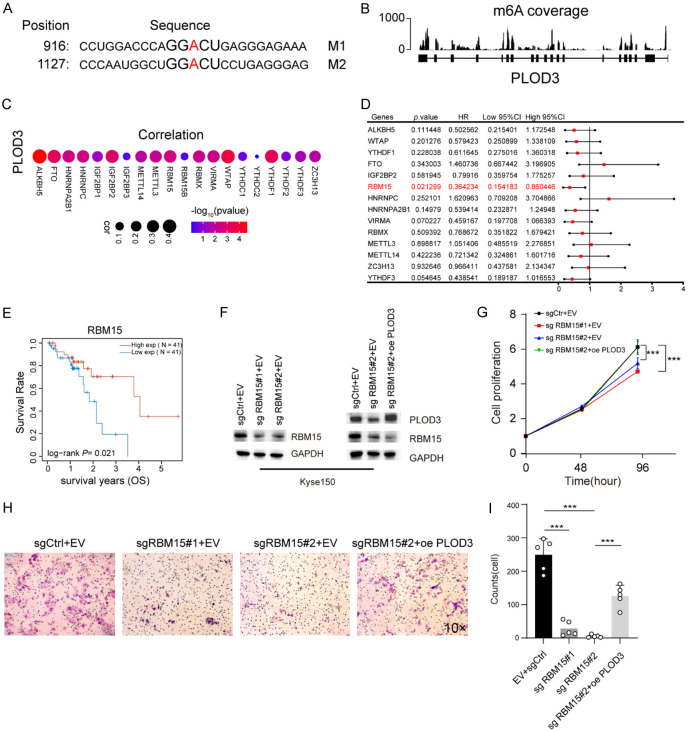
We used the sequence-based SRAMP database of m6A modification site predictors (https://www.cuilab.cn/sramp) to predict the m6A locus in PLOD3 mRNA in order to better explore the mechanism underlying the expression of PLOD3 in ESCC cells. The results showed that two m6A recognition sites with high confidence in the coding sequence (CDS) of PLOD3 (Figure 6A). We further confirmed m6A modification on PLOD3 mRNA through GETx database (Figure 6B). Given the potential role of m6A on PLOD3, we want to know which m6A regulator modulate PLOD3 expression in ESCC. Correlation analysis revealed that 14 m6A regulators were significantly correlated with PLOD3 (Figure 6C). Next, we analyzed the correlation of these 14 genes with prognosis in ESCC and found that the expression of RBM15 was significantly associated with favorable prognosis (Figure 6D, 6E). Therefore, we hypothesized that RBM15 may regulate PLOD3 expression in ESCC cells. To confirm this, we measured the expression of PLOD3 in ESCC cells after the knockdown of RBM15. Upon RBM15 knockdown, PLOD3 displayed an apparent decrease in ESCC cells (Supplementary Figure 3A, 3B). To further validate the regulatory role of RBM15 on PLOD3 in ESCC cell lines, we conducted rescue experiments by overexpressing PLOD3 in RBM15 knockdown Kyse150 cells via lentiviral transduction. Western blot was performed to assess the efficiency of lentiviral infection (Figure 6F). The results demonstrated that PLOD3 overexpression significantly rescued cell proliferation in RBM15 knockdown Kyse150 cells (Figure 6G). Similarly, when PLOD3 was overexpressed in RBM15 knockdown cells, it was observed that PLOD3 rescued the decrease in cell invasion caused by RBM15 knockdown (Figure 6H, 6I). These findings suggest that RBM15 plays a critical role in mediating the oncogenic functions of PLOD3, particularly in promoting cell proliferation and invasion in ESCC cells.
Figure 6.
RBM15 regulates PLOD3 expression in ESCC. A. The m6A methylation sites in the PLOD3 sequence are predicted by the bioinformatics site SRAMP. B. The coverage plots of m6A based on the GETx database. C. Correlation between PLOD3 expression and m6A regulators in TCGA-ESCC. D. Forest showing the prognosis of the m6A regulators in ESCC. E. The overall survival (OS) curve of high- and low-RBM15 groups in TCGA ESCC data set. F. PLOD3 and RBM15 expression in Kyse150 infected by lentivirus were determined by Western blot (oe: overexpression, sg: small guide RNA). G. The effect of RBM15 knockdown and PLOD3 overexpression on the proliferation of Kyse150. H, I. The effect of RBM15 knockdown and PLOD3 overexpression on the invasion of Kyse150 (Magnification, ×10).
RBM15 increase tumor-infiltrating CD4+ T cell in ESCC
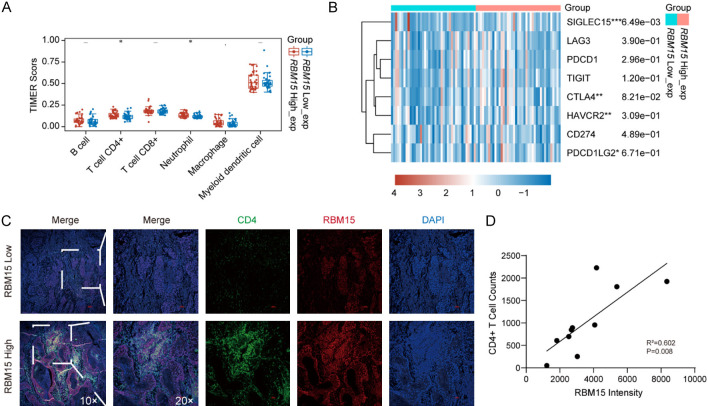
Given that RBM15 positively regulate PLOD3, we investigated whether RBM15 expression in ESCC was also associated with CD4+ T cell abundance. The results showed that infiltrated CD4+ T cells and neutrophils were significantly higher in the RBM15-high subgroup, which is consistent with PLOD3 results (Figure 7A). Further, we also shown that the expression levels of SIGLEC15 was higher in the RBM15-high group than the RBM15-low group (Figure 7B). There was no difference in other genes between the two groups (Figure 7B). These results indicated that RBM15 affects tumor-infiltrating CD4+ T cell in ESCC through modulating PLOD3 expression. To further investigate the relationship between RBM15 expression and CD4+ T cell infiltration, we performed a similar analysis using immunofluorescence staining for RBM15. The correlation between RBM15 intensity and CD4+ T cell counts was assessed. As shown in the scatter plot, a positive correlation was observed between RBM15 expression and CD4+ T cell counts. Linear regression analysis revealed a coefficient of determination (R2=0.602), indicating a moderate correlation, with a statistically significant p-value of 0.008. These results suggest that RBM15 expression may also be linked to CD4+ T cell infiltration within the tumor microenvironment (Figure 7C, 7D).
Figure 7.
Analysis of the RBM15-mediated immune microenvironment. A. Immune cell infiltration analysis of RBM15 in ESCC. B. Analysis of immune check loci in high- and low-RBM15 groups. C. Representative IF images (Magnification, ×10, ×20) for CD4+ T cells infiltration in high- and low-RBM15 groups. D. Correlation between RBM15 intensity and CD4+ T cell counts. *P < 0.05, **P < 0.01, ***P < 0.001.
Validation of prognostic value of PLOD3 and RBM15 expression in ESCC
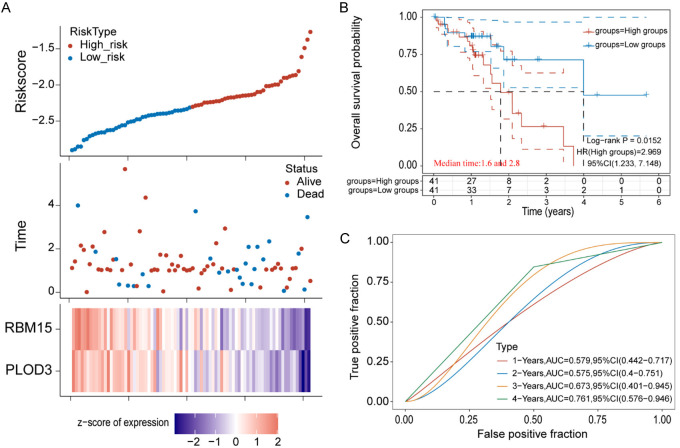
To confirm the prognostic value of PLOD3 and RBM15, these two genes were subjected to univariate Cox and multivariate Cox regression. The Cox risk model was built and each patient’s risk score was computed based on the expression of PLOD3 and RBM15. Subgroups of high- and low-risk patients were identified based on the median risk score (Figure 8A). Compared to patients in the low-risk group, individuals in the high-risk group saw worse outcomes (Figure 8B). We found that the two prognostic signatures were negatively associated with risk score (Figure 8B), indicating that low levels of these genes could predict a high-risk score in ESCC. Using the ROC curve, the area under the curve ranged from 0.579 to 0.761 for 1-, 2-, 3-, and 4-year prognoses (Figure 8C). Our findings suggest that PLOD3 and RBM15 could be an effective two-gene prognostic signature to be used in ESCC.
Figure 8.
Establishment of prognostic signature based on RBM15 and PLOD3 expression in TCGA-ESCC. A. The rick score distribution, survival statue of patients, and heatmap of prognostic gene distribution in the training cohort. B. The OS of high- and low-risk group. C. ROC curves of the training set for 1-, 2-, 3- and 4-year survival.
Discussion
ESCC is a complex disease involving multiple gene alterations and aberrant overexpression of oncogenic proteins. A comprehensive transcriptomic and proteomic analysis of ESCC can provide more reliable information than that obtained from the proteome or transcriptome alone. In this study, we integrated transcriptomic and proteomic data to explore potential diagnostic markers for ESCC. Our results showed that PLOD3 was upregulated at both the mRNA and protein levels in ESCC tissues. High PLOD3 expression was associated with favorable prognosis in patients with ESCC. Further analysis showed that PLOD3 expression was associated with CD4+ T cell infiltration in ESCC tissues. Subsequent analysis demonstrated that RBM15 promotes PLOD3 expression in ESCC cells.
Recently, an increasing number of omics approaches have been applied to diagnose cancer and predict differentiation and progression. Differentially expressed proteins were discovered by Wang et al. to be engaged in metabolic processes and pathways associated with the extracellular matrix (ECM) via iTRAQ and 2D-LC-MS/MS techniques [26]. Similarly, in our proteomics analyses, we found that metabolism- and ECM-related proteins were the most distinctly differentiated between ESCC tumors and adjacent tissues. Furthermore, we combined transcriptomic and proteomic data to identify differentially expressed transcripts and proteins between healthy and diseased tissue, but few genes showed consistent expression at the transcriptional and translational levels (Figure 1B). Such results may have occurred due to clinical heterogeneity among ESCC tumors, post-transcriptional mRNA modifications, or protein modifications [27-29]. Combining the omics results and clinical features, we found that PLOD3 expression was significantly correlated with ESCC prognosis. PLOD3 overexpression relative to healthy tissue has been reported in gastric, colorectal, pancreatic, and lung cancers [30-33], and in our present findings. Notably, high PLOD3 expression was associated with favorable prognosis in ESCC, which is inconsistent with results for hepatocellular carcinoma and lung cancer [33,34]. This discrepancy may be due to tissue-specific effects. The PLOD3-STAT3 interaction in lung cancer is linked to disease progression and a dismal prognosis [33]. However, STAT3β, one of the two STAT3 isoforms, is an independent protective prognostic factor in ESCC patients that has a significant association with longer overall survival and recurrence-free survival [35]. The function of PLOD3 will likely change due to the tissue-specific gene expression.
Several studies have indicated that PLOD3 is involved in cell proliferation, migration, and invasion [36-38]. The results of this study align with those of earlier investigations. Tumor progression is associated with abnormal cell differentiation. Interestingly, the experimental results obtained in the present study indicate that high expression of PLOD3 in ESCC cells can promote tumor cell proliferation and invasion, contradicting our findings that high PLOD3 expression indicates positive ESCC prognosis. This suggests that PLOD3 can inhibit ESCC progression through pathways other than invasion and proliferation. In this study, ESCC samples were divided into high- and low-expression groups according to PLOD3 expression, and a series of DEGs between the groups was identified. These DEGs were mainly enriched in extracellular structure organization, extracellular matrix organization, epidermis development, skin development, and epidermal cell differentiation. In comparison to individuals with high and moderate differentiation, patients with esophageal cancer who have poor differentiation have a worse prognosis [39]. Thus, our results suggest that abnormal epidermal cell differentiation and development caused by low PLOD3 levels may have been partially responsible for the poor prognosis of these patients.
Tumor-infiltrating immune cells play a critical role in cancer development and closely associated with clinical outcome [40,41]. A higher density of CD4+ T cells within the tumor is associated with a more favorable prognosis and improved survival rates in many cancers [42]. In colorectal cancer, higher levels of CD4+ T cell infiltration have been correlated with better outcomes and longer overall survival [43]. Here, we found that the abundance of infiltrated CD4+ T cells were significantly higher in PLOD3-high subgroup than in the PLOD3-low subgroup, and the PLOD3-high subgroup had a favorable outcome. Our results consistent with the colorectal cancer study. These results suggested that high PLOD3 levels were associated with more infiltrating CD4+ T cells through ECM, potentially explaining why high PLOD3 expression was correlated with favorable outcome in ESCC.
Dysregulation of m6A regulators has been observed in tumor, and their altered expression is associated with tumor progression, metastasis, and prognosis [44]. RBM15 promotes cell proliferation, invasion and accelerate the malignant progression of laryngeal squamous cell carcinoma (LSCC) through altering TMBIM6 stability [23]. In this study, we found that RBM15 positively regulates PLOD3 expression and high expression of RBM15 predicted a favorable overall survival rate in patients with ESCC. This result is different from LSCC study, may be a result of different tissue system. It is not clear at this point whether RBM15 directly binding to m6A site in PLOD3, then promotes its expression. This should be evaluated further.
Although the present study reveals the pattern of PLOD3 and RBM15 expression and its potential clinical significance in ESCC, it has some limitations. For instance, additional clinical and paired adjacent normal tissues need to be gathered to identify the expression of immune response genes, PLOD3, and RBM15 in ESCC. Co-culture of ESCC cells and activated immune cells should be performed to investigate the functions of infiltrated immune cells in ESCC. Additional research is needed to clarify the mechanism by which PLOD3 regulates cell proliferation, migration, and invasion. Finally, because some analyses were performed retrospectively, missing data were inevitable, leading to a limited sample size during the selection of participants. Larger sample numbers are thus needed for additional research.
Conclusion
In summary, our results show that RBM15 promote tumor-infiltrating CD4+ T cell abundance by regulating PLOD3 expression. We also present PLOD3 and RBM15 as two novel molecular biomarkers for predicting the prognosis and overall survival in ESCC, with the potential to optimize treatment decisions. Further prospective cohort studies are warranted to elucidate this association, and further research should be performed to investigate the prognostic value of PLOD3 and RBM15 in ESCC.
Acknowledgements
The authors would like to thank their colleagues for their helpful ideas regarding this work. This work was supported by the National Natural Science Foundation of China (Nos. 82203738, 81500128), and Huai’an Natural Science Research Program (No. HAB202110).
To take part in this study, the patients/participants gave their written informed consent.
Disclosure of conflict of interest
The authors declare that the research was conducted in the absence of any commercial or financial relationships that could be construed as a potential conflict of interest.
Supplementary Table 1 and Supplementary Figures 1-3
Supplementary Table 2
Supplementary Table 3
Supplementary Table 4
References
- 1.Sung H, Ferlay J, Siegel RL, Laversanne M, Soerjomataram I, Jemal A, Bray F. Global cancer statistics 2020: GLOBOCAN estimates of incidence and mortality worldwide for 36 cancers in 185 countries. CA Cancer J Clin. 2021;71:209–249. doi: 10.3322/caac.21660. [DOI] [PubMed] [Google Scholar]
- 2.Agrawal N, Jiao Y, Bettegowda C, Hutfless SM, Wang Y, David S, Cheng Y, Twaddell WS, Latt NL, Shin EJ, Wang LD, Wang L, Yang W, Velculescu VE, Vogelstein B, Papadopoulos N, Kinzler KW, Meltzer SJ. Comparative genomic analysis of esophageal adenocarcinoma and squamous cell carcinoma. Cancer Discov. 2012;2:899–905. doi: 10.1158/2159-8290.CD-12-0189. [DOI] [PMC free article] [PubMed] [Google Scholar]
- 3.Vingeliene S, Chan DSM, Vieira AR, Polemiti E, Stevens C, Abar L, Navarro Rosenblatt D, Greenwood DC, Norat T. An update of the WCRF/AICR systematic literature review and meta-analysis on dietary and anthropometric factors and esophageal cancer risk. Ann Oncol. 2017;28:2409–2419. doi: 10.1093/annonc/mdx338. [DOI] [PMC free article] [PubMed] [Google Scholar]
- 4.He S, Xu J, Liu X, Zhen Y. Advances and challenges in the treatment of esophageal cancer. Acta Pharm Sin B. 2021;11:3379–3392. doi: 10.1016/j.apsb.2021.03.008. [DOI] [PMC free article] [PubMed] [Google Scholar]
- 5.Dinh HQ, Pan F, Wang G, Huang QF, Olingy CE, Wu ZY, Wang SH, Xu X, Xu XE, He JZ, Yang Q, Orsulic S, Haro M, Li LY, Huang GW, Breunig JJ, Koeffler HP, Hedrick CC, Xu LY, Lin DC, Li EM. Integrated single-cell transcriptome analysis reveals heterogeneity of esophageal squamous cell carcinoma microenvironment. Nat Commun. 2021;12:7335. doi: 10.1038/s41467-021-27599-5. [DOI] [PMC free article] [PubMed] [Google Scholar]
- 6.Wang T, Lu R, Kapur P, Jaiswal BS, Hannan R, Zhang Z, Pedrosa I, Luke JJ, Zhang H, Goldstein LD, Yousuf Q, Gu YF, McKenzie T, Joyce A, Kim MS, Wang X, Luo D, Onabolu O, Stevens C, Xie Z, Chen M, Filatenkov A, Torrealba J, Luo X, Guo W, He J, Stawiski E, Modrusan Z, Durinck S, Seshagiri S, Brugarolas J. An empirical approach leveraging tumorgrafts to dissect the tumor microenvironment in renal cell carcinoma identifies missing link to prognostic inflammatory factors. Cancer Discov. 2018;8:1142–1155. doi: 10.1158/2159-8290.CD-17-1246. [DOI] [PMC free article] [PubMed] [Google Scholar]
- 7.Cioni B, Zaalberg A, van Beijnum JR, Melis MHM, van Burgsteden J, Muraro MJ, Hooijberg E, Peters D, Hofland I, Lubeck Y, de Jong J, Sanders J, Vivie J, van der Poel HG, de Boer JP, Griffioen AW, Zwart W, Bergman AM. Androgen receptor signalling in macrophages promotes TREM-1-mediated prostate cancer cell line migration and invasion. Nat Commun. 2020;11:4498. doi: 10.1038/s41467-020-18313-y. [DOI] [PMC free article] [PubMed] [Google Scholar]
- 8.Cox TR. The matrix in cancer. Nat Rev Cancer. 2021;21:217–238. doi: 10.1038/s41568-020-00329-7. [DOI] [PubMed] [Google Scholar]
- 9.Xiong G, Stewart RL, Chen J, Gao T, Scott TL, Samayoa LM, O’Connor K, Lane AN, Xu R. Collagen prolyl 4-hydroxylase 1 is essential for HIF-1alpha stabilization and TNBC chemoresistance. Nat Commun. 2018;9:4456. doi: 10.1038/s41467-018-06893-9. [DOI] [PMC free article] [PubMed] [Google Scholar]
- 10.Fang M, Yuan J, Peng C, Li Y. Collagen as a double-edged sword in tumor progression. Tumour Biol. 2014;35:2871–2882. doi: 10.1007/s13277-013-1511-7. [DOI] [PMC free article] [PubMed] [Google Scholar]
- 11.Zhou J, Yang Y, Zhang H, Luan S, Xiao X, Li X, Fang P, Shang Q, Chen L, Zeng X, Yuan Y. Overexpressed COL3A1 has prognostic value in human esophageal squamous cell carcinoma and promotes the aggressiveness of esophageal squamous cell carcinoma by activating the NF-kappaB pathway. Biochem Biophys Res Commun. 2022;613:193–200. doi: 10.1016/j.bbrc.2022.05.029. [DOI] [PubMed] [Google Scholar]
- 12.Pollard JW. Tumour-educated macrophages promote tumour progression and metastasis. Nat Rev Cancer. 2004;4:71–78. doi: 10.1038/nrc1256. [DOI] [PubMed] [Google Scholar]
- 13.Romer AMA, Thorseth ML, Madsen DH. Immune modulatory properties of collagen in cancer. Front Immunol. 2021;12:791453. doi: 10.3389/fimmu.2021.791453. [DOI] [PMC free article] [PubMed] [Google Scholar]
- 14.Li SS, Lian YF, Huang YL, Huang YH, Xiao J. Overexpressing PLOD family genes predict poor prognosis in gastric cancer. J Cancer. 2020;11:121–131. doi: 10.7150/jca.35763. [DOI] [PMC free article] [PubMed] [Google Scholar]
- 15.Qi Q, Huang W, Zhang H, Zhang B, Sun X, Ma J, Zhu C, Wang C. Bioinformatic analysis of PLOD family member expression and prognostic value in non-small cell lung cancer. Transl Cancer Res. 2021;10:2707–2724. doi: 10.21037/tcr-21-73. [DOI] [PMC free article] [PubMed] [Google Scholar]
- 16.Gjaltema RA, Bank RA. Molecular insights into prolyl and lysyl hydroxylation of fibrillar collagens in health and disease. Crit Rev Biochem Mol Biol. 2017;52:74–95. doi: 10.1080/10409238.2016.1269716. [DOI] [PubMed] [Google Scholar]
- 17.Qi Y, Xu R. Roles of PLODs in collagen synthesis and cancer progression. Front Cell Dev Biol. 2018;6:66. doi: 10.3389/fcell.2018.00066. [DOI] [PMC free article] [PubMed] [Google Scholar]
- 18.Scietti L, Chiapparino A, De Giorgi F, Fumagalli M, Khoriauli L, Nergadze S, Basu S, Olieric V, Cucca L, Banushi B, Profumo A, Giulotto E, Gissen P, Forneris F. Molecular architecture of the multifunctional collagen lysyl hydroxylase and glycosyltransferase LH3. Nat Commun. 2018;9:3163. doi: 10.1038/s41467-018-05631-5. [DOI] [PMC free article] [PubMed] [Google Scholar]
- 19.Heikkinen J, Risteli M, Wang C, Latvala J, Rossi M, Valtavaara M, Myllyla R. Lysyl hydroxylase 3 is a multifunctional protein possessing collagen glucosyltransferase activity. J Biol Chem. 2000;275:36158–36163. doi: 10.1074/jbc.M006203200. [DOI] [PubMed] [Google Scholar]
- 20.Deng X, Pan Y, Yang M, Liu Y, Li J. PLOD3 is associated with immune cell infiltration and genomic instability in colon adenocarcinoma. Biomed Res Int. 2021;2021:4714526. doi: 10.1155/2021/4714526. [DOI] [PMC free article] [PubMed] [Google Scholar]
- 21.Baek JH, Yun HS, Kwon GT, Lee J, Kim JY, Jo Y, Cho JM, Lee CW, Song JY, Ahn J, Kim JS, Kim EH, Hwang SG. PLOD3 suppression exerts an anti-tumor effect on human lung cancer cells by modulating the PKC-delta signaling pathway. Cell Death Dis. 2019;10:156. doi: 10.1038/s41419-019-1405-8. [DOI] [PMC free article] [PubMed] [Google Scholar]
- 22.Jiang X, Liu B, Nie Z, Duan L, Xiong Q, Jin Z, Yang C, Chen Y. The role of m6A modification in the biological functions and diseases. Signal Transduct Target Ther. 2021;6:74. doi: 10.1038/s41392-020-00450-x. [DOI] [PMC free article] [PubMed] [Google Scholar]
- 23.Wang X, Tian L, Li Y, Wang J, Yan B, Yang L, Li Q, Zhao R, Liu M, Wang P, Sun Y. RBM15 facilitates laryngeal squamous cell carcinoma progression by regulating TMBIM6 stability through IGF2BP3 dependent. J Exp Clin Cancer Res. 2021;40:80. doi: 10.1186/s13046-021-01871-4. [DOI] [PMC free article] [PubMed] [Google Scholar]
- 24.Cai X, Chen Y, Man D, Yang B, Feng X, Zhang D, Chen J, Wu J. RBM15 promotes hepatocellular carcinoma progression by regulating N6-methyladenosine modification of YES1 mRNA in an IGF2BP1-dependent manner. Cell Death Discov. 2021;7:315. doi: 10.1038/s41420-021-00703-w. [DOI] [PMC free article] [PubMed] [Google Scholar]
- 25.Thike AA, Chng MJ, Fook-Chong S, Tan PH. Immunohistochemical expression of hormone receptors in invasive breast carcinoma: correlation of results of H-score with pathological parameters. Pathology. 2001;33:21–25. [PubMed] [Google Scholar]
- 26.Wang X, Peng Y, Xie M, Gao Z, Yin L, Pu Y, Liu R. Identification of extracellular matrix protein 1 as a potential plasma biomarker of ESCC by proteomic analysis using iTRAQ and 2D-LC-MS/MS. Proteomics Clin Appl. 2017;11 doi: 10.1002/prca.201600163. [DOI] [PubMed] [Google Scholar]
- 27.Ma Y, He S, Gao A, Zhang Y, Zhu Q, Wang P, Yang B, Yin H, Li Y, Song J, Yue P, Li M, Zhang D, Liu Y, Wang X, Guo M, Jiao Y. Methylation silencing of TGF-beta receptor type II is involved in malignant transformation of esophageal squamous cell carcinoma. Clin Epigenetics. 2020;12:25. doi: 10.1186/s13148-020-0819-6. [DOI] [PMC free article] [PubMed] [Google Scholar]
- 28.Teng H, Xue M, Liang J, Wang X, Wang L, Wei W, Li C, Zhang Z, Li Q, Ran X, Shi X, Cai W, Wang W, Gao H, Sun Z. Inter- and intratumor DNA methylation heterogeneity associated with lymph node metastasis and prognosis of esophageal squamous cell carcinoma. Theranostics. 2020;10:3035–3048. doi: 10.7150/thno.42559. [DOI] [PMC free article] [PubMed] [Google Scholar]
- 29.Lin L, Lin DC. Biological significance of tumor heterogeneity in esophageal squamous cell carcinoma. Cancers (Basel) 2019;11:1156. doi: 10.3390/cancers11081156. [DOI] [PMC free article] [PubMed] [Google Scholar]
- 30.Schiarea S, Solinas G, Allavena P, Scigliuolo GM, Bagnati R, Fanelli R, Chiabrando C. Secretome analysis of multiple pancreatic cancer cell lines reveals perturbations of key functional networks. J Proteome Res. 2010;9:4376–4392. doi: 10.1021/pr1001109. [DOI] [PubMed] [Google Scholar]
- 31.Nicastri A, Gaspari M, Sacco R, Elia L, Gabriele C, Romano R, Rizzuto A, Cuda G. N-glycoprotein analysis discovers new up-regulated glycoproteins in colorectal cancer tissue. J Proteome Res. 2014;13:4932–4941. doi: 10.1021/pr500647y. [DOI] [PubMed] [Google Scholar]
- 32.Cheng L, Wang P, Yang S, Yang Y, Zhang Q, Zhang W, Xiao H, Gao H, Zhang Q. Identification of genes with a correlation between copy number and expression in gastric cancer. BMC Med Genomics. 2012;5:14. doi: 10.1186/1755-8794-5-14. [DOI] [PMC free article] [PubMed] [Google Scholar]
- 33.Baek JH, Yun HS, Kwon GT, Kim JY, Lee CW, Song JY, Um HD, Kang CM, Park JK, Kim JS, Kim EH, Hwang SG. PLOD3 promotes lung metastasis via regulation of STAT3. Cell Death Dis. 2018;9:1138. doi: 10.1038/s41419-018-1186-5. [DOI] [PMC free article] [PubMed] [Google Scholar]
- 34.Yang B, Zhao Y, Wang L, Zhao Y, Wei L, Chen D, Chen Z. Identification of PLOD family genes as novel prognostic biomarkers for hepatocellular carcinoma. Front Oncol. 2020;10:1695. doi: 10.3389/fonc.2020.01695. [DOI] [PMC free article] [PubMed] [Google Scholar]
- 35.Zhang HF, Chen Y, Wu C, Wu ZY, Tweardy DJ, Alshareef A, Liao LD, Xue YJ, Wu JY, Chen B, Xu XE, Gopal K, Gupta N, Li EM, Xu LY, Lai R. The opposing function of STAT3 as an oncoprotein and tumor suppressor is dictated by the expression status of STAT3beta in esophageal squamous cell carcinoma. Clin Cancer Res. 2016;22:691–703. doi: 10.1158/1078-0432.CCR-15-1253. [DOI] [PubMed] [Google Scholar]
- 36.Li WH, Huang K, Wen FB, Cui GH, Guo HZ, Zhao S. PLOD3 regulates the expression of YAP1 to affect the progression of non-small cell lung cancer via the PKCδ/CDK1/LIMD1 signaling pathway. Lab Invest. 2022;102:440–451. doi: 10.1038/s41374-021-00674-7. [DOI] [PubMed] [Google Scholar]
- 37.Tsai CK, Huang LC, Tsai WC, Huang SM, Lee JT, Hueng DY. Overexpression of PLOD3 promotes tumor progression and poor prognosis in gliomas. Oncotarget. 2018;9:15705–15720. doi: 10.18632/oncotarget.24594. [DOI] [PMC free article] [PubMed] [Google Scholar]
- 38.Shen Q, Eun JW, Lee K, Kim HS, Yang HD, Kim SY, Lee EK, Kim T, Kang K, Kim S, Min DH, Oh SN, Lee YJ, Moon H, Ro SW, Park WS, Lee JY, Nam SW. Barrier to autointegration factor 1, procollagen-lysine, 2-oxoglutarate 5-dioxygenase 3, and splicing factor 3b subunit 4 as early-stage cancer decision markers and drivers of hepatocellular carcinoma. Hepatology. 2018;67:1360–1377. doi: 10.1002/hep.29606. [DOI] [PubMed] [Google Scholar]
- 39.Wang Y, Bai G, Guo L, Chen W. Associations between apparent diffusion coefficient value with pathological type, histologic grade, and presence of lymph node metastases of esophageal carcinoma. Technol Cancer Res Treat. 2019;18:1533033819892254. doi: 10.1177/1533033819892254. [DOI] [PMC free article] [PubMed] [Google Scholar]
- 40.Gajewski TF, Schreiber H, Fu YX. Innate and adaptive immune cells in the tumor microenvironment. Nat Immunol. 2013;14:1014–1022. doi: 10.1038/ni.2703. [DOI] [PMC free article] [PubMed] [Google Scholar]
- 41.Trimaglio G, Tilkin-Mariame AF, Feliu V, Lauzeral-Vizcaino F, Tosolini M, Valle C, Ayyoub M, Neyrolles O, Vergnolle N, Rombouts Y, Devaud C. Colon-specific immune microenvironment regulates cancer progression versus rejection. Oncoimmunology. 2020;9:1790125. doi: 10.1080/2162402X.2020.1790125. [DOI] [PMC free article] [PubMed] [Google Scholar]
- 42.Borst J, Ahrends T, Babala N, Melief CJM, Kastenmuller W. CD4(+) T cell help in cancer immunology and immunotherapy. Nat Rev Immunol. 2018;18:635–647. doi: 10.1038/s41577-018-0044-0. [DOI] [PubMed] [Google Scholar]
- 43.Qin M, Chen G, Hou J, Wang L, Wang Q, Wang L, Jiang D, Hu Y, Xie B, Chen J, Wei H, Xu G. Tumor-infiltrating lymphocyte: features and prognosis of lymphocytes infiltration on colorectal cancer. Bioengineered. 2022;13:14872–14888. doi: 10.1080/21655979.2022.2162660. [DOI] [PMC free article] [PubMed] [Google Scholar]
- 44.Deng LJ, Deng WQ, Fan SR, Chen MF, Qi M, Lyu WY, Qi Q, Tiwari AK, Chen JX, Zhang DM, Chen ZS. m6A modification: recent advances, anticancer targeted drug discovery and beyond. Mol Cancer. 2022;21:52. doi: 10.1186/s12943-022-01510-2. [DOI] [PMC free article] [PubMed] [Google Scholar]
Associated Data
This section collects any data citations, data availability statements, or supplementary materials included in this article.


