Abstract
Bladder cancer is the most common malignant tumor of the urinary system. Currently, treatment strategies for bladder cancer remain limited, highlighting the urgent need to explore novel therapeutic approaches. Sotorasib, the first successful small molecule drug targeting KRAS, has been approved for treating non-small cell lung cancer (NSCLC), but it has not yet been studied in bladder cancer. Additionally, glucose metabolism-related proteins, such as GLUT1, PKM2, and LDHA are highly expressed in most bladder cancer cell lines, promoting tumor progression. KRASG12D mutant cells exhibit enhanced glucose uptake and glycolysis. However, little is known about whether KRASG12C mutant cells exhibit enhanced glucose metabolism. Various techniques, including glucose and lactate analysis, Seahorse assay, western blot, qRT-PCR, and immunofluorescence, were used to investigate whether Sotorasib can inhibit glucose metabolism in bladder cancer cells. The results demonstrated that Sotorasib significantly inhibited glucose metabolism in KRASG12C mutant bladder cancer, both in vitro and in vivo, but not in wild-type bladder cancer. Furthermore, Sotorasib’s inhibition of glucose metabolism was associated with suppressing the degradation of thioredoxin-interacting protein (TXNIP), a negative regulator of glucose metabolism. Additionally, Sotorasib increased TXNIP expression by regulating the RAS/RAF/ERK axis. This study uncovers the mechanism by which Sotorasib inhibits glucose metabolism in KRASG12C mutant bladder cancer cells and suggests a potential therapeutic benefit for the treatment of KRASG12C mutant bladder cancer.
Keywords: Bladder cancer, Sotorasib, KRASG12C mutation, glucose metabolism, TXNIP
Introduction
Bladder cancer is the most common malignant tumor of the urinary system, ranking first in incidence among urinary system tumors in China and second to prostate cancer in Western countries. The number of new bladder cancer cases is increasing globally [1,2]. Therefore, exploring novel therapeutic approaches is urgently needed. The Warburg effect is characteristic of both non-muscle-invasive bladder cancer (NMIBC) and muscle-invasive bladder cancer (MIBC). Studies have shown that glucose metabolism-related proteins, such as LDHA and GLUT1, are highly expressed in most bladder cancer cell lines, promoting tumor progression [3,4]. Additionally, the high expression of PKM2 facilitates bladder cancer growth and maintenance [5]. However, few therapeutic strategies are currently available to inhibit glucose metabolism in bladder cancer.
KRAS mutations occur with a certain frequency in bladder cancer, with the KRASG12C mutation detected in urothelial carcinoma in situ [6,7]. KRAS mutations primarily occur at codon 12 in bladder cancer [8,9]. These mutations act as carcinogenic drivers [6,10]; alterations in KRAS proteins impede their interaction with GTPase-activating proteins (GAPs) and the hydrolysis of GTP bound to KRAS, leaving the protein in a constitutively active state [11,12]. Activated KRAS can trigger multiple signaling pathways, including RAF-MEK-ERK and PI3K-AKT-mTOR pathways [13,14]. KRAS mutations also impact immune cells in the tumor microenvironment (TME), ultimately contributing to tumor progression and immune evasion [15]. Some studies have shown that KRAS mutant pancreatic and lung cancer cells, such as those with the KRASG12D mutation, exhibit enhanced glucose uptake and glycolysis, with GLUT1 upregulated in these cells [16,17]. Therefore, KRAS represents a potential target for suppressing glucose metabolism. However, little is known about whether KRASG12C mutant cells also exhibit enhanced glucose metabolism. The tumor suppressor TXNIP can promote the internalization of the glucose transporter GLUT1 and mediate the inhibition of GLUT1 mRNA and protein expression, thus regulating glucose metabolism in tumors [18-20]. Therefore, we will investigate whether TXNIP plays a role in this process.
Sotorasib, a KRAS G12C inhibitor, was approved for marketing by the FDA in 2021, marking a significant breakthrough in cancer treatment since RAS had long been considered an undruggable target. Sotorasib traps KRAS G12C in its inactive state, specifically and irreversibly inhibiting KRAS G12C [21]. In mechanistic studies, researchers found that Sotorasib inhibited the MAPK and PI3K-AKT-mTOR signaling pathways and reduced the expression of p-S6 in KRASG12C mutant non-small cell lung cancer and pancreatic cancer cells, while increasing the expression of the apoptosis-related protein caspase-3 [22,23]. Currently, Sotorasib is used in clinical settings for the treatment of locally advanced or metastatic non-small cell lung cancer patients with KRASG12C mutations [24,25]. However, it has not yet been utilized for the treatment of bladder cancer. In summary, we will explore whether Sotorasib can be applied to treat bladder cancer and inhibit glucose metabolism in this context.
Materials and methods
Cell culture
Human bladder cancer cells were obtained from iCell Bioscience Inc. (Shanghai, China). UMUC3 were cultivated in MEM (Gibco, Grand Island, NY) supplemented with 10% FBS (Excell Bio, China) and 1% penicillin/streptomycin in an incubator at 37°C with 5% CO2. T24 were cultivated in 5A (iCell, Shanghai, China) with the same supplements.
MTT assay
Cells were plated in 96-well plates at a density of 6.0 × 10³ cells per well. After 12 h, the cells were either treated with Sotorasib or FDP (fructose-1,6-diphosphate) or left untreated for 24, 48, or 72 h. Subsequently, 50 μL of MTT solution (2 mg/mL, Sigma-Aldrich, St. Louis, MO) was added to each well and incubated for 5 h. Finally, 150 μL of dimethyl sulfoxide (DMSO) was added, and the absorbance was measured at 490 nm using a microplate reader (BioTek, SYNERGY HTX, VT, USA).
Clonogenic assay
For a different assay, cells were plated in 24-well plates at a density of 2.0 × 10³ cells per well. After 12 h, the cells were either treated with Sotorasib or FDP or left untreated and incubated for 5 to 7 days. Following incubation, 10% paraformaldehyde solution was added to fix the cells, and then 0.1% crystal violet was used to stain them. Absorbance was measured at 550 nm using a microplate reader (BioTek, SYNERGY HTX, VT, USA), and images of the cells were captured.
Western blot
Protein samples were resolved by SDS-PAGE and transferred to PVDF membranes, where they were probed with primary antibodies. Peroxidase-conjugated anti-rabbit or anti-mouse antibodies were used as secondary antibodies, and the antigen-antibody reactions were visualized using the ChemiDoc system (Bio-Rad, Hercules, CA, USA). The antibodies used are detailed in the Supplementary Table 1. The blot intensities were quantified using ImageJ, and the data were normalized to the loading control with an antibody against β-actin.
Immunoprecipitation
Briefly, 1.0 × 10⁷ cells in a bottle were collected and lysed using a non-denaturing lysis buffer (Solarbio, Beijing, China). After a 30-min incubation on ice, the lysate was centrifuged, and the supernatant was collected. The supernatant was then blocked with protein A/G (Santa Cruz, Dallas, TX) for 1 h. Following another centrifugation, antibodies or normal IgG were added to the supernatant and incubated overnight at 4°C. Protein A/G was added again to bind the antibody and incubated for 1 h. Protein A/G was then collected by centrifugation and washed four times with lysis buffer. A sample loading buffer (2 ×) was mixed with the beads and boiled for 10 min. The supernatant was used for western blot analysis.
Glucose analysis
Cells were plated in 6-well plates (2.5 × 10⁵ cells/well). After 48 h, the cell culture medium was replaced with DMEM (Gibco, Grand Island, NY) supplemented with 10% FBS (Excell Bio, China) and 1% penicillin/streptomycin. After 2 h, the supernatant and cell lysate were collected. Cells were counted before being lysed with lysis buffer (Beyotime, Shanghai, China). In the remaining wells, cells were treated or not treated with Sotorasib. After 24 h, the supernatant and cell lysate were collected. Then, 10 μL of the samples were mixed with 180 μL of glucose assay reagent (Beyotime, Shanghai, China). The mixture was heated at 95°C for 8 min using a high-capacity cDNA reverse transcription kit (Thermo, Shanghai, China). A total of 150 μL of the reaction mixture was added to 96-well plates. Absorbance was measured at 630 nm using a microplate reader (BioTek, SYNERGY HTX, VT, USA). The concentration of glucose in the samples was calculated based on a standard curve.
Lactate analysis
Cells were plated in 6-well plates at a density of 2.5 × 10⁵ cells per well. After 48 h, the cell culture medium was replaced with DMEM (Gibco, Grand Island, NY) supplemented with 10% FBS (Excell Bio, China) and 1% penicillin/streptomycin. The supernatant and cell lysate were collected after 2 h. Cells were counted before being lysed with lysis buffer (Beyotime, Shanghai, China). In the remaining wells, cells were either treated or not treated with Sotorasib. After 24 h, the supernatant and cell lysate were collected again. Subsequently, 5-μL samples were transferred into 96-well plates. Each reagent from the lactate assay kit (Elabscience, Wuhan, China) was added sequentially. Absorbance was measured at 530 nm using a microplate reader (BioTek, SYNERGY HTX, VT, USA). Lactate concentration in the samples was calculated based on a standard curve.
qRT-PCR
RNA was extracted using Trizol reagent. Complementary DNA (cDNA) was synthesized using a high-capacity cDNA reverse transcription kit (Thermo, Shanghai, China). Quantitative RT-PCR (qRT-PCR) was performed using TaqMan Gene Expression Master Mix (Bio-Rad, Shanghai, China). The sequences of the primers are provided in the Supplementary Table 2.
siRNA transfection
Cells were plated in 6-well plates at a density of 2.5 × 10⁵ cells per well. After 12 h, cells were transfected with 25 nM RNAi oligonucleotides and 25 nM Negative Control siRNA (Ribobio, Shanghai, China) using Lipofectamine 6000 (Invitrogen, Eugene, USA) in the absence of FBS for 5 h. Subsequently, cells were washed with PBS, and the medium was replaced with MEM for 24 h. Proteins were then collected, and specific silencing was confirmed by western blot. The sequences of the siRNAs are provided in the Supplementary Table 3.
Immunofluorescence
Briefly, 1.0 × 10⁴ cells were seeded on glass coverslips. Cells were either treated or not treated with Sotorasib, then washed three times with PBS and fixed with 4% paraformaldehyde for 30 min. After another washing step, cells were incubated for 30 min with 4% BSA. Cells were incubated overnight at 4°C with the primary antibody. Following two PBS washes, DyLight 549-labeled secondary antibody (Proteintech, Chicago, USA) was added and incubated for 1 h. Nuclei were stained with DAPI and fixed in glycerin before being imaged using a fluorescence microscope. Fluorescence intensities were quantified using ImageJ and normalized to the loading control.
Measurement of extracellular fluxes
Cells were analyzed for glycolytic and mitochondrial function using Seahorse XF24 (Agilent, Santa Clara, CA, USA) equipped with Glycolysis Stress Test Kit (103020-100) and Mito Stress Test Kit (103015-100). Following Sotorasib treatment, 2.5 × 10⁴ cells were seeded in an XF24 well cell culture microplate and incubated overnight at 37°C under 5% CO2. Four corner wells were filled with medium for background correction. To assess oxidative respiration, the medium was replaced with 500 μL of Seahorse XF DMEM (103575-100) containing 1 mM pyruvate (103578-100), 2 mM glutamine (103579-100), and 10 mM glucose (103577-100). For glycolytic activity, 500 μL of Seahorse XF DMEM (103575-100) devoid of glucose and pyruvate was used, followed by a 1-h incubation at 37°C in a CO2-free environment. Oxygen consumption rate (OCR) and extracellular acidification rate (ECAR) were quantified using the XF24 Extracellular Flux Analyzer. ECAR measurements were performed first without additives, followed by sequential addition of glucose (10 mM), oligomycin (1 μM), and 2-DG (50 mM). OCR measurements were conducted after baseline assessments with subsequent addition of oligomycin (1.5 μM), FCCP (1 μM), and rotenone/antimycin A (0.5 μM).
Subcutaneous xenograft model study
Female BALB/c nude mice, aged 4 to 6 weeks (n=40), were procured from GemPharmatech LLC (Jiangsu, China). The study was sanctioned by the Ethics Committee of Hunan Normal University (D2023001). Mice were randomized into groups and subcutaneously injected with UMUC3 or T24 cell suspensions to create xenograft models. Tumor volumes were measured using the formula: 1/2 × long diameter × short diameter2. Treatment commenced when tumors reached 50 mm3, with mice receiving either Sotorasib or vehicle (0.5% carboxy methyl cellulose sodium) through gavage. Tumor volumes and body weights were recorded every 2 days. Following 14 days of treatment, the mice were euthanized, and their livers and kidneys were paraffin-embedded, sectioned, and histologically examined. All tumors were preserved in formalin for subsequent Ki-67 and WB analysis. The investigators were blinded to group assignments during the evaluation of the results.
Histology
Tissues were fixed with 4% paraformaldehyde for 24 h, embedded in paraffin, and sectioned to a thickness of 7 μm. Sections were stained with hematoxylin and eosin (H&E) and evaluated for disease presence. For immunohistochemistry staining, sections were deparaffinized and rehydrated sequentially in xylene, 100%, 95%, and 75% ethanol. They were then incubated with 3% H2O2 for 20 min to inhibit endogenous peroxidase activity, rinsed with PBS, and subjected to antigen retrieval in Tris-EDTA solution for 5 min in a pressure cooker. Overnight incubation at 4°C followed, using the primary antibody anti-Ki-67. After additional washes in PBS, sections were treated with Reagent 2 and Reagent 3 from the Goat Hypersensitivity Two-Step Detection Kit (ZSGB-BIO, Beijing, China), as per the manufacturer’s instructions. Staining was completed using a DAB substrate kit (Cell Signaling, Beverly, MA, USA) and counterstaining with Gill’s hematoxylin (Solarbio, Beijing, China). Finally, sections were dehydrated and mounted with neutral resins (Solarbio, China). IHC staining analysis data were quantified using Image J and normalized to the load control.
UALCAN database analysis
The relationship between the expression of glucose metabolism-related genes and the survival of bladder cancer patients was examined using the UALCAN database. TCGA database was selected and gene names were entered. Then the specific cancer type was chosen before generating the survival curves.
Statistical analysis
Data from three independent experiments were presented as mean ± SD. Statistical analyses were conducted using Graphpad Prism 6. Two-tailed unpaired Student t-tests and one-way analysis of variance (ANOVA) were applied. Variances between groups were also statistically compared. All experiments were conducted at least three times. A p-value of less than 0.05 was considered statistically significant.
Results
The survival of bladder cancer patients is negatively correlated with the expression levels of SLC2A1 (GLUT1) and PKM2
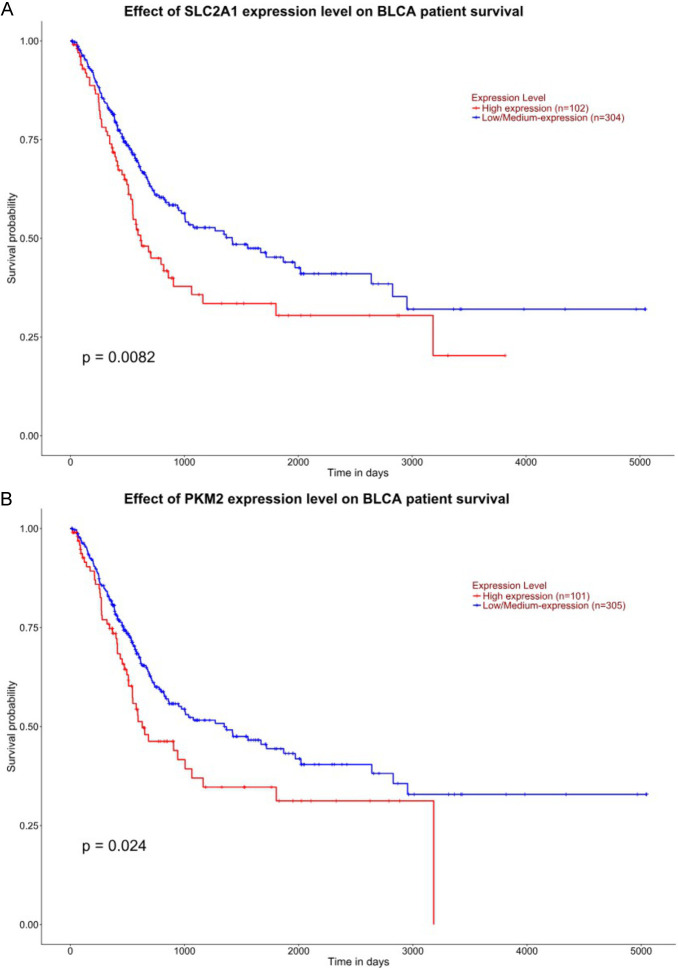
Firstly, we explored the relationship between the expression of SLC2A1 and PKM2 and the survival of bladder cancer patients using the UALCAN database [26,27]. The results indicated that the survival of bladder cancer patients is negatively correlated with the expression levels of SLC2A1 and PKM2 (Figure 1A and 1B).
Figure 1.
Relationship between the expression of SLC2A1 and PKM2 and patient survival. (A, B) UALCAN database was used to analyze the relationship between the patient survival and expression of SLC2A1 and PKM2.
KRASG12C mutant bladder cancer cells possess enhanced glucose metabolism capabilities and are more sensitive to Sotorasib
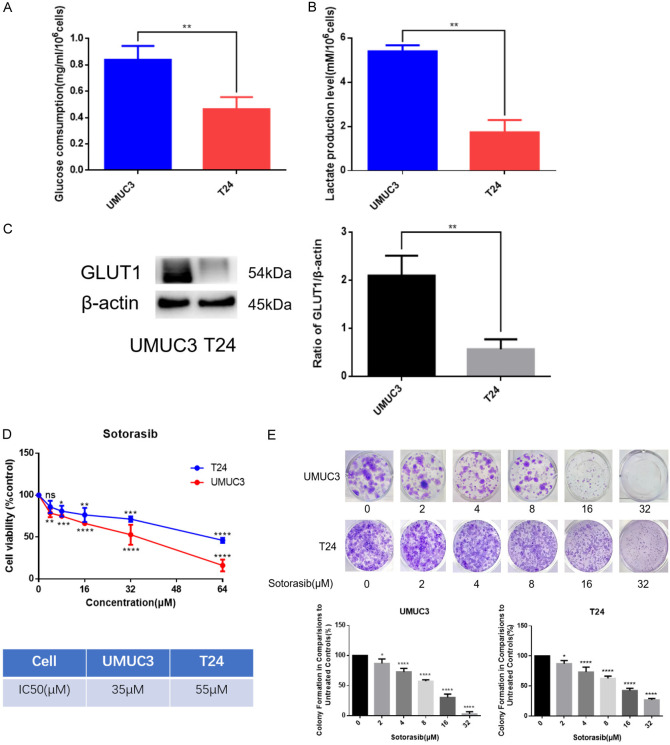
UMUC3 is a KRASG12C mutant bladder cancer cell line, while T24 is a wild-type bladder cancer cell line. We analyzed the basal levels of glucose consumption and lactate production in both UMUC3 and T24. The results demonstrated that UMUC3 exhibited higher glucose consumption and lactate production levels compared to T24 (Figure 2A and 2B). Additionally, western blot (WB) analysis revealed that GLUT1 expression was higher in UMUC3 than in T24 (Figure 2C). These findings suggested that KRASG12C mutant bladder cancer cells possess enhanced glucose metabolism capabilities.
Figure 2.
Comparison on the glucose metabolism and the sensitivity to Sotorasib of KRASG12C mutant and wild-type bladder cancer cells. (A) When UMUC3 and T24 density reached 60%-70%, the supernatant and cell lysate were collected. Cells were counted before lysed. After 24 h, the supernatant and cell lysate were collected. Then glucose consumption was detected by glucose detection kit. (B) Steps before detection were the same as those for (A). Then lactate production was detected by lactate detection kit. (C) Expression of GLUT1 in UMUC3 and T24 was detected by WB. (D) Inhibitory effects of Sotorasib on the proliferation of UMUC3 and T24 were detected by MTT assay. IC50 values were counted by SPSS 20.0. (E) Inhibitory effects of Sotorasib on the proliferation of UMUC3 and T24 were detected by colony formation assay (*P < 0.05, **P < 0.01, ***P < 0.001, ****P < 0.0001, ns not significant, n=3).
To investigate the effect of the KRASG12C mutation on sensitivity to Sotorasib, we found that Sotorasib had a stronger inhibitory effect on the proliferation of UMUC3, as evidenced by the MTT assay. The IC50 values for Sotorasib in UMUC3 and T24 were 35 μM and 55 μM, respectively (Figure 2D). Further experiments using colony formation assays confirmed that Sotorasib inhibited the proliferation of bladder cancer cells, with a more pronounced effect observed in UMUC3 (Figure 2E). These results indicated that KRASG12C mutant bladder cancer cells are more sensitive to Sotorasib.
Sotorasib inhibited glucose metabolism in KRASG12C mutant bladder cancer cells
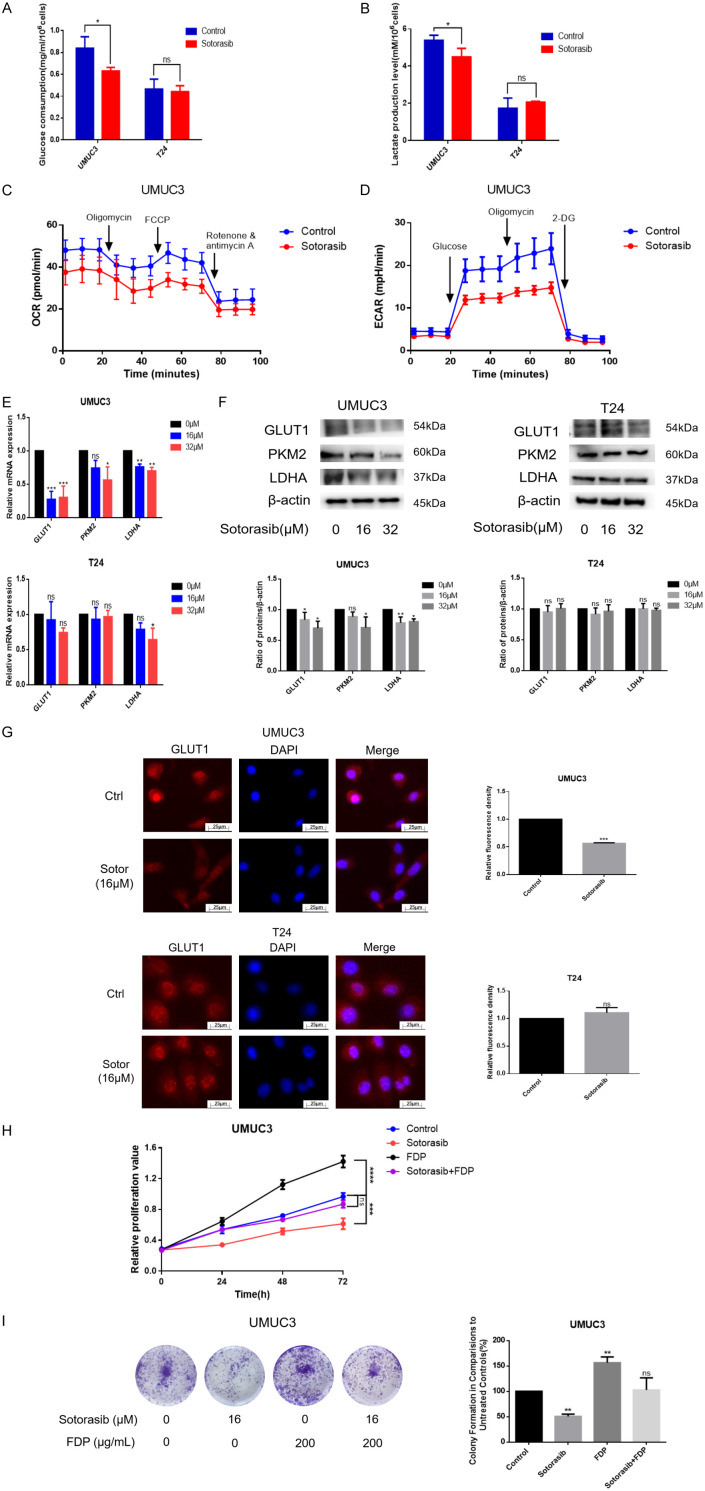
Since KRAS mutations can enhance glucose uptake and glycolysis [28,29], we speculated whether Sotorasib interferes with glucose metabolism in KRASG12C mutant bladder cancer cells. Following treatment with 16 μM Sotorasib, glucose consumption and lactate production in UMUC3 decreased by 24.9% and 16.6%, respectively, within 24 h. In contrast, glucose consumption and lactate production in T24 did not decrease (Figure 3A and 3B). The oxygen consumption rate (OCR) results indicated a decrease following Sotorasib treatment, while the extracellular acidification rate (ECAR) also declined after treatment. These results suggested that both glycolysis and oxidative phosphorylation (OXPHOS) were inhibited after Sotorasib treatment (Figure 3C and 3D). To further validate these findings, we measured the mRNA levels of glucose metabolism-related proteins using qRT-PCR. The results showed that the mRNA expression of GLUT1, PKM2, and LDHA was inhibited after treatment with 16 μM and 32 μM Sotorasib in UMUC3 but not in T24 (Figure 3E). Additionally, WB analysis demonstrated that the protein expression of GLUT1, PKM2, and LDHA was similarly inhibited in UMUC3 following 16 μM and 32 μM Sotorasib treatment, while no changes were observed in T24 (Figure 3F). Immunofluorescence results further confirmed that GLUT1 expression was inhibited in UMUC3 but not in T24 (Figure 3G). In conclusion, Sotorasib effectively inhibited glycolysis and OXPHOS in KRASG12C mutant bladder cancer cells.
Figure 3.
Impact of Sotorasib on glucose metabolism in KRASG12C mutant bladder cancer cells. (A) Glucose consumption was measured using a glucose detection kit. (B) The steps before detection were the same as (A), then lactate production was detected with a lactate detection kit. (C) UMUC3 with or without Sotorasib treatment (16 μM), were analyzed for oxygen consumption rate via Seahorse assay. (D) The extracellular acidification rate was examined using the same assay. (E and F) UMUC3 and T24 were treated with various concentrations of Sotorasib (0, 16, and 32 μM) for 12 h and underwent mRNA and protein expression analyses of GLUT1, PKM2, and LDHA by qRT-PCR and WB, respectively. (G) The expression of GLUT1 in treated or untreated UMUC3 and T24 was detected by immunofluorescence. (H and I) The proliferation of UMUC3 treated with Sotorasib (16 μM) or FDP (200 μg/mL) was monitored using MTT and colony formation assays, respectively (*P < 0.05, **P < 0.01, ***P < 0.001, ****P < 0.0001, ns not significant, n=3).
To investigate the role of glucose metabolism in the effects of Sotorasib, UMUC3 were treated with FDP (fructose-1,6-diphosphate), a glycolysis agonist, alongside Sotorasib. Cell proliferation was assessed using MTT and colony formation assays. FDP, a critical intermediate in the glycolysis pathway, enhances glucose metabolism. Our findings revealed a significant increase in UMUC3 proliferation following treatment with 200 μg/mL of FDP, which nearly abolished the inhibitory effect of Sotorasib on cell growth. These results indicated that the suppression of glucose metabolism was a key mechanism by which Sotorasib inhibited the proliferation of KRASG12C mutant bladder cancer cells (Figure 3H and 3I).
Sotorasib increased the expression of TXNIP by inhibiting its ubiquitination degradation
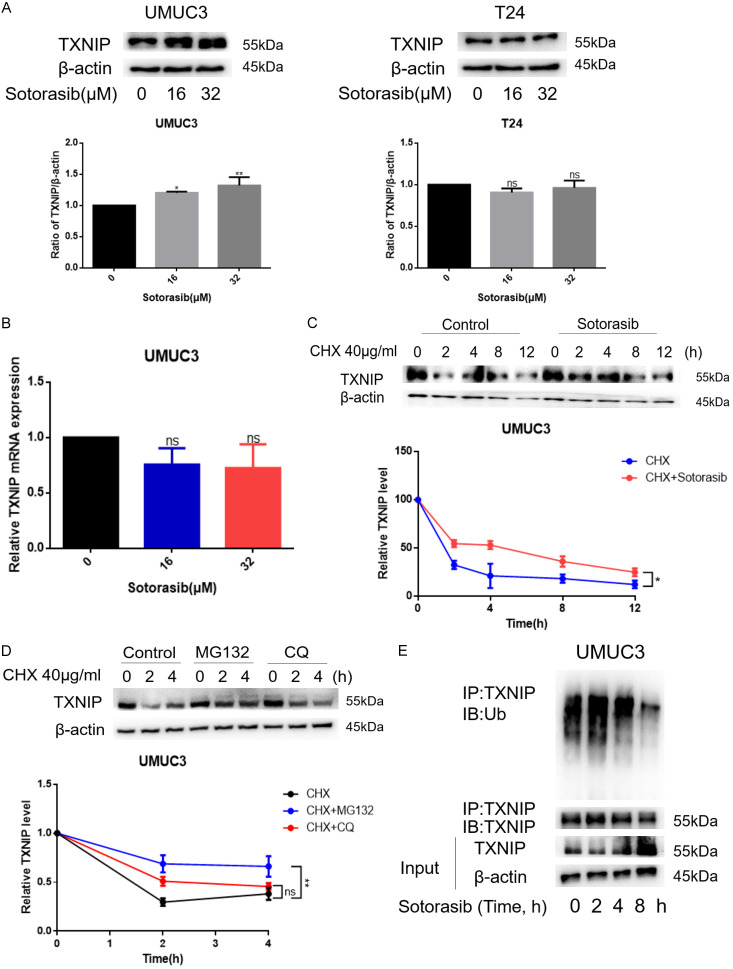
Initially, we observed an increase in TXNIP expression in UMUC3 but not in T24 (Figure 4A). To further elucidate how Sotorasib modulates TXNIP expression, we first analyzed its mRNA levels. According to Figure 4B, Sotorasib treatment did not significantly alter TXNIP mRNA levels in KRASG12C mutant bladder cancer cells, although protein levels increased following treatment. This suggested that Sotorasib may influence the post-transcriptional regulation of TXNIP. Subsequently, UMUC3 were treated with CHX (cycloheximide, a protein synthesis inhibitor) in the absence or presence of Sotorasib to explore its effect on TXNIP protein synthesis post-transcriptionally. WB results indicated that the degradation rate of TXNIP decreased following Sotorasib treatment, suggesting that Sotorasib inhibited TXNIP degradation (Figure 4C). To investigate the primary site of TXNIP degradation, UMUC3 were treated with cycloheximide (CHX) and subsequently exposed to either MG132 (a proteasome inhibitor) or chloroquine (CQ, a lysosome inhibitor). The results indicated that TXNIP degradation decreased after treatment with both MG132 and CQ, with a more significant reduction observed after MG132 treatment, suggesting that the proteasome is the primary site of TXNIP degradation (Figure 4D). Additionally, we found that TXNIP ubiquitination was reduced after Sotorasib treatment, indicating that Sotorasib inhibited the ubiquitination degradation of TXNIP (Figure 4E). Thus, Sotorasib increased the expression of TXNIP by inhibiting its ubiquitination degradation.
Figure 4.
Effect of Sotorasib on TXNIP. (A) UMUC3 and T24 were treated with Sotorasib (0, 16, and 32 μM) for 12 h. Protein expression of TXNIP was detected by WB. (B) Steps before detection were the same as (A). mRNA expression of TXNIP was detected by qRT-PCR. (C) UMUC3 were treated with CHX (40 μg/mL; 0, 2, and 4 h) and either treated or not treated with Sotorasib (16 μM; 0, 2, and 4 h). The degradation rate of TXNIP was detected by WB. (D) UMUC3 were treated with CHX (40 μg/mL; 0, 2, and 4 h) and treated with MG132 (1 μM) or CQ (5 μM). The degradation rate of TXNIP was detected by WB. (E) UMUC3 were treated with Sotorasib (16 μM; 0 h, 2 h, 4 h, and 8 h). The protein lysates were immunoprecipitated with TXNIP antibody. The immunoprecipitates were tested by WB with antibodies to TXNIP and Ub (*P < 0.05, **P < 0.01, ***P < 0.001, ****P < 0.0001, ns not significant, n=3).
TXNIP is a negative regulator of glucose metabolism
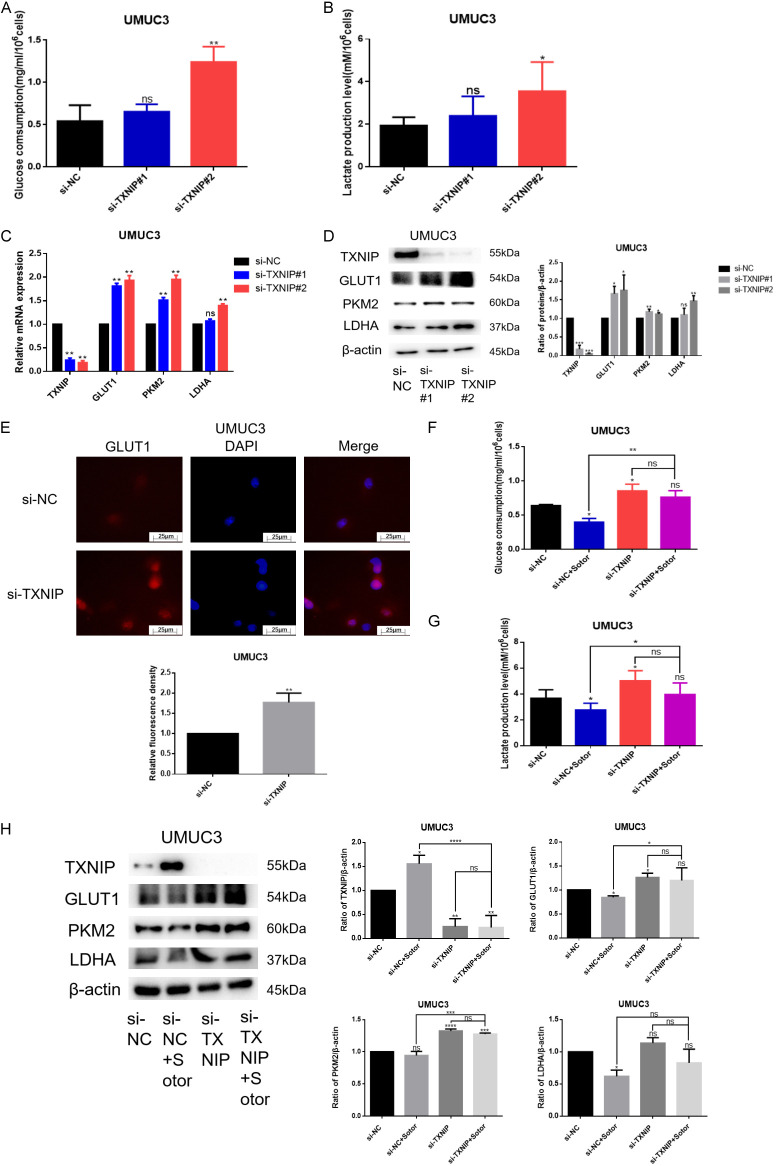
To explore the relationship between TXNIP and glucose metabolism, we silenced TXNIP in KRASG12C mutant bladder cancer cells and observed a significant increase in glucose consumption and lactate production within 24 h (Figure 5A and 5B). Investigating the underlying mechanism, we found that the mRNA expression of glucose metabolism-related proteins GLUT1, PKM2, and LDHA increased upon TXNIP silencing (Figure 5C). Correspondingly, WB results confirmed that the expression of these proteins also increased when TXNIP was silenced (Figure 5D). Immunofluorescence further validated that GLUT1 expression increased in the absence of TXNIP (Figure 5E). In summary, TXNIP acts as a negative regulator of glucose metabolism.
Figure 5.
Effect of TXNIP on glucose metabolism in either absence or presence of Sotorasib. (A) UMUC3 were transfected by 25 nM TXNIP RNAi oligonucleotides and 25 nM negative control siRNA with the transfection reagent Lipofectamine 6000 in the absence of FBS for 5 h. UMUC3 were washed with PBS, and the medium was replaced for 24 h. Finally, glucose consumption was detected using a glucose detection kit. (B) Treatment on UMUC3 was the same as that for (A). Then lactate production was detected using a lactate detection kit. (C) UMUC3 were transfected by TXNIP RNAi oligonucleotides. And then the mRNA expression of TXNIP, GLUT1, PKM2, and LDHA was detected by qRT-PCR. (D) Treatment on UMUC3 was the same as that for (C). The protein expression of TXNIP, GLUT1, PKM2, and LDHA was detected by WB. (E) Expression of GLUT1 was detected by immunofluorescence. (F) UMUC3 were transfected by TXNIP RNAi oligonucleotides. Then UMUC3 were treated or not treated with Sotorasib (16 μM) for 12 h. Glucose consumption was detected by glucose detection kit. (G) Treatment on UMUC3 was the same as that for (F). Lactate production was detected using a lactate detection kit. (H) UMUC3 were transfected by TXNIP RNAi oligonucleotides. And then UMUC3 were treated or not treated with Sotorasib (16 μM) for 12 h. The protein expression of TXNIP, GLUT1, PKM2, and LDHA was detected by WB (*P < 0.05, **P < 0.01, ***P < 0.001, ****P < 0.0001, ns, not significant, n=3).
Next, we verified whether Sotorasib’s inhibition of glucose metabolism is linked to TXNIP regulation. Results from glucose consumption and lactate production experiments indicated that Sotorasib’s inhibition of these processes decreased when TXNIP was silenced (Figure 5F and 5G). Furthermore, WB results demonstrated that the inhibition of glucose metabolism-related proteins GLUT1, PKM2, and LDHA by Sotorasib diminished when TXNIP was silenced (Figure 5H). These findings indicated that Sotorasib inhibited glucose metabolism in KRASG12C mutant bladder cancer cells through TXNIP regulation.
Sotorasib increased TXNIP expression by modulating the RAS/RAF/ERK axis
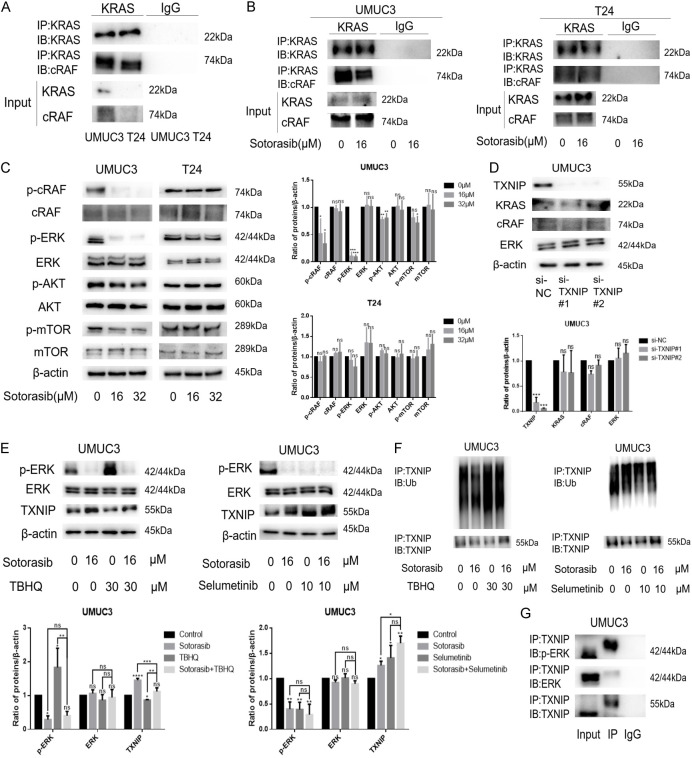
To determine whether Sotorasib upregulated the expression of TXNIP by regulating the RAS/RAF/ERK axis, we first assessed the effect of Sotorasib on this pathway. After RAS activation, activated RAS binds to the N-terminal domain of RAF, thereby activating the downstream MAPK pathway [30]. Notably, the binding of KRAS to cRAF in UMUC3 was stronger than in T24 (Figure 6A). Following treatment with 16 μM Sotorasib, the binding of KRAS to cRAF in UMUC3 decreased, while no decrease was observed in T24 (Figure 6B). Similarly, WB results indicated that treatment with 16 μM and 32 μM Sotorasib inhibited the expression of p-cRAF and p-ERK in UMUC3, but did not affect these proteins in T24. Furthermore, Sotorasib inhibited the expression of bypass proteins p-AKT and p-mTOR in UMUC3, while no inhibition was noted in T24 (Figure 6C).
Figure 6.
Effect of Sotorasib on TXNIP expression associated with the RAS/RAF/ERK axis. (A) The binding of KRAS to cRAF in UMUC3 and T24 was detected by CO-IP and WB experiments. The protein lysates were immunoprecipitated with KRAS antibody. The immunoprecipitates were tested using WB with antibodies to KRAS and cRAF. (B) UMUC3 and T24 were treated with Sotorasib for 12 h. Then the protein lysates were immunoprecipitated with KRAS antibody. The immunoprecipitates were tested by WB with antibodies to KRAS and cRAF. (C) UMUC3 and T24 were treated with Sotorasib (0 μM, 16 μM, and 32 μM) for 12 h. And the protein expression of p-cRAF, cRAF, p-ERK, ERK, p-AKT, AKT, p-mTOR, and mTOR was detected by WB. (D) UMUC3 were transfected by TXNIP RNAi oligonucleotides. The protein expression of TXNIP, KRAS, cRAF, and ERK was detected by WB. (E) UMUC3 were treated or not treated with Sotorasib (16 μM) for 12 h. At the same time, UMUC3 were treated or not treated with TBHQ (30 μM) or Selumetinib (10 μM) for 12 h. The protein expression of p-ERK, ERK, and TXNIP was detected by WB. (F) Treatment on UMUC3 was the same as that for (E), and then the protein lysates were immunoprecipitated with TXNIP antibody. The immunoprecipitates were tested by WB with antibodies to TXNIP and Ub. (G) The protein lysates were immunoprecipitated with TXNIP antibody. The immunoprecipitates were tested by WB with antibodies to TXNIP, p-ERK, and ERK (*P < 0.05, **P < 0.01, ***P < 0.001, ****P < 0.0001, ns not significant, n=3).
To investigate the relationship between TXNIP and the RAS/RAF/ERK axis, we examined the expression changes of KRAS, cRAF, and ERK upon silencing TXNIP. WB results showed no significant changes in the expression of KRAS, cRAF, and ERK, indicating that TXNIP is located downstream of the RAS/RAF/ERK axis (Figure 6D). Previous research has suggested that TXNIP may prevent bladder cancer by inhibiting ERK activation [31]. Additionally, Kelleher et al. proposed that TNF-α-induced degradation of TXNIP is ERK-dependent [32]. Therefore, we speculated that the inhibition of TXNIP degradation by Sotorasib is ERK-dependent. We found that after treatment with TBHQ (tert-Butylhydroquinone, an ERK activator), ERK phosphorylation increased and TXNIP expression decreased. Conversely, after Selumetinib (an ERK inhibitor) treatment, ERK phosphorylation decreased and TXNIP expression increased, indicating that ERK phosphorylation status regulates TXNIP expression. Furthermore, we observed that the inhibition of TXNIP degradation by Sotorasib was reduced when ERK phosphorylation increased, and conversely, this inhibition increased when ERK phosphorylation decreased (Figure 6E). At the same time, following either inhibition or activation of ERK phosphorylation, the inhibition of TXNIP ubiquitination by Sotorasib showed a similar trend (Figure 6F). These results indicated that Sotorasib’s inhibition of TXNIP degradation was related to ERK phosphorylation. To explore the mechanism further, we conducted co-immunoprecipitation (CO-IP) experiments. The results demonstrated that TXNIP bound to both p-ERK and ERK, with a stronger binding affinity to p-ERK and a weaker affinity to ERK. This suggested that p-ERK regulates TXNIP through direct binding (Figure 6G). In conclusion, Sotorasib increased TXNIP expression by modulating the RAS/RAF/ERK axis.
Sotorasib inhibited the growth of xenograft bladder tumor in vivo and the expression of glucose metabolism-related proteins in KRASG12C mutant bladder tumor
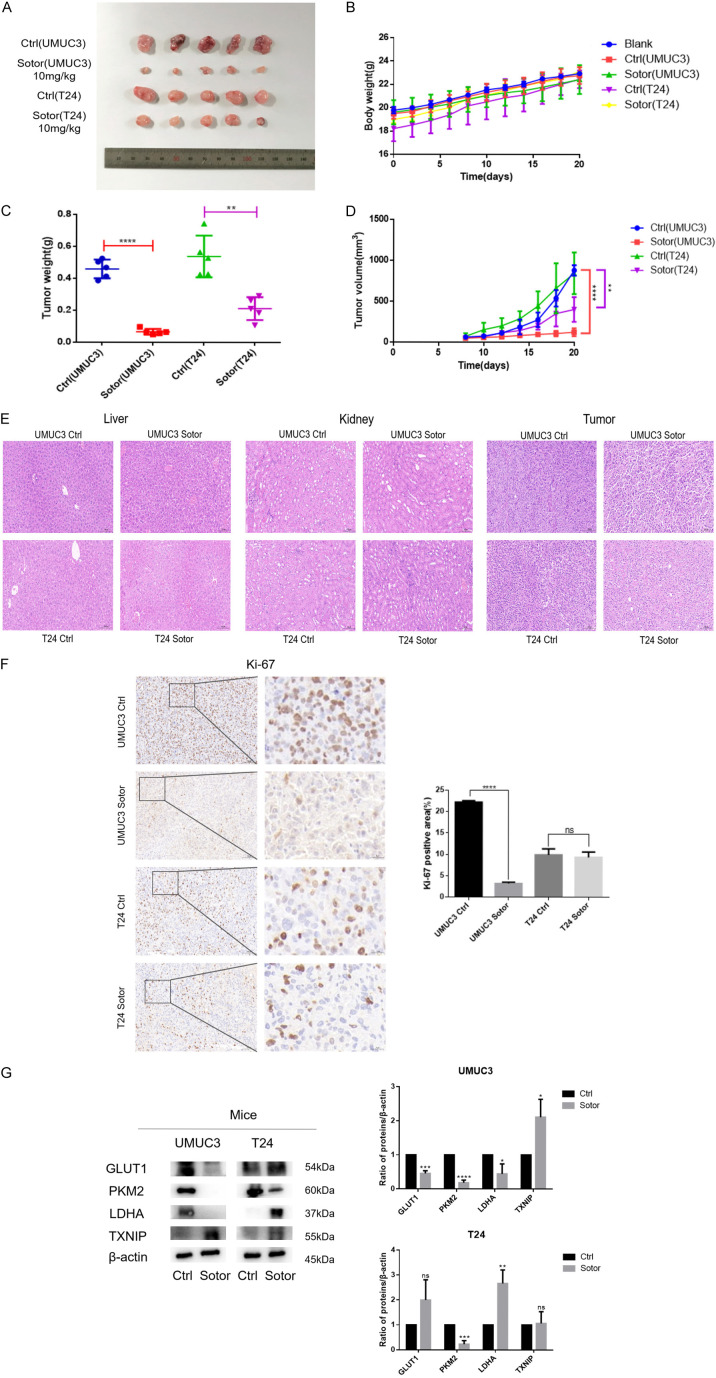
In this study, we demonstrated that Sotorasib inhibited the growth of bladder cancer cells. To further verify its effect on bladder tumor growth, we conducted in vivo experiments using UMUC3 and T24 xenograft models in BALB/c-Nude mice. Once the tumor volume reached 50 mm3, the mice were treated with Sotorasib (10 mg/kg) every 2 days. As shown in Figure 7A and 7D, the volume of UMUC3 xenograft tumors significantly decreased following Sotorasib treatment. Figure 7C illustrated a corresponding reduction in the weight of UMUC3 xenograft tumors. In contrast, the volume and weight of T24 xenograft tumors decreased to a lesser extent after Sotorasib treatment. There was no significant difference in the body weight of nude mice between the treatment and control groups (Figure 7B). Additionally, H&E staining revealed no evident toxicity in the liver and kidneys after Sotorasib treatment, although the arrangement of tumor cells appeared more chaotic and loose in the treatment groups compared to the control groups (Figure 7E). Immunohistochemical analysis of Ki-67 indicated a significant reduction in the number of Ki-67-positive tumor cells in the UMUC3 group following Sotorasib treatment, whereas the decrease in the T24 group was less pronounced (Figure 7F). WB analysis showed that the expression of glucose metabolism-related proteins GLUT1, PKM2, and LDHA in UMUC3 xenograft tumors was significantly downregulated after Sotorasib treatment, while TXNIP expression was significantly upregulated. In T24 xenograft tumors, there were no significant changes in the expression of GLUT1 and TXNIP, whereas PKM2 was downregulated and LDHA was upregulated (Figure 7G).
Figure 7.
Inhibitory effect of Sotorasib on xenograft bladder tumor in vivo. (A) UMUC3 and T24 xenograft models were established in BALB/c-Nude mice. When the tumor volume reached 50 mm3, nude mice were treated with Sotorasib (10 mg/kg) every 2 days. After 14 days of Sotorasib treatment, the tumors were removed and photographed. (B) The body weights were recorded every 2 days. (C) After the tumors were removed, the tumor weights were recorded. (D) The tumor volumes were recorded every 2 days. Tumor volumes were calculated according to the formula: 1/2 × long diameter × short diameter2. (E) H&E staining of liver, kidney, and tumor. (F) Expression of Ki-67 in tumor tissues was detected by immunohistochemistry. (G) Protein expression of GLUT1, PKM2, LDHA, and TXNIP in tumor tissues was detected by WB (*P < 0.05, **P < 0.01, ***P < 0.001, ****P < 0.0001, ns not significant, n=3).
Discussion
In recent years, several studies have demonstrated that the oncogene KRAS plays a critical role in regulating cancer metabolism by orchestrating multiple metabolic changes [33]. Additionally, some researchers have indicated that targeting the Warburg effect in KRASG12D glycolytic tumor organoids enhances the toxicity of 5-FU without affecting non-transformed wild-type cells [34]. On the other hand, the first KRAS inhibitor, Sotorasib, specifically targets KRAS G12C and is currently used clinically for the treatment of locally advanced or metastatic non-small cell lung cancer patients with KRASG12C mutation [22,35]. However, Sotorasib has not yet been studied in bladder cancer. Therefore, we proposed the hypothesis that Sotorasib can be used to inhibit glucose metabolism in KRASG12C mutant bladder cancer.
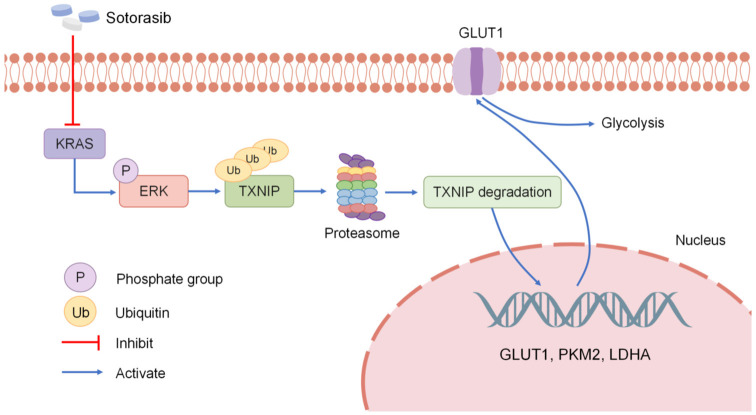
Firstly, we found that bladder cancer cells with KRASG12C mutation demonstrated enhanced glucose metabolism capabilities. Additionally, experiments measuring glucose consumption and lactate production, along with Seahorse assays, revealed that Sotorasib impeded glucose metabolism in these cells. The mechanism behind this was linked to Sotorasib’s suppression of TXNIP ubiquitination degradation. Sotorasib increased TXNIP expression by modulating the RAS/RAF/ERK axis. Concurrently, we investigated Sotorasib’s impact on glucose metabolism in bladder tumors through in vivo experiments. Results showed that Sotorasib significantly curtailed the growth of KRASG12C mutant bladder tumors and reduced the expression of glucose metabolism-related proteins (Figure 8).
Figure 8.
Summary of the mechanisms. Sotorasib specifically inhibits KRAS and then suppresses the phosphorylation of ERK; therefore, the ubiquitination of TXNIP decreases. After the ubiquitination degradation of TXNIP in the proteasome decreases, the mRNA and protein expression of GLUT1, PKM2, and LDHA is inhibited; therefore, the glucose metabolism is inhibited.
To date, there has been limited research on the application of Sotorasib in treating bladder cancer. Our study indicated that Sotorasib can inhibit glucose metabolism in KRASG12C mutant bladder cancer and delved into the mechanisms underlying this inhibition, potentially aiding the development of new bladder cancer treatments.
Our findings suggested that Sotorasib’s effect on TXNIP ubiquitination is linked to ERK phosphorylation. However, specific studies on how phosphorylated ERK (p-ERK) influences TXNIP ubiquitination have not yet been conducted. Some research suggested that TXNIP’s ubiquitination degradation is related to its phosphorylation [36]. Our study also discovered that p-ERK associates with TXNIP, though the specific phosphorylation sites remain unidentified. Other studies have shown that ERK-dependent TXNIP ubiquitination and proteasome degradation hinge on phosphorylation at a PXTP motif threonine (Thr349) within the C-terminal α-arrestin domain, close to a known E3 ubiquitin ligase binding site [32].
Although Sotorasib exhibits anticancer activity in preclinical studies and has demonstrated effective remission, disease stability, and absence of dose-limiting toxic effects in clinical trials, these benefits are often short-lived due to the development of resistance [37]. Resistance represents a significant challenge in the clinical use of Sotorasib, primarily due to mutations in EGFR/FGFR, secondary RAS mutations, alterations in other genes, and activation of the PI3K pathway [35,38,39]. To counteract resistance, combining Sotorasib with other targeted therapies is considered a viable approach to extend the duration of response or reverse drug resistance [40].
Acknowledgements
This work was supported by the National Natural Science Foundation of China (82172653), Institutional Open Fund (KF2022001), Key Project of Developmental Biology and Breeding from Hunan Province (2022XKQ0205), and the Research Team for Reproduction Health and Translational Medicine of Hunan Normal University (2023JC101).
Disclosure of conflict of interest
None.
Supporting Information
References
- 1.Dobruch J, Oszczudłowski M. Bladder cancer: current challenges and future directions. Medicina (Kaunas) 2021;57:749. doi: 10.3390/medicina57080749. [DOI] [PMC free article] [PubMed] [Google Scholar]
- 2.Martinez Rodriguez RH, Buisan Rueda O, Ibarz L. Bladder cancer: present and future. Med Clin (Barc) 2017;149:449–455. doi: 10.1016/j.medcli.2017.06.009. [DOI] [PubMed] [Google Scholar]
- 3.Burns JE, Hurst CD, Knowles MA, Phillips RM, Allison SJ. The Warburg effect as a therapeutic target for bladder cancers and intratumoral heterogeneity in associated molecular targets. Cancer Sci. 2021;112:3822–3834. doi: 10.1111/cas.15047. [DOI] [PMC free article] [PubMed] [Google Scholar]
- 4.Afonso J, Gonçalves C, Costa M, Ferreira D, Santos L, Longatto-Filho A, Baltazar F. Glucose metabolism reprogramming in bladder cancer: Hexokinase 2 (HK2) as prognostic biomarker and target for bladder cancer therapy. Cancers (Basel) 2023;15:982. doi: 10.3390/cancers15030982. [DOI] [PMC free article] [PubMed] [Google Scholar]
- 5.Xia Y, Wang X, Liu Y, Shapiro E, Lepor H, Tang MS, Sun TT, Wu XR. PKM2 is essential for bladder cancer growth and maintenance. Cancer Res. 2022;82:571–585. doi: 10.1158/0008-5472.CAN-21-0403. [DOI] [PMC free article] [PubMed] [Google Scholar]
- 6.Buyucek S, Coskun SK, Onal B, Gamsizkan M, Cangur S, Esbah O. Receptor tyrosine kinase pathway and infiltrating urothelial carcinoma. J Environ Pathol Toxicol Oncol. 2023;42:65–77. doi: 10.1615/JEnvironPatholToxicolOncol.2022044380. [DOI] [PubMed] [Google Scholar]
- 7.Li X, Liu J, Li A, Liu X, Miao Y, Wang Z. Analysis of the relationship between bladder cancer gene mutation and clinical prognosis by high-throughput sequencing. Lab Med. 2023;54:142–152. doi: 10.1093/labmed/lmac083. [DOI] [PubMed] [Google Scholar]
- 8.Ouerhani S, Bougatef K, Soltani I, Elgaaied AB, Abbes S, Menif S. The prevalence and prognostic significance of KRAS mutation in bladder cancer, chronic myeloid leukemia and colorectal cancer. Mol Biol Rep. 2013;40:4109–4114. doi: 10.1007/s11033-013-2512-8. [DOI] [PubMed] [Google Scholar]
- 9.Ouerhani S, Elgaaied AB. The mutational spectrum of HRAS, KRAS, NRAS and FGFR3 genes in bladder cancer. Cancer Biomark. 2011-2012;10:259–266. doi: 10.3233/CBM-2012-0254. [DOI] [PubMed] [Google Scholar]
- 10.McDonald ER 3rd, de Weck A, Schlabach MR, Billy E, Mavrakis KJ, Hoffman GR, Belur D, Castelletti D, Frias E, Gampa K, Golji J, Kao I, Li L, Megel P, Perkins TA, Ramadan N, Ruddy DA, Silver SJ, Sovath S, Stump M, Weber O, Widmer R, Yu J, Yu K, Yue Y, Abramowski D, Ackley E, Barrett R, Berger J, Bernard JL, Billig R, Brachmann SM, Buxton F, Caothien R, Caushi JX, Chung FS, Cortés-Cros M, deBeaumont RS, Delaunay C, Desplat A, Duong W, Dwoske DA, Eldridge RS, Farsidjani A, Feng F, Feng J, Flemming D, Forrester W, Galli GG, Gao Z, Gauter F, Gibaja V, Haas K, Hattenberger M, Hood T, Hurov KE, Jagani Z, Jenal M, Johnson JA, Jones MD, Kapoor A, Korn J, Liu J, Liu Q, Liu S, Liu Y, Loo AT, Macchi KJ, Martin T, McAllister G, Meyer A, Mollé S, Pagliarini RA, Phadke T, Repko B, Schouwey T, Shanahan F, Shen Q, Stamm C, Stephan C, Stucke VM, Tiedt R, Varadarajan M, Venkatesan K, Vitari AC, Wallroth M, Weiler J, Zhang J, Mickanin C, Myer VE, Porter JA, Lai A, Bitter H, Lees E, Keen N, Kauffmann A, Stegmeier F, Hofmann F, Schmelzle T, Sellers WR. Project DRIVE: a compendium of cancer dependencies and synthetic lethal relationships uncovered by large-scale, deep RNAi screening. Cell. 2017;170:577–592. e510. doi: 10.1016/j.cell.2017.07.005. [DOI] [PubMed] [Google Scholar]
- 11.Hunter JC, Manandhar A, Carrasco MA, Gurbani D, Gondi S, Westover KD. Biochemical and structural analysis of common cancer-associated KRAS mutations. Mol Cancer Res. 2015;13:1325–1335. doi: 10.1158/1541-7786.MCR-15-0203. [DOI] [PubMed] [Google Scholar]
- 12.Ostrem JM, Shokat KM. Direct small-molecule inhibitors of KRAS: from structural insights to mechanism-based design. Nat Rev Drug Discov. 2016;15:771–785. doi: 10.1038/nrd.2016.139. [DOI] [PubMed] [Google Scholar]
- 13.Huang L, Guo Z, Wang F, Fu L. KRAS mutation: from undruggable to druggable in cancer. Signal Transduct Target Ther. 2021;6:386. doi: 10.1038/s41392-021-00780-4. [DOI] [PMC free article] [PubMed] [Google Scholar]
- 14.Hoxhaj G, Manning BD. The PI3K-AKT network at the interface of oncogenic signalling and cancer metabolism. Nat Rev Cancer. 2020;20:74–88. doi: 10.1038/s41568-019-0216-7. [DOI] [PMC free article] [PubMed] [Google Scholar]
- 15.Dias Carvalho P, Guimarães CF, Cardoso AP, Mendonça S, Costa ÂM, Oliveira MJ, Velho S. KRAS oncogenic signaling extends beyond cancer cells to orchestrate the microenvironment. Cancer Res. 2018;78:7–14. doi: 10.1158/0008-5472.CAN-17-2084. [DOI] [PubMed] [Google Scholar]
- 16.Yun J, Rago C, Cheong I, Pagliarini R, Angenendt P, Rajagopalan H, Schmidt K, Willson JK, Markowitz S, Zhou S, Diaz LA Jr, Velculescu VE, Lengauer C, Kinzler KW, Vogelstein B, Papadopoulos N. Glucose deprivation contributes to the development of KRAS pathway mutations in tumor cells. Science. 2009;325:1555–1559. doi: 10.1126/science.1174229. [DOI] [PMC free article] [PubMed] [Google Scholar]
- 17.Kim D, Min D, Kim J, Kim MJ, Seo Y, Jung BH, Kwon SH, Ro H, Lee S, Sa JK, Lee JY. Nutlin-3a induces KRAS mutant/p53 wild type lung cancer specific methuosis-like cell death that is dependent on GFPT2. J Exp Clin Cancer Res. 2023;42:338. doi: 10.1186/s13046-023-02922-8. [DOI] [PMC free article] [PubMed] [Google Scholar]
- 18.Ji S, Qin Y, Liang C, Huang R, Shi S, Liu J, Jin K, Liang D, Xu W, Zhang B, Liu L, Liu C, Xu J, Ni Q, Chiao PJ, Li M, Yu X. FBW7 (F-box and WD repeat domain-containing 7) Negatively regulates glucose metabolism by targeting the c-Myc/TXNIP (thioredoxin-binding protein) axis in pancreatic cancer. Clin Cancer Res. 2016;22:3950–3960. doi: 10.1158/1078-0432.CCR-15-2380. [DOI] [PubMed] [Google Scholar]
- 19.Dagdeviren S, Lee RT, Wu N. Physiological and pathophysiological roles of thioredoxin interacting protein: a perspective on redox inflammation and metabolism. Antioxid Redox Signal. 2023;38:442–460. doi: 10.1089/ars.2022.0022. [DOI] [PMC free article] [PubMed] [Google Scholar]
- 20.Herzig S, Shaw RJ. AMPK: guardian of metabolism and mitochondrial homeostasis. Nat Rev Mol Cell Biol. 2018;19:121–135. doi: 10.1038/nrm.2017.95. [DOI] [PMC free article] [PubMed] [Google Scholar]
- 21.Skoulidis F, Li BT, Dy GK, Price TJ, Falchook GS, Wolf J, Italiano A, Schuler M, Borghaei H, Barlesi F, Kato T, Curioni-Fontecedro A, Sacher A, Spira A, Ramalingam SS, Takahashi T, Besse B, Anderson A, Ang A, Tran Q, Mather O, Henary H, Ngarmchamnanrith G, Friberg G, Velcheti V, Govindan R. Sotorasib for lung cancers with KRAS p.G12C mutation. N Engl J Med. 2021;384:2371–2381. doi: 10.1056/NEJMoa2103695. [DOI] [PMC free article] [PubMed] [Google Scholar]
- 22.Canon J, Rex K, Saiki AY, Mohr C, Cooke K, Bagal D, Gaida K, Holt T, Knutson CG, Koppada N, Lanman BA, Werner J, Rapaport AS, San Miguel T, Ortiz R, Osgood T, Sun JR, Zhu X, McCarter JD, Volak LP, Houk BE, Fakih MG, O’Neil BH, Price TJ, Falchook GS, Desai J, Kuo J, Govindan R, Hong DS, Ouyang W, Henary H, Arvedson T, Cee VJ, Lipford JR. The clinical KRAS (G12C) inhibitor AMG 510 drives anti-tumour immunity. Nature. 2019;575:217–223. doi: 10.1038/s41586-019-1694-1. [DOI] [PubMed] [Google Scholar]
- 23.Xue JY, Zhao Y, Aronowitz J, Mai TT, Vides A, Qeriqi B, Kim D, Li C, de Stanchina E, Mazutis L, Risso D, Lito P. Rapid non-uniform adaptation to conformation-specific KRAS (G12C) inhibition. Nature. 2020;577:421–425. doi: 10.1038/s41586-019-1884-x. [DOI] [PMC free article] [PubMed] [Google Scholar]
- 24.Nakajima EC, Drezner N, Li X, Mishra-Kalyani PS, Liu Y, Zhao H, Bi Y, Liu J, Rahman A, Wearne E, Ojofeitimi I, Hotaki LT, Spillman D, Pazdur R, Beaver JA, Singh H. FDA approval summary: sotorasib for KRAS G12C-mutated metastatic NSCLC. Clin Cancer Res. 2022;28:1482–1486. doi: 10.1158/1078-0432.CCR-21-3074. [DOI] [PMC free article] [PubMed] [Google Scholar]
- 25.de Langen AJ, Johnson ML, Mazieres J, Dingemans AC, Mountzios G, Pless M, Wolf J, Schuler M, Lena H, Skoulidis F, Yoneshima Y, Kim SW, Linardou H, Novello S, van der Wekken AJ, Chen Y, Peters S, Felip E, Solomon BJ, Ramalingam SS, Dooms C, Lindsay CR, Ferreira CG, Blais N, Obiozor CC, Wang Y, Mehta B, Varrieur T, Ngarmchamnanrith G, Stollenwerk B, Waterhouse D, Paz-Ares L CodeBreaK 200 Investigators. Sotorasib versus docetaxel for previously treated non-small-cell lung cancer with KRAS (G12C) mutation: a randomised, open-label, phase 3 trial. Lancet. 2023;401:733–746. doi: 10.1016/S0140-6736(23)00221-0. [DOI] [PubMed] [Google Scholar]
- 26.Chandrashekar DS, Karthikeyan SK, Korla PK, Patel H, Shovon AR, Athar M, Netto GJ, Qin ZS, Kumar S, Manne U, Creighton CJ, Varambally S. UALCAN: an update to the integrated cancer data analysis platform. Neoplasia. 2022;25:18–27. doi: 10.1016/j.neo.2022.01.001. [DOI] [PMC free article] [PubMed] [Google Scholar]
- 27.Chandrashekar DS, Bashel B, Balasubramanya SAH, Creighton CJ, Ponce-Rodriguez I, Chakravarthi B, Varambally S. UALCAN: a portal for facilitating tumor subgroup gene expression and survival analyses. Neoplasia. 2017;19:649–658. doi: 10.1016/j.neo.2017.05.002. [DOI] [PMC free article] [PubMed] [Google Scholar]
- 28.Ying H, Kimmelman AC, Lyssiotis CA, Hua S, Chu GC, Fletcher-Sananikone E, Locasale JW, Son J, Zhang H, Coloff JL, Yan H, Wang W, Chen S, Viale A, Zheng H, Paik JH, Lim C, Guimaraes AR, Martin ES, Chang J, Hezel AF, Perry SR, Hu J, Gan B, Xiao Y, Asara JM, Weissleder R, Wang YA, Chin L, Cantley LC, DePinho RA. Oncogenic Kras maintains pancreatic tumors through regulation of anabolic glucose metabolism. Cell. 2012;149:656–670. doi: 10.1016/j.cell.2012.01.058. [DOI] [PMC free article] [PubMed] [Google Scholar]
- 29.Liu YH, Hu CM, Hsu YS, Lee WH. Interplays of glucose metabolism and KRAS mutation in pancreatic ductal adenocarcinoma. Cell Death Dis. 2022;13:817. doi: 10.1038/s41419-022-05259-w. [DOI] [PMC free article] [PubMed] [Google Scholar]
- 30.Lu S, Jang H, Muratcioglu S, Gursoy A, Keskin O, Nussinov R, Zhang J. Ras conformational ensembles, allostery, and signaling. Chem Rev. 2016;116:6607–6665. doi: 10.1021/acs.chemrev.5b00542. [DOI] [PubMed] [Google Scholar]
- 31.Chen Y, Ning J, Cao W, Wang S, Du T, Jiang J, Feng X, Zhang B. Research progress of TXNIP as a tumor suppressor gene participating in the metabolic reprogramming and oxidative stress of cancer cells in various cancers. Front Oncol. 2020;10:568574. doi: 10.3389/fonc.2020.568574. [DOI] [PMC free article] [PubMed] [Google Scholar]
- 32.Kelleher ZT, Wang C, Forrester MT, Foster MW, Marshall HE. ERK-dependent proteasome degradation of Txnip regulates thioredoxin oxidoreductase activity. J Biol Chem. 2019;294:13336–13343. doi: 10.1074/jbc.RA119.007733. [DOI] [PMC free article] [PubMed] [Google Scholar]
- 33.Kawada K, Toda K, Sakai Y. Targeting metabolic reprogramming in KRAS-driven cancers. Int J Clin Oncol. 2017;22:651–659. doi: 10.1007/s10147-017-1156-4. [DOI] [PubMed] [Google Scholar]
- 34.Ludikhuize MC, Gevers S, Nguyen NTB, Meerlo M, Roudbari SKS, Gulersonmez MC, Stigter ECA, Drost J, Clevers H, Burgering BMT, Rodríguez Colman MJ. Rewiring glucose metabolism improves 5-FU efficacy in p53-deficient/KRAS (G12D) glycolytic colorectal tumors. Commun Biol. 2022;5:1159. doi: 10.1038/s42003-022-04055-8. [DOI] [PMC free article] [PubMed] [Google Scholar]
- 35.Lee A. Sotorasib: a review in KRAS G12C mutation-positive non-small cell lung cancer. Target Oncol. 2022;17:727–733. doi: 10.1007/s11523-022-00922-w. [DOI] [PMC free article] [PubMed] [Google Scholar]
- 36.Gao S, Zhang X, Gao K, Zhang Z, Huang Y, Yoda R, Yao J. The pivotal role of extracellular signal-regulated kinase in gap junction-mediated regulation of TXNIP. Cell Signal. 2017;38:116–126. doi: 10.1016/j.cellsig.2017.07.001. [DOI] [PubMed] [Google Scholar]
- 37.Akhave NS, Biter AB, Hong DS. Mechanisms of resistance to KRAS (G12C)-targeted therapy. Cancer Discov. 2021;11:1345–1352. doi: 10.1158/2159-8290.CD-20-1616. [DOI] [PMC free article] [PubMed] [Google Scholar]
- 38.Zhao Y, Murciano-Goroff YR, Xue JY, Ang A, Lucas J, Mai TT, Da Cruz Paula AF, Saiki AY, Mohn D, Achanta P, Sisk AE, Arora KS, Roy RS, Kim D, Li C, Lim LP, Li M, Bahr A, Loomis BR, de Stanchina E, Reis-Filho JS, Weigelt B, Berger M, Riely G, Arbour KC, Lipford JR, Li BT, Lito P. Diverse alterations associated with resistance to KRAS (G12C) inhibition. Nature. 2021;599:679–683. doi: 10.1038/s41586-021-04065-2. [DOI] [PMC free article] [PubMed] [Google Scholar]
- 39.Chan CH, Chiou LW, Lee TY, Liu YR, Hsieh TH, Yang CY, Jeng YM. PAK and PI3K pathway activation confers resistance to KRAS (G12C) inhibitor sotorasib. Br J Cancer. 2023;128:148–159. doi: 10.1038/s41416-022-02032-w. [DOI] [PMC free article] [PubMed] [Google Scholar]
- 40.Yaeger R, Solit DB. Overcoming adaptive resistance to KRAS inhibitors through vertical pathway targeting. Clin Cancer Res. 2020;26:1538–1540. doi: 10.1158/1078-0432.CCR-19-4060. [DOI] [PMC free article] [PubMed] [Google Scholar]
Associated Data
This section collects any data citations, data availability statements, or supplementary materials included in this article.


