An error was found in Figures 1B, 1C and 3B of this article. Therefore, we are providing the corrected versions to replace the inaccurate figures and reflect the true changes. This correction does not alter any interpretations or conclusions of the study. We apologize for this oversight and any confusion it may have caused. The corrected Figures 1 and 3 are shown below.
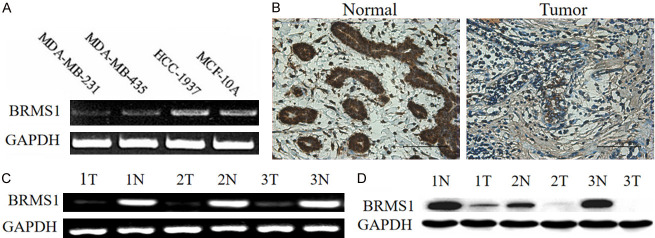
Figure 1.
BRMS1 expression in human breast cancer cells and tissues, using GAPDH as a control. (A) Quantitative reverse-transcription polymerase chain reaction (RT-PCR) analyses on the expression of BRMS1 in MCF-10A and three breast cancer cell lines (HCC-1937, MDA-MB-435, and MDA-MB-231). The expression of BRMS1 in MCF-10A was higher than in the three different types of breast cancer cell lines, and it was the lowest in MDA-MB-231. (B) Immunohistochemical analysis of BRMS1 protein in primary breast carcinoma and corresponding nonmalignant tissues. All photos were obtained at 40× magnification. BRMS1 mRNA (C) and protein (D) expression in three cases of breast cancer tissues and corresponding non-tumorous tissues. N: nonmalignant breast tissues, T: primary breast tissues.
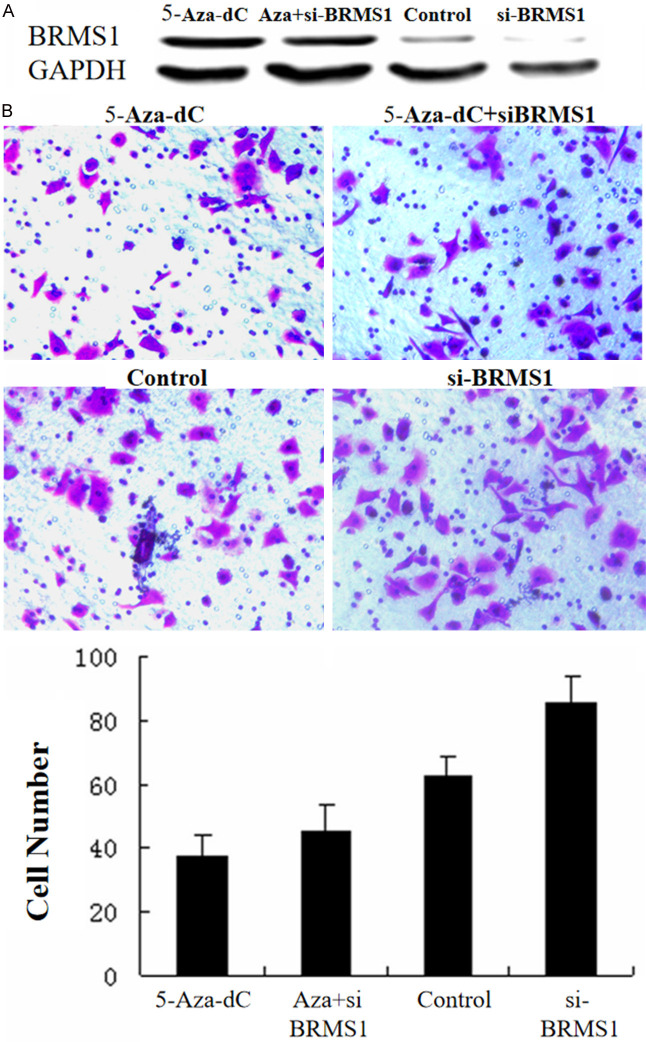
Figure 3.
Effect of 5-Aza-dC on MDA-MB-231 cellular invasion. A. Comparison of BRMS1 protein expression in human breast cancer cell line MDA-MB-231 after treatment with 5-Aza-cytidine (10 μM) and siRNA-BRMS1. B. Demethylation effect of BRMS1 on the invasion ability of the highly metastatic cell line MDA-MB-231 observed with the invasion assay after treatment with 5-Aza-dC and siRNA-BRMS1. All photos were obtained at 100× magnification. The columns indicate the number of cells invading at the 24 h time point. The number of invading MDA-MB-231 cells was significantly reduced after treatment with 5-Aza-Dc compared with the control group. The values represent the mean values ± SD.


