Abstract
The linear ubiquitin assembly complex (LUBAC) consists of HOIP, HOIL-1 and SHARPIN, and is essential for proper immune responses. Patients with HOIP and HOIL-1 deficiencies present with severe immunodeficiency, autoinflammation and glycogen storage. In mice, the loss of Sharpin leads to severe dermatitis due to excessive cell death in keratinocytes. Here we report two patients with SHARPIN deficiency manifesting autoinflammatory symptoms but unexpectedly, no dermatologic manifestations. Patient fibroblasts and B cells showed attenuated canonical NF-κB response and propensity to cell death mediated by TNF superfamily members. Both SHARPIN- and HOIP-deficient patients showed substantial reduction of secondary lymphoid germinal center B cell development. Treatment of one SHARPIN-deficient patient with anti-TNF therapies led to complete clinical and transcriptomic resolution of autoinflammation. These findings underscore the critical role of LUBAC as a gatekeeper for cell death-mediated immune dysregulation in humans.
Keywords: LUBAC, HOIP, HOIL-1, SHARPIN, autoinflammation, cell death
INTRODUCTION
The linear ubiquitin assembly complex (LUBAC) is a trimeric complex consisting of heme-oxidized IRP2 ubiquitin ligase-1 (HOIL-1), HOIL-1-interacting protein (HOIP) and SHANK-associated RH domain interactor (SHARPIN). LUBAC mediates the conjugation of linear ubiquitin chains, also known as Met1 ubiquitin chains, to various target molecules of the NF-κB pathway and other signaling complexes1. HOIP is the main catalytic subunit of LUBAC with an E3 ligase activity for linear ubiquitylation. HOIL-1 and SHARPIN function as scaffold proteins, although recent reports suggest that HOIL-1 also has an E3 ligase activity for mono-ubiquitylation2,3. Patients with HOIP and HOIL-1 deficiencies present with early-onset potentially lethal immunodeficiency, autoinflammation and glycogen deposits in the heart, skeletal muscle and liver4–6. HOIP and HOIL-1-deficient patients’ fibroblasts and B cells have defects in the NF-κB pathway, which accounts for the immunodeficiency phenotype. The autoinflammation was attributed to hyper-responsiveness of monocytes to inflammatory cytokine stimulation. In mice, loss of HOIP (Rnf31) and HOIL-1 (Rbck1) leads to embryonic lethality7,8, whereas Sharpin-deficient mice are viable but present with severe TNF-dependent chronic proliferative dermatitis and multi-organ inflammation 9. Importantly, studies in LUBAC mutant mice have highlighted an essential contribution of apoptotic and necroptotic cell death to the development of inflammatory phenotypes that are prominent in these mice7,8,10–14. Nonetheless, the role of cell death pathways in human LUBAC deficiency is unknown.
This study describes two patients with homozygous SHARPIN deficiency, termed sharpenia, who in stark contrast to patients with HOIL-1 and HOIP deficiencies, presented with distinct clinical inflammatory features. Strikingly, the human disease did not recapitulate the severe dermatologic phenotype observed in Sharpin-deficient mice. Mechanistically, we show ex vivo and in vivo evidence of an increased propensity to cell death, especially apoptosis mediated by TNF superfamily members, which likely contributes to the pathogenesis of all three human LUBAC deficiencies. Based on this finding, the inflammatory phenotype in the surviving patient has been successfully ameliorated with anti-TNF therapy. These data provide a vindication of molecular medicine by underscoring the role of TNF-induced cell death in the pathogenesis of human LUBAC deficiency.
RESULTS
Two patients with homozygous loss-of-function variants in SHARPIN
We investigated two patients with autoinflammatory manifestations. The first patient (P1) was a 14-year-old boy born to consanguineous parents of Indian origin, manifesting recurrent fever, parotitis (Fig. 1a), joint inflammation (Fig. 1b–d), colitis (Fig. 1e), and chronic otitis media necessitating tympanoplasty. He did not present with any skin rash, and his skin biopsy for dermal fibroblast culture did not reveal histological evidence of inflammation. At age 14, he was wheelchair-dependent and had prominent painful swelling of the left ankle joint (Fig. 1b). Synovial fluid aspiration demonstrated marked leukocytosis with neutrophil predominance (Fig. 1d). Colon biopsy showed dense infiltration of lymphocytes and neutrophils in crypts and the lamina propria (Fig. 1e), whereas liver biopsy showed diffuse glycogen deposition in the absence of inflammatory cell infiltrate (Fig. 1f). Muscle biopsy was not performed due to the absence of myopathic clinical features.
Figure 1. Human SHARPIN deficiency causes autoinflammation and hepatic glycogenosis.
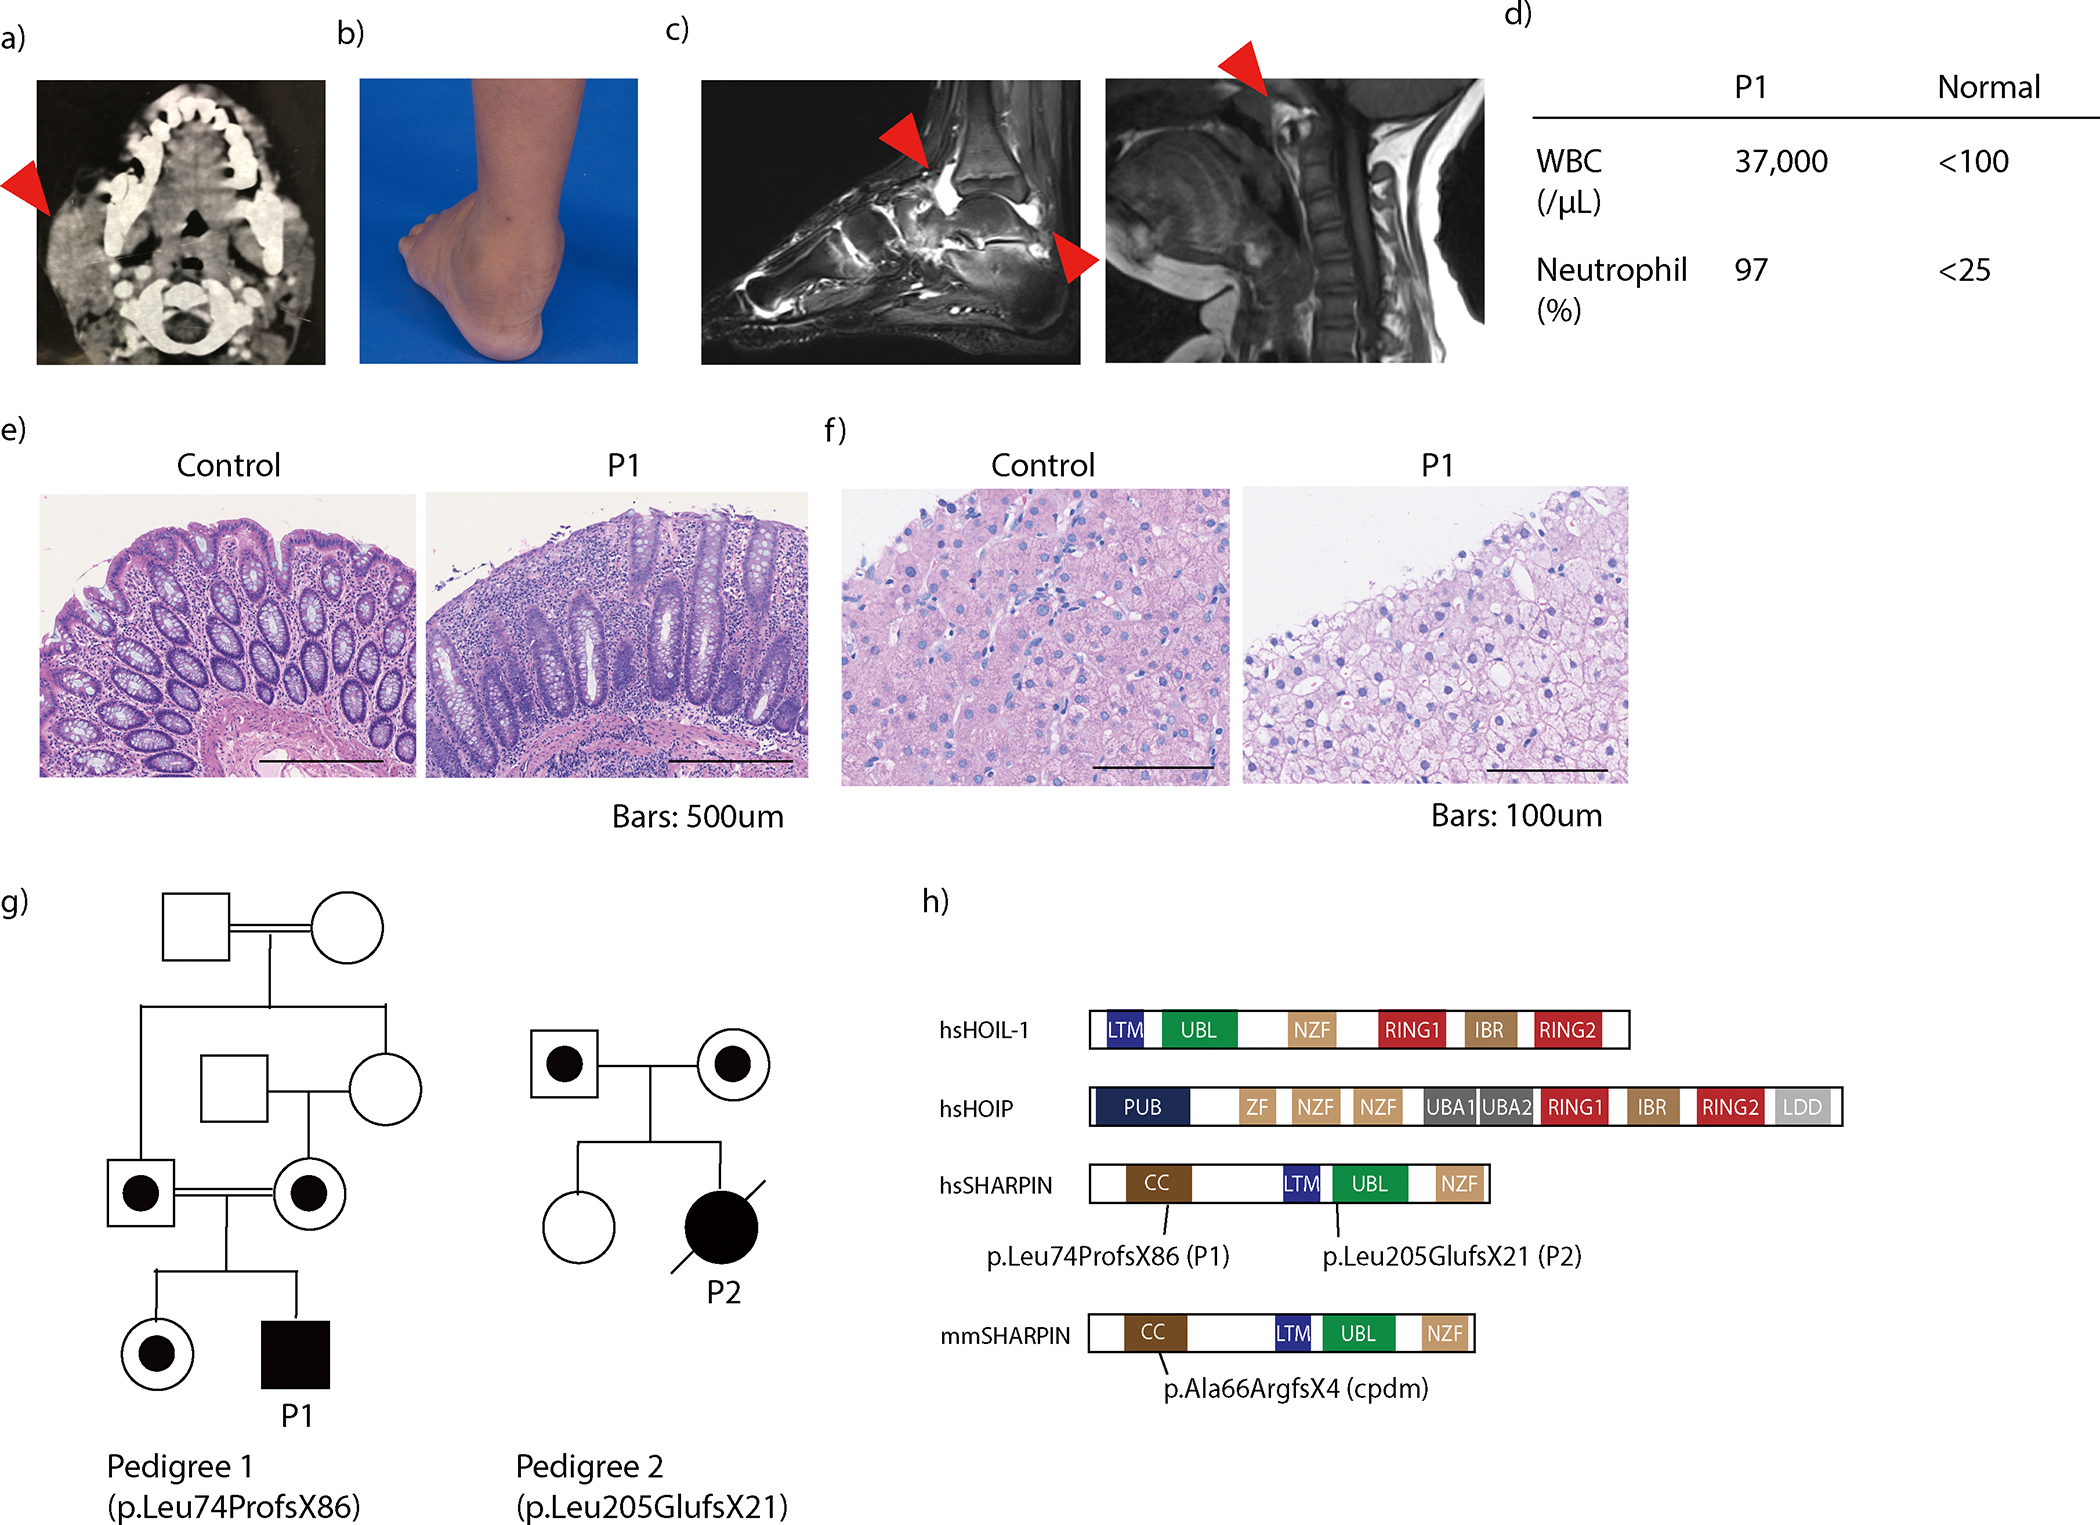
(a) Computed tomography imaging demonstrating the swelling of the right parotid gland (arrowhead) of patient 1 (P1) at age 5. (b) Swelling of P1’s left ankle before initiation of treatment with etanercept. (c) Magnetic resonance imaging demonstrating joint inflammation of P1’s ankle joint (left) and atlanto-axial joint (right). Arrowheads indicate inflammatory changes. (d) Pre-treatment sterile synovial fluid analysis from the ankle joint of P1. (e) Colitis in P1. (f) Hematoxylin and eosin staining of liver biopsy from P1 suggestive of glycogenosis. (g) Family pedigrees. (h) Schematic domain structures of the three LUBAC subunits. hs: Homo sapiens; mm: Mus musculus. (e-f) Representative of three biopsy specimens.
The second patient (P2) was born to non-consanguineous parents of Iranian ancestry. Beginning at 5 months of age, she had recurrent fever episodes with lymphadenopathy and vomiting every 2–3 weeks. No skin rash, parotitis, hepatosplenomegaly, joint symptoms or muscle weakness were observed. Her laboratory findings during attacks included leukocytosis with elevation of C-reactive protein (CRP: 40–70 mg/L), which ultimately required daily prednisolone treatment. At age 4, she had a febrile episode with altered mental status and elevation of CRP and D-dimer. She was treated for suspected multisystem inflammatory syndrome in children (MIS-C) with intravenous immunoglobulin (IVIg) and pulse methylprednisolone, which ameliorated her clinical symptoms. She was started on the TNF inhibitor etanercept which reduced fever episodes. However, three months after discharge, she developed another attack with fever and altered mental status at home and was transferred to the hospital, where she suffered from respiratory and cardiac arrest. Resuscitation was unsuccessful. An infectious cause such as SARS-CoV2 was suspected, although testing was not performed. No autopsy was conducted. Detailed clinical information of P1 and P2 are available in the Supplementary Note.
Trio exome sequencing in the two pedigrees identified homozygous frameshift variants in the SHARPIN gene (NM_030974.4; NP_112236.3): c.220dupC (p.Leu74ProfsX86) in P1 and c.613_614delCT (p.Leu205GlufsX21) in P2, respectively (Fig 1g–h). No individuals in the two pedigrees except for P1 and P2 carried the variants in the homozygous status (Extended Data Fig. 1a). In silico analyses predicted the two variants to be highly deleterious with a combined annotation-dependent deletion (CADD) score of 32.5 (P1) and 24.2 (P2), well above the mutation significance cutoff (MSC) score of 12.1 for SHARPIN (Extended Data Fig. 1b). Furthermore, no homozygous LOF variants of SHARPIN or copy number loss encompassing SHARPIN in the homozygous state are reported in gnomAD, suggesting an intolerance to the complete loss of the gene.
Impaired LUBAC expression and NF-κB activation in sharpenia
Due to the demise of P2, LUBAC expression and function ex vivo were assessed only in P1. While SHARPIN mRNA expression was reduced but not completely lost, no full-length or truncated SHARPIN protein was detected in P1’s PBMCs and fibroblasts (Fig. 2a–b; Extended Data Fig. 1c–d). A significant reduction of HOIP expression associated with a reduced recruitment to HOIL-1 was also observed in P1’s EBV-transformed lymphoblast cells (EBV-B) (Fig. 2c). Both SHARPIN variants lack the UBL domain, critical for interaction with HOIP (Fig. 1h) 10,11,14. Consistently, none of the SHARPIN variants interacted with HOIP (Fig. 2d). Importantly, re-expression of wild type SHARPIN restored HOIP expression in P1’s cells (Fig. 2b). These data indicate that both SHARPIN variants significantly impair LUBAC expression.
Figure 2. Human SHARPIN deficiency impairs canonical NF-κB mediated signaling.
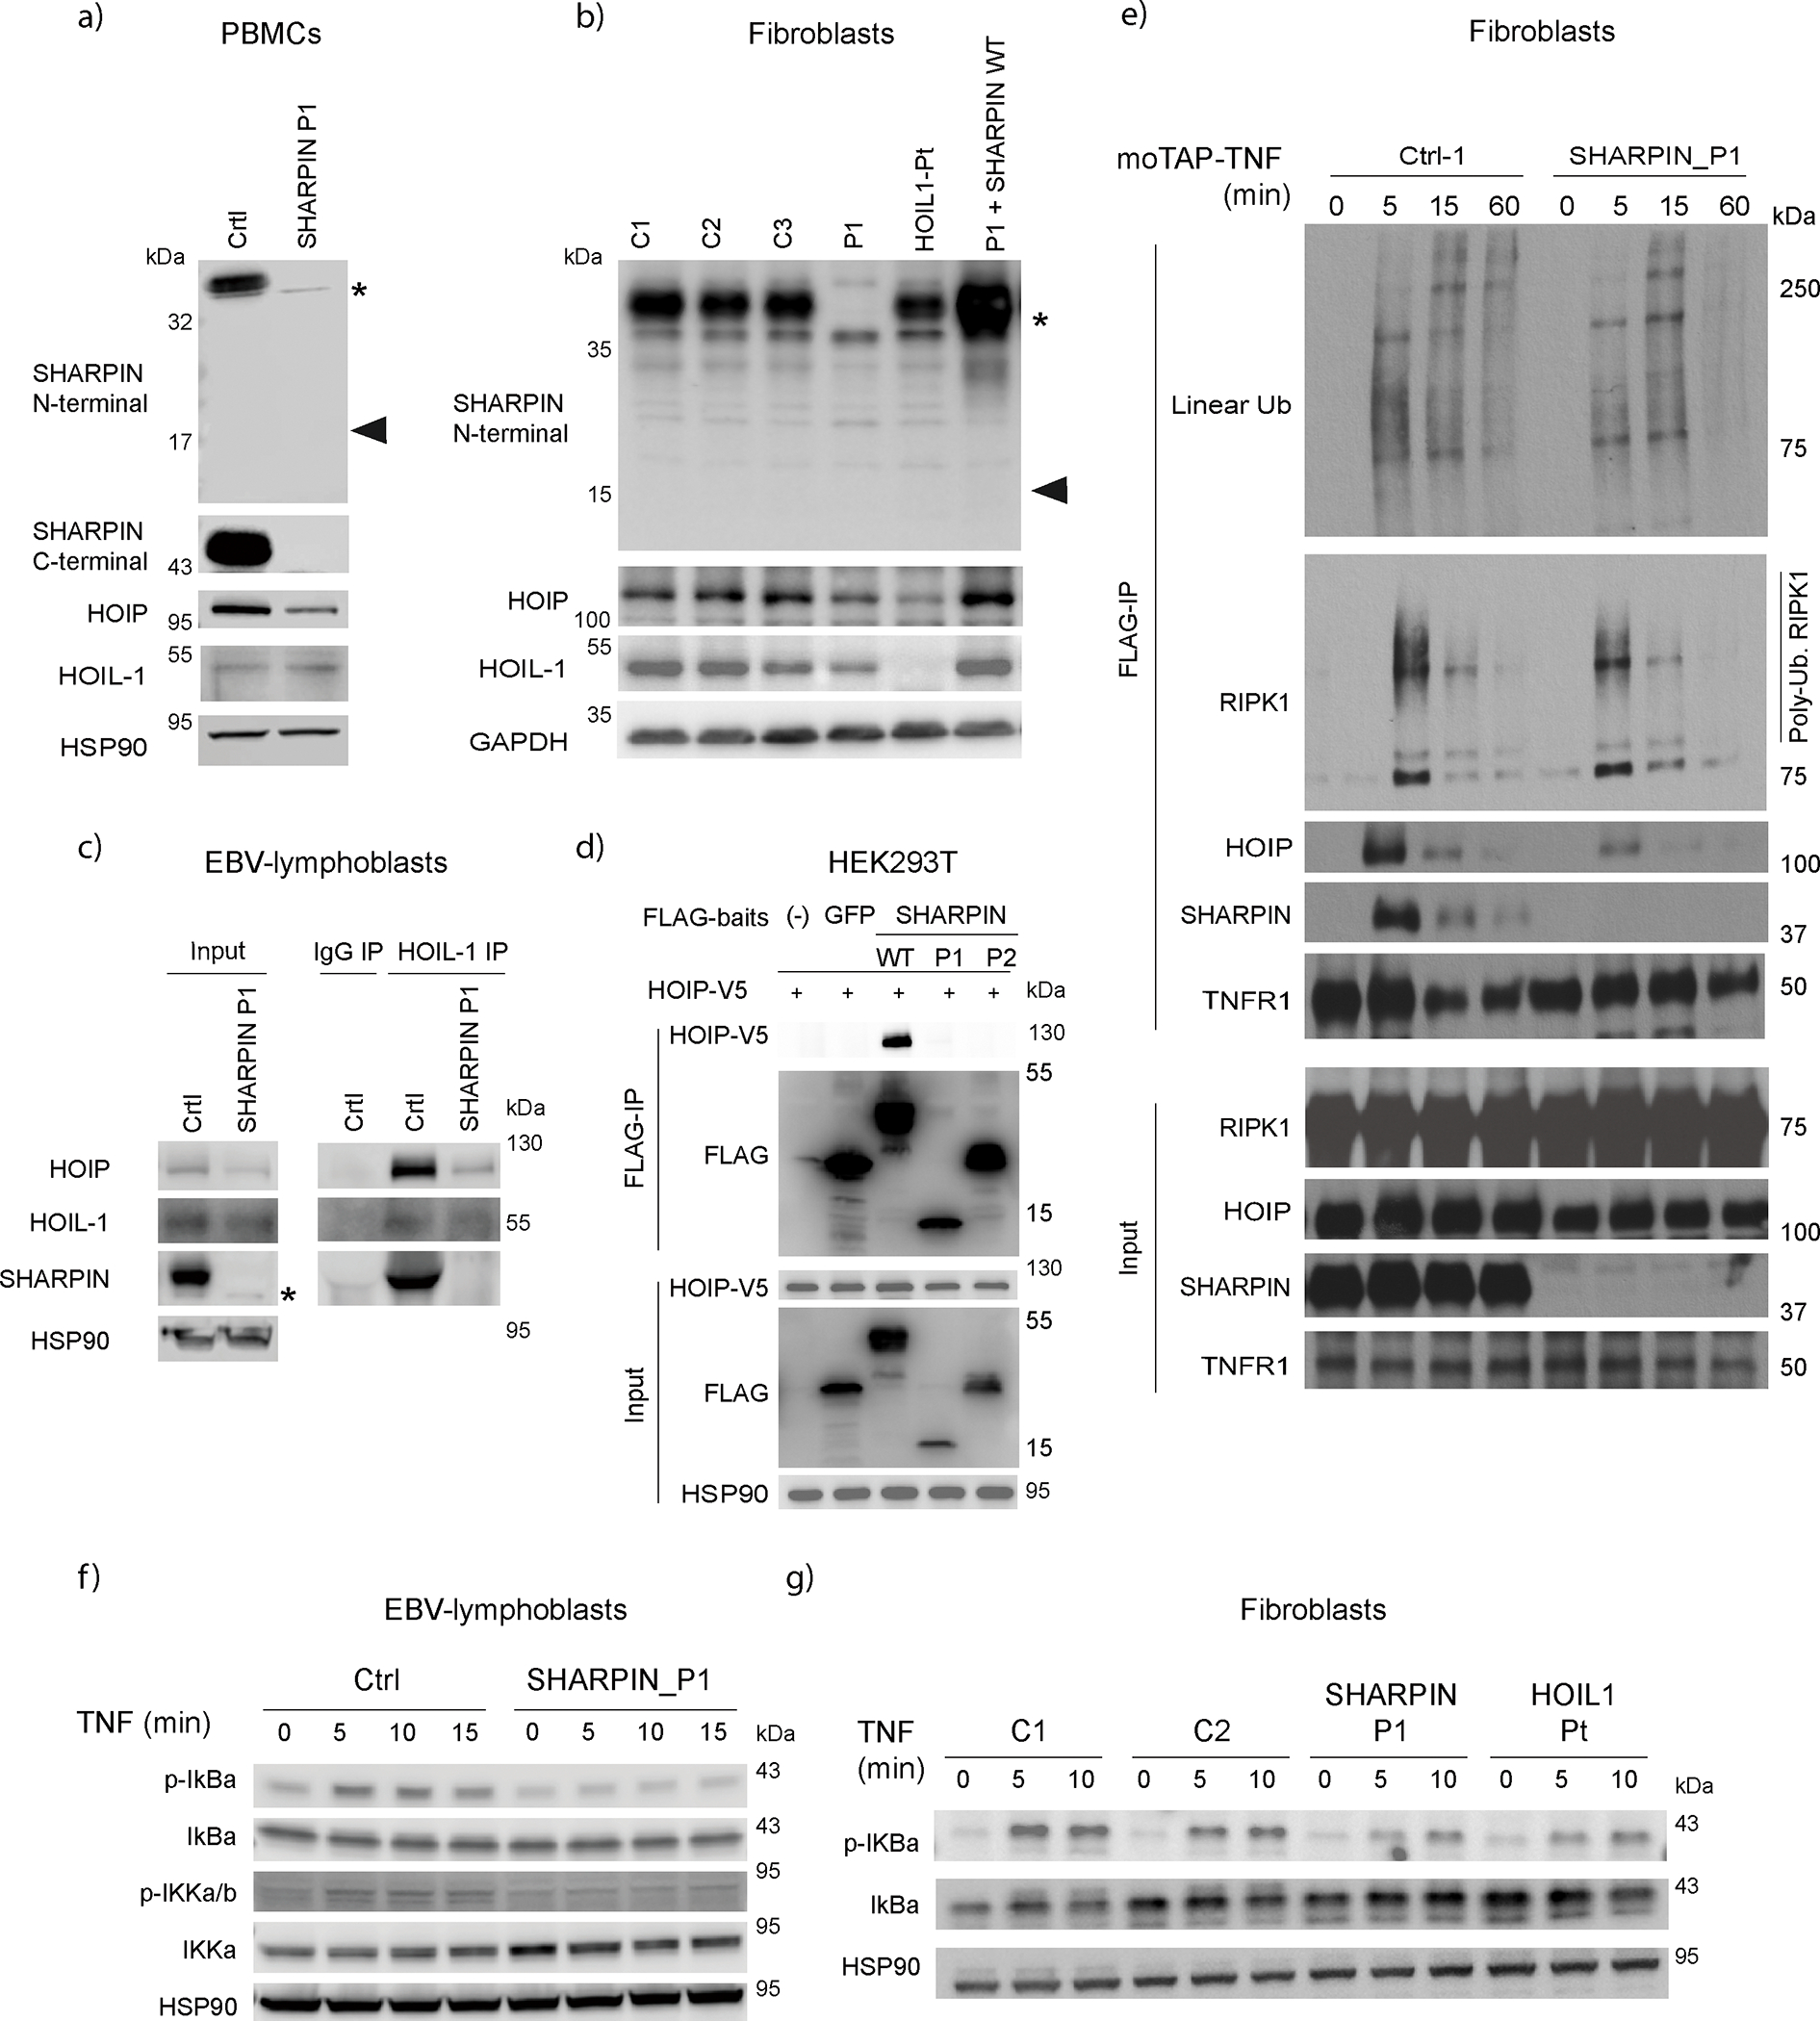
(a) LUBAC subunit expression in PBMCs from SHARPIN-deficient patient (P1) and an unrelated healthy donor. (b) LUBAC subunit expression in fibroblasts from three unrelated healthy donors, SHARPIN (P1)- and HOIL1-deficient patients, and in P1 fibroblasts complemented with wild type SHARPIN. (a-b) Note that the expected truncated SHARPIN protein (18kDa: arrowhead) was not observed. * indicates non-specific bands. (c) Western blot of immunoprecipitated extracts from EBV-immortalized lymphoblastic cells of P1 and a healthy donor. (d) Immunoprecipitation of LUBAC in HEK293T. V5-HOIP and FLAG-baits (SHARPIN or GFP) were transiently overexpressed in HEK293T, and immunoprecipitation using anti-FLAG beads was performed. The eluates were subjected to western blotting. (e) TNFR1-signaling complex (TNFR1-SC) formation in fibroblasts from P1 and a healthy donor. Fibroblasts were stimulated with modified tandem affinity purification (moTAP)-tagged TNF (1 μg/ml) for the indicated times. TNFR1-SC was purified with anti-FLAG immunoprecipitation, and analyzed by western blotting. (f-g) P1’s (f) EBV-immortalized lymphoblastic cells and (g) fibroblasts showed attenuated induction of NF-κB after TNF stimulation (20 ng/ml). These data are representative of three (a, b, e, g) or two (c, d, f) independent experiments.
We next investigate the linear ubiquitylating activity in patient cells by immunoprecipitating plasma membrane-bound TNF receptor-1 signaling complex called complex I 15. Consistent with reduced HOIP expression, HOIP was less recruited to complex I in P1 fibroblasts after TNF stimulation. This was associated with a slight reduction in linear Ub chains and ubiquitylated RIPK1 in complex I from SHARPIN-deficient P1 fibroblasts when compared to two healthy individuals (Fig. 2e and Extended Data Fig. 1e–f). These results agree with the role of LUBAC in the linear ubiquitylation of complex I7,10,11,14,16. Despite its preferential binding to linear ubiquitylation 17, A20 recruitment to complex I was seemingly unchanged (Extended Data Fig. 1e–f). Consistent with previous reports in Sharpin-deficient mice 10,11,14, SHARPIN-deficient P1 cells demonstrated a slight reduction of IkBα phosphorylation upon TNF stimulation, indicating an attenuation of NF-κB activation (Fig. 2f and 2g). In contrast, CD3-induced non-canonical NF-κB activation was unchanged in P1 cells (Extended Data Fig. 1g), agreeing with mouse studies10,14. Altogether, these data are consistent with mouse studies and show that SHARPIN regulates linear ubiquitylation of complex I and canonical NF-κB activation in humans.
Increased induction of cell death in sharpenia
Previously, the inflammatory signature in human HOIL-1 and HOIP deficiencies were attributed to excessive monocyte-derived inflammatory cytokine production in response to pro-inflammatory stimuli 4,5. However, intracellular cytokine accumulation in response to IL-1β was not increased in SHARPIN-deficient monocytes (Extended Data Fig. 2a). Furthermore, HOIP- and SHARPIN-deficient cells presented with reduced cytokine release in response to LPS or IL-1β (Extended Data Fig. 2b–e), suggesting that other mechanisms might contribute to the pathogenesis of LUBAC deficiencies.
Mouse studies demonstrated that LUBAC is an important gatekeeper of TNF-induced cell death by promoting NF-κB-induced pro-survival signaling emanating from complex I, and by restricting the formation of cytosolic RIPK1/FADD/caspase-8 (complex II) or RIPK1/RIPK3/MLKL (necrosome) complexes that trigger apoptosis and necroptosis, respectively7,8,12,13. We, therefore, assessed P1 cells sensitivity to TNF-mediated killing. While Sharpin-deficient mouse embryonic fibroblasts (MEFs) reconstituted with P1 and P2 SHARPIN mutations were sensitive to TNF alone (Extended Data Fig. 3a) 13, P1 fibroblasts were not (Fig. 3a). However, co-treatment with cycloheximide (CHX) heightened cell death of SHARPIN-deficient P1 fibroblasts compared to healthy donors cells (Fig. 3a). Despite the requirement of the inhibitors of apoptosis (IAPs) for LUBAC recruitment to complex I, their inhibition with smac-mimetic (SM) also rendered P1 cells more sensitive to TNF killing compared to healthy donor cells (Extended Data Fig. 3b). Similarly, co-treatment with TWEAK which degrades cIAP1/2 18, also sensitized P1 fibroblasts to TNF-induced cell death (Extended Data Fig. 3c). Given the reduced expression of HOIP and HOIL1 in the SHARPIN-deficient cells, these results may corroborate the suggested role of LUBAC in complex II19.
Figure 3. Human LUBAC deficiencies trigger excessive TNF-induced cell death.
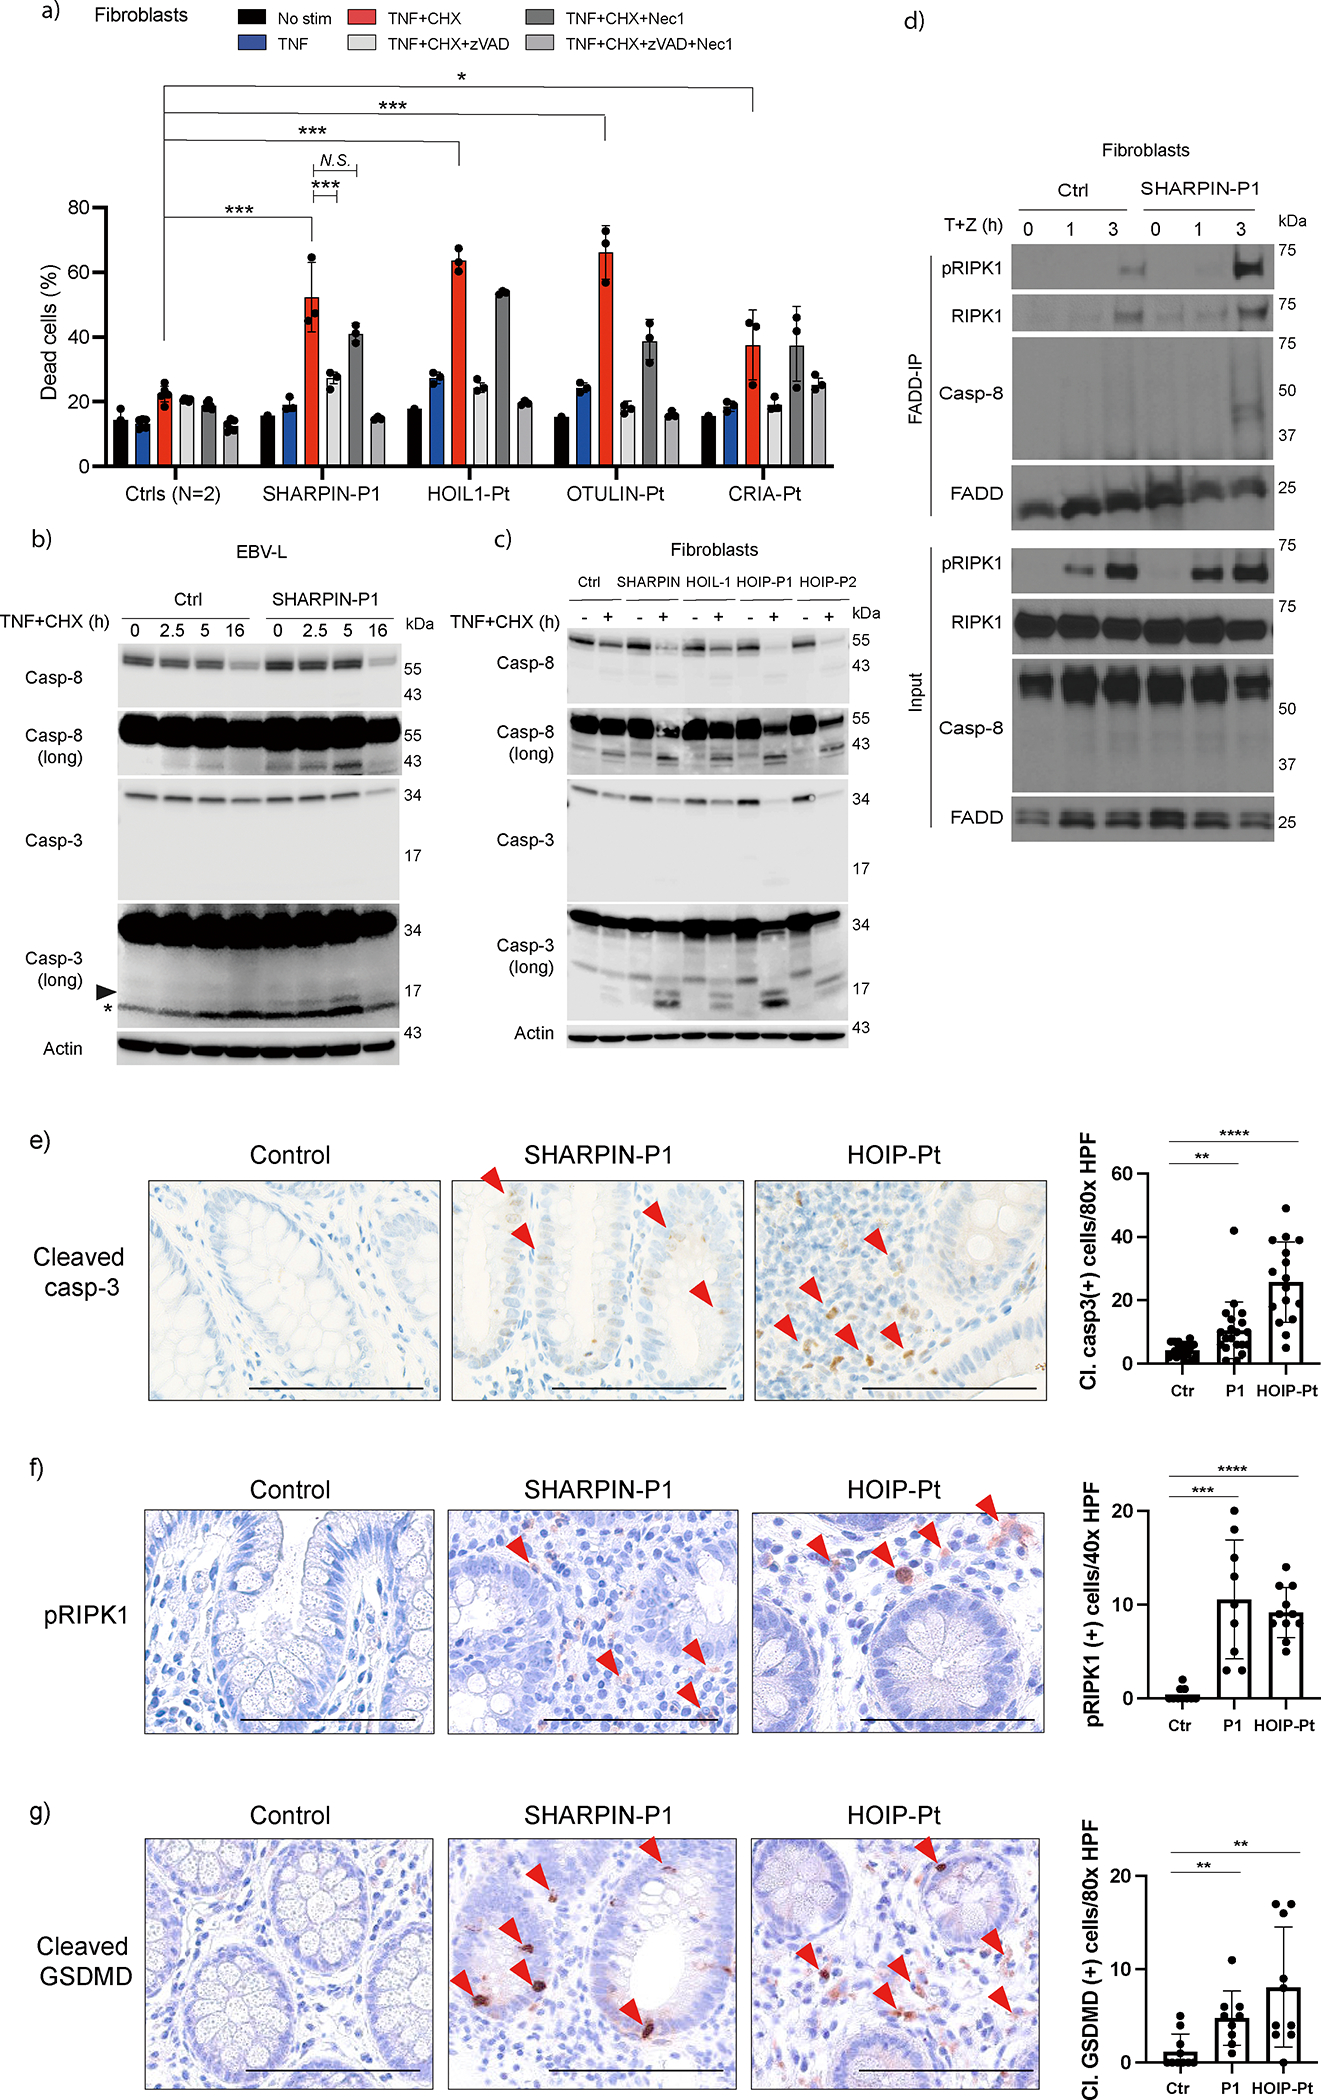
(a) Cell death assay using fibroblasts from a SHARPIN-deficient patient (P1), a patient with HOIL1 deficiency, otulipenia and cleavage resistant RIPK1-induced autoinflammation (CRIA), and two unrelated healthy donors. The dead cell percentage after 16 h of treatment is shown. The experiments were performed with biological triplicates. Mean values ± s.d are displayed. Significance calculated with one-way ANOVA followed by Tukey-Kramer test. (b-c) Western blot analysis of caspase-3 and -8 activity in cell lysates from EBV-immortalized lymphoblasts (b) and fibroblasts (c) from LUBAC-deficient patients. Long: long exposure. (a-c) The cells were stimulated with TNF (100ng/ml) and cycloheximide (CHX:50 μg/ml) for the indicated times in the presence or absence of zVAD (pan-caspase inhibitor, 20 μM) or Nec1 (RIPK1 inhibitor, 50 μM). (d) Complex II immunoprecipitation in fibroblasts from SHARPIN-deficienct P1 compared with a healthy donor. Fibroblasts were stimulated with TNF + zVAD for the indicated times, and the lysates were subjected to immunoprecipitation. (e-g) Immunohistochemistry examination of (e) cleaved caspase-3, (f) pRIPK1 (Ser166) and (g) cleaved GSDMD (Asp275) using colon biopsy samples from LUBAC-deficient patients compared with an unrelated control donor specimen. The number of staining-positive cells per high power field (HPF) was quantified. Bars indicate 100μm. (a, e, f, g) Mean values ± s.d are displayed. Significance calculated with one-way ANOVA followed by Tukey-Kramer test. *p < 0.05, **p < 0.01, ***p < 0.001, ****p < 0.0001, N.S., not significant. (a-d) The ex vivo results are representative of five (a), three (c), or two (b, d) independent experiments. (e-g) These images are representative of three biopsy specimens per donor.
We also analyzed the sensitivity to TNF of HOIL-1 and OTULIN deficient and cleavage-resistant RIPK1-induced autoinflammation (CRIA) patients’ cells. We found that while HOIL-1- and OTULIN-deficient fibroblasts were slightly sensitive to TNF alone, CRIA cells were not (Fig. 3a). However, similarly to SHARPIN-deficient P1 fibroblasts, all patients’ fibroblasts showed significantly higher sensitivity to TNF/CHX-, TNF/SM- and TNF/TWEAK-mediated killing (Fig. 3a and Extended Data Fig. 3b–c). Importantly, whereas RIPK1 inhibitor necrostatin-1 (Nec-1) had little or no impact on the sensitivity of LUBAC-deficient fibroblasts to TNF/CHX- or TNF/TWEAK-mediated killing, a pan-caspase inhibitor zVAD consistently reduced cell death in most scenarios (Fig. 3a and Extended Data Fig. 3b–c), suggesting that LUBAC-deficient fibroblasts are more prone to TNF-induced apoptosis.
Consistent with these findings, we observed augmented cleavage of caspase-3 and -8 in LUBAC-deficient patients’ cells (Fig. 3b–c and Extended Data Fig. 3d). In line with apoptosis being the predominant mode of cell death, phosphorylation of MLKL, a marker of necroptosis, was only marginally detectable in SHARPIN-deficient P1 fibroblasts in response to a necroptotic stimulus (Extended Data Fig. 3e–f). The higher sensitivity to TNF of SHARPIN-deficient cells was associated with increased incorporation of cleaved caspase-8 and RIPK1, as well as Ser166 phospho-RIPK1 (pRIPK1) within complex II 20 (Fig. 3d and Extended Data Fig. 3g). Overall, these data indicate that LUBAC-deficient patients are predominantly sensitized to apoptosis, with limited propensity to necroptosis in response to TNF.
Based on the increased cell death of patients’ fibroblasts, we determined whether intestinal inflammation, which is a common feature in LUBAC-deficient patients (Extended Data Fig. 4a), is associated with excessive cell death. Remarkably, a significant increase of positive cells for cleaved caspase-3 (CC3), a marker of apoptosis, and Ser166 pRIPK1, a marker of RIPK1 kinase-dependent apoptosis and necroptosis, were found in colon biopsy samples from both SHARPIN-deficient P1 and a HOIP-deficient patient compared to a control donor sample (Fig. 3e–f and Extended Data Fig. 4b–c). Interestingly, we observed a significant increase of cleaved gasdermin (GSDM)-D positive cells in the intestinal epithelium and the lamina propria of LUBAC-deficient patients compared to a control donor, indicating that pyroptosis is activated in the gut of these patients (Fig. 3g and Extended Data Fig. 4d–e). In contrast to GSDMD, we did not observe a significant increase in GSDME cleavage in sharpenia fibroblasts stimulated with TNF+CHX, suggesting that the contribution of GSDME is not central to the pathogenesis (Extended Data Fig 4f). Altogether, these data suggest that heightened sensitivity to TNF-induced cell death might contribute to the distinct inflammatory phenotype in LUBAC-deficient patients.
TNF-dependent inflammation in SHARPIN-deficient joints
The SHARPIN-deficient P1 showed substantial sterile joint inflammation associated with marked neutrophil infiltration (Fig. 1b–d). To better characterize this disease feature, we measured the inflammatory cytokines in his synovial fluid. Compared to osteoarthritis samples, the SHARPIN-deficient P1 had a significantly higher level of IL-6, whereas the levels of TNF or IL-1β, known to play a role in rheumatoid arthritis pathogenesis 21,22, were not elevated (Fig. 4a). The synovial fluid also showed significantly elevated levels of the neutrophil chemoattractant proteins IL-8 (CXCL8), GROα (CXCL1), and MIP1α (CCL3) (Fig. 4b and Extended Data Fig. 5a), consistent with the observed accumulation of neutrophils in the joint (Fig. 1d).
Figure 4. Loss of SHARPIN causes joint inflammation in human and mouse.
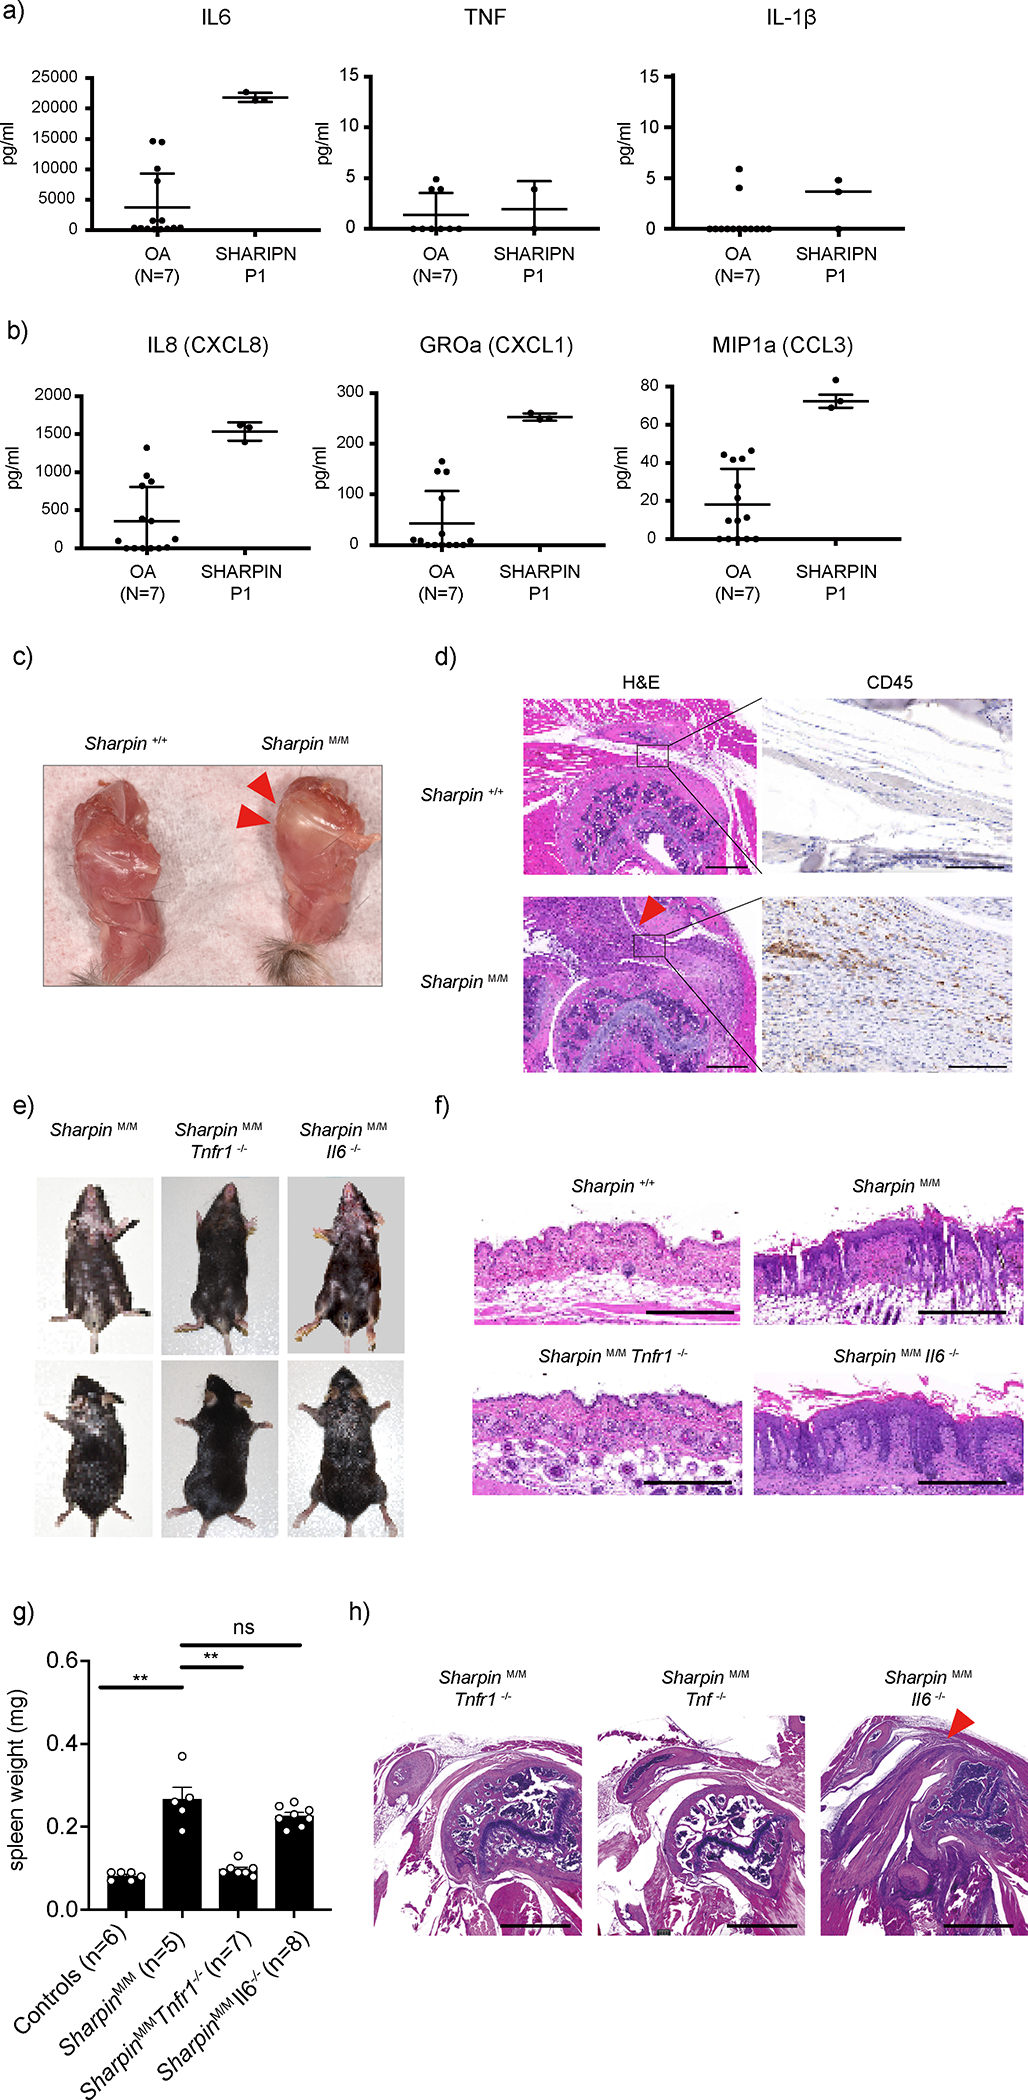
(a-b) Multiplex ELISA measurement of (a) cytokines and (b) neutrophil-recruiting chemokines in the sterile synovial fluid of SHARPIN-deficient patient (P1) before the initiation of anti-TNF treatment, compared with osteoarthritis (OA) patients as a control (N=7). The samples were measured in technical triplicate (P1) or duplicate (OA), respectively. Mean values ± s.d are displayed. (c) A representative photo of shoulder joints from Sharpin-deficient mice (Sharpin M/M) compared with wild-type littermate control. Representative of 5 mice for each genotype. Arrowheads indicate an inflamed shoulder joint capsule. (d) Hematoxylin and eosin (H&E) and immunohistochemistry (CD45) staining sections of shoulder joints from Sharpin M/M and wild-type littermate control. Arrowhead indicates inflamed ligament indicative of enthesitis. Bars: 1mm (H&E) and 100μm (CD45). Representative of 4 mice for each genotype. (e) Dermatologic findings of Sharpin M/M crossed with Tnfr1- or Il6-deficient mice. Representative of more than 30 mice for each genotype. (f) H&E staining sections of the skin from wild-type and Sharpin M/M, crossed with Tnfr1- or Il6-deficient mice. Bars: 0.5mm. Representative of 3 mice for each genotype. (g) Spleen weights of mice of indicated genotypes. Spleen weights were taken at ~12 week-old mice. Data are represented as mean values + SEM. Significance calculated with a two-tailed Mann-Whitney test. **p < 0.01. (h) Representative H&E staining sections of shoulder joints from Sharpin-deficient mice crossed with Tnf- (n=4), Tnfr1- (n=2) or Il6-deficient (n=2) mice. Bars: 1mm.
Despite the numerous studies that have been performed on Sharpin-deficient mice, only two studies have reported an arthritic phenotype 9,23. We therefore investigated the molecular histopathological mechanism of the joint inflammation in Sharpin-deficient mice. Macroscopically, we observed a significant deposition of yellow plaque surrounding the shoulder joints of the Sharpin-deficient mice (Fig. 4c), indicative of an inflammatory change. Histologically, this was accompanied by marked thickening of ligaments with massive immune cell infiltration, suggestive of enthesitis (Fig. 4d and Extended Data Fig. 5b). This inflammatory finding was the most prominent on the shoulder, whereas a milder inflammatory finding was also observed on elbow joints (Extended Data Fig. 5c). Of note, we did not observe histological evidence of chronic arthritis, such as erosions of bone surface or destruction of growth plates.
Previous reports indicated an increased production of IL-6 in monocytes from HOIL-1- and HOIP-deficient patients4,5. Thus, as we observed preferential elevation of IL-6 in the synovial fluid of the SHARPIN-deficient patient, we compared the contribution of IL-6 versus TNF signaling to the inflammatory phenotype in Sharpin-deficient mice by crossing them with Il6-, Tnf- and Tnfr1 (Tnfrsf1a)- deficient mice. Deletion of Tnf or Tnfr1 not only ameliorated the dermatitis in Sharpin-deficient mice, as previously reported 10,13, but also eliminated the joint inflammation. In contrast, loss of Il6 did not attenuate the inflammatory features of Sharpin-deficient mice (Fig. 4e–h). These in vivo data collectively emphasize the importance of TNF-mediated inflammation on the joint pathology associated with SHARPIN deficiency, even in the absence of detectable TNF levels.
Impaired development of germinal centers in sharpenia
The SHARPIN-deficient P1 manifested a subtle feature of immunodeficiency. In contrast, HOIP and HOIL-1 deficiencies present with severe hypogammaglobulinemia, which has been, in part, attributed to an attenuated B cell response to CD40L4,6. To understand the molecular basis of this phenotypic difference, we first analyzed secondary lymphoid organs from HOIP- and SHARPIN-deficient patients. As expected 6, there were fewer and disorganized lymphoid follicles (B cell zone) in a HOIP-deficient patient’s axillary lymph node. This defect was compounded by a complete lack of germinal centers (GCs), which are highly specialized microanatomical sites where B cells proliferate and undergo somatic hypermutation (SHM) and affinity maturation (Fig. 5a and Extended Data Fig. 6a). Despite the milder form of immunodeficiency observed in the SHARPIN-deficient P1, analysis of his adenoids also demonstrated very few, small and poorly structured lymphoid follicles associated with significantly smaller GCs (Fig. 5b and Extended Data Fig. 6b). This is consistent with the histological finding reported in B cell-specific Sharpin-deficient mice 24. These data suggest that the LUBAC deficiency results in a dysregulated secondary lymphoid organ structure, irrespective of the degree of clinical immunodeficiency.
Figure 5. Human LUBAC deficiencies cause defective germinal center formation.
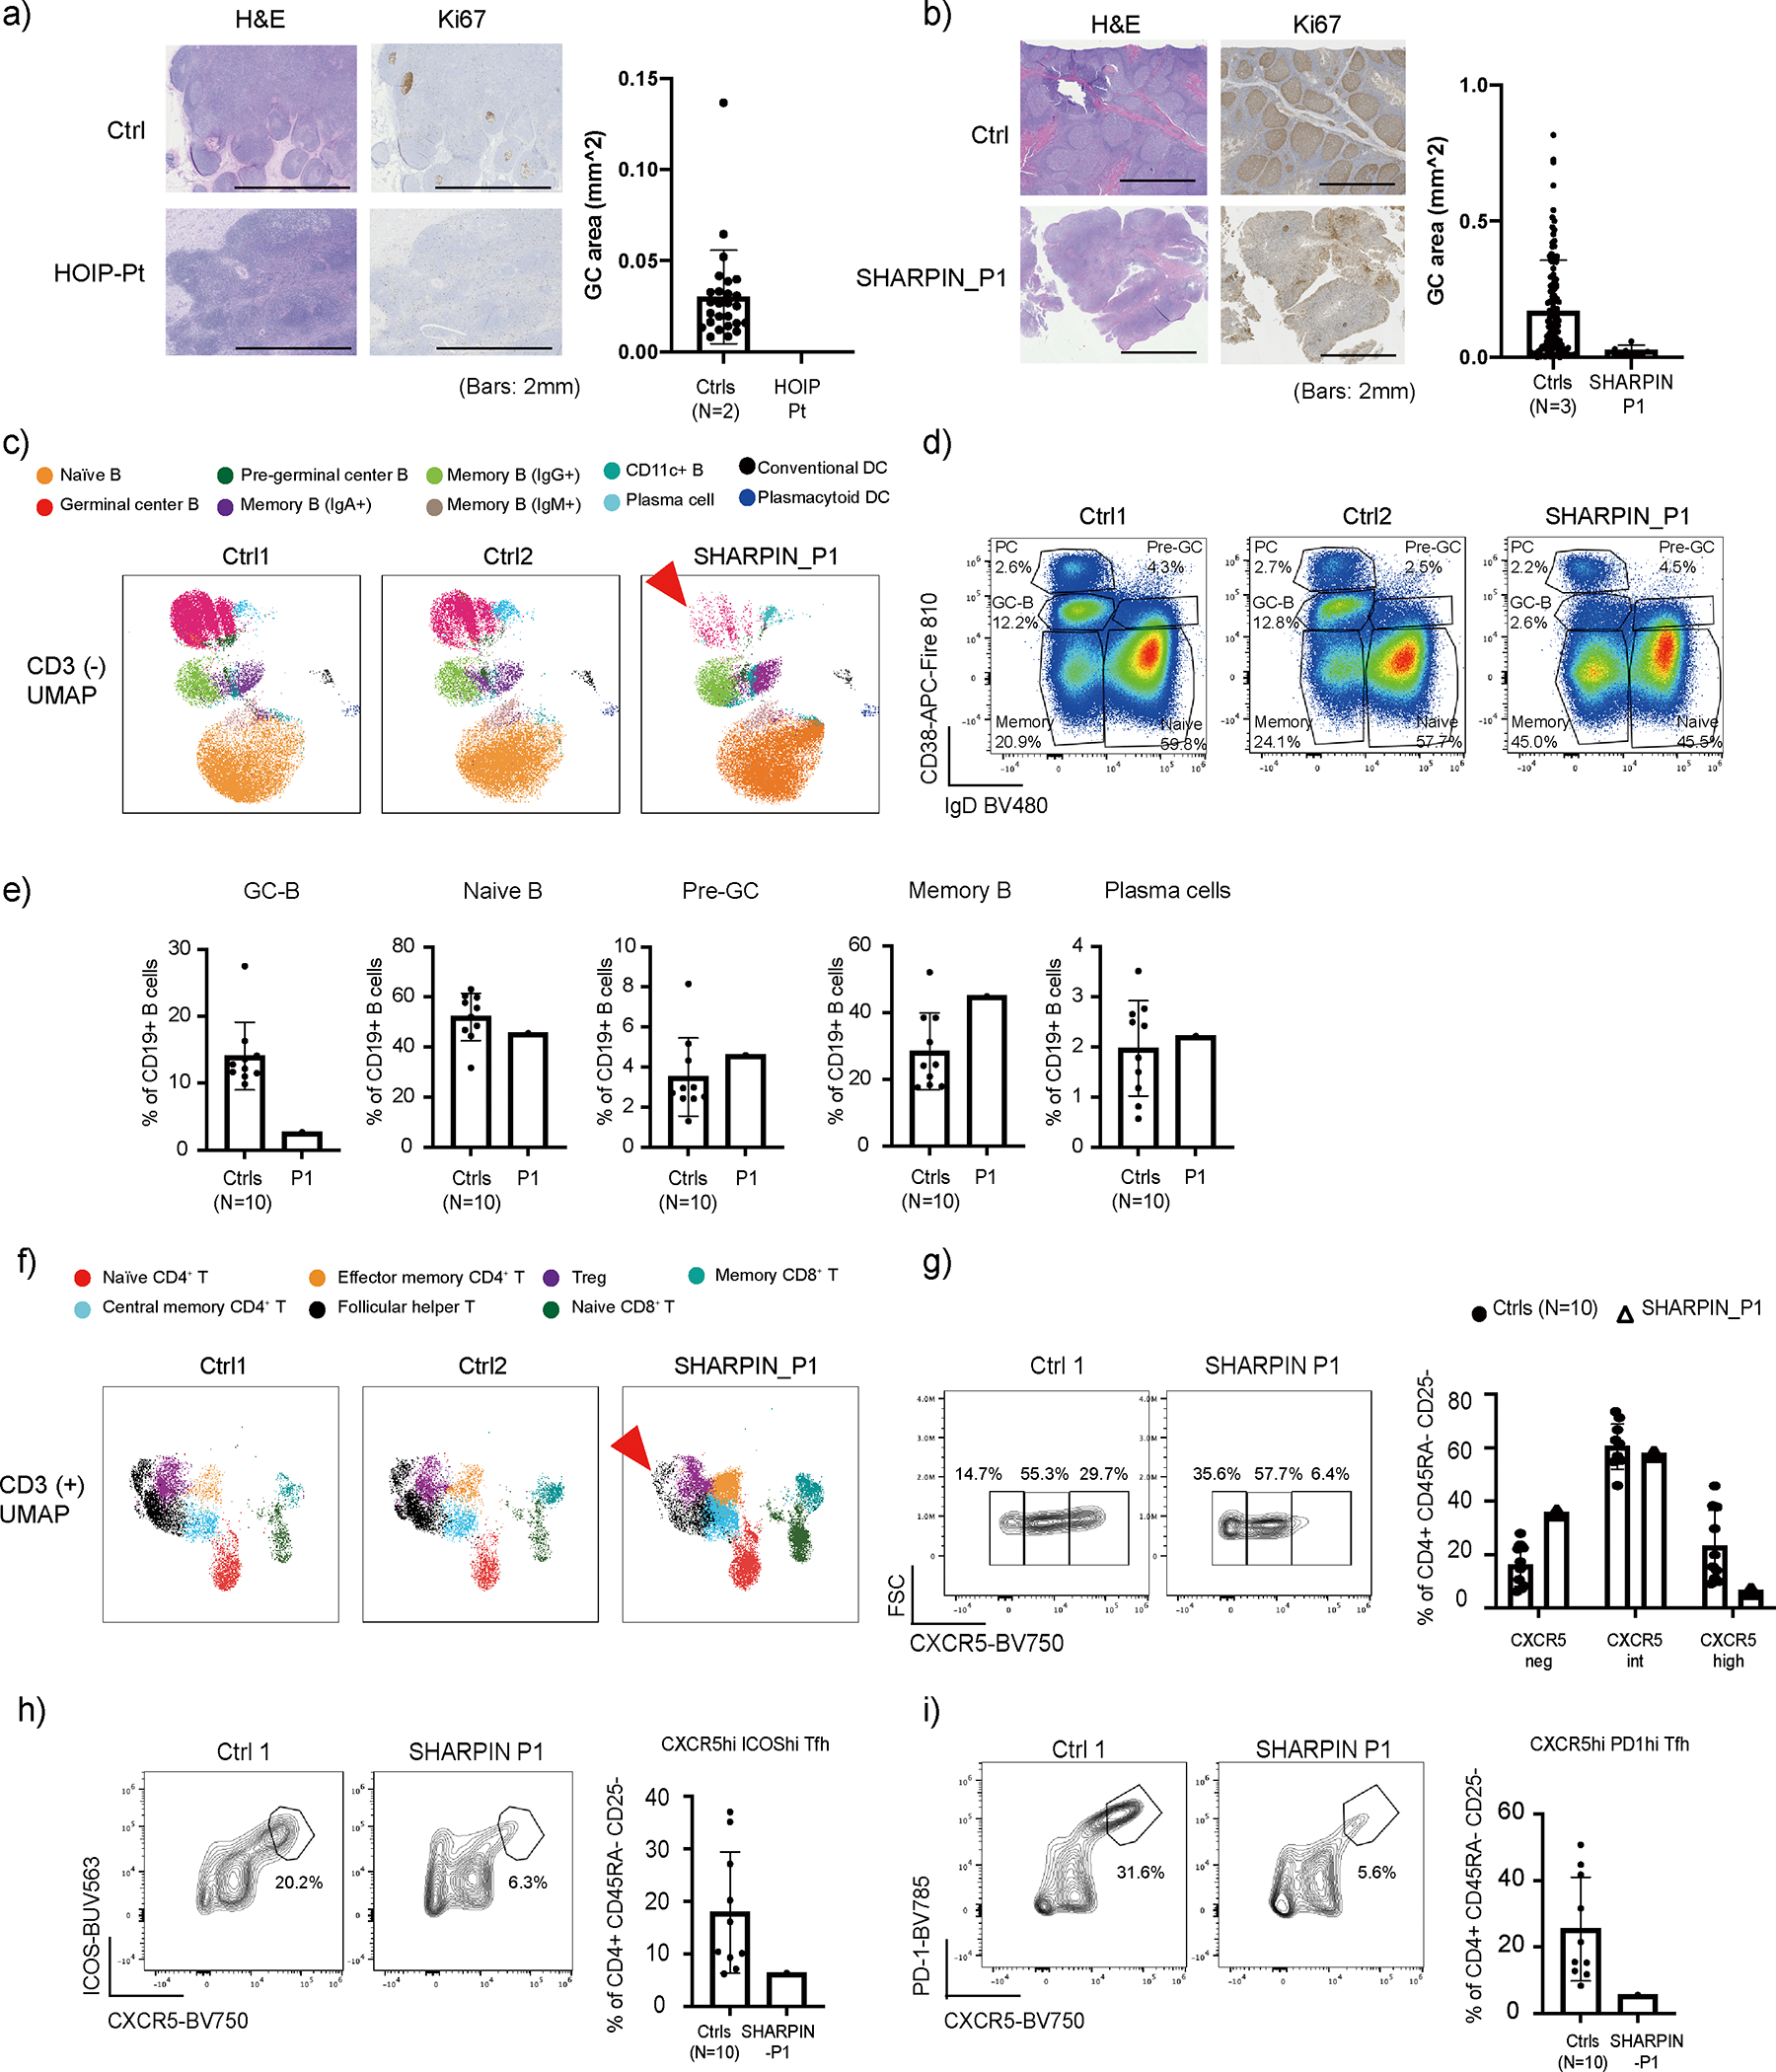
(a) Lymph node histology of a HOIP deficient patient. (b) Adenoid histology of a SHARPIN-deficient patient. (a-b) Ki67 staining positive areas on histology slides were measured as germinal centers (GC). Lymph nodes from two unrelated donors and adenoids from three unrelated donors were used as controls. Mean values ± s.d are displayed. (c) UMAP plot of CD3− population demonstrating reduction of germinal center B (GC-B) fraction (arrowhead) in SHARPIN-deficient P1 compared to unrelated control donors (N=10). (d) Dot plot analysis of CD19+ population with reduced CD19+ CD38int IgD− GC-B cells in the patient. (e) Quantification of Fig. 6d. Mean values ± s.d are displayed. (f) UMAP plot of CD3+ population demonstrating reduction of follicular helper T cell fraction (arrowhead) in the SHARPIN deficient patient compared to unrelated control donors (N=10). (g) Reduction of GC-Tfh (CD4+ CD45RA− CD25− CXCR5hi) cell population in the SHARPIN-deficient patient. (h-i) Reduced surface expression of ICOS (h) and PD1 (i) on GC-Tfh cells in the SHARPIN-deficient patient. (g-i) Mean values ± s.d are displayed. (a-i) The experiments were not repeated due to the limited clinical specimens.
Next, to investigate the effect of human SHARPIN deficiency on secondary lymphoid organ development, we established a 37-color high-dimensional spectral flow cytometry assay using adenoid cells from the SHARPIN-deficient P1 and compared it with control samples from ten age-matched unrelated donors (Extended Data Fig. 6c). Consistent with the histological analyses, we observed a reduction of the CD20+ B cell population in the patient along with a specific decrease in the GC-B cell population (CD19+ CD38int IgD−) and a moderate increase in memory B cells (CD19+ CD38low IgD−) (Extended Data Fig. 7a and Fig. 5c–e). Despite the marked reduction of GC-B cells, relative class-switch recombination (CSR) was maintained in both the GC and the memory B cells (Extended Data Fig. 7b–c). This finding is consistent with a previous report that CSR in B cells occurs before entering the GCs 25. Interestingly, the SHARPIN-deficient patient’s adenoid had an intact percentage of CD19+ CD38high IgD− plasma cell (PC) population (Fig. 5c–e). Recent studies have indicated that in secondary lymphoid organs, naïve B cells can differentiate into short-lived antibody-secreting cells via an extrafollicular (EF) pathway independent of conventional GC incorporation, and contribute to rapid antibody response during infection 26. Since an adenoidectomy was performed on the SHARPIN-deficient patient during his treatment of streptococcal otitis media, we reasoned that the normal percentage of adenoidal PCs and memory B cells might be attributable to chronic infection triggering a potential activation of the EF pathway.
We next focused on T cell populations in the adenoid analysis. Consistent with the histology (Extended Data Fig. 6b), we observed a moderate increase of CD3+ T cells that can be attributed to increased proportions of central memory CD4+ and CD8+ T cells in the SHARPIN-deficient patient (Extended Data Fig. 7d–e). Contrary to previous reports of murine Sharpin deficiency 27 28, we did not observe a reduction in the regulatory T cell (Treg) population in the adenoid or in the peripheral blood (Extended Data Fig. 7d and Supplementary Data Table 1). T follicular helper cells (Tfh) are a specialized subset of CD4+ T cells that support the appropriate formation of GCs and the subsequent production of high affinity immunoglobulin. Intriguingly, we observed an attenuated maturation of Tfh in the patient, demonstrated by the reduction in percentages of GC-follicular helper T cells (GC-Tfh: CD4+ CD45RA− CD25− CXCR5high) (Fig. 5f and 5g). This was further complemented by reduced expression of Tfh activation markers, ICOS and PD-1 (Fig. 5h–i). Altogether, these data highlight the importance of LUBAC in GC formation in vivo.
Defective CD40L-induced B cell signaling ex vivo
To further gain insights into molecular mechanisms underlying the GC hypoplasia in the SHARPIN-deficient P1 in vivo, we examined the effect of the loss of SHARPIN on CD40-mediated B cell signaling, which reflects T cell-dependent B cell activation in GCs. The SHARPIN-deficient P1’s EBV-B cells showed attenuated activation of NF-κB and MAPK signaling and their targets genes in response to CD40L (Fig. 6a–b). In agreement, CD40L-mediated transcription of activation-induced cytidine deaminase (AICDA, encoding AID) was also attenuated in P1’s primary B cells (Fig. 6c). This was associated with defects in proliferation and augmented cell death of P1’s B cells (Fig. 6d–e). Importantly, we observed a more profound effect in a HOIP-deficient patient compared with the SHARPIN-deficient patient (Fig. 6c–e). In contrast with previous reports in Sharpin-deficient mice28,29. we did not observe defects in T cell proliferation or in Th1/2/17 skewing, indicating that human SHARPIN may have a limited role in T cell homeostasis (Extended Data Fig. 8a–b). Lastly, we observed a higher degree of apoptotic cells (CC3+) among lymphoid follicles in SHARPIN- and HOIP-deficient secondary lymphoid organs in vivo, further highlighting the contribution of apoptosis dysregulation on the GC defects (Fig. 6f and 6g).
Figure 6: Human LUBAC deficiencies cause dysregulation in B cell activation and death.
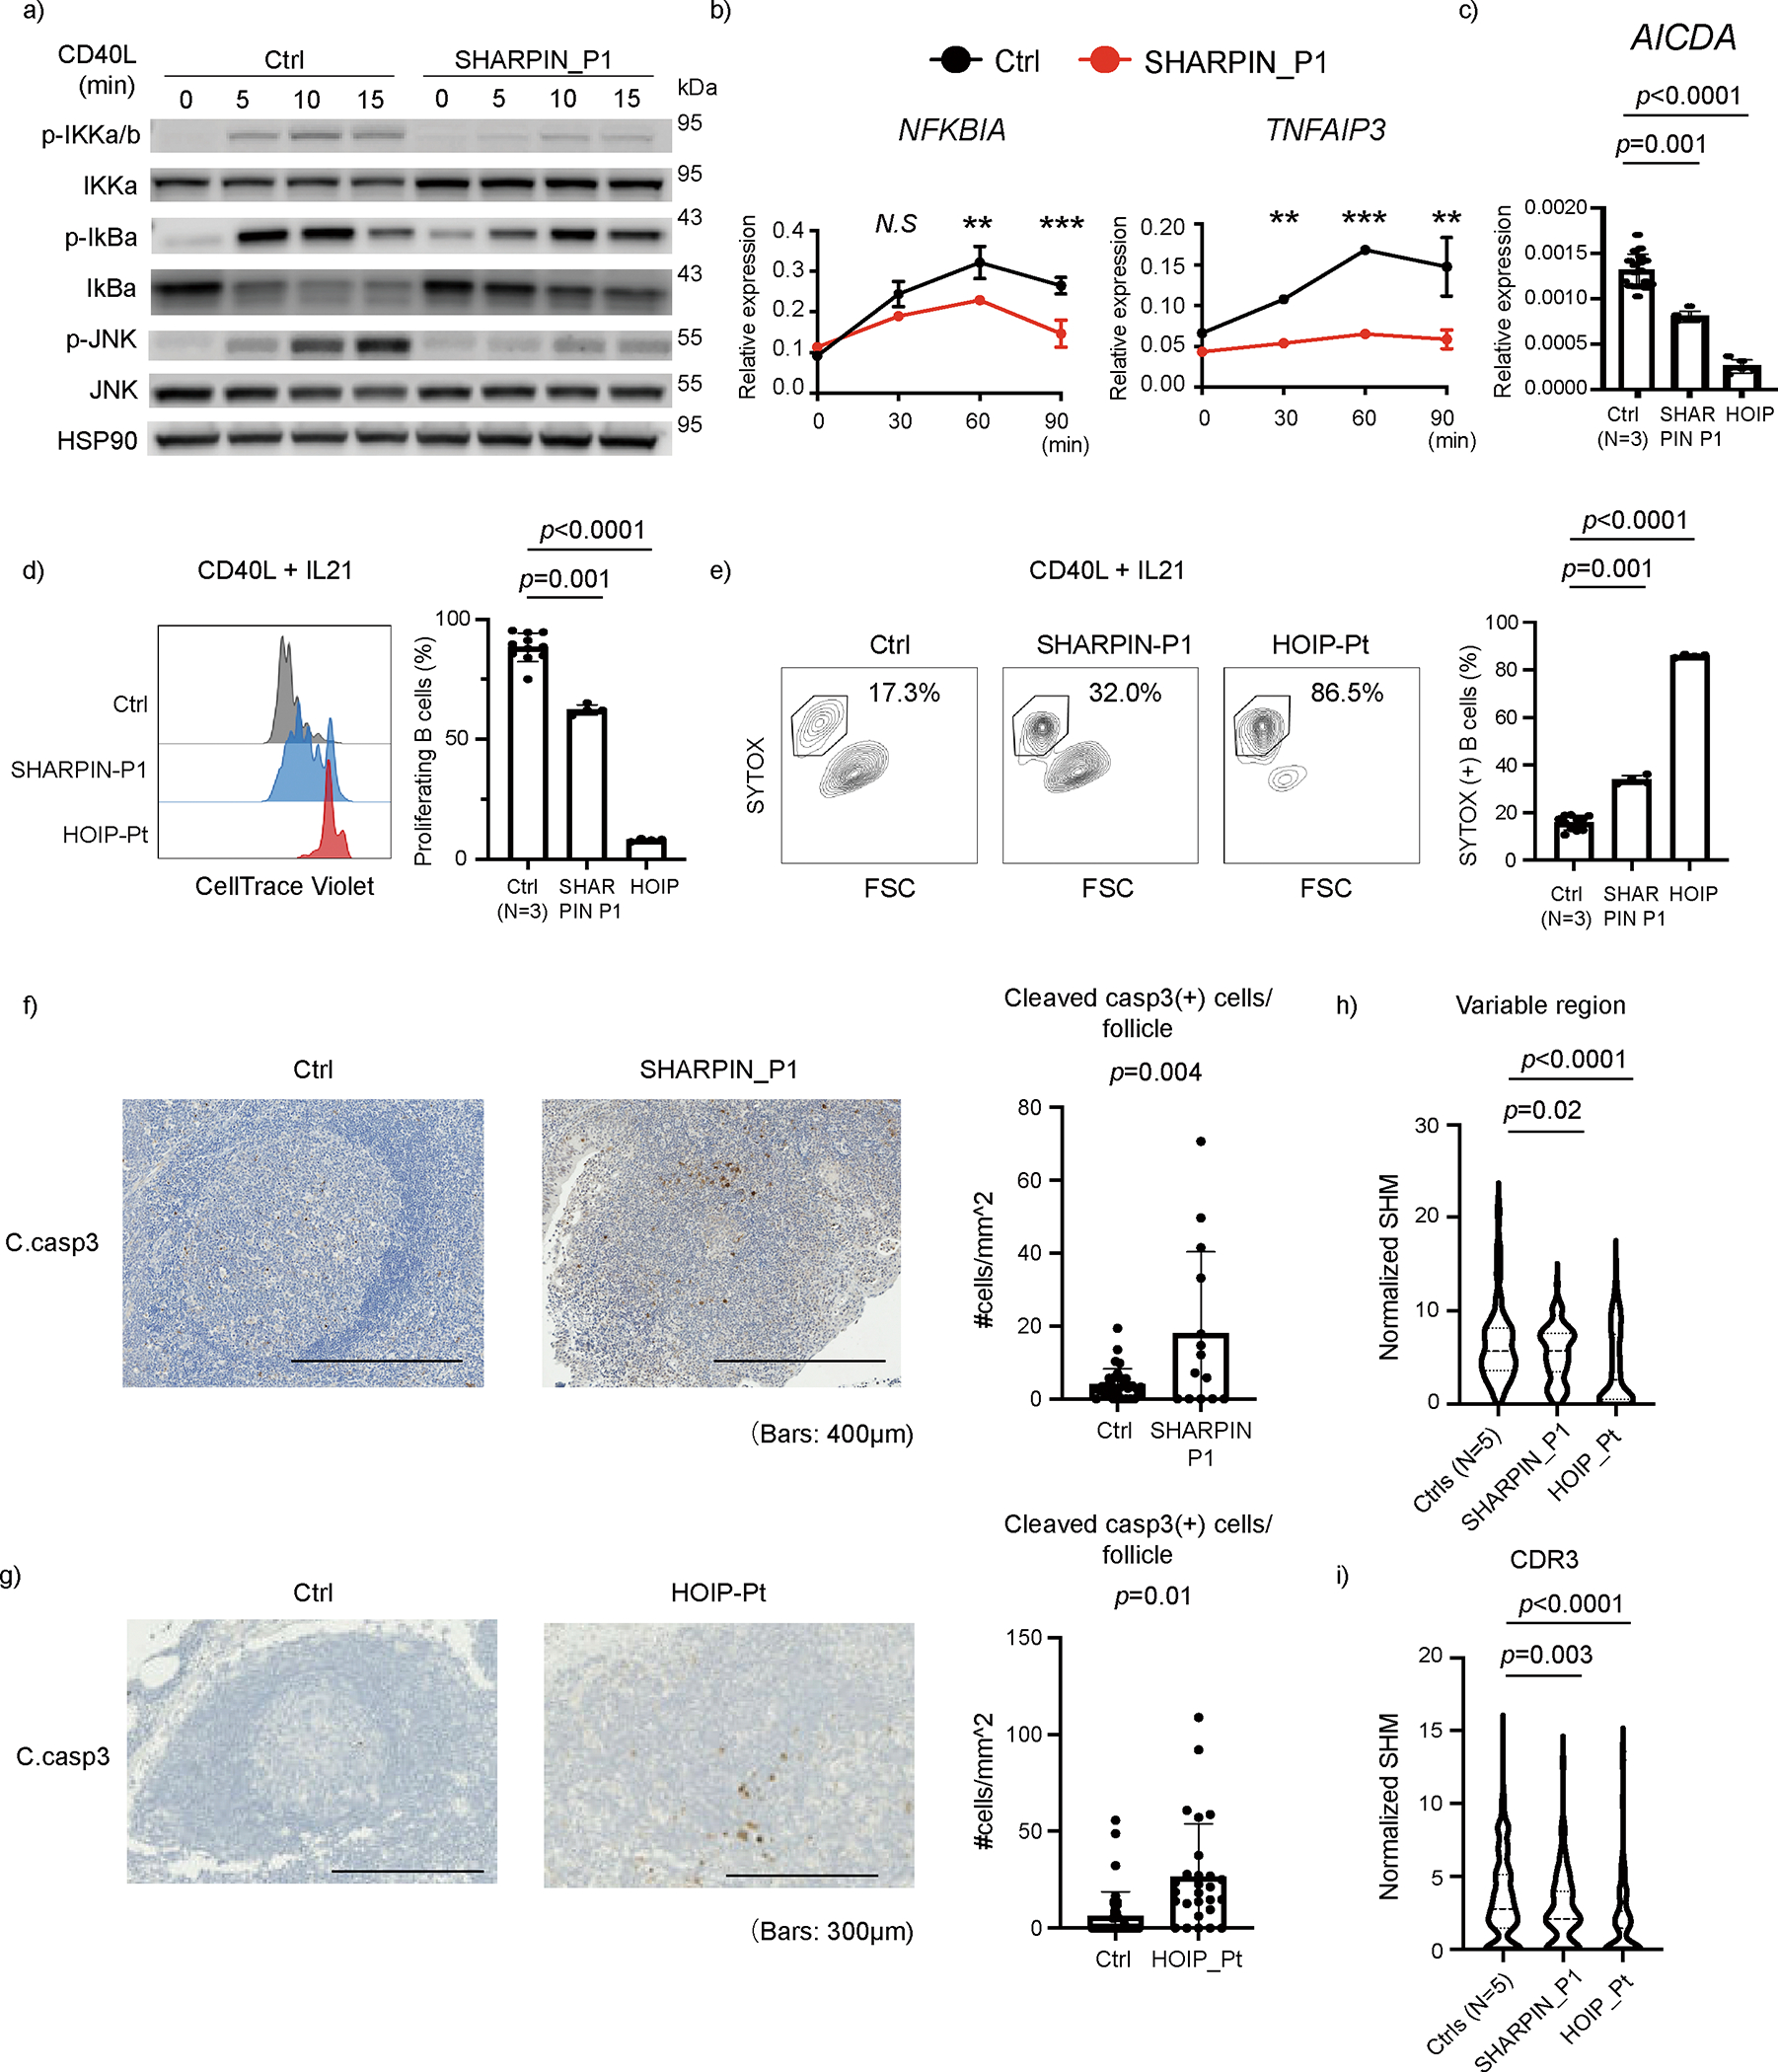
(a) NF-κB induction assay. EBV-immortalized lymphoblast (EBV-B) cells from SHARPIN deficient P1 showed attenuated phosphorylation of IKKα/β, IκBα and JNK after CD40L stimulation. (b) mRNA expression of NF-κB target genes in EBV-B cells after CD40L stimulation. The experiment was performed in biological triplicates, and the expression levels were normalized to GAPDH. Mean values ± s.d are displayed. Significance calculated with two-tailed Student’s t-test. (c) mRNA expression of AICDA gene (encoding AID), normalized to GAPDH. CD19+ primary B cells were enriched by anti-CD19 magnetic beads and stimulated with CD40L for 24h. (d) Proliferation assay using primary B cells from LUBAC deficient patients. PBMCs were stained with CellTrace Violet, cultured with CD40L and IL21 for 96 h and analyzed by flow cytometer. (e) Cell death assay by SYTOX staining of primary B cells from LUBAC deficient patients. PBMCs were cultured with CD40L and IL-21 for 96 h. (c-e) The experiments were performed using biological quadruplicates from a SHARPIN- and a HOIP-deficient patient, and the results were compared with samples from three unrelated healthy donors. Mean values ± s.d are displayed. Significance calculated with one-way ANOVA followed by Tukey-Kramer test. (f-g) Cleaved caspase-3 immunohistochemistry staining of (f) adenoid from SHARPIN deficient patient and (g) axillary lymph node from a HOIP deficient patient, compared with tissues from control donors. The number of cleaved caspase-3 positive cells per follicle was quantified and normalized by follicle area size. Mean values ± s.d are displayed. (h-i) Somatic hypermutation (SHM) quantification in FACS-sorted memory B cells from peripheral blood. SHM in the entire V region (h) and the CDR3 region (i) of the t gene were normalized by the nucleotide length of each clonotype. Normalized SHM of top 100 IGHG clonotypes per each sample are demonstrated. Significance calculated with one-way ANOVA followed by Tukey-Kramer test. (a-e) These ex vivo data are representative of two independent experiments. (f-i) The experiments were not repeated due to the limited clinical specimens.
During the maturation process in the GCs, B cells undergo SHM to produce high-affinity clones. Indeed, patients with primary antibody deficiencies caused by dysfunction during GC maturation present with a wide range of abnormalities in the peripheral immunoglobulin repertoires 30,31. Thus, we investigated the role of LUBAC on immunoglobulin repertoires in the peripheral blood by targeted RNA sequencing of the BCR genes using sorted memory B cells from SHARPIN- and HOIP-deficient patients. SHM rate in the entire variable (V) region as well as the complementarity determining region 3 (CDR3) of the IGHG gene (encoding IgG heavy chain) were significantly reduced, reflecting the patients’ deficient GC function and the subsequent limited production of high-affinity immunoglobulins in vivo (Fig. 6h and 6i). The SHM was clearly defective in the HOIP-deficient patient and was modestly diminished in the SHARPIN-deficient patient, indicating a genotype-phenotype correlation consistent with the ex-vivo functional data.
Collectively, our data indicate that the LUBAC-deficient patients have variable degrees of B cell immunodeficiency due to a dysfunction of germinal centers and propensity to cell death. Consequently, this defect led to the clinically severe immunodeficiency in the HOIP deficient patients, whereas the immunodeficiency phenotype of the SHARPIN-deficient patient was less obvious.
Genetics-guided treatment in one patient with sharpenia
Based on our functional data, as well as our confirmation that systemic inflammation in the Sharpin-deficient mice is TNF-dependent, we treated the SHARPIN-deficient P1 with etanercept, a recombinant soluble TNFR:Fc fusion protein that antagonizes TNF. Notably, his arthritic symptoms improved within 1 month from the initiation of treatment, allowing him to ambulate without assistive devices (Fig. 7a). Because the patient still had intermittent gastrointestinal tract inflammation, etanercept was switched to adalimumab, a monoclonal anti-TNF antibody indicated for treatment of inflammatory bowel disease. After the switch to adalimumab his colitis also markedly diminished, and the inflammatory biomarkers were also completely normalized (Fig. 7b–c). This resolution of inflammatory disease was accompanied by a growth spurt and full physical activity (Fig. 7d). Anti-TNF therapy also provided substantial improvement of his bone mineral density (Fig. 7e), consistent with the TNF-driven osteopenia in Sharpin-deficient mice32.
Figure 7: TNF inhibitors resolve the systemic inflammation of SHARPIN deficiency.
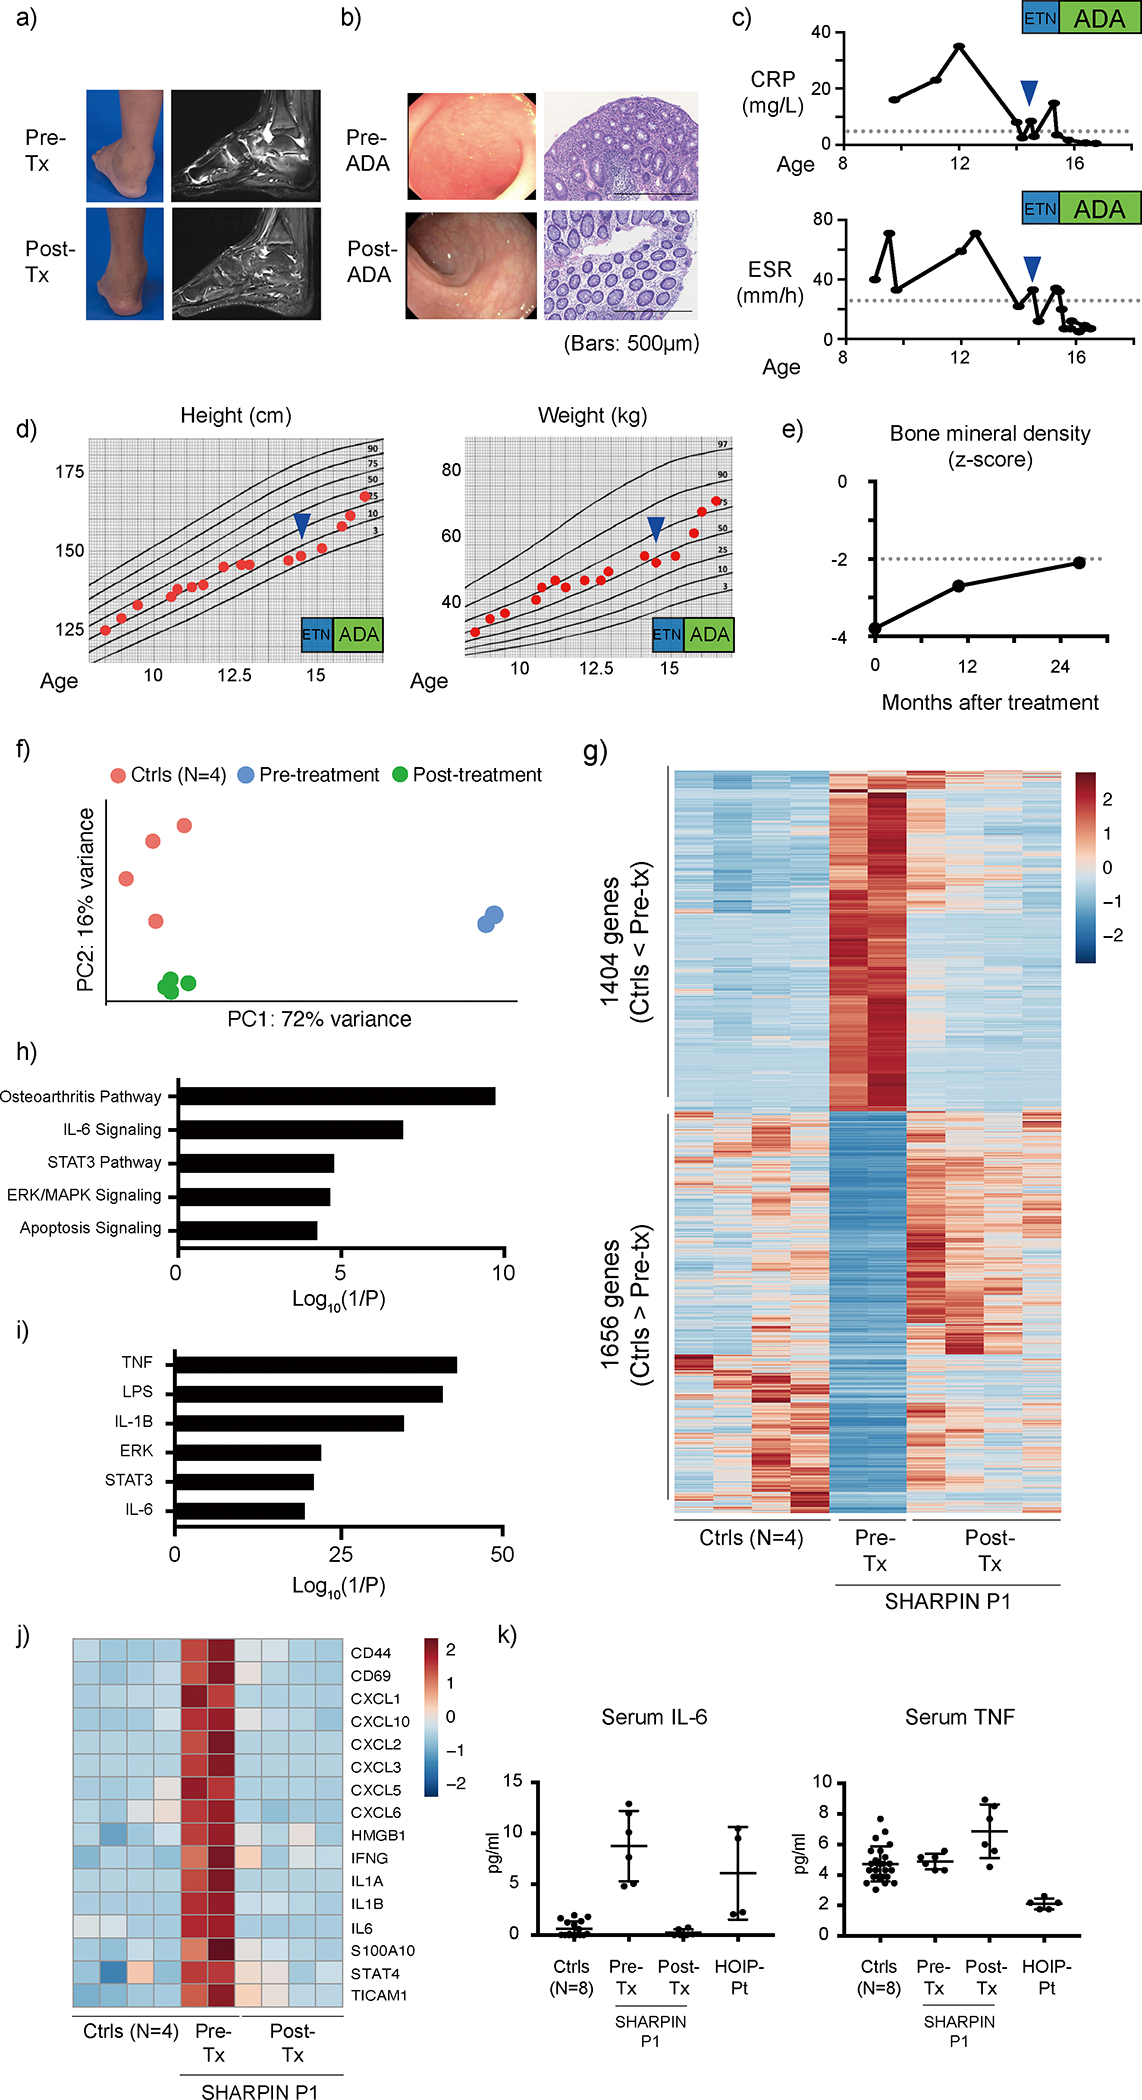
(a-b) Clinical evaluation of (a) joint inflammation and (b) colonic inflammation to TNF blockade in P1. (b) The histology images are representative of three biopsy specimens. (c) P1’s response of inflammatory markers to TNF blocking therapies. (a-c) CRP: C-reactive protein; ESR: erythrocyte sedimentation rate; ETN: etanercept; ADA: adalimumab. (d) Growth recovery of P1 after TNF blockade. (e) Recovery of bone mineral density in P1 after TNF blockade. (f) Principal component analysis using RNA sequencing data of pre- and post-treatment whole blood RNA samples from P1. (g) A heatmap showing differentially expressed genes between healthy donors (N=4) and biological replicate samples from P1 pre-treatment (N=2) and post-treatment (N=4). (h-i) Gene enrichment analysis of 1404 genes upregulated in pre-treatment P1 using Ingenuity Pathway Analysis software. (h) Pathway analysis; (i) upstream molecule analysis. (j) A heatmap demonstrating the upregulation of representative inflammation-related genes in pre-treatment samples from P1 and the response to treatment with TNF inhibitors. (k) Response of serum IL-6 and TNF to TNF blockade therapies in P1. Cytokine measurements were performed in technical duplicates from pre- and post-treatment serum samples from SHARPIN-deficient P1, and the results were compared with a HOIP-deficient patient and eight healthy unrelated donors. Mean values ± s.d are displayed. A representative data of two independent experiments.
Transcriptomic analysis of whole blood cells revealed that the principal component analysis (PCA) clearly separated the pre-treatment patient data from healthy donors, whereas the post-treatment data approached the healthy donors (Fig. 7f). We identified 3060 differentially expressed genes (DEGs) between pre-treatment dataset and healthy donors (1404 DEGs upregulated and 1656 DEGs downregulated in the pre-treatment data). Consistent with the PCA, the expression of these DEGs was dramatically normalized in post anti-TNF treatment data from the SHARPIN-deficient patient (Fig. 7g). Our pathway analysis identified an enrichment of multiple inflammatory pathways as well as upstream inflammatory molecules in the pre-treatment dataset including TNF-, IL-1β- and IL-6-mediated pathways which was markedly normalized by the anti-TNF treatment (Fig. 7h–j). Similarly, the cytokines and chemokines noted to be elevated in the patient’s pre-treatment synovial fluid were significantly normalized in the post-treatment blood transcriptome, including IL6, CXCL8 (IL8), CXCL1(GROα), CCL4 (MIP1β) and CXCL10 (IP10) (Fig. 4a–b and Extended Data Fig. 9a–b). A serum ELISA assay validated the IL-6 increase in the pre-treatment patient blood, which was also normalized after anti-TNF treatment (Fig. 7k). Of note, we did not observe prominent enrichment of interferon-stimulated genes 33 in pre-treatment sharpenia transcriptome (Extended Data Fig. 9c). Interestingly, despite the patient’s complete response to anti-TNF, the protein and mRNA expression of TNF was not elevated in the pre-treatment blood (Fig. 7k and Extended Data Fig. 9a). Altogether, these clinical and functional data further support the hypothesis that the autoinflammation in human SHARPIN deficiency is driven by the augmented cell death due to their altered responsiveness to TNF.
DISCUSSION
Our study has identified a novel recessively inherited human autoinflammatory disease that we denote “sharpenia”. Remarkably, the two patients presented with a phenotype distinct from patients with other LUBAC deficiencies and Sharpin-deficient mice. Our in vivo and ex vivo analyses provide the first clinically relevant evidence that the deficiency of human SHARPIN causes autoinflammation. Our human data corroborate previously reported animal models of apoptosis-induced inflammation particularly in the cpdm mice 12,13,34,35. Collectively, our results suggest that TNF-mediated apoptosis rather than necroptosis contributes to the autoinflammation observed in sharpenia, as well as in other LUBAC deficiencies, thereby arguing against the conventional wisdom that apoptosis is “non-immunogenic”. Interestingly, our findings also suggest that the enhanced proficiency of SHARPIN-deficient patient cells to TNF-induced apoptosis is not primarily attributed to defects in Complex I formation and the NF-kB-mediated gene transcription. Instead, it appears to be linked to increased Complex II formation. This aligns with the suggested role of LUBAC in regulating TNF-induced cell death beyond Complex I 19, although the precise molecular mechanisms behind this still require elucidation. In addition to apoptotic markers, we show activation of pyroptosis in LUBAC-deficient patients’ biopsies. Determining whether this GSDMD cleavage is driven by caspase-8-mediated proteolysis 36 37or due to LUBAC’s role in inflammasome regulation 38 will be challenging to address in human settings. Nevertheless, this finding strengthens our conclusion for the contribution of cell death in human LUBAC deficiency.
The remarkable efficacy of anti-TNF therapy in one patient, supported by genetic dissection of joint inflammation using murine models, suggests that TNF-mediated cell death contributes to the autoinflammation. The fatal outcome of the other patient, despite being on anti-TNF treatment, remains unexplained. The patient had fewer febrile episodes on anti-TNF therapy; her demise may have been due to other aspects of LUBAC deficiency such as immunodeficiency. Previous reports attributed the autoinflammation to a hyperresponsiveness of HOIL-1 and HOIP deficient monocytes to cytokines 4,5. However, we did not observe this cytokine hyperresponsiveness in sharpenia monocytes. Furthermore, despite high levels of IL-6 in P1’s synovial fluid and peripheral blood, loss of Il6 in the Sharpin-deficient mice suggests limited contribution of IL-6 to the pathogenesis. Similarly, recent publications indicated that the systemic inflammation in Sharpin-deficient mice was not fully resolved by the genetic ablation of IL-1 signaling pathway, even though the expression of IL-1β is highly elevated in their affected skin 13 39 40. In contrast, despite the unchanged TNF levels in sharpenia as well as in Sharpin-deficient mice 41, their autoinflammatory manifestations significantly improved upon TNF inhibition. Altogether, these findings highlight the critical importance of TNF-mediated signaling in driving autoinflammation in SHARPIN deficiency.
The inflammatory consequence of excessive cell death has been investigated in the past 20 years, primarily by elegant murine genetic studies. These animal models have provided a vast amount of evidence that excessive and unchecked programmed cell death, due to genetic, pharmacological or infectious insults, can lead to uncontrolled inflammation in vivo 42 43 44. This was the rational to target RIPK1 dependent-cell death and inflammation in a number of human polygenic disorders, such as rheumatic and cardiovascular diseases, neuroinflammation and neurodegeneration 42 45. However, those human patient-based studies are mainly restricted to correlative evidence, such as the upregulation of genes in cell death pathways (e.g., RIPK3) or histopathological characterizations. Consequently, recent clinical trials have not shown efficacy of RIPK1 kinase inhibitors in polygenic inflammatory diseases 46,47, which may indicate the need for better patient stratification. In our study, we found phosphorylated RIPK1 in sharpenia biopsies, suggesting that RIPK1 kinase inhibitors could be an alternative therapeutic option for sharpenia in the case of intolerance to TNF inhibitors. However, we also showed that necrostatin did not consistently inhibit TNF-induced cell death in sharpenia fibroblasts, suggesting the activation of both RIPK1 kinase-dependent and -independent cell death. Thus, the therapeutic benefit of RIPK1 inhibitors in sharpenia still needs to be cautiously estimated. Recent advances in human genetics have enabled the rapid identification of causal genes in human systemic autoinflammatory diseases (SAIDs). For example, both loss-of-function and gain-of-function mutations in RIPK1, a critical regulator of apoptosis and necroptosis, have been reported in human SAIDs, indicating that the cell death-inducing activity of RIPK1 needs to be under strict regulatory control to ensure homeostasis in humans 48 49 50 51. Furthermore, other recently reported SAIDs, such as RELA haploinsufficiency, OTULIN deficiency and TBK1 deficiency, have provided additional causal genetic evidence of cell death-mediated inflammation in humans 52 53 54. Here, by adding LUBAC deficiency as a novel member of this clinical entity, we propose to name “inborn errors of cell death (IECD)” (Supplementary Data Table 3).
The importance of studying IECD in humans, despite the recent widespread availability of murine models, has been highlighted by the species-specific differences in phenotypes occasionally observed between human IECD and associated animal models. For example, in contrast to neonatal lethality of Ripk1-deficient mice, RIPK1-deficient patients survive and manifest severe immunodeficiency with lymphopenia in addition to autoinflammation 50 51. Here, the lack of dermatitis in sharpenia, without any histologic trace of immune cell infiltration, stands out as another dramatic example of interspecies differences. Keratinocytes from Sharpin-deficient mice were shown to be susceptible to TNF- and TLR3 agonist-induced cell death ex vivo 12 13 55, and their skin phenotype was rescued by crossing with either Tnf heterozygote mice (Tnf+/−) or mice devoid of apoptotic and necroptotic machinery (Casp8+/−, Casp8+/−Ripk3−/−) 12 10,13. Recently Sundberg et al., reported that conditional deletion of Sharpin in keratinocytes leads to severe dermatitis comparable to Sharpin-deficient mice, whereas the skin phenotype of fibroblast-specific Sharpin-deficient mice is mild. In contrast, a severe arthritic phenotype was only observed in fibroblast-specific and not in keratinocyte-specific Sharpin-deficient mice 23. Together with our patient data, these findings may indicate yet unknown cell lineage-specific mechanisms for the expression and function of the LUBAC that differ between humans and mice.
In this study, we highlight a role of LUBAC in human secondary lymphoid organ homeostasis and CD40 signaling pathway. We observed that despite the normal lymphocyte markers in blood, the adenoidal lymphocytes from a sharpenia patient are developmentally affected. We observed markedly defective GC formation in secondary lymphoid organs in vivo, caused by a specific reduction in GC-associated lymphocytes, namely GC-B cells and GC-Tfh cells. We further provided mechanistic evidence by demonstrating the marked attenuation of CD40L-mediated activation and heightened sensitivity to cell death in LUBAC-deficient patients’ B cells ex vivo, whereas the effect of human SHARPIN loss on T cell activation was seemingly limited. Recent reports have emphasized the indispensable role of GC-B cells in activating Tfh cells for their maturation and the subsequent collaboration in stimulating GC formation. Thus, we hypothesize that in sharpenia, the increased B cell death during GC maturation may be the initial cause of the GC hypoplasia. Lastly, we observed that the rate of SHM in LUBAC deficiencies in vivo correlates with the genotype and the degree of clinical immunodeficiency. Especially in our sharpenia patient, the observed residual induction of AID, along with the intact PC pool potentially caused by compensatory EF differentiation, may be providing attenuated but still sufficient antibody production and affinity maturation for many circumstances.
Beside their immunological manifestations, LUBAC-deficient patients present with glycogen storage disease in skeletal muscle, heart and liver, although the molecular mechanism leading to this potentially life-threatening non-immune manifestation remains unclear. Recent work by Kelsall et al. demonstrated that mice with E3 ligase-inactive HOIL-1 (p.Cys458Ser), devoid of immune dysregulation, develop spontaneous glycogenosis in the brain and the heart, reminiscent of LUBAC deficient patients 56. Mechanistically, they provide evidence that HOIL-1, but not HOIP, directly ubiquitylates unbranched glucosaccharides in vitro, a novel paradigm-shifting example of ester-linked ubiquitylation of non-proteinaceous targets similarly to lipopolysaccharide57. Importantly, these data are consistent with the clinical observation that HOIL-1-deficient patients manifest more severe glycogen storage phenotypes than either HOIP deficient patients 4–6 or the sharpenia patients. The glycogen accumulation in HOIL-1 catalytic-inactive mice is age-dependent, especially in heart; thus, it is important to note that a careful follow-up is necessary for all LUBAC deficient patients who survive early-onset immunological complications.
In summary, we have provided genetic and mechanistic evidence that human LUBAC deficiency is driven by the increased propensity to cell death and consequently manifests with the two opposing forms of immune dysregulation, autoinflammation and B cell immunodeficiency. Studying the role of TNF-induced cell death in other human inborn errors of immunity will provide further insights for the development of targeted therapies.
METHODS
Ethics statement
All enrolled participants or their parents/guardians provided written informed consent, including consent to publish, in accordance with the Declaration of Helsinki. This study has been approved by the Institutional Review Board of the National Institutes of Health (94-HG-0105), and has been registered at ClinicalTrials.gov (NCT00001373).
Exome sequencing (ES)
ES for the P1 pedigree was performed using the Ion Torrent AmpliSeq RDY Exome kit (Life Technologies) and the Ion Chef and Proton instruments (Life Technologies). Briefly, 100 ng of gDNA was used as the starting material for the AmpliSeq RDY Exome amplification step following the manufacturer’s protocol. Library templates were clonally amplified and enriched using the Ion Chef and the Ion PI Hi-Q Chef kit (Chef package version IC.4.4.2; Life Technologies). Enriched, templated Ion Sphere Particles were sequenced on the Ion Proton sequencer using the Ion PI chip v3 (Life Technologies). Reads were mapped against the University of California, Santa Cruz (UCSC) hg19 reference genome (GCF_000001405.13) using the Torrent Mapping Alignment Program (TMAP) map4 algorithm. Variants were called by the Torrent Variant Caller plugin (v.4.414–1) using the “Generic-Proton-Germ Line: Low Stringency” configuration. Variants were annotated using ANNOVAR (http://annovar.openbioinformatics.org/).
For the P2 pedigree, ES library was prepared with the Twist Library preparation kit and captured with Human Core Exome probes extended by Twist Human RefSeq Panel (Twist Bioscience, San Francisco, CA) following the manufacturer’s recommendations. Paired-end (2 × 100 bp) sequencing was performed on a NextSeq2000 sequencer (Illumina, San Diego, CA). The raw reads were mapped using the Burrows-Wheeler Alignment (BWA) tool. For each sample, average target read coverage was at least 60-fold. Variant calling was done using the GATK HalotypeCaller of the GATK software suite. The annotation was performed by VEP. The whole process, from raw sequencing to variant annotation, was executed through an analysis pipeline articulated with bcbio-nextgen (1.2.9).
Whole blood RNA sequencing
Total RNA was isolated from whole blood collected in PAXgene Blood RNA tubes using PAXgene Blood RNA Kit (PreAnalytiX) per manufacturer’s instructions. Total RNA with high quality (RIN > 8) was used for cDNA library preparation using the NEBNext Ultra II Directional RNA library preparation kit with NEBNext Poly(A) mRNA magnetic isolation module and NEBNext Globin and rRNA Depletion kit (E7765, E7490 and E7755, New England Biolab). Sequencing was performed on an Illumina NovaSeq6000 System in a 2 × 150 bp paired-end mode. Sequenced reads were mapped against the human reference genome (GRCh38) using HISAT2. Mapped reads were quantified using HTSeq. All the count data were normalized by total mapped reads, and differentially expressed genes were detected using edgeR. Pathway enrichment analysis was performed using Ingenuity Pathway Analysis (IPA) software (Qiagen).
Plasmids and antibodies
The open reading frame of human SHARPIN gene (Addgene, #50014) was subcloned into retroviral vector (pDS-FB-IRES-hygromycin, kindly shared from Dr. Iain Fraser, NIAID, NIH) or a mammalian expression vector (pHAGE-N-FLAGx3-HA, kindly shared from Dr. Shireen Sarraf, NINDS, NIH) using the Gateway system (Invitrogen). Mutant vectors were constructed using site-directed mutagenesis.
The following antibodies were used for immunoblotting: HOIP (Abcam: ab46322; ubiquigent: 68-0013-100)); HOIL1 (Santa Cruz:sc-393754); SHARPIN (Millipore: ABF128 for N-terminus; Cell Signaling Technologies, CST: 12541 for C-terminus; Proteintech: 14626-I-AP); β –Actin (Santa Cruz; sc-47778); IkBα (CST: 4814); p-IkBα (CST: 2859); p-IKKα/β (CST: 2697); IKKα (CST: 11930); p-JNK (CST: 4668); JNK (CST: 9252); HSP90 (CST: 4877); Casp-8 (Enzo: ALX-804-242-C100; CST: 9746); Casp-3 (CST: 9662); p-MLKL (CST:91689); MLKL (CST: 14993); p-RIPK1 (CST:65746); RIPK1 (CST: 3493); FADD (Milipore: 05–486; Proteintech: 14906-1-AP for complex II immunoprecipitation); A20 (CST: 5630); TNFR1 (Santa Cruz: SC-8436 (H5)); p-NF-kB2 (CST: 37359); p-NF-kB2 S866/870 (CST: 4810); p-p65-S536 (CST: 3033); anti-mouse IgG, HRP-linked (CST:7076); anti-rabbit IgG, HRP-linked (CST:7074). The M1 antibody detecting linear ubiquitin was produced in-house according to the published sequences 58, and the production was reported previously 59. The antibodies were all used in 1:1000 dilution.
Cell culture and transfection
Human embryonic kidney (HEK) 293T, HeLa, patient-derived SV40-immortalized fibroblasts and mouse embryonic fibroblasts from Sharpin-deficient mice were maintained in DMEM with 10% fetal bovine serum and 1% PenStrep. Plasmid transfections were carried out using lipofectamine 2000 or NEON electroporation system (Invitrogen). Cells were routinely tested for mycoplasma using the Universal Mycoplasma Detection kit (ATCC).
Western blotting and immunoprecipitation
Whole-cell lysates were prepared using ice-cold M-PER (Thermo Fisher Scientific) supplemented with protease inhibitor (Roche) and phosphatase inhibitor (Roche). Proteins were separated with Novex Tris-Glycine Gel Systems (Invitrogen) and transferred to nitrocellulose membranes with Trans-Blot Turbo systems (Biorad). After incubation with primary and secondary antibodies, proteins were visualized using ECL Plus Western blotting substrate (Thermo).
For NF-κB2 signaling, total PBMCs were stimulated with or without anti-CD3 antibody 1μg/mL (eBioscience, 16-0037085) for 48 hours. Total cell lysates were prepared in lysis buffer (50mM Tris pH 7.4, 150mM NaCl, 2mM EDTA, 0.5% Triton X-100 and 0.5% NP40 and halt protease and phosphatase inhibitor cocktail [Sigma PPC1010]) and subjected to immunoblotting.
For LUBAC immunoprecipitation, cells were lysed using ice-cold lysis buffer containing 30 mM Tris-HCl, 150 mM NaCl, 1% Triton-X 100 and protease inhibitor cocktail (Roche). 1–2 mg of lysates were incubated with 3μg of anti-HOIL1 antibody (Santa Cruz: sc-393754) for 1 h, followed by incubation with protein A/G agarose beads for additional 30 min, washed 6 times with lysis buffer and subjected to immunoblotting.
For TNFR1-SC preparation (complex I IP), cells were stimulated with modified tandem affinity purification (moTAP)-tagged TNF15 for the indicated times, washed twice with ice-cold PBS and harvested in IP lysis buffer and incubated at 4 °C for 30 min. moTAP-TNF (500 ng) was added to the lysates of non-stimulated control samples. Subsequently, the lysates were centrifuged at 13,300 rpm for 20 min and the TNFR1-SC was immunoprecipitated using M2-Agarose beads (Sigma) overnight at 4 °C. The following day, the beads were washed three times with IP lysis buffer (1 ml), and proteins were eluted by boiling in reducing sample buffer. Samples were analysed by western blotting.
To analyse complex II, cells were pre-treated with 20 μM zVAD-fmk (abcam) followed by a stimulation with moTAP-TNF for the indicated times. After stimulation cells were collected in IP lysis buffer and incubated at 4 °C for 30 min. Subsequently, the lysates were centrifuged at 13,300 rpm. for 20 min and incubated overnight at 4°C with 15 μl protein G beads pre-blocked with 1% BSA and coupled with 2 μg anti-FADD antibody (Proteintech, 14906-1-AP). The following day beads were washed three times with IP-lysis buffer and incubated with reducing sample buffer at 95°C for 5 min before western blot analysis.
Time-lapse imaging-based cell death assay
SV40-immortaized fibroblasts were plated onto a 96-well plate (1×10^4/well, Corning #3596) and incubated overnight. The next day, the cells were stimulated and stained with SYTOX green (Thermo) and Nuclight Rapid Red Dye (Sartorius) for dead and live cells, respectively. Percentage of cell death was assayed every 1–2h by time-lapse imaging using the IncuCyte S3 live cell analysis instrument (Sartorius) for 24h with 5% CO2 and 37 °C climate control.
Histology and immunohistochemistry
Biopsies were fixed in formalin and embedded in paraffin before sectioning and staining. For cleaved casp-3 stainig, deparaffinization, hematoxylin and eosin (H&E) staining, and immunohistochemistry were performed by NDBbio Laboratories (Baltimore, MD). pRIPK1, cleaved GSDMD (cl-GSDMD) and CD45 stainings were performed using anti-pRIPK1 (Ser166; CST: 44590), anti-cl-GSDMD (CST: 36425) and anti-CD45 (3076, BD Pharmingen) antibodies. The specificities of the anti-pRIPK1 and anti-cl-GSDMD were validated with immunocytochemistry in HT29 cells stimulated with TNF + BV6 + zVAD (4h) and in THP1 cells stimulated with LPS (4h) + nigericin (1h), as reported previously 60,61. Stained slides were scanned, and image files were processed using NDP.view2 software (Hamamatsu photonics). Quantification was performed using ImageJ and Qupath (Queen’s University, Belfast, Northern Ireland) software.
Flow cytometry
For intracellular cytokine studies, PBMCs were cultured with IL-1β (R/D, 10 ng/ml) and Monensin for 6 h and fixed with 4% PFA. Cells were permeabilized with Perm/Wash buffer (BD), immunolabeled with antibodies against CD14 (BD; 557154), TNF (BD; 554513), IL-6 (BD; 561441) and IL-1β (Abcam; 16168) and were analyzed by CytoFLEX (BD).
For proliferation assays, PBMCs were incubated with CellTrace Violet (Cell Proliferation Kit, Thermo) and stimulated with CD40L (Enzo; ALX522-110-C010), IL-21 (Peprotech; 200-21), anti-CD3 (eBioscience; 16-0037-85), anti-CD28 (eBioscience; 16-0289-85) and PHA (Sigma; L9017). 72 or 96 h later the cells were stained with surface markers and analyzed by flow cytometer. Staining was performed with following antibodies from BD: CD3 (UCHT1), CD4 (RPAT4), CD8 (RPAT8), CD19 (HIB19) and CD80 (L307.4).
For measurement of Th1, Th2, and Th17 populations, PBMCs were stimulated with PMA (100 ng/ml, Sigma P8139) and ionomycin (1 μM, Invitrogen, I24222) for 5 hours in the presence of brefeldin A (10 μg/ml, Sigma B7651). The cells were stained with CD3 and CD4 fluorochrome-conjugated antibodies for 30 minutes and then washed, fixed, permeabilized with the BD Cytofix/Cytoperm kit according to the manufacturer’s instructions. Cells were stained with indicated antibodies; anti–IFN-γ (clone B27); anti–IL-4 (8D4-8); anti–IL-17A (N49-653); IL-2 (MQ1-17H12).
Adenoid analysis by high dimensional spectral cytometry
Adenoid cells were mechanically disrupted to make single cell suspension after adenoidectomy and cryopreserved until data acquisition. Cryopreserved adenoid cells were thawed and 5×10^6 cells per adenoid were used for the analysis. Cells were first stained with live dead dye for 15 min at room temperature (RT), washed twice and then incubated with true stain monocyte blocker (BioLegend) for 5 min. Antibodies for chemokine receptors (anti-CCR7 for 10 min, anti-CCR6, anti-CXCR5 and anti-CXCR3 together with brilliant stain buffer plus (BD) for 5min, anti-TCRγδ for 10 min) were sequentially added at RT. Antibody mix containing the rest of the surface antibodies and brilliant stain buffer plus were then added directly to the cells and incubated for 30 min at RT in the dark. Cells were washed three times and stained with fluorescence conjugated streptavidin for 15 min. Then cells were washed another three times and fixed in 1% paraformaldehyde for 20 min at RT before data acquisition on spectral flowcytometry (Aurora, Cytek). Data analysis was performed using Flowjo (version 10.7.2).
Ex vivo cytokine secretion assay
Frozen PBMCs were resuspended in RPMI with 10% FBS and incubated for 1–2 h. After additional 30 min of serum starvation, the cells were further stimulated with LPS (1μg/ml) or IL-1β (10ng/ml) for 6 h. Cytokines in the supernatant were measured by ELISA (R&D Systems).
Multiplexed detection of inflammatory cytokines and chemokines
Multiplex ELISA measurement of cytokines and chemokines in synovial fluid was performed using 34-Plex Human ProcartaPlex 1A (Thermo). The sample from the SHARPIN deficient patient was obtained before the initiation of anti-TNF treatment, and compared with samples from osteoarthritis patients for comparison (N=7).
5’ RACE-based deep sequencing of the BCR genes
Total RNA was extracted from naïve and memory B cells (CD3− CD19+ CD27− and CD3− CD19+ CD27+, respectively), sorted from bulk PBMCs of the SHARPIN and HOIP deficient patients as well as 5 healthy age-matched donors. 5’ RACE-based cDNA synthesis was performed according to the manufacture’s protocol (SMARTer Human BCR IgG/IgM H/K/L Profiling Kit, Takara Bio). Briefly, 10 ng of total RNA from sorted B cells were reverse transcribed using 5’RACE, with primers each contained a unique 8 bp unique molecular identifier (UMI) barcode sequences for demultiplexing. Synthesized cDNA was further amplified using multiplex PCR primers specific for IGHM and IGHG sequences. Sequencing was performed on an Illumina MiSeq system in a 2 × 300 bp paired-end mode. After demultiplexing UMI barcode sequences with MIGEC, the sequence reads were mapped using MiXCR. Immunoglobulin isotype-specific quantification of somatic hypermutation was conducted using MIGMAP. Downstream data analysis was performed using VDJtools.
Animal experiments
The WEHI Animal Ethics Committee approved all mouse experiments, which were conducted according to the Australian Code for the care and use of animals for scientific purposes. All strains are on a C57BL/6 background with a minimum of five generations of backcrossing.
Statistical analysis and Reproducibility
Statistical analyses were performed using GraphPad Prism (version 9.0.2) or R (version 4.3.1). No statistical methods were used to predetermine sample sizes. Data were displayed as dot plots, which include the mean value and the SD displayed as a bar. Data distribution was assumed to be normal, but this was not formally tested. Student’s t-test or one-way ANOVA followed by Tukey-Kramer test was used for the analyses. Mice were not randomized. Data collection and analysis were not performed blind to the conditions of the experiments.
Extended Data
Extended Data Figure 1: Genetic analysis, SHARPIN expression, complex I formation and non-canonical NF-κB activation.
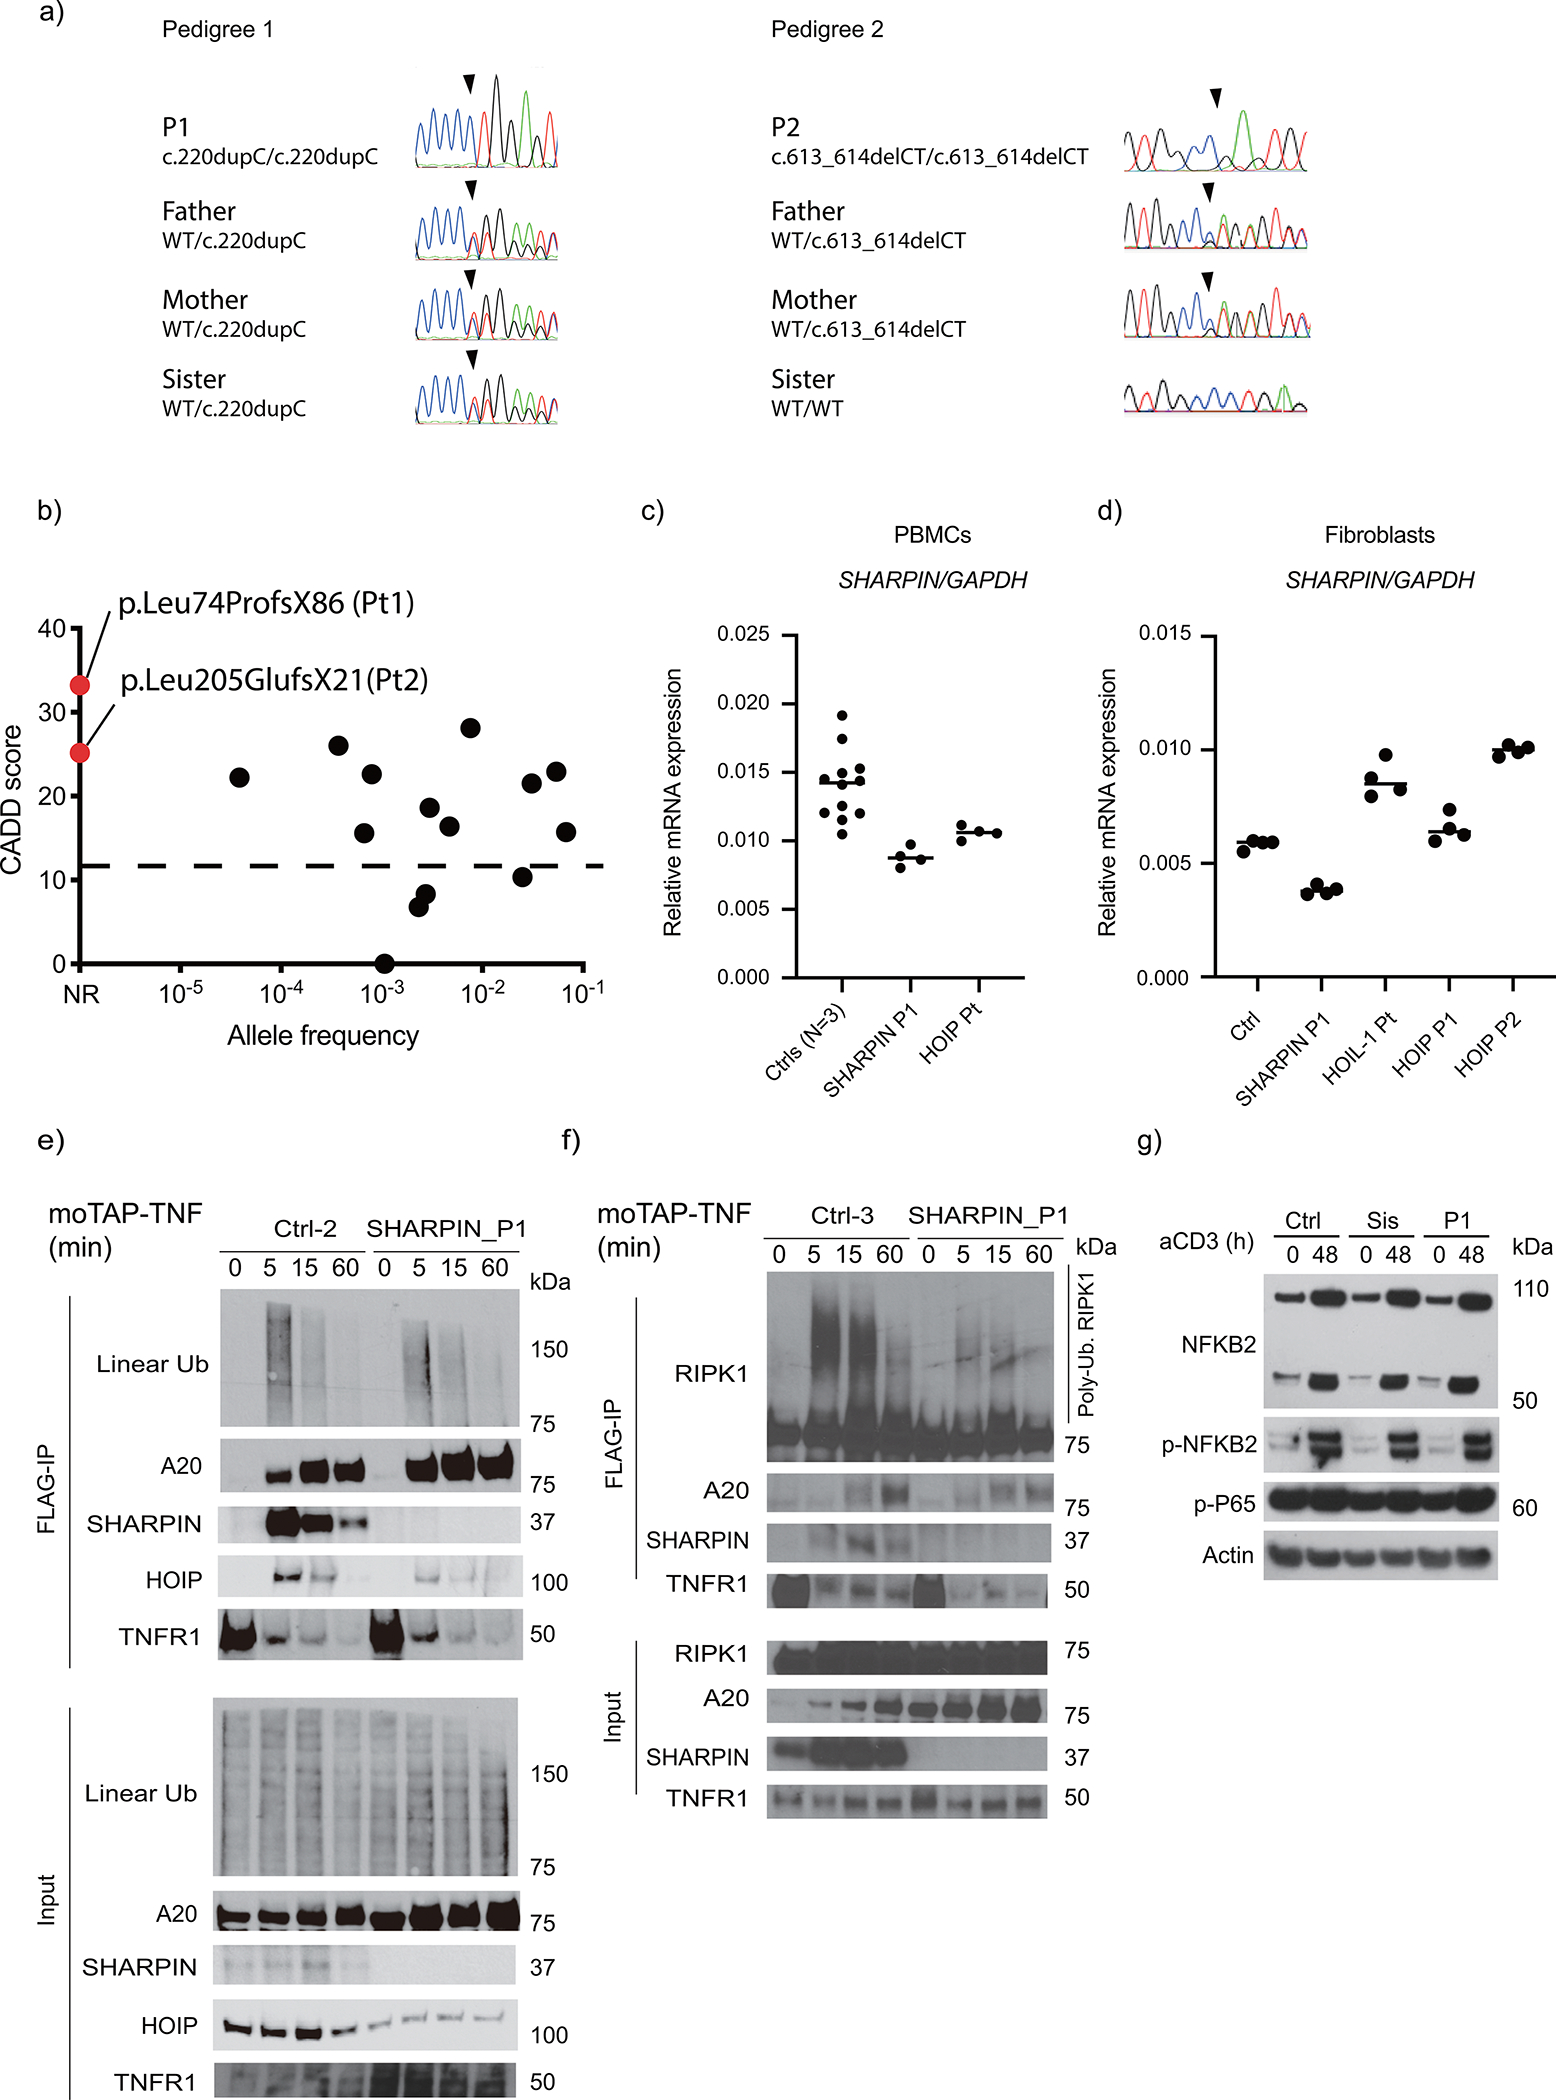
(a) Sanger sequence electropherograms demonstrating homozygous frameshift variants in the patients. (b) Population allele frequency and CADD score for SHARPIN variants homozygous in public databases. The two SHARPIN variants appear in red. CADD-Mutation Significance Score (MSC) cutoff for SHARPIN (90% confidence interval) was indicated by dashed line. NR: not reported. (c-d) Normalized mRNA levels of SHARPIN in (c) PBMCs and (d) fibroblasts from LUBAC-deficient patients and healthy controls. RNA was extracted from each sample and was measured with technical quadruplicates. Mean value is displayed as a bar. (e-f) TNFR1-signaling complex (TNFR1-SC) formation in fibroblasts from P1 and two unrelated healthy controls. Fibroblasts were stimulated with modified tandem affinity purification (moTAP)-tagged TNF (1 μg/ml) for the indicated times. TNFR1-SC was purified with anti-FLAG immunoprecipitation, and analyzed by western blotting. Supporting data for Fig. 2e. (g) Normal induction of non-canonical NF-κB in P1. Total PBMCs were stimulated with anti-CD3 (aCD3) for the indicated durations, and the expression of NFKB2 p100 (full length) and p52 (active form) was detected by western blot. Sis: P1’s sister carrying a heterozygous p.Leu74ProfsX86 variant. Representative result of two independent experiments.
Extended Data Figure 2: Cytokine expression studies ex vivo in LUBAC-deficient patients.
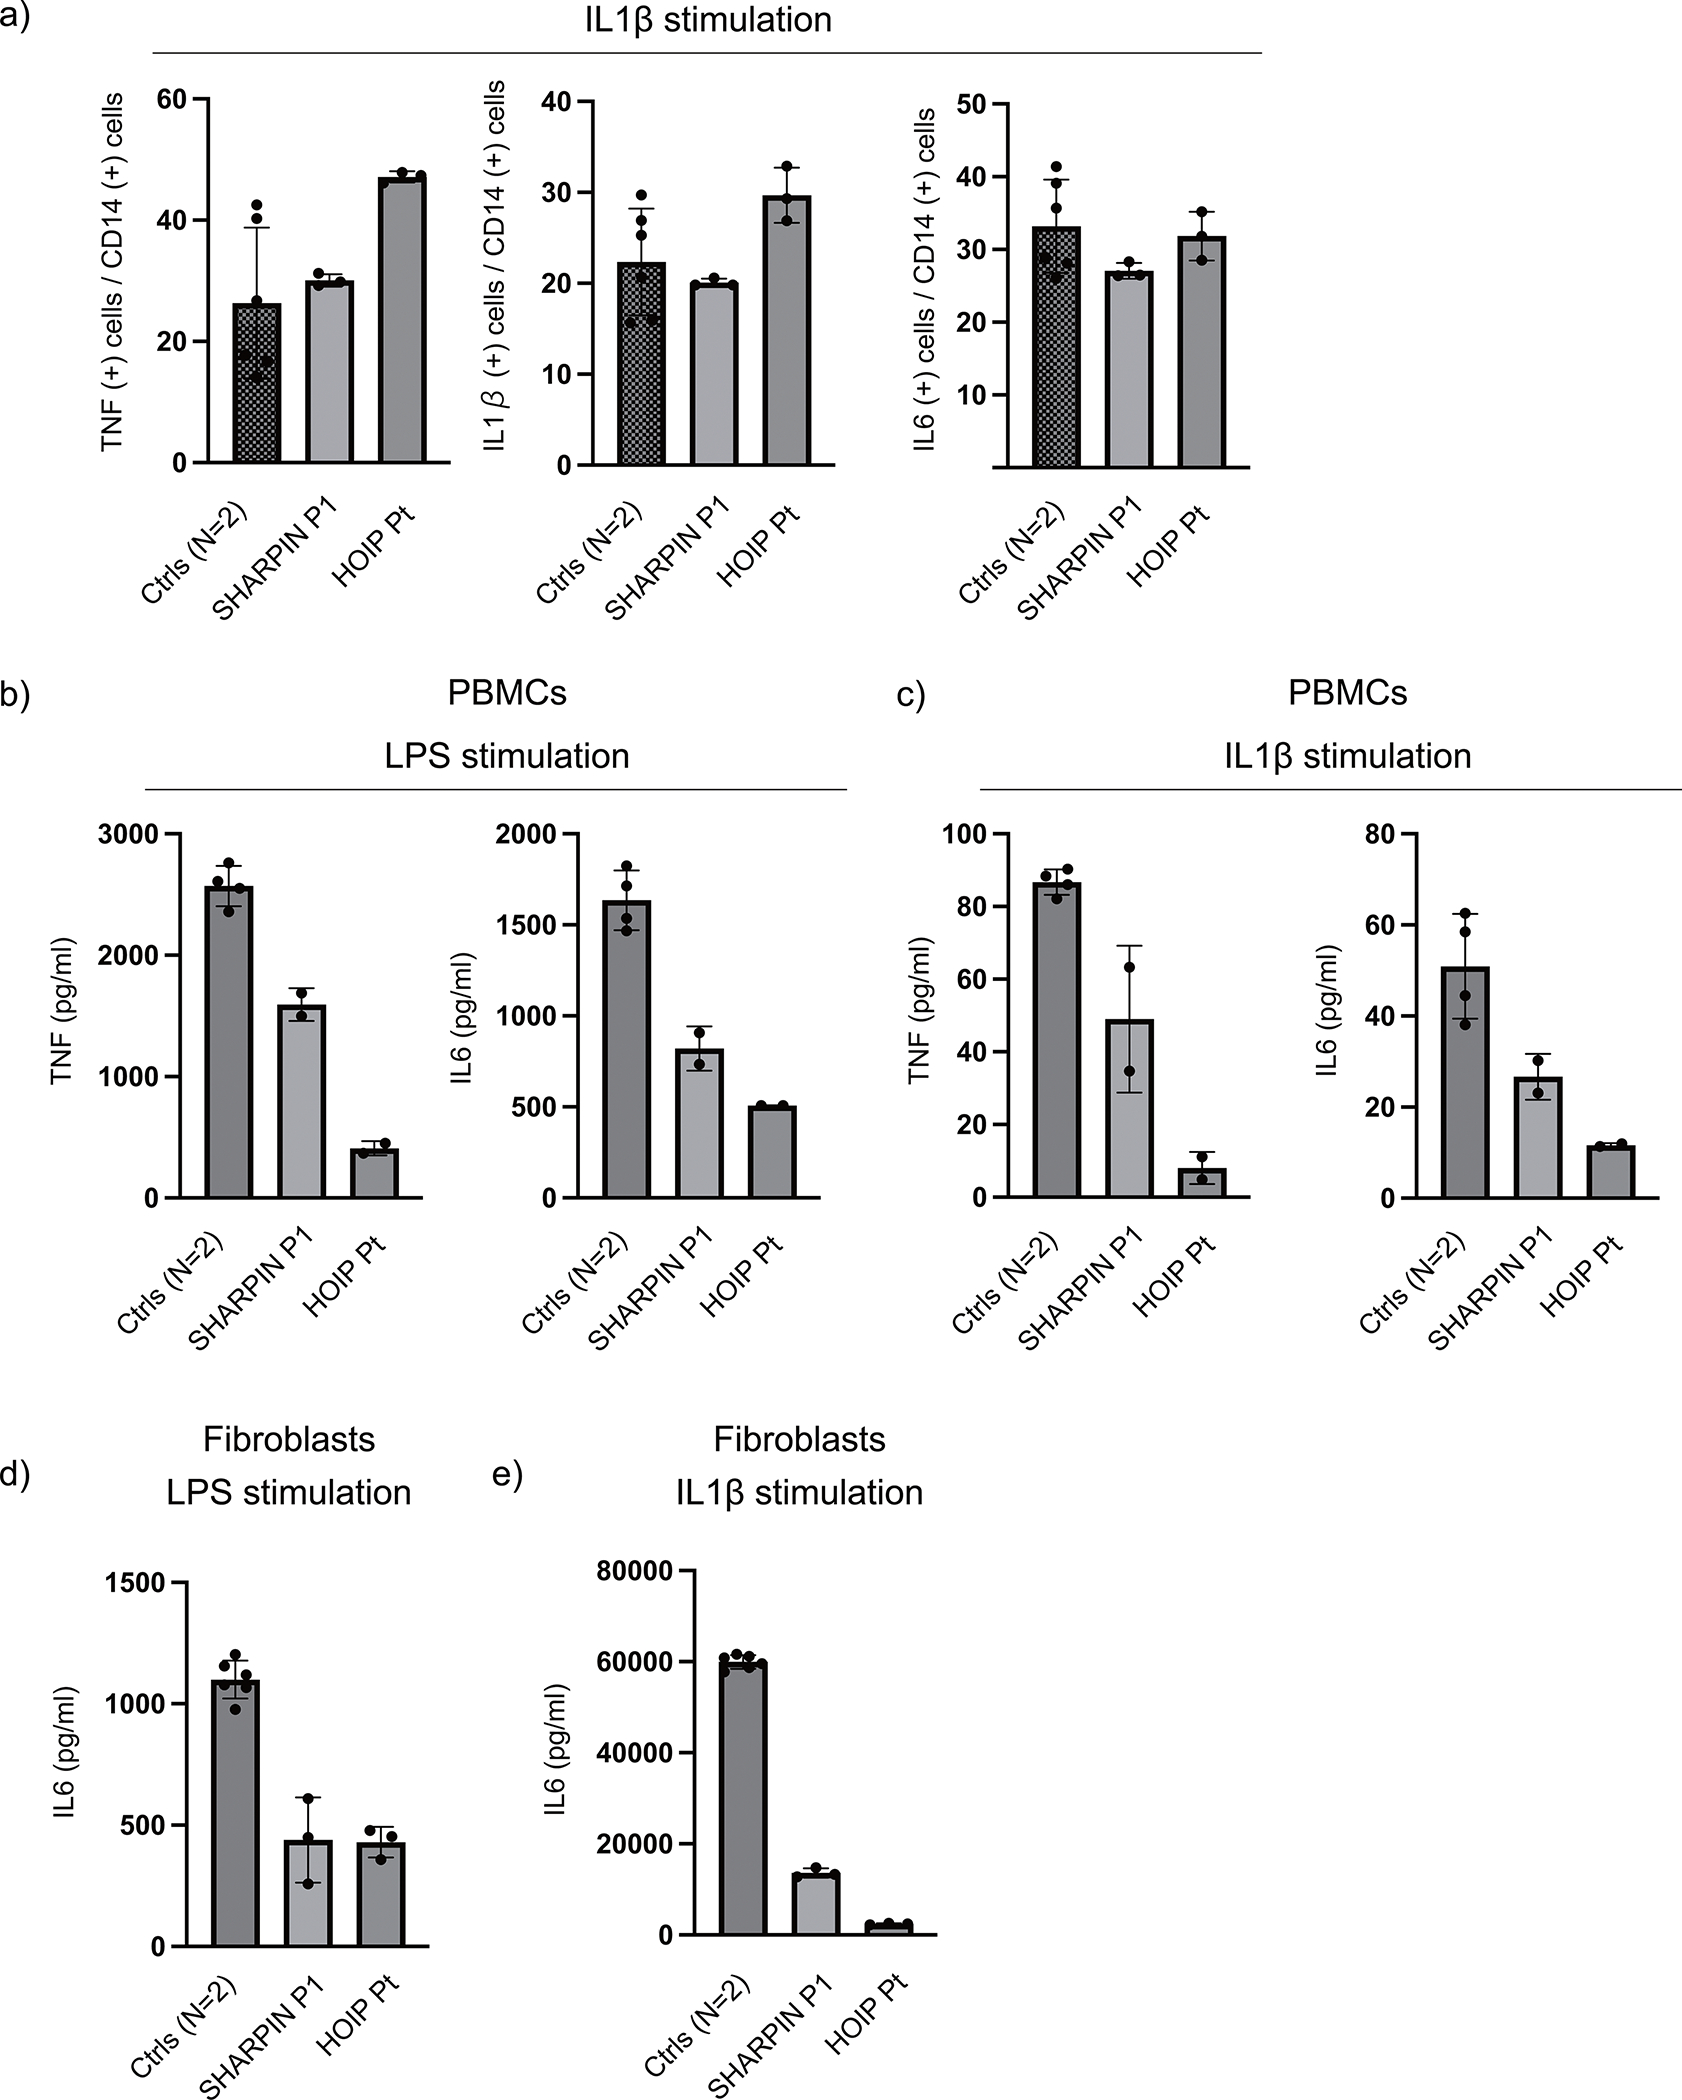
(a) Cytokine expression in LUBAC-deficient monocytes. PBMCs from SHARPIN (P1)- and HOIP-deficient patients and two healthy controls were stimulated with IL-1β (10 ng/ml) for 6h, and the intracellular accumulation of cytokines in CD14+ monocytes were quantified by flow cytometry. (b-c) Cytokine secretion from LUBAC-deficient PBMCs. PBMCs from SHARPIN and HOIP-deficient patients and two healthy controls were stimulated with (b) LPS (1 μg/ml) or (c) IL-1β (10 ng/ml) for 6h, and secreted cytokines were measured by ELISA. (d-e) Cytokine secretion from LUBAC-deficient fibroblasts. Fibroblasts from SHARPIN (P1)- and HOIP-deficient patients and two healthy controls were stimulated with (d) LPS (1 μg/ml) or (e) IL-1β (10 ng/ml) for 24h, and secreted cytokines were measured by ELISA. (a-e) The experiments were performed with biological triplicates (a,d,e) or duplicates (b,c), and shown are the representative of two independent experiments. Mean values ± s.d are displayed.
Extended Data Figure 3: Cell death induction assays.
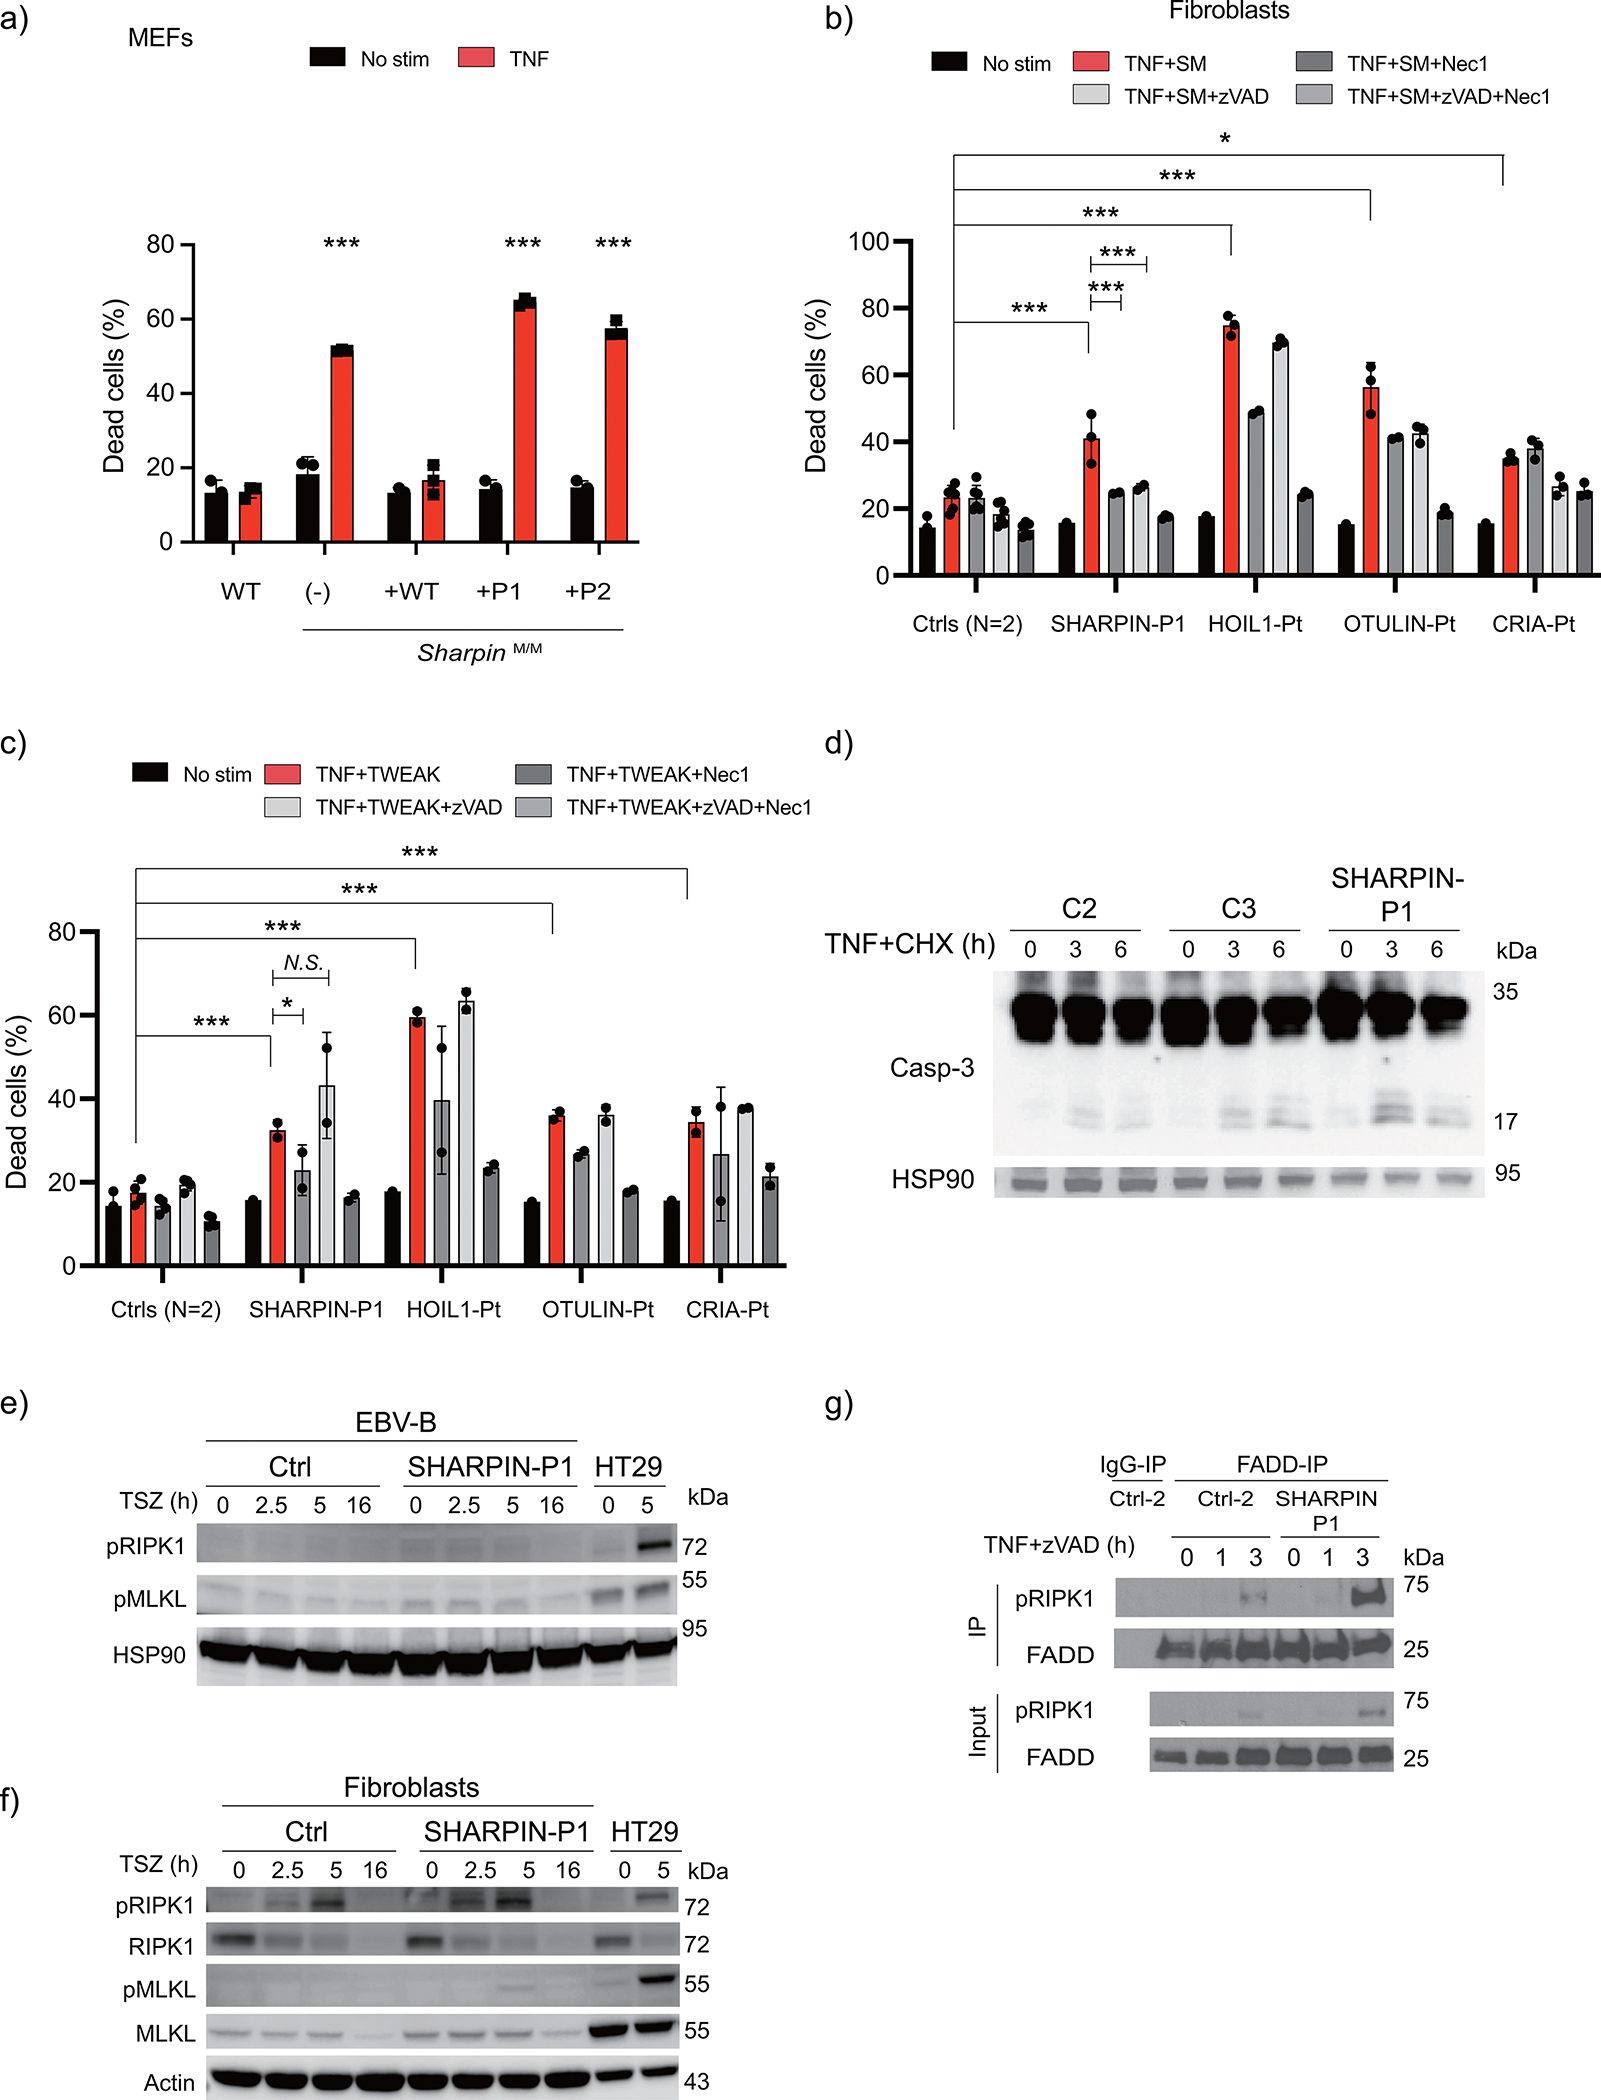
(a) Cell death assay using immortalized mouse embryonic fibroblasts from Sharpin-deficient mice stably reconstituted with wild type SHARPIN or patient-derived SHARPIN mutants. (b-c) Cell death assay using fibroblasts from a SHARPIN-deficient patient (P1), a patient with HOIL1 deficiency, otulipenia and cleavage resistant RIPK1-induced autoinflammation (CRIA), and two unrelated healthy controls. The cells were stimulated with TNF (100 ng/ml) combined with (b) smac mimetic (SM: compound A: 100nM) or (c) human recombinant TWEAK (50 ng/ml), in the presence or absence of zVAD (pan-caspase inhibitor: 20 μM) or Nec1 (RIPK1 inhibitor: 50 μM). The dead cell percentages after 16 h of treatment are shown. (a-c) The experiments were performed with biological triplicates (a, b) or duplicates (c), and shown are representative of two (a, c) or five (b) independent experiments. Mean values ± s.d are displayed. Quantitative data were analyzed using one-way ANOVA followed by Tukey-Kramer test. *p < 0.05, **p < 0.01, ***p < 0.001, ****p < 0.0001, N.S., not significant. (d) Western blot analysis of caspase-3 cleavage in cell lysates from fibroblasts from SHARPIN-deficient patient and two unrelated healthy controls. The cells were stimulated with TNF (100ng/ml) and cycloheximide (CHX 50 μg/ml) for the indicated times. Supporting data for Fig. 3c. (e-f) Necroptosis induction assay using EBV-immortalized lymphoblastoid cells (e) and fibroblasts (f) from SHARPIN-deficient patient. The fibroblasts were stimulated with TSZ (TNF, smac mimetic (compound A) and zVAD) for the indicated time. HT29 cells were used as a positive control for the phospho-antibodies. Representative result of two independent experiments. (g) Complex II immunoprecipitation in fibroblasts from SHARPIN-deficienct P1 compared with an unrelated healthy control. Fibroblasts were stimulated with TNF + zVAD for the indicated times, and the lysates were subjected to immunoprecipitation. Supporting data for Fig. 3d.
Extended Data Figure 4: In vivo and in vitro characterization of cell death in human LUBAC deficiency.
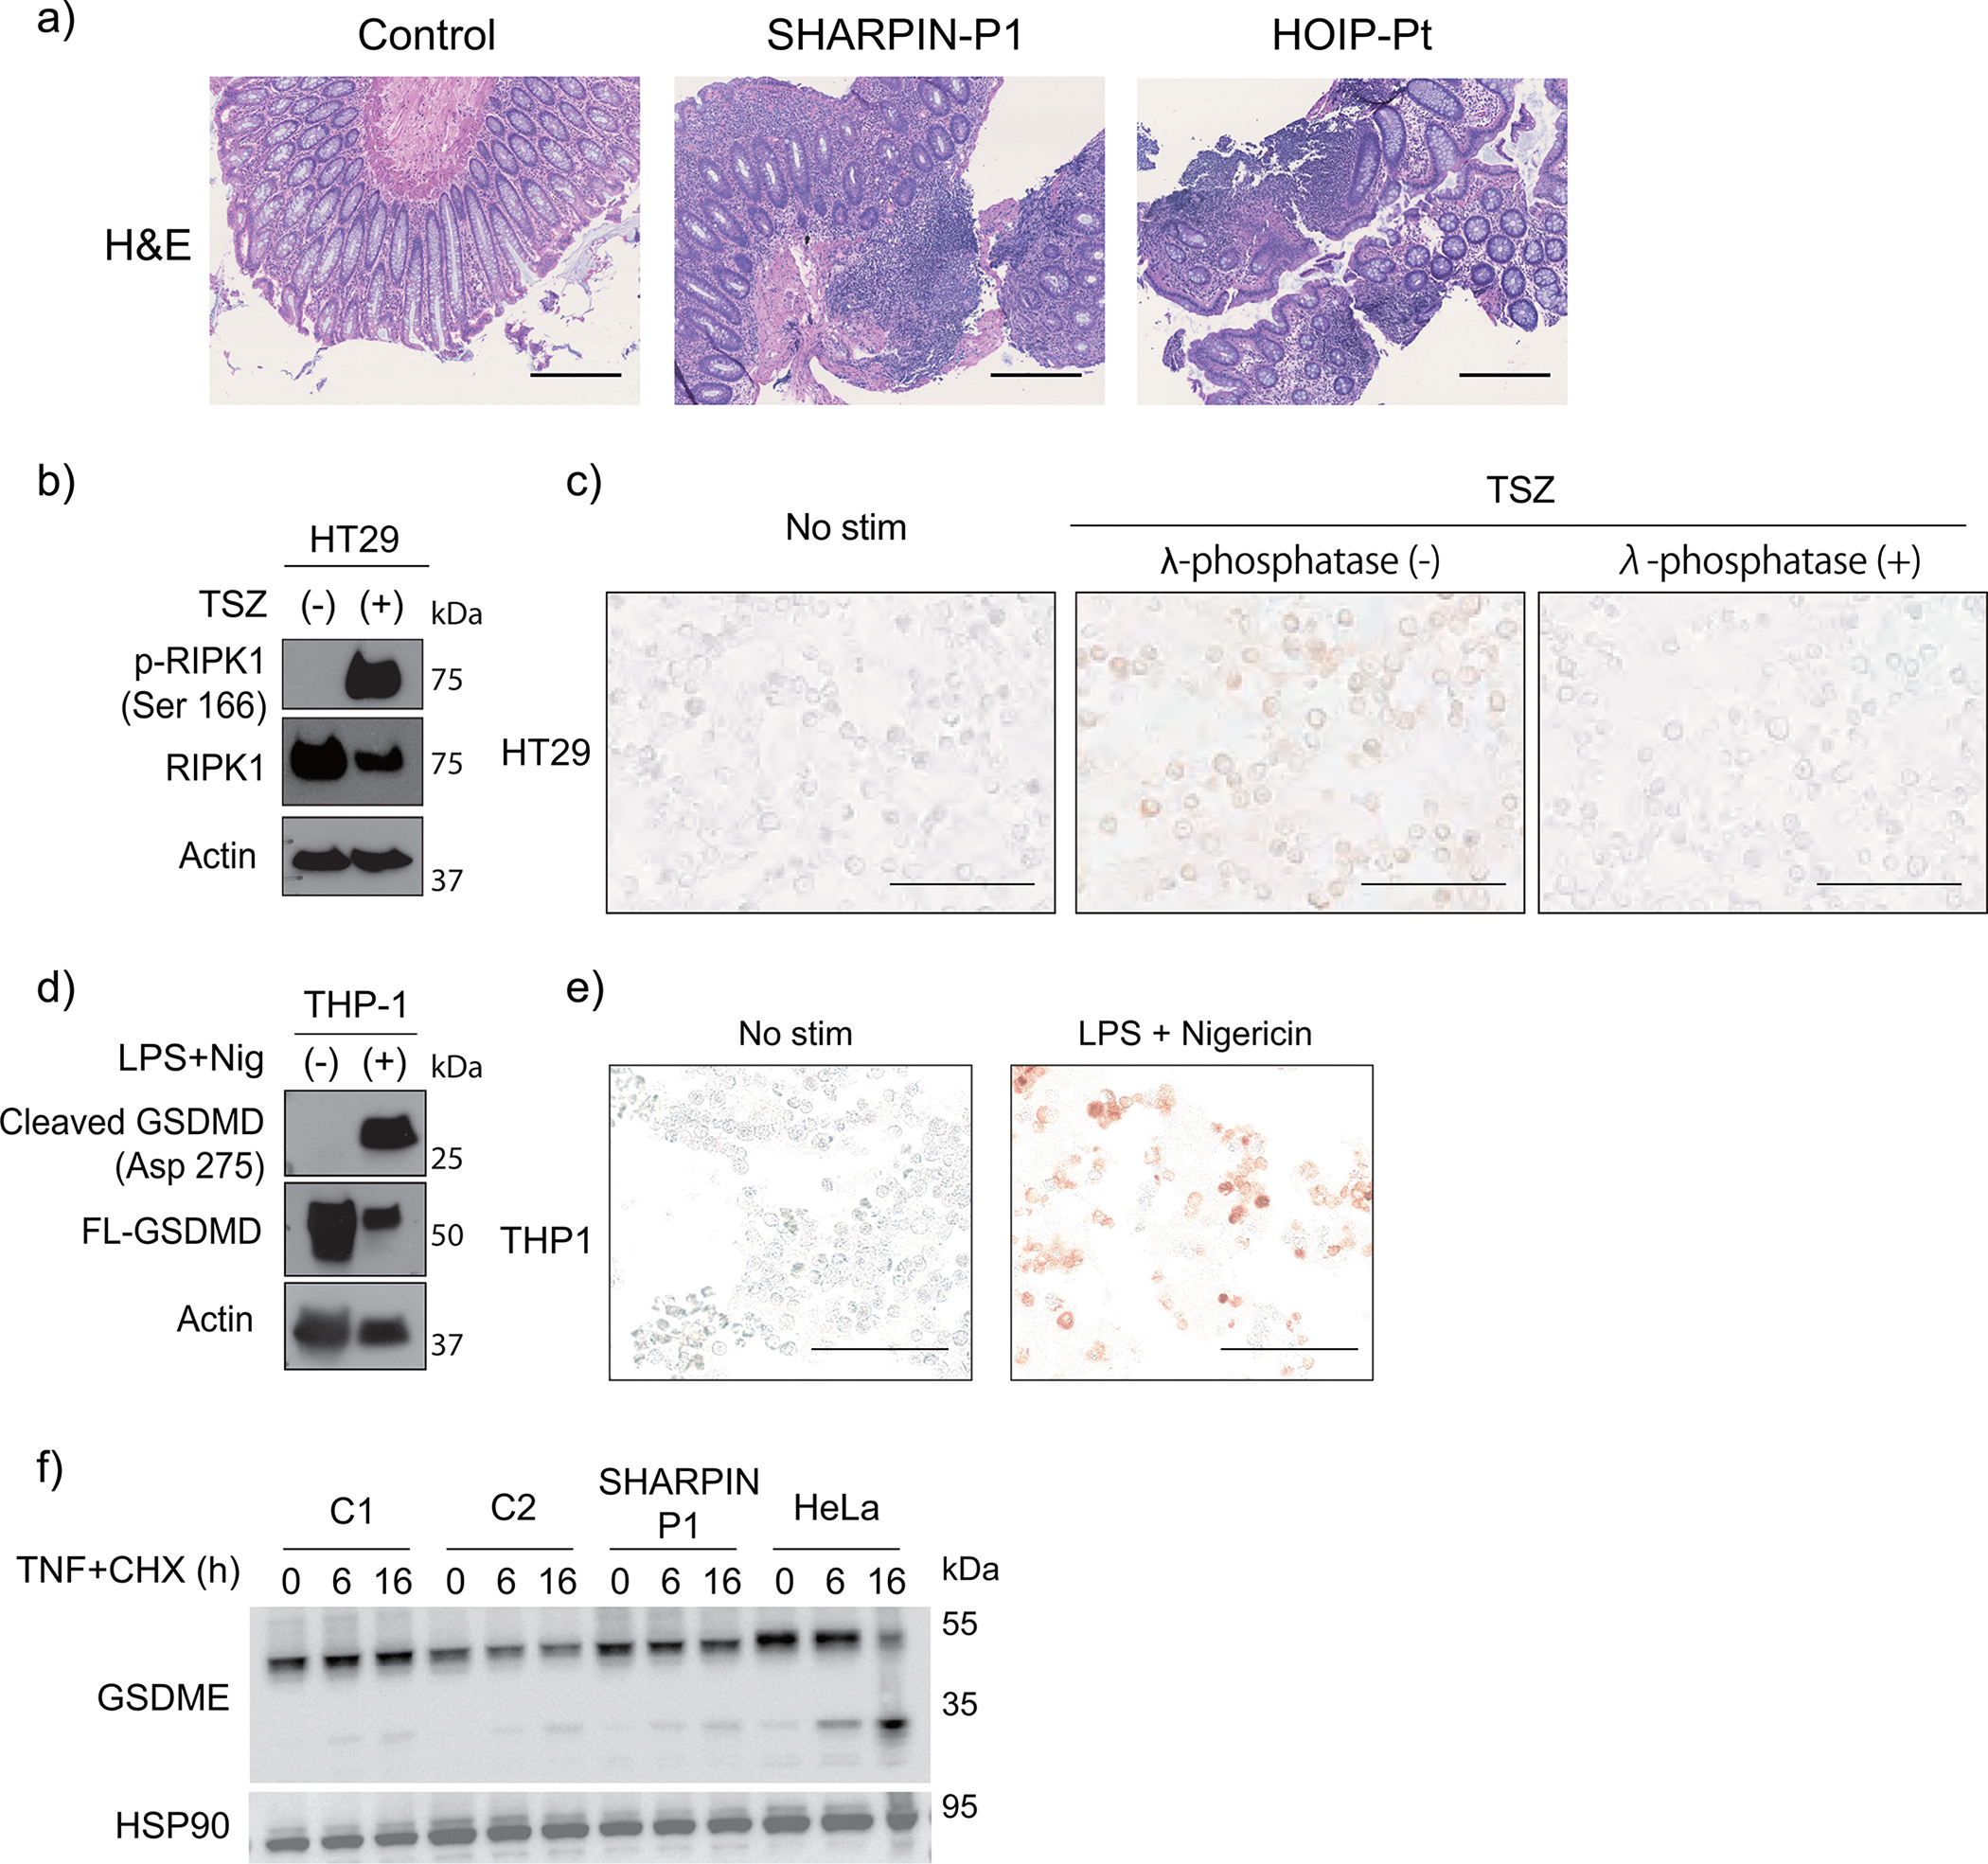
(a) Hematoxylin and eosin (H&E) staining of colon biopsy samples from LUBAC-deficient patients. Bars: 0.4mm. These images were obtained as a part of clinical testing and were not repeated. (b-c) Supporting data for Fig. 3g to validate the specificity of p-RIPK1 antibody to detect RIPK1 Ser166 phosphorylation with (b) western blot and (c) immunocytochemistry. HT29 cells were stimulated with TSZ (TNF + smac mimetic (BV6) + zVAD) for 4h. Note that TSZ-stimulated cells show positive staining of pRIPK1, which was removed by λ-phosphatase treatment. (d-e) Supporting data for Fig. 3h to validate the antibody specificity for cleaved GSDMD (Asp275) with (d) western blot and (e) immunocytochemistry. THP1 cells were pre-incubated with LPS for 3h and were further stimulated with nigericin for another 1h. (b-e) These experiments were aimed to confirm the specificity of the antibodies and were not repeated. (f) Cleavage of GSDME in dermal fibroblasts stimulated with TNF (100 ng/ml) + CHX (50 μg/ml) for the indicated times. HeLa cells were used as a positive control. Representative result of two independent experiments.
Extended Data Figure 5: Characterization of joint inflammation in SHARPIN deficiency.
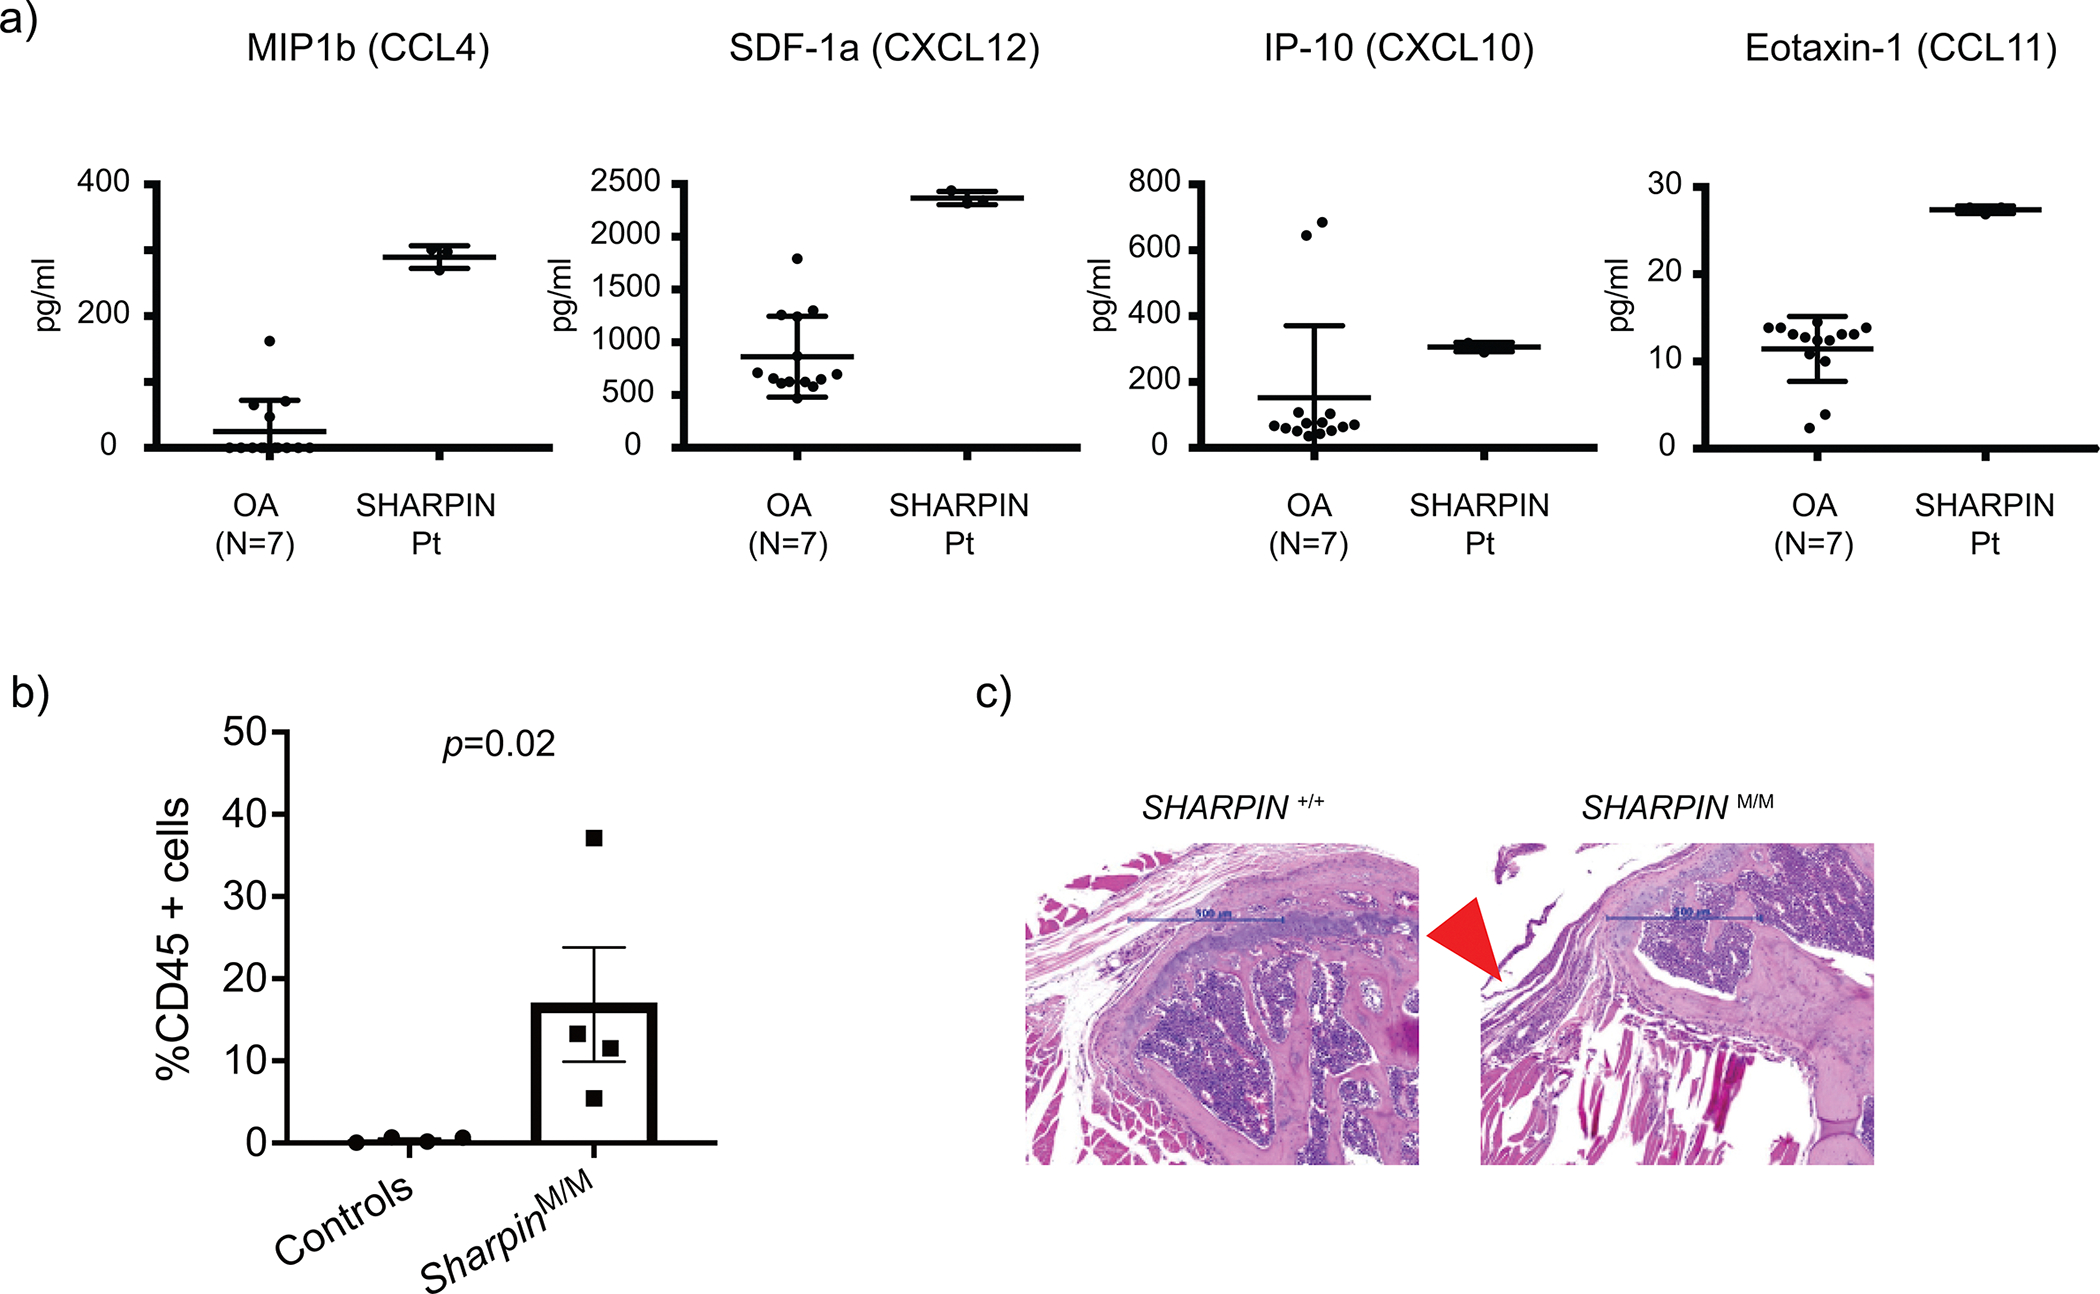
(a) Multiplex ELISA measurement of chemokines in the sterile synovial fluid from P1 before the initiation of anti-TNF treatment and osteoarthritis (OA) control donors (N=7). The samples were measured in technical triplicate (P1) or duplicate (OA), respectively. Mean values ± s.d are displayed. (b) Quantification of CD45 positive cells in tendons of shoulder joints of control and Sharpin-deficient mice (n=4 for each group). Statistical method? Data are represented as mean values + SEM. (c) Representative hematoxylin and eosin (H&E) staining sections of elbow joints from Sharpin-deficient mice (N=) and wild type littermate control (N= _. Arrowhead indicates inflamed ligament.
Extended Data Figure 6: Characterization of secondary lymphoid organ abnormalities in LUBAC deficiencies.
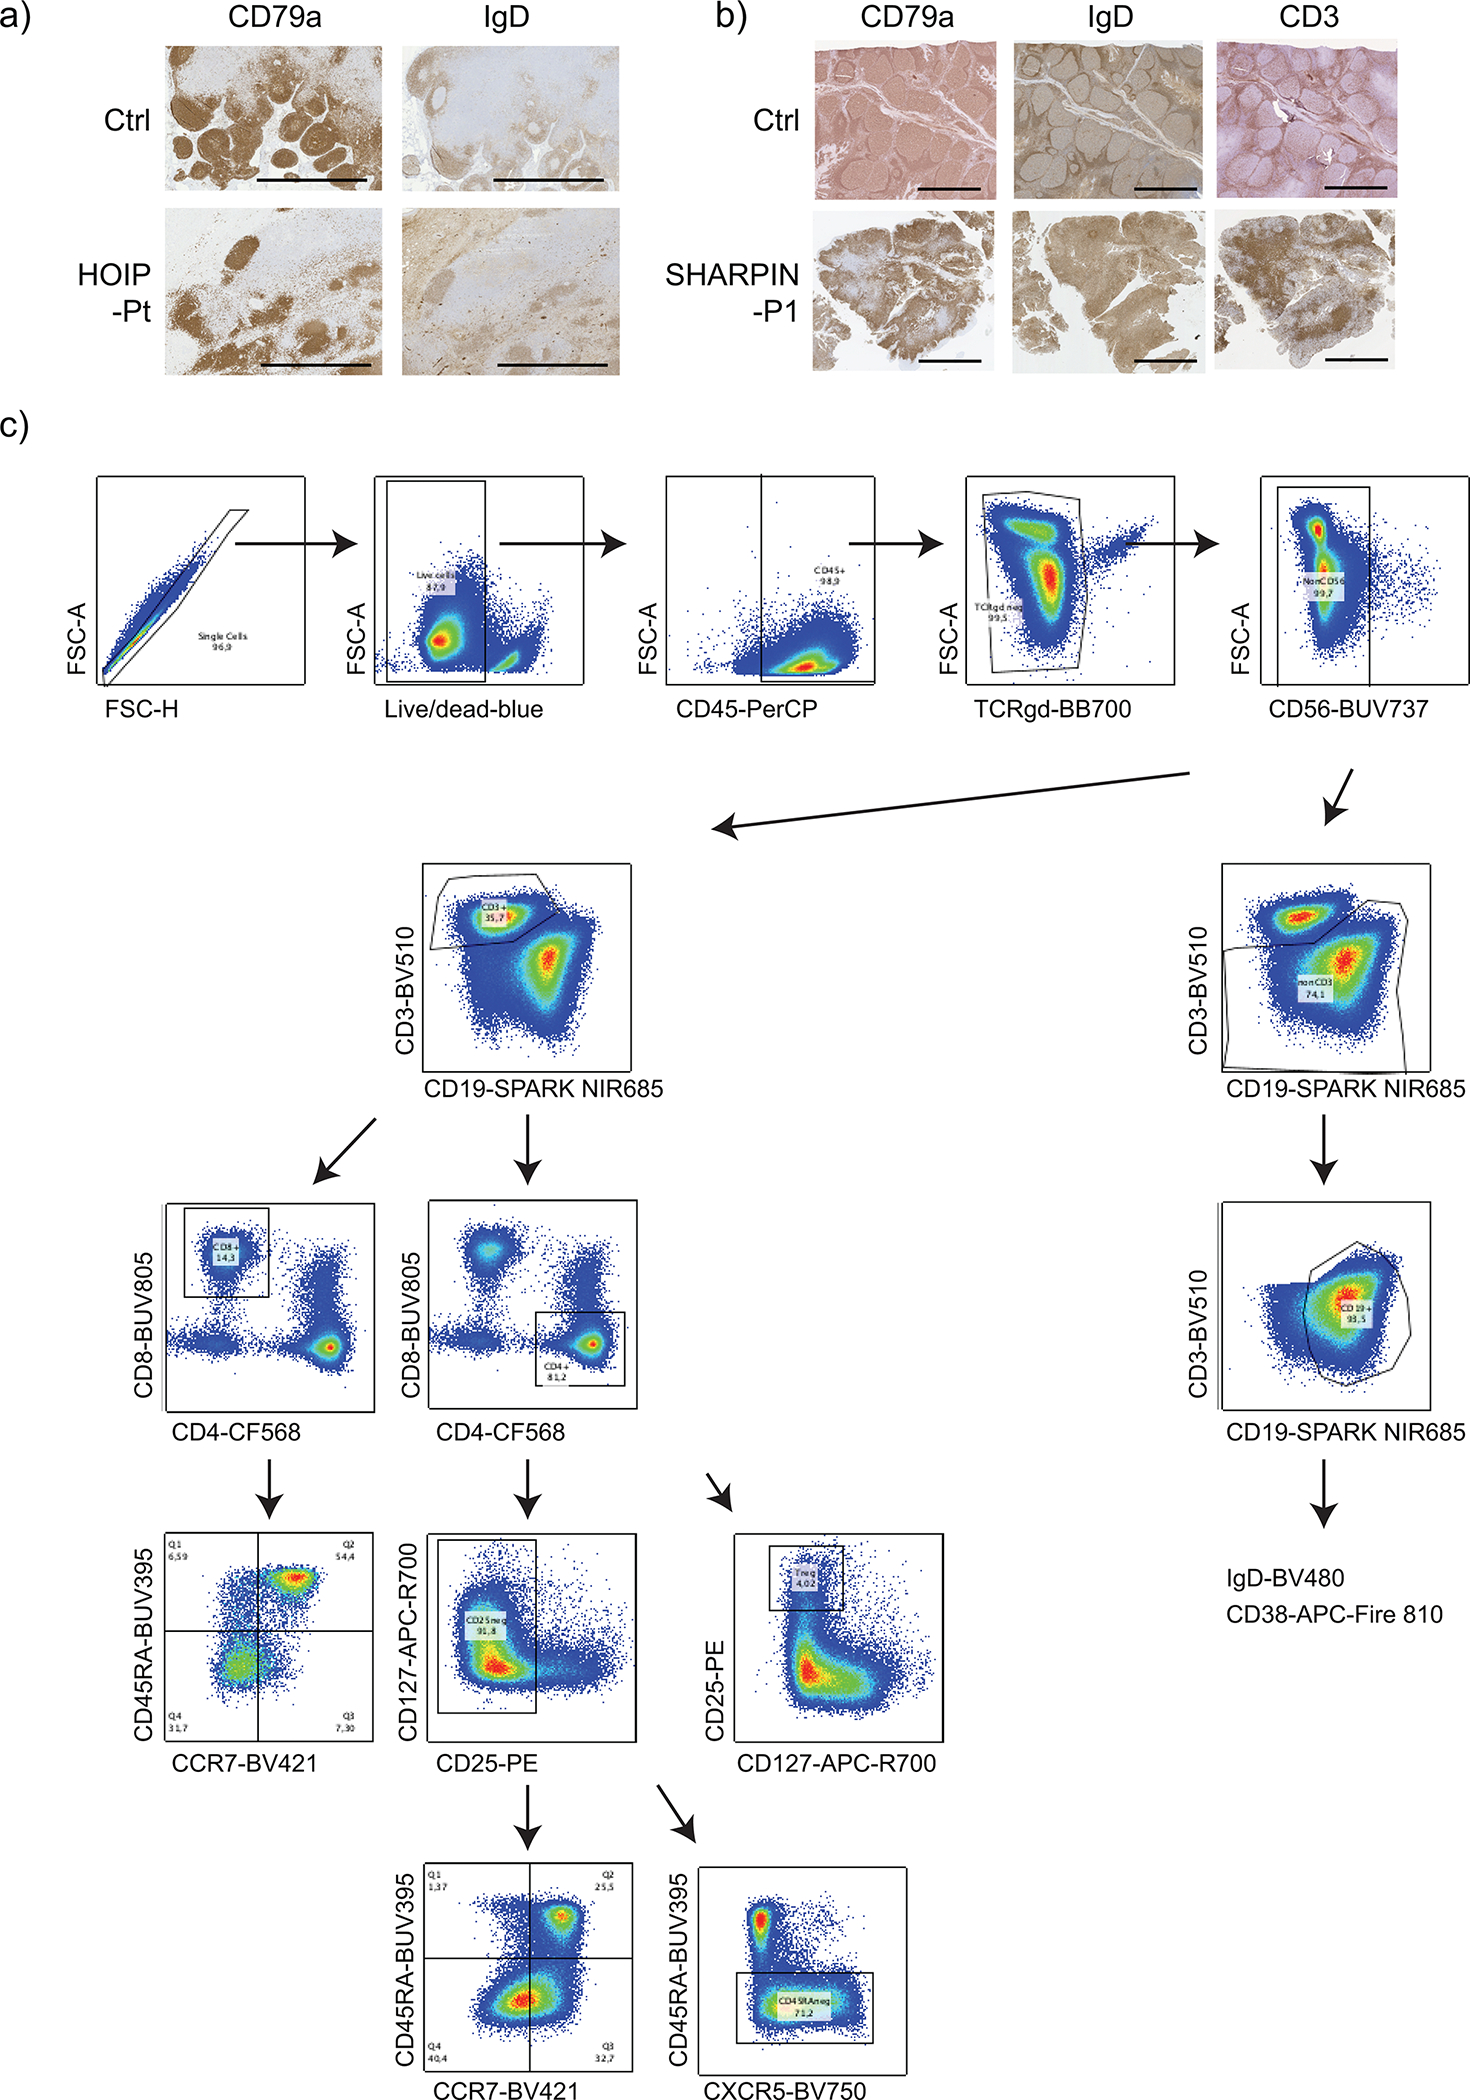
(a-b) Aberrant formation of lymphoid follicles and paracortex in secondary lymphoid organs from LUBAC deficient patients. (a) Lymph node histology of a HOIP-deficient patient compared with a control specimen from an unrelated donor. (b) Adenoid histology of SHARPIN-deficient P1 compared with a control specimen from an unrelated donor. The immunohistochemistry staining was not repeated due to the limited amount of clinical specimens. (c) Gating strategy for the adenoid spectral flow cytometry analysis. All cells were gated on singlet live CD45+ cells.
Extended Data Figure 7:
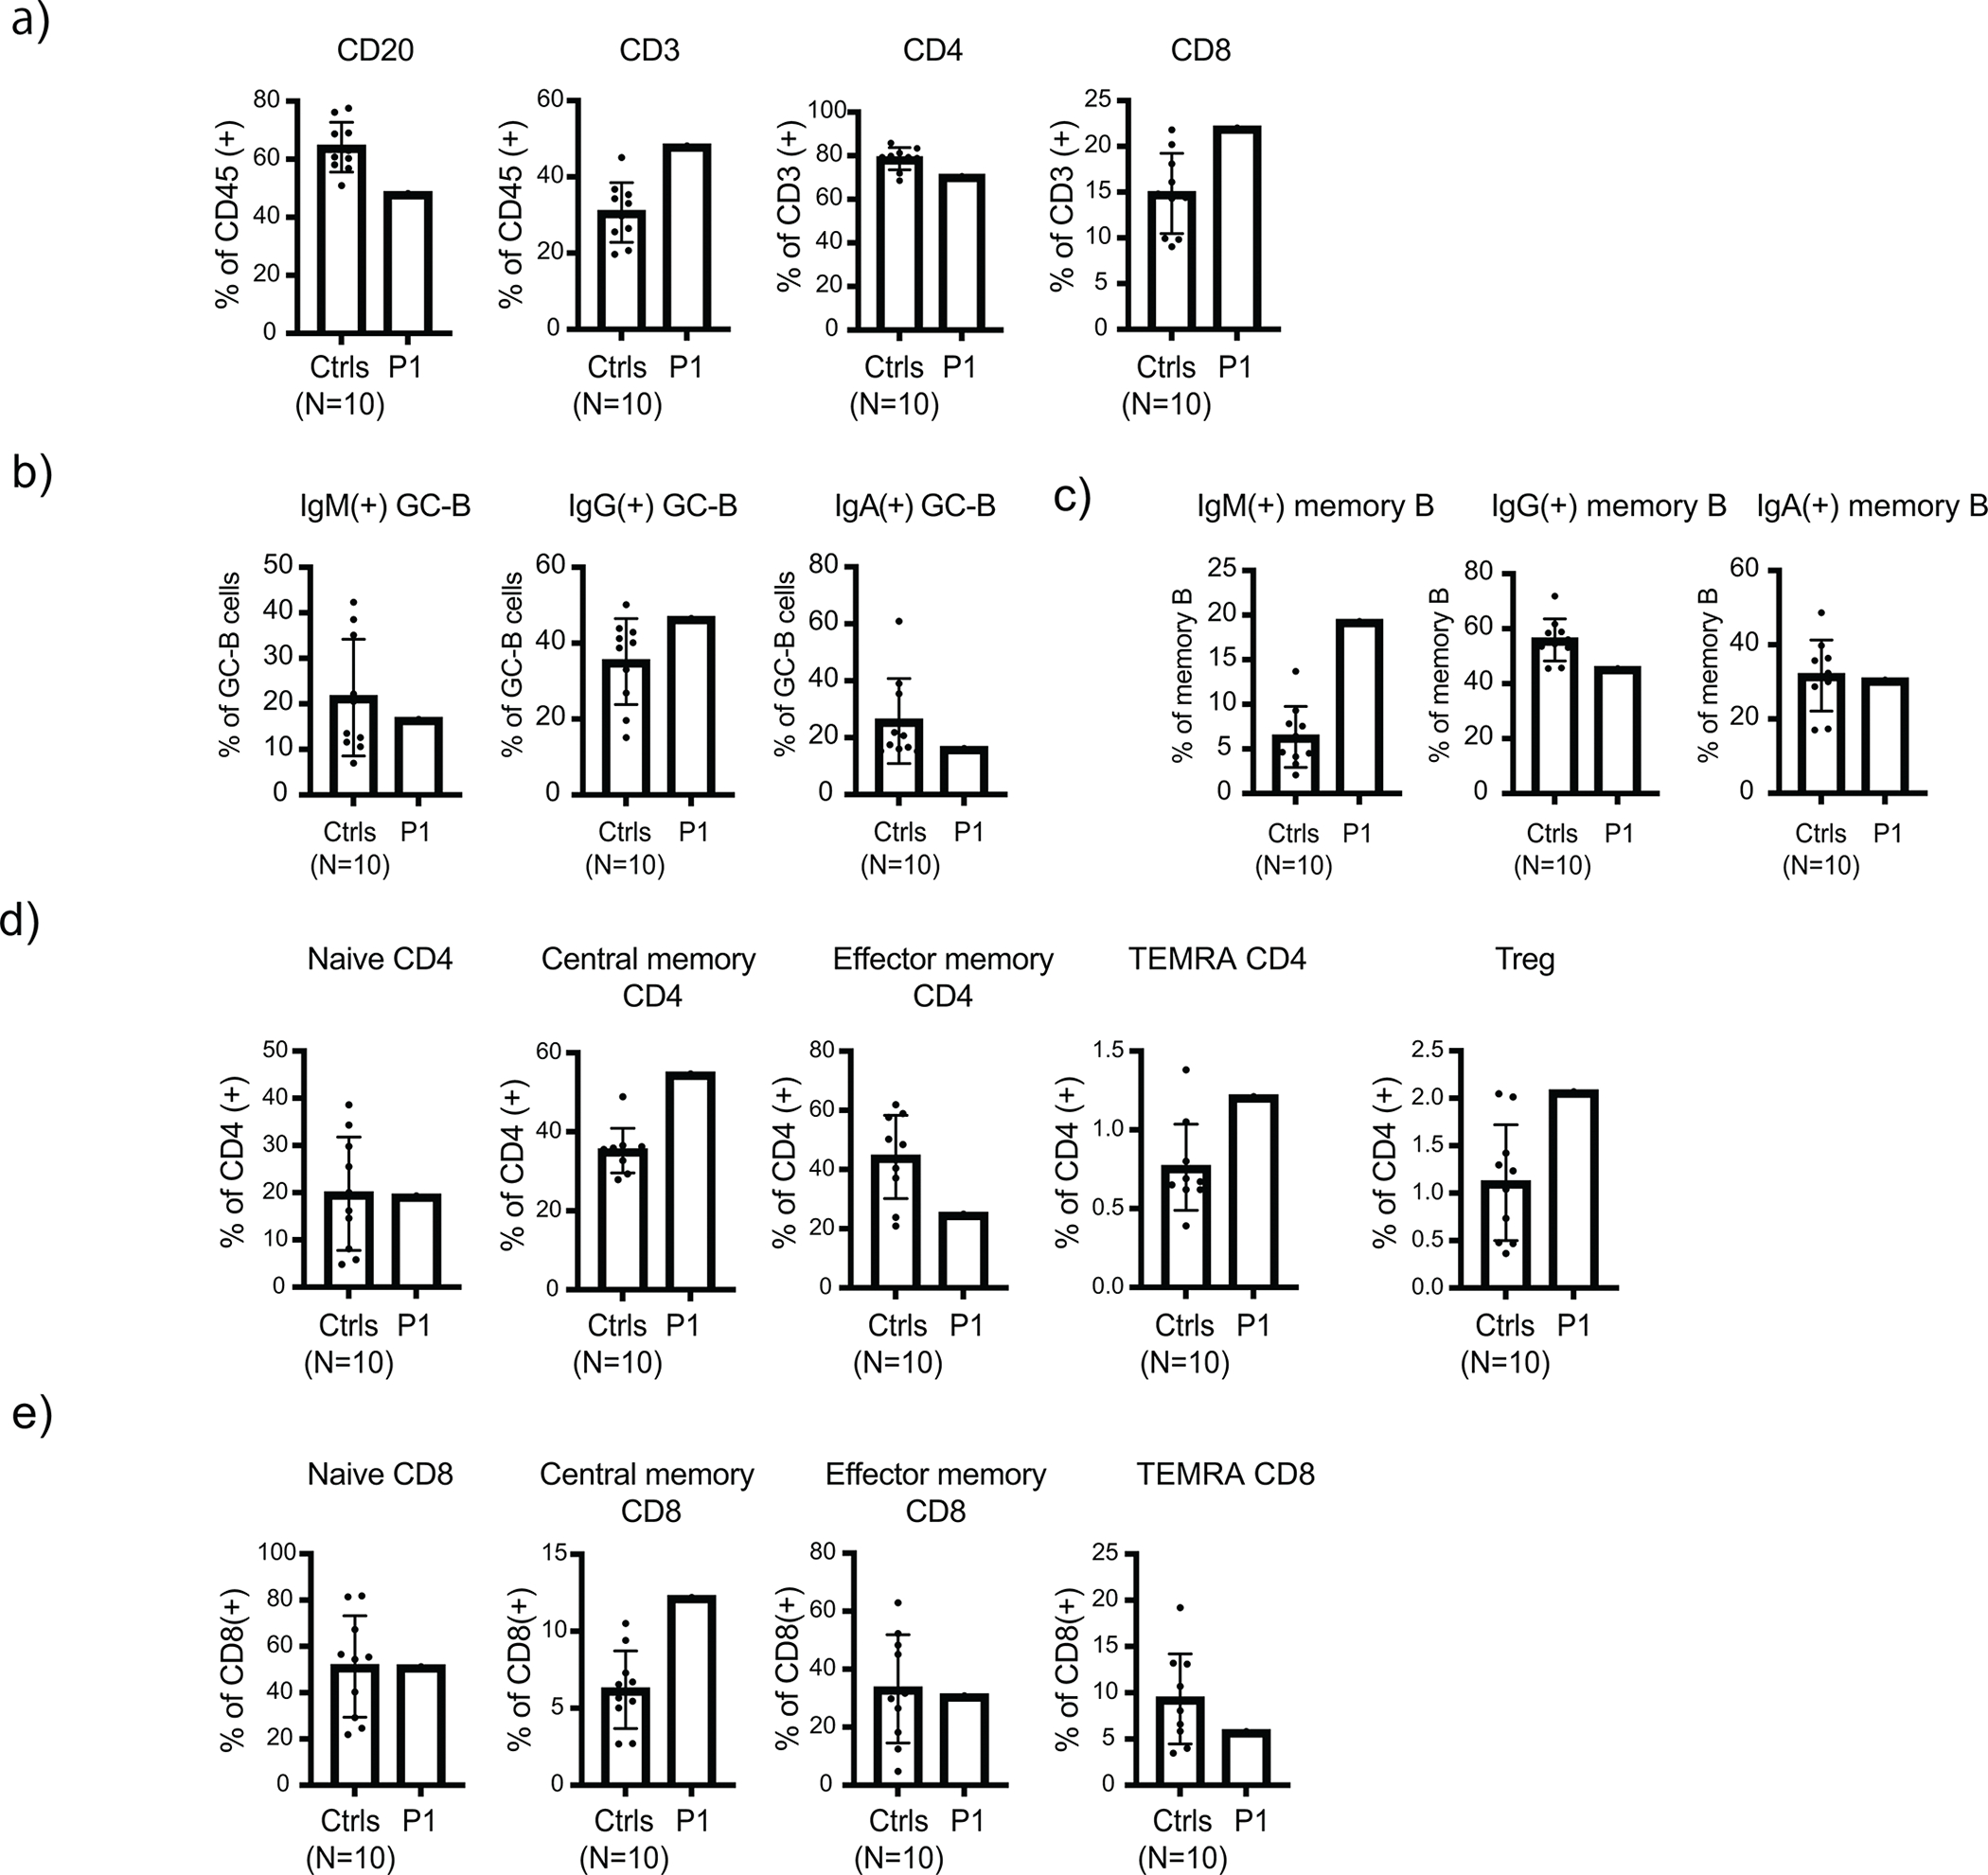
High dimensional spectral flow cytometry analysis of human adenoid samples. Adenoid single-cell suspensions from SHARPIN-deficient P1 and 10 unrelated pediatric control donors were analyzed. (a) Quantification of CD3+, CD4+, CD8+ and CD20+ populations in adenoid samples. (b-c) Surface immunoglobulin expression in GC-B (b) and memory B (c) populations. (d-e) Quantification of T cell subpopulations in the adenoid samples. Mean values ± s.d are displayed. The experiment was not repeated due to the limited amount of clinical specimens.
Extended Data Figure 8: Normal T cell phenotyping results in the SHARPIN-deficient patient ex vivo.
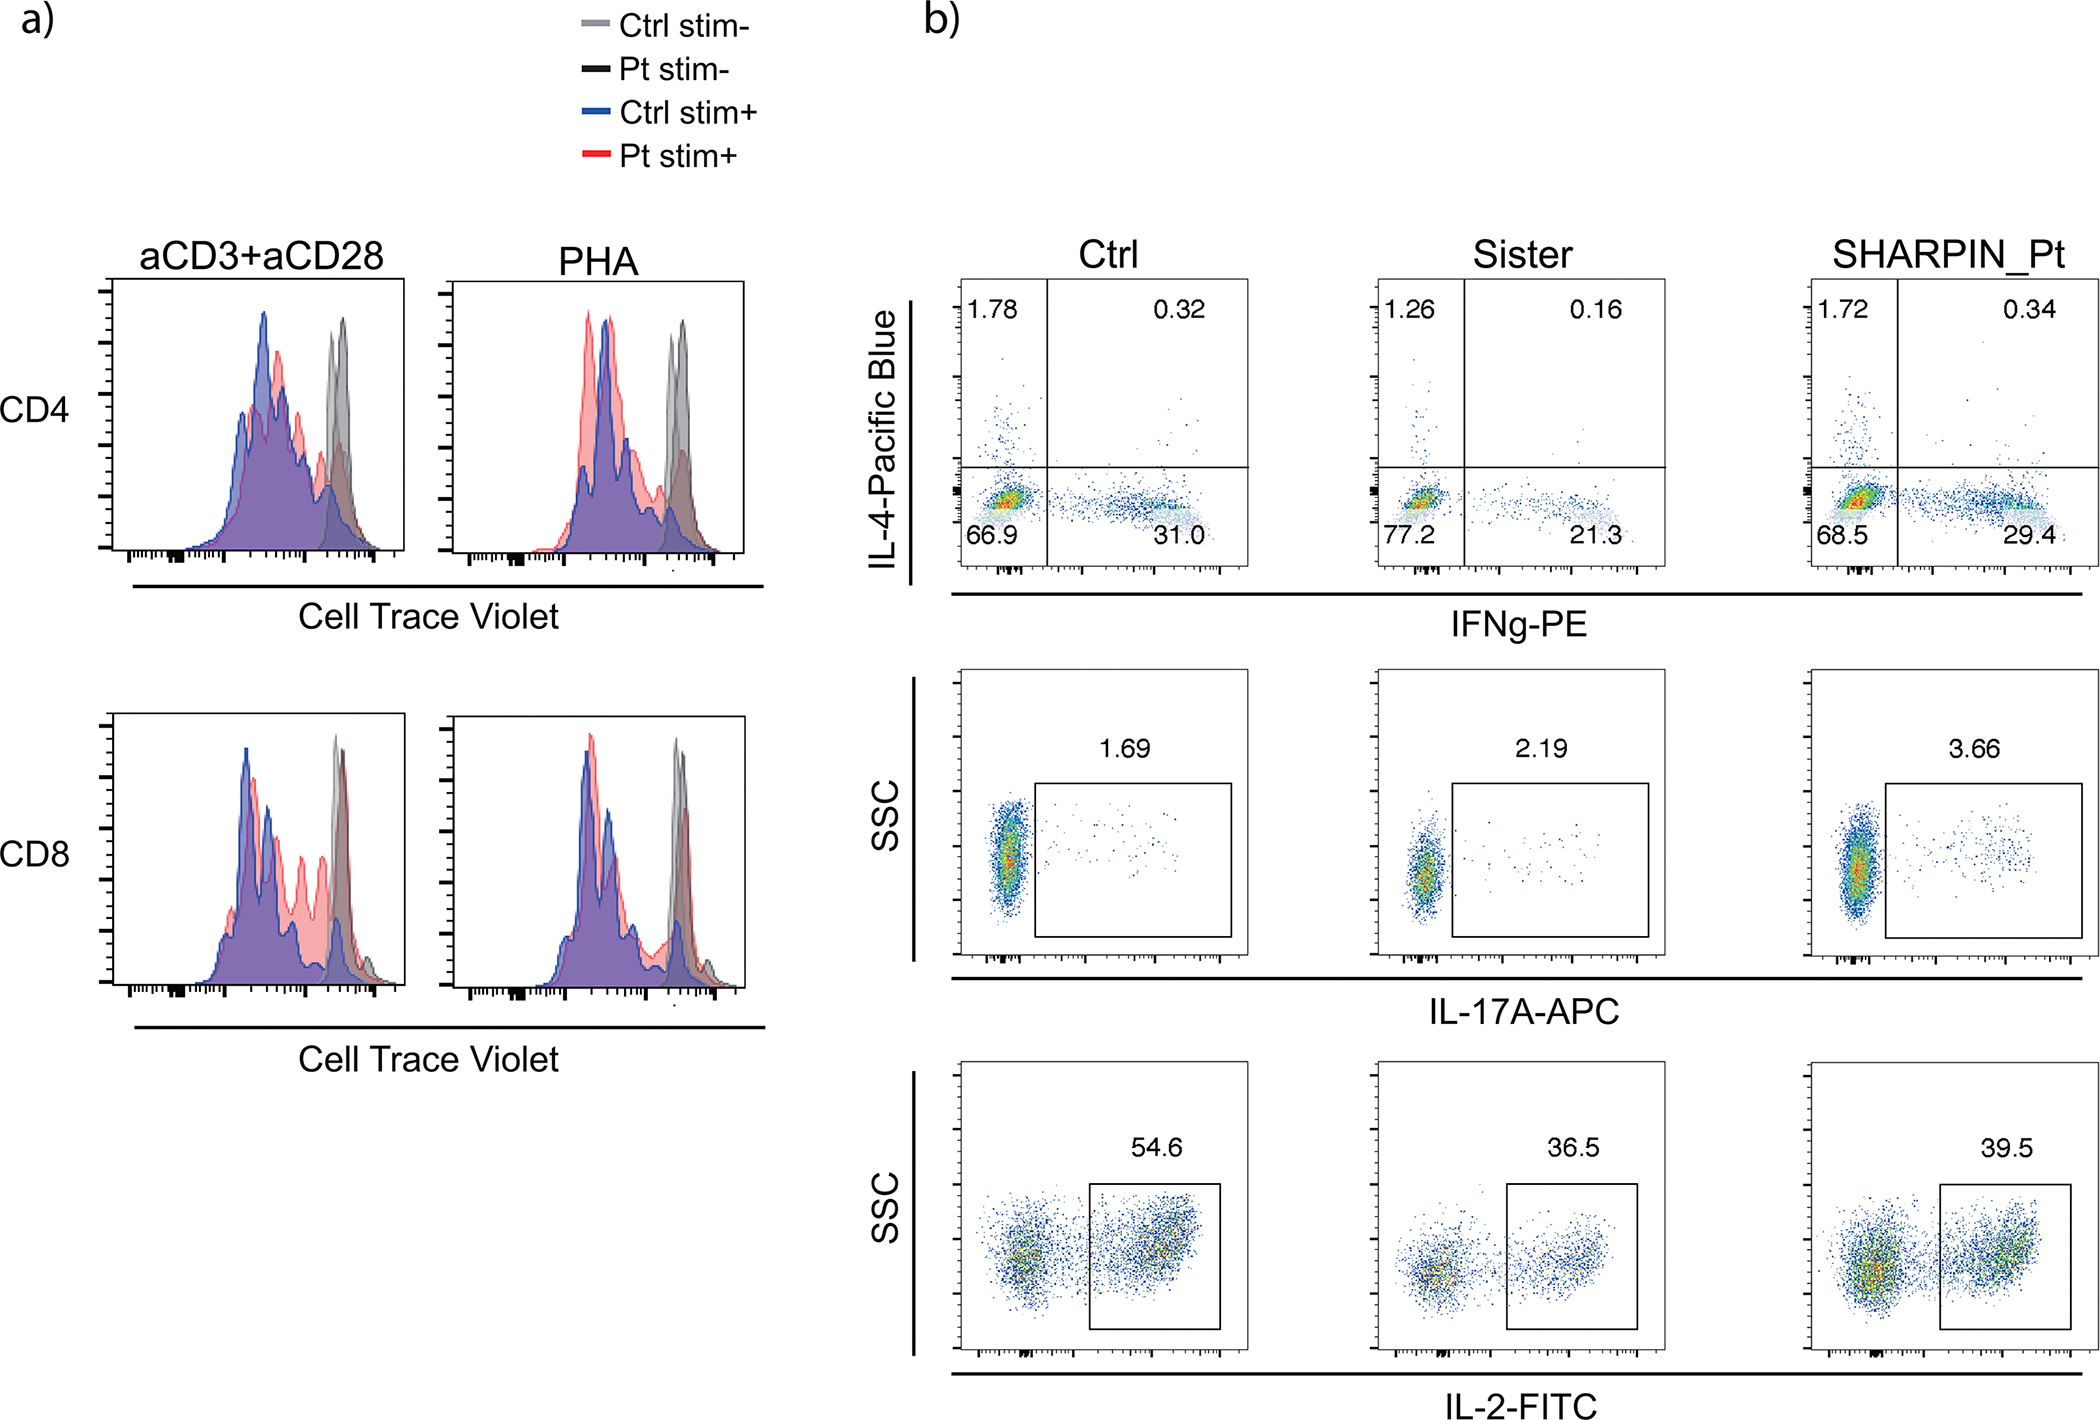
(a) T cell proliferation assay. PMBCs were incubated with Cell Trace Violet, stimulated with anti-CD3/28 or PHA for 72h and analyzed by flow cytometer. (b) Intracellular cytokine staining for Th1, Th2 and Th17 populations. PBMCs were stimulated with PMA (100 ng/ml) and ionomycin (1 μM) for 5h with Brefeldin A. Stimulated cells were surface stained, fixed and permeabilized with BD Cytofix/Cytoperm kit. Cells were further stained for intracellular cytokines and analyzed by flow cytometry. Ctrl: unrelated healthy control, Sister: sister carrying the heterozygous frameshift SHARPIN variant p.Leu74ProfsX86. Representative result of two independent experiments.
Extended Data Figure 9: Whole blood RNA sequencing.
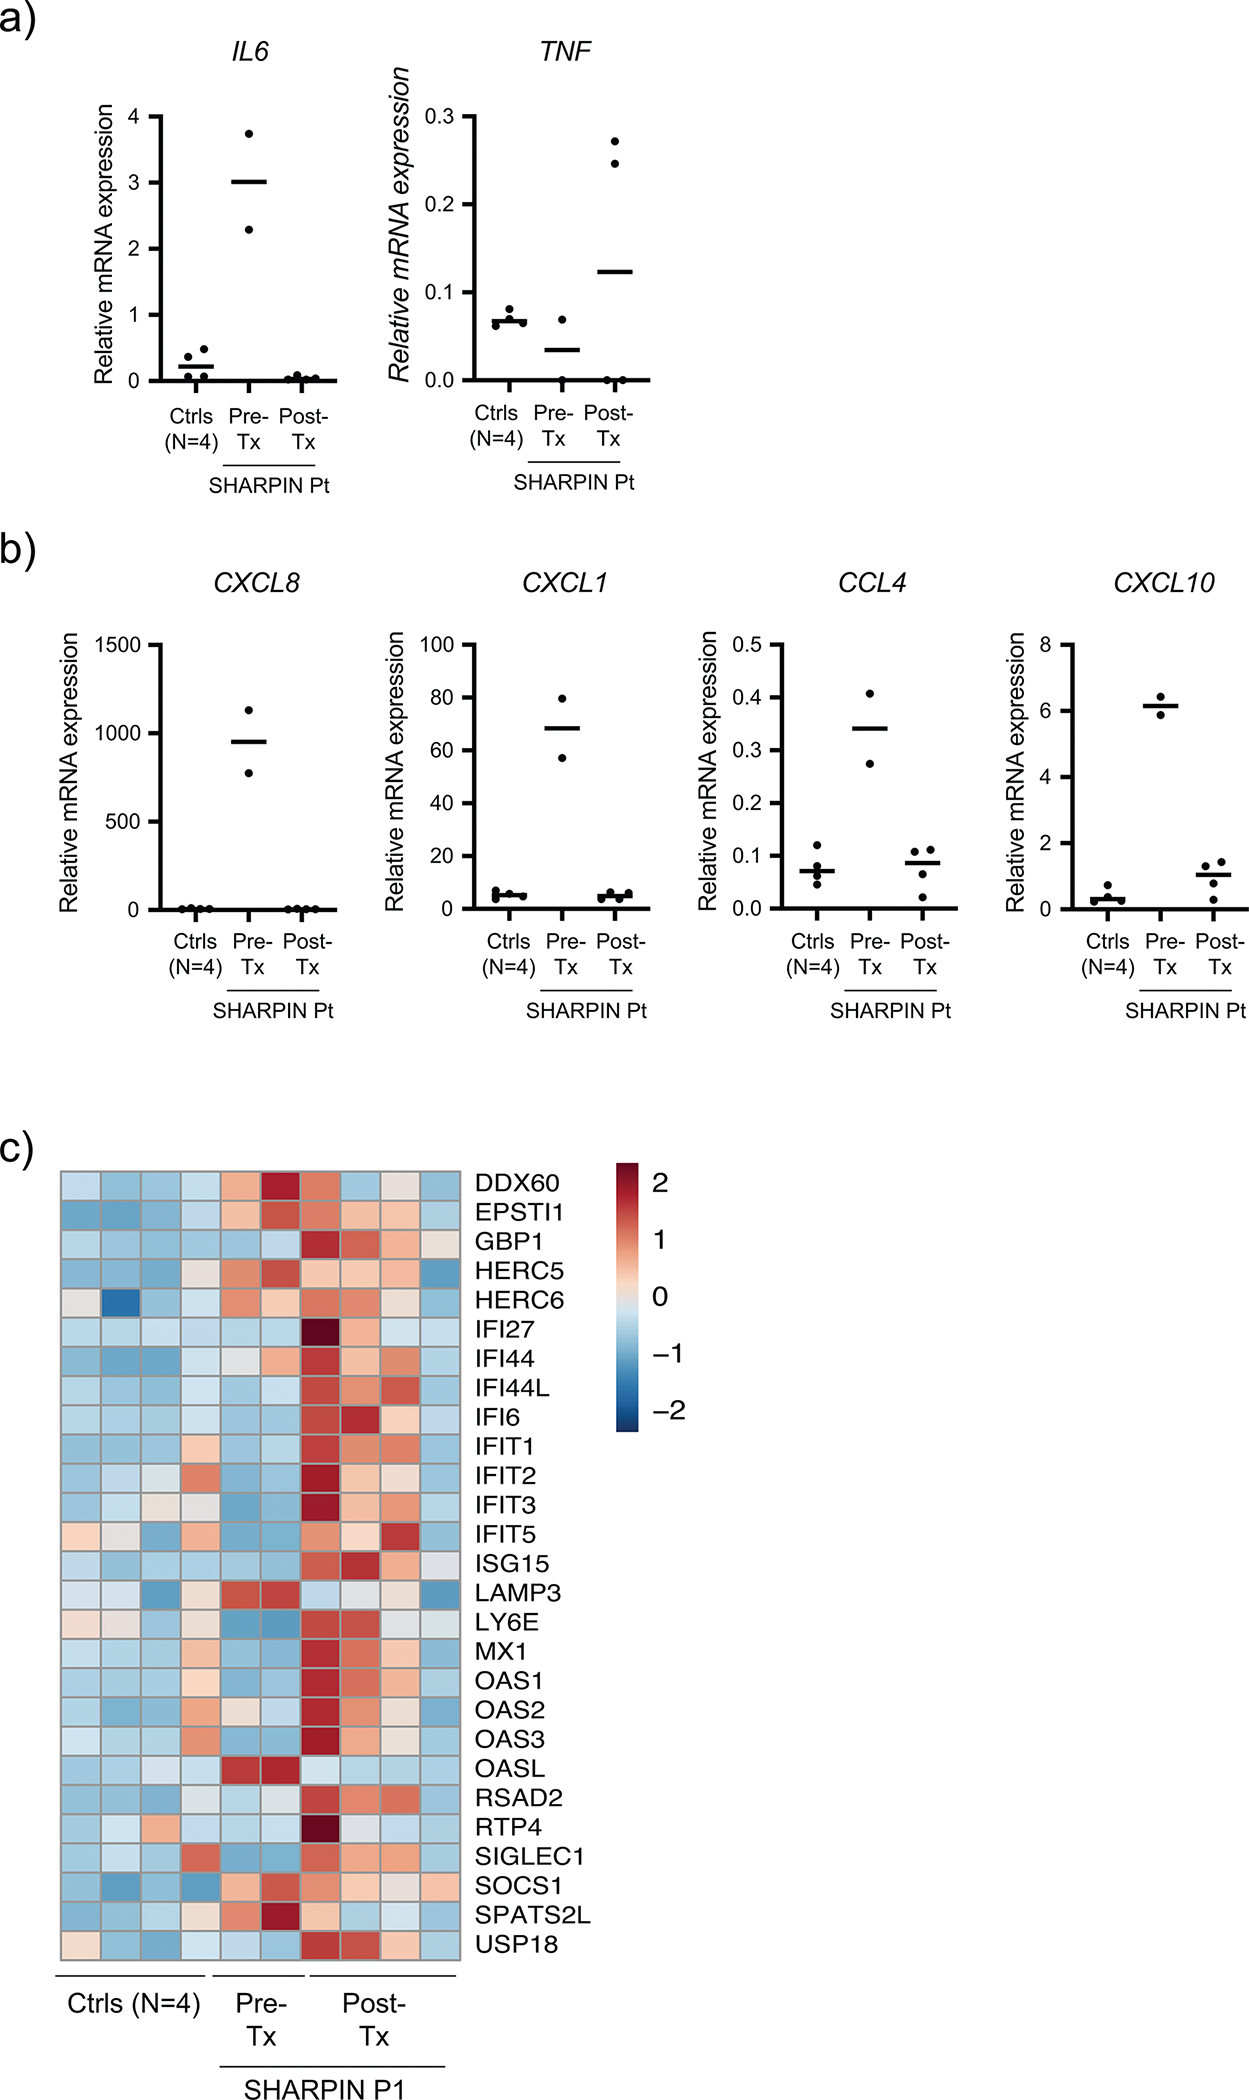
(a-b) mRNA expression of selected cytokines (a) and chemokines (b) in the pre- and post-anti-TNF treatment P1 whole blood RNA samples as well as four age-matched healthy controls. (c) A heatmap demonstrating the changes of genes representative for type I interferon-stimulated gene signature in pre- and post-treatment samples from the SHARPIN-deficient P1.
Supplementary Material
ACKNOWLEDGEMENT
The authors would like to thank the patients and the family members, and the healthy donors, for their enthusiastic support during this research study; Manolis Pasparakis, Hamid Kashkar and Alessandro Annibaldi (CECAD and CMMC, University of Cologne, Germany) for logistic support and valuable suggestions. We thank the WEHI Histology core facility for their support and assistance in this work. This study was in part supported by the Intramural Research Programs of the NHGRI, the NIAMS, the NIAID, the NCI, the NHLBI, the CC of the NIH and the Peter MacCallum Cancer Foundation. H.O. was supported by the Deutsche Forschungsgemeinschaft (DFG: German Research Foundation) including CRC1403 [414786233] and Germanýs Excellence Strategy (EXC 2030 [390661388]); by Fritz-Thyssen Stiftung [10.23.1.013MN]. K.E.L is supported by an Australian Research Council Future Fellowship [#FT190100266]. N.L. J.S. and H.A. are supported by National Health and Medical Research Council (NHMRC) Leadership Investigator Grants [2017929; 1195038; 1194144]. This work was made possible through Victorian State Government Operational Infrastructure Support and Australian Government NHMRC IRIISS [GNT9000719]. S.B is supported by France’s National Research Agency, the Investment for the Future Program [ANR-11-LABX-0070_TRANSPLANTEX] as well as by Strasbourg’s Interdisciplinary Thematic Institute for Precision Medicine, CNRS and INSERM, funded by IdEx Unistra [ANR-10-IDEX-0002] and SFRI-STRAT’US [ANR-20-SFRI-0012]. H.W. is supported by a Cancer Research UK [#A27323], a Wellcome Trust Investigator Award [#214342/Z/18/Z], a Medical Research Council [#MR/S00811X/1], the DFG (CRC1399 [413326622]; CRC1530 [455784452]; CRC1403 [414786233]), an Alexander von Humboldt Foundation Professorship Award, and CANTAR.
Footnotes
DISCLOSURE
S.P. is currently an employee of AstraZeneca and may own stock or stock options. All the other authors declare that they have no conflicts of interest.
DATA AVAILABILITY
Whole blood RNA sequencing data is available on Gene Expression Omnibus (GSE261031). Exome sequencing data will not be made publicly available because they contain information that could compromise research participant privacy/consent.
REFERENCES
- 1.Iwai K, Fujita H & Sasaki Y Linear ubiquitin chains: NF-kappaB signalling, cell death and beyond. Nat Rev Mol Cell Biol 15, 503–508 (2014). 10.1038/nrm3836 [DOI] [PubMed] [Google Scholar]
- 2.Fuseya Y et al. The HOIL-1L ligase modulates immune signalling and cell death via monoubiquitination of LUBAC. Nat Cell Biol 22, 663–673 (2020). 10.1038/s41556-020-0517-9 [DOI] [PubMed] [Google Scholar]
- 3.Kelsall IR, Zhang J, Knebel A, Arthur JSC & Cohen P The E3 ligase HOIL-1 catalyses ester bond formation between ubiquitin and components of the Myddosome in mammalian cells. Proc Natl Acad Sci U S A 116, 13293–13298 (2019). 10.1073/pnas.1905873116 [DOI] [PMC free article] [PubMed] [Google Scholar]
- 4.Boisson B et al. Human HOIP and LUBAC deficiency underlies autoinflammation, immunodeficiency, amylopectinosis, and lymphangiectasia. J Exp Med 212, 939–951 (2015). 10.1084/jem.20141130 [DOI] [PMC free article] [PubMed] [Google Scholar]
- 5.Boisson B et al. Immunodeficiency, autoinflammation and amylopectinosis in humans with inherited HOIL-1 and LUBAC deficiency. Nat Immunol 13, 1178–1186 (2012). 10.1038/ni.2457 [DOI] [PMC free article] [PubMed] [Google Scholar]
- 6.Oda H et al. Second Case of HOIP Deficiency Expands Clinical Features and Defines Inflammatory Transcriptome Regulated by LUBAC. Front Immunol 10, 479 (2019). 10.3389/fimmu.2019.00479 [DOI] [PMC free article] [PubMed] [Google Scholar]
- 7.Peltzer N et al. LUBAC is essential for embryogenesis by preventing cell death and enabling haematopoiesis. Nature 557, 112–117 (2018). 10.1038/s41586-018-0064-8 [DOI] [PMC free article] [PubMed] [Google Scholar]
- 8.Peltzer N et al. HOIP deficiency causes embryonic lethality by aberrant TNFR1-mediated endothelial cell death. Cell Rep 9, 153–165 (2014). 10.1016/j.celrep.2014.08.066 [DOI] [PubMed] [Google Scholar]
- 9.HogenEsch H et al. A spontaneous mutation characterized by chronic proliferative dermatitis in C57BL mice. Am J Pathol 143, 972–982 (1993). [PMC free article] [PubMed] [Google Scholar]
- 10.Gerlach B et al. Linear ubiquitination prevents inflammation and regulates immune signalling. Nature 471, 591–596 (2011). 10.1038/nature09816 [DOI] [PubMed] [Google Scholar]
- 11.Ikeda F et al. SHARPIN forms a linear ubiquitin ligase complex regulating NF-kappaB activity and apoptosis. Nature 471, 637–641 (2011). 10.1038/nature09814 [DOI] [PMC free article] [PubMed] [Google Scholar]
- 12.Kumari S et al. Sharpin prevents skin inflammation by inhibiting TNFR1-induced keratinocyte apoptosis. Elife 3 (2014). 10.7554/eLife.03422 [DOI] [PMC free article] [PubMed] [Google Scholar]
- 13.Rickard JA et al. TNFR1-dependent cell death drives inflammation in Sharpin-deficient mice. Elife 3 (2014). 10.7554/eLife.03464 [DOI] [PMC free article] [PubMed] [Google Scholar]
- 14.Tokunaga F et al. SHARPIN is a component of the NF-kappaB-activating linear ubiquitin chain assembly complex. Nature 471, 633–636 (2011). 10.1038/nature09815 [DOI] [PubMed] [Google Scholar]
- 15.Lafont E et al. TBK1 and IKKepsilon prevent TNF-induced cell death by RIPK1 phosphorylation. Nat Cell Biol 20, 1389–1399 (2018). 10.1038/s41556-018-0229-6 [DOI] [PMC free article] [PubMed] [Google Scholar]
- 16.Sasaki Y et al. Defective immune responses in mice lacking LUBAC-mediated linear ubiquitination in B cells. EMBO J 32, 2463–2476 (2013). 10.1038/emboj.2013.184 [DOI] [PMC free article] [PubMed] [Google Scholar]
- 17.Draber P et al. LUBAC-Recruited CYLD and A20 Regulate Gene Activation and Cell Death by Exerting Opposing Effects on Linear Ubiquitin in Signaling Complexes. Cell Rep 13, 2258–2272 (2015). 10.1016/j.celrep.2015.11.009 [DOI] [PMC free article] [PubMed] [Google Scholar]
- 18.Vince JE et al. IAP antagonists target cIAP1 to induce TNFalpha-dependent apoptosis. Cell 131, 682–693 (2007). 10.1016/j.cell.2007.10.037 [DOI] [PubMed] [Google Scholar]
- 19.de Almagro MC, Goncharov T, Newton K & Vucic D Cellular IAP proteins and LUBAC differentially regulate necrosome-associated RIP1 ubiquitination. Cell Death Dis 6, e1800 (2015). 10.1038/cddis.2015.158 [DOI] [PMC free article] [PubMed] [Google Scholar]
- 20.Laurien L et al. Autophosphorylation at serine 166 regulates RIP kinase 1-mediated cell death and inflammation. Nat Commun 11, 1747 (2020). 10.1038/s41467-020-15466-8 [DOI] [PMC free article] [PubMed] [Google Scholar]
- 21.Kay J & Calabrese L The role of interleukin-1 in the pathogenesis of rheumatoid arthritis. Rheumatology (Oxford) 43 Suppl 3, iii2–iii9 (2004). 10.1093/rheumatology/keh201 [DOI] [PubMed] [Google Scholar]
- 22.Wijbrandts CA et al. The clinical response to infliximab in rheumatoid arthritis is in part dependent on pretreatment tumour necrosis factor alpha expression in the synovium. Ann Rheum Dis 67, 1139–1144 (2008). 10.1136/ard.2007.080440 [DOI] [PMC free article] [PubMed] [Google Scholar]
- 23.Sundberg JP et al. Keratinocyte-specific deletion of SHARPIN induces atopic dermatitis-like inflammation in mice. PLoS One 15, e0235295 (2020). 10.1371/journal.pone.0235295 [DOI] [PMC free article] [PubMed] [Google Scholar]
- 24.Wang J et al. LUBAC Suppresses IL-21-Induced Apoptosis in CD40-Activated Murine B Cells and Promotes Germinal Center B Cell Survival and the T-Dependent Antibody Response. Front Immunol 12, 658048 (2021). 10.3389/fimmu.2021.658048 [DOI] [PMC free article] [PubMed] [Google Scholar]
- 25.Roco JA et al. Class-Switch Recombination Occurs Infrequently in Germinal Centers. Immunity 51, 337–350 e337 (2019). 10.1016/j.immuni.2019.07.001 [DOI] [PMC free article] [PubMed] [Google Scholar]
- 26.Elsner RA & Shlomchik MJ Germinal Center and Extrafollicular B Cell Responses in Vaccination, Immunity, and Autoimmunity. Immunity 53, 1136–1150 (2020). 10.1016/j.immuni.2020.11.006 [DOI] [PMC free article] [PubMed] [Google Scholar]
- 27.Teh CE et al. Linear ubiquitin chain assembly complex coordinates late thymic T-cell differentiation and regulatory T-cell homeostasis. Nat Commun 7, 13353 (2016). 10.1038/ncomms13353 [DOI] [PMC free article] [PubMed] [Google Scholar]
- 28.Park Y et al. SHARPIN controls regulatory T cells by negatively modulating the T cell antigen receptor complex. Nat Immunol 17, 286–296 (2016). 10.1038/ni.3352 [DOI] [PMC free article] [PubMed] [Google Scholar]
- 29.HogenEsch H et al. Increased expression of type 2 cytokines in chronic proliferative dermatitis (cpdm) mutant mice and resolution of inflammation following treatment with IL-12. Eur J Immunol 31, 734–742 (2001). [DOI] [PubMed] [Google Scholar]
- 30.van Zelm MC et al. Human CD19 and CD40L deficiencies impair antibody selection and differentially affect somatic hypermutation. J Allergy Clin Immunol 134, 135–144 (2014). 10.1016/j.jaci.2013.11.015 [DOI] [PubMed] [Google Scholar]
- 31.Meyers G et al. Activation-induced cytidine deaminase (AID) is required for B-cell tolerance in humans. Proc Natl Acad Sci U S A 108, 11554–11559 (2011). 10.1073/pnas.1102600108 [DOI] [PMC free article] [PubMed] [Google Scholar]
- 32.McGowan HW et al. Sharpin is a key regulator of skeletal homeostasis in a TNF-dependent manner. J Musculoskelet Neuronal Interact 14, 454–463 (2014). [PubMed] [Google Scholar]
- 33.Kim H et al. Development of a Validated Interferon Score Using NanoString Technology. J Interferon Cytokine Res 38, 171–185 (2018). 10.1089/jir.2017.0127 [DOI] [PMC free article] [PubMed] [Google Scholar]
- 34.Panayotova-Dimitrova D et al. cFLIP regulates skin homeostasis and protects against TNF-induced keratinocyte apoptosis. Cell Rep 5, 397–408 (2013). 10.1016/j.celrep.2013.09.035 [DOI] [PubMed] [Google Scholar]
- 35.Weinlich R et al. Protective roles for caspase-8 and cFLIP in adult homeostasis. Cell Rep 5, 340–348 (2013). 10.1016/j.celrep.2013.08.045 [DOI] [PMC free article] [PubMed] [Google Scholar]
- 36.Orning P et al. Pathogen blockade of TAK1 triggers caspase-8-dependent cleavage of gasdermin D and cell death. Science 362, 1064–1069 (2018). 10.1126/science.aau2818 [DOI] [PMC free article] [PubMed] [Google Scholar]
- 37.Sarhan J et al. Caspase-8 induces cleavage of gasdermin D to elicit pyroptosis during Yersinia infection. Proc Natl Acad Sci U S A 115, E10888–E10897 (2018). 10.1073/pnas.1809548115 [DOI] [PMC free article] [PubMed] [Google Scholar]
- 38.Gurung P, Lamkanfi M & Kanneganti TD Cutting edge: SHARPIN is required for optimal NLRP3 inflammasome activation. J Immunol 194, 2064–2067 (2015). 10.4049/jimmunol.1402951 [DOI] [PMC free article] [PubMed] [Google Scholar]
- 39.Douglas T, Champagne C, Morizot A, Lapointe JM & Saleh M The Inflammatory Caspases-1 and -11 Mediate the Pathogenesis of Dermatitis in Sharpin-Deficient Mice. J Immunol 195, 2365–2373 (2015). 10.4049/jimmunol.1500542 [DOI] [PubMed] [Google Scholar]
- 40.Gurung P, Sharma BR & Kanneganti TD Distinct role of IL-1beta in instigating disease in Sharpin(cpdm) mice. Sci Rep 6, 36634 (2016). 10.1038/srep36634 [DOI] [PMC free article] [PubMed] [Google Scholar]
- 41.Anderton H et al. Langerhans cells are an essential cellular intermediary in chronic dermatitis. Cell Rep 39, 110922 (2022). 10.1016/j.celrep.2022.110922 [DOI] [PubMed] [Google Scholar]
- 42.Anderton H, Wicks IP & Silke J Cell death in chronic inflammation: breaking the cycle to treat rheumatic disease. Nat Rev Rheumatol 16, 496–513 (2020). 10.1038/s41584-020-0455-8 [DOI] [PubMed] [Google Scholar]
- 43.van Loo G & Bertrand MJM Death by TNF: a road to inflammation. Nat Rev Immunol 23, 289–303 (2023). 10.1038/s41577-022-00792-3 [DOI] [PMC free article] [PubMed] [Google Scholar]
- 44.Pasparakis M & Vandenabeele P Necroptosis and its role in inflammation. Nature 517, 311–320 (2015). 10.1038/nature14191 [DOI] [PubMed] [Google Scholar]
- 45.Mifflin L, Ofengeim D & Yuan J Receptor-interacting protein kinase 1 (RIPK1) as a therapeutic target. Nat Rev Drug Discov 19, 553–571 (2020). 10.1038/s41573-020-0071-y [DOI] [PMC free article] [PubMed] [Google Scholar]
- 46.Weisel K et al. A randomized, placebo-controlled experimental medicine study of RIPK1 inhibitor GSK2982772 in patients with moderate to severe rheumatoid arthritis. Arthritis Res Ther 23, 85 (2021). 10.1186/s13075-021-02468-0 [DOI] [PMC free article] [PubMed] [Google Scholar]
- 47.Weisel K et al. A randomised, placebo-controlled study of RIPK1 inhibitor GSK2982772 in patients with active ulcerative colitis. BMJ Open Gastroenterol 8 (2021). 10.1136/bmjgast-2021-000680 [DOI] [PMC free article] [PubMed] [Google Scholar]
- 48.Lalaoui N et al. Mutations that prevent caspase cleavage of RIPK1 cause autoinflammatory disease. Nature 577, 103–108 (2020). 10.1038/s41586-019-1828-5 [DOI] [PMC free article] [PubMed] [Google Scholar]
- 49.Tao P et al. A dominant autoinflammatory disease caused by non-cleavable variants of RIPK1. Nature 577, 109–114 (2020). 10.1038/s41586-019-1830-y [DOI] [PubMed] [Google Scholar]
- 50.Cuchet-Lourenco D et al. Biallelic RIPK1 mutations in humans cause severe immunodeficiency, arthritis, and intestinal inflammation. Science 361, 810–813 (2018). 10.1126/science.aar2641 [DOI] [PMC free article] [PubMed] [Google Scholar]
- 51.Li Y et al. Human RIPK1 deficiency causes combined immunodeficiency and inflammatory bowel diseases. Proc Natl Acad Sci U S A 116, 970–975 (2019). 10.1073/pnas.1813582116 [DOI] [PMC free article] [PubMed] [Google Scholar]
- 52.Taft J et al. Human TBK1 deficiency leads to autoinflammation driven by TNF-induced cell death. Cell 184, 4447–4463 e4420 (2021). 10.1016/j.cell.2021.07.026 [DOI] [PMC free article] [PubMed] [Google Scholar]
- 53.Badran YR et al. Human RELA haploinsufficiency results in autosomal-dominant chronic mucocutaneous ulceration. J Exp Med 214, 1937–1947 (2017). 10.1084/jem.20160724 [DOI] [PMC free article] [PubMed] [Google Scholar]
- 54.Damgaard RB et al. OTULIN deficiency in ORAS causes cell type-specific LUBAC degradation, dysregulated TNF signalling and cell death. EMBO Mol Med 11 (2019). 10.15252/emmm.201809324 [DOI] [PMC free article] [PubMed] [Google Scholar]
- 55.Zinngrebe J et al. --LUBAC deficiency perturbs TLR3 signaling to cause immunodeficiency and autoinflammation. J Exp Med 213, 2671–2689 (2016). 10.1084/jem.20160041 [DOI] [PMC free article] [PubMed] [Google Scholar]
- 56.Kelsall IR et al. HOIL-1 ubiquitin ligase activity targets unbranched glucosaccharides and is required to prevent polyglucosan accumulation. EMBO J 41, e109700 (2022). 10.15252/embj.2021109700 [DOI] [PMC free article] [PubMed] [Google Scholar]
- 57.Otten EG et al. Ubiquitylation of lipopolysaccharide by RNF213 during bacterial infection. Nature 594, 111–116 (2021). 10.1038/s41586-021-03566-4 [DOI] [PMC free article] [PubMed] [Google Scholar]
METHOD-ONLY REFERENCES
- 58.Matsumoto ML et al. Engineering and structural characterization of a linear polyubiquitin-specific antibody. J Mol Biol 418, 134–144 (2012). 10.1016/j.jmb.2011.12.053 [DOI] [PubMed] [Google Scholar]
- 59.Zinngrebe J et al. Compound heterozygous variants in OTULIN are associated with fulminant atypical late-onset ORAS. EMBO Mol Med 14, e14901 (2022). 10.15252/emmm.202114901 [DOI] [PMC free article] [PubMed] [Google Scholar]
- 60.Samson AL et al. A toolbox for imaging RIPK1, RIPK3, and MLKL in mouse and human cells. Cell Death Differ 28, 2126–2144 (2021). 10.1038/s41418-021-00742-x [DOI] [PMC free article] [PubMed] [Google Scholar]
- 61.Wang K et al. Structural Mechanism for GSDMD Targeting by Autoprocessed Caspases in Pyroptosis. Cell 180, 941–955 e920 (2020). 10.1016/j.cell.2020.02.002 [DOI] [PubMed] [Google Scholar]
Associated Data
This section collects any data citations, data availability statements, or supplementary materials included in this article.
Supplementary Materials
Data Availability Statement
Whole blood RNA sequencing data is available on Gene Expression Omnibus (GSE261031). Exome sequencing data will not be made publicly available because they contain information that could compromise research participant privacy/consent.


