Abstract
CRISPR knockout (KO) screens have identified host factors regulating SARS-CoV-2 replication. Here, we conducted a meta-analysis of these screens, which showed a high level of cell-type specificity of the identified hits, highlighting the necessity of additional models to uncover the full landscape of host factors. Thus, we performed genome-wide KO and activation screens in Calu-3 lung cells, and KO screens in Caco-2 colorectal cells, followed by secondary screens in four human cell lines. This revealed new host-dependency factors, including AP1G1 adaptin and ATP8B1 flippase, as well as inhibitors, including Mucins. Interestingly, some of the identified genes also modulate MERS-CoV and seasonal HCoV-NL63 and -229E replication. Moreover, most genes had an impact on viral entry, with AP1G1 likely regulating TMPRSS2 activity at the plasma membrane. These results demonstrate the value of multiple cell models and perturbational modalities for understanding SARS-CoV-2 replication, and provide a list of potential targets for therapeutic interventions.
Introduction
Severe acute respiratory syndrome coronavirus 2 (SARS-CoV-2) is the etiologic agent of the coronavirus disease 2019 (COVID-19) pandemic. SARS-CoV-2 is the third highly pathogenic coronavirus to cross the species barrier in the 21st century after SARS-CoV-1 in 2002–20031–3 and Middle East respiratory syndrome (MERS)-CoV in 20124. Four additional Human Coronaviruses (HCoV-229E, -NL63, -OC43 and -HKU1) are known to circulate seasonally in humans, contributing to approximately one-third of common cold infections5. Like SARS-CoV-1 and HCoV-NL63, SARS-CoV-2 entry into target cells is mediated by the Angiotensin converting enzyme 2 (ACE2) receptor6–10. The cellular serine protease Transmembrane protease serine 2 (TMPRSS2) is employed by both SARS-CoV-1 and -2 for Spike (S) protein priming at the plasma membrane6,11. Cathepsins are also involved in SARS-CoV S protein cleavage and fusion peptide exposure upon entry via an endocytic route, in the absence of TMPRSS212–15.
Several whole-genome KO CRISPR screens for the identification of coronavirus regulators have been reported16–21. These screens used naturally permissive simian Vero E6 cells of kidney origin20; human Huh7 cells (or derivatives) of liver origin (ectopically expressing ACE2 and TMPRSS2, or not)16,18,19; and A549 cells of lung origin, ectopically expressing ACE217,21. Here, we conducted genome-wide, loss-of-function CRISPR KO screens and gain-of-function CRISPRa screens in several cell lines, including physiologically relevant human Calu-3 cells and Caco-2 cells, of lung and colorectal adenocarcinoma origin, respectively, followed by secondary screens in these cell lines and in Huh7.5.1 and A549 cells. Well-known SARS-CoV-2 host dependency factors were identified among top hits, such as ACE2 and either TMPRSS2 or Cathepsin L (depending on the cell type). We characterized the mechanism of action of the top hits and assessed their effect on other coronaviruses and influenza A orthomyxovirus. Altogether, this study provides new insights into the coronavirus life cycle by identifying host factors that modulate replication, and might lead to pan-coronavirus strategies for host-directed therapies.
Results
Meta-analysis of CRISPR KO screens highlights the importance of multiple models
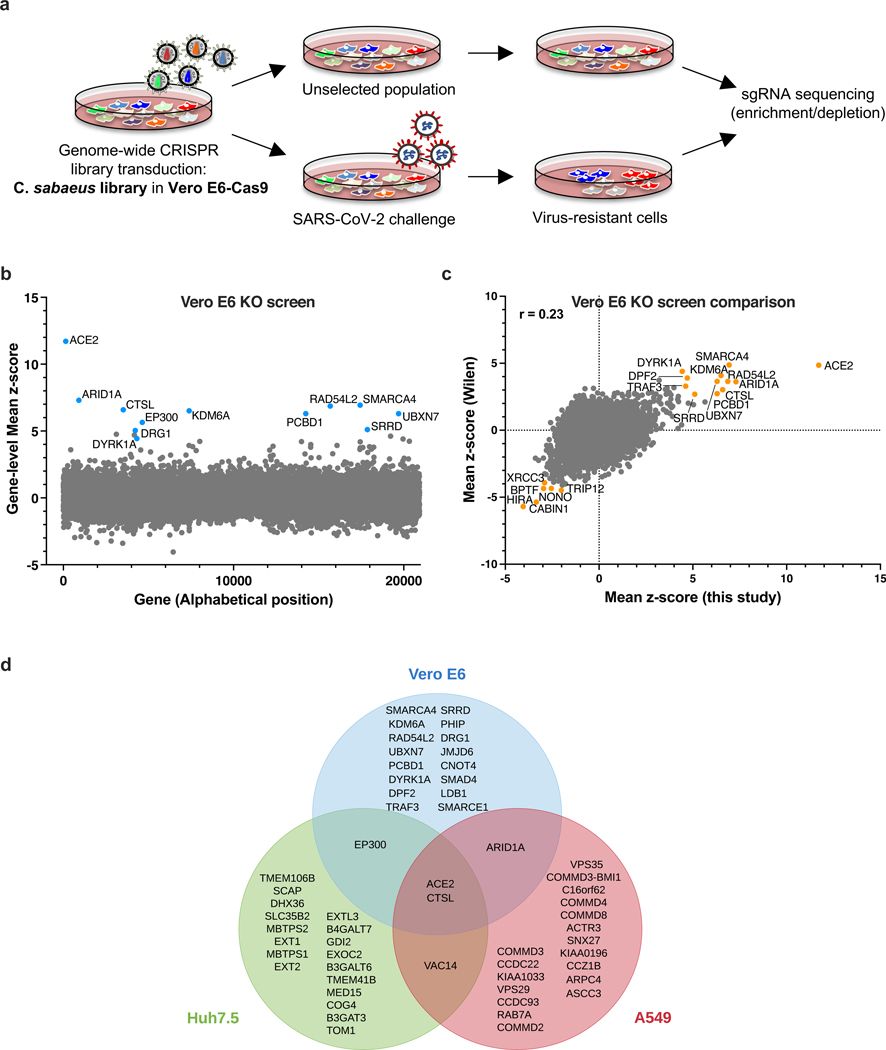
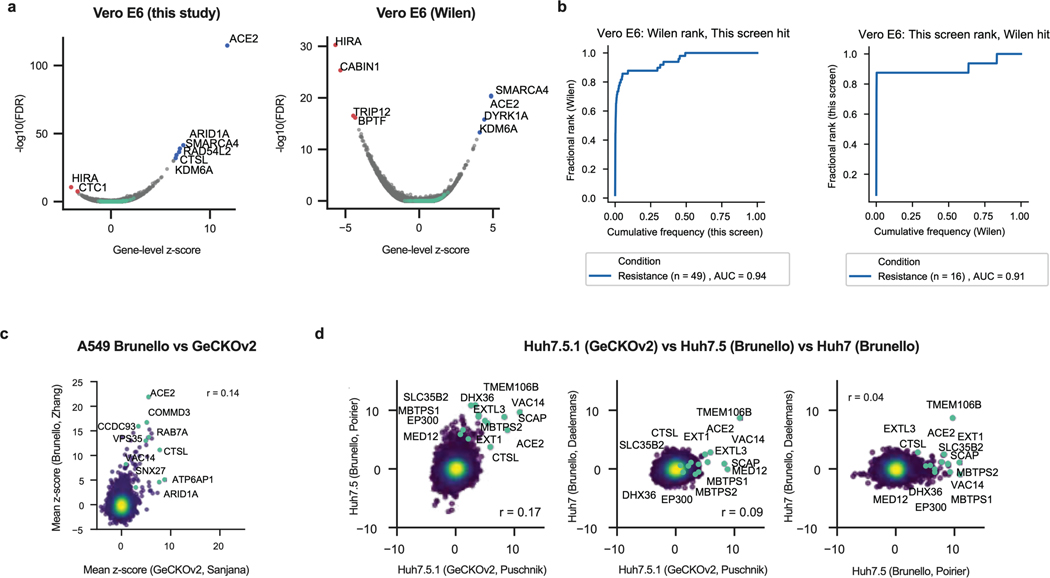
Vero E6 cells present high levels of cytopathic effects (CPE) upon SARS-CoV-2 replication, making them ideal to perform whole-genome CRISPR screens for host factor identification. A C. sabaeus sgRNA library was previously successfully used to identify host factors regulating SARS-CoV-2 (isolate USA-WA1/2020) replication20. Therefore, we initially repeated whole-genome CRISPR KO screens in Vero E6 cells using the SARS-CoV-2 isolate BetaCoV/France/IDF0372/2020 (Fig. 1a). Importantly, ACE2 was a top hit (Fig. 1b; Supplementary Data 1). Compared to prior results from the Wilen lab20, this screen showed greater statistical significance for proviral (resistance) hits, suggesting that our screening conditions resulted in stronger selective pressure (Fig. 1c; Extended Data Fig. 1a-b). Nevertheless, proviral hits were consistent across the two screens, with 11 genes scoring in the top 20 of both datasets, including ACE2 and CTSL; similarly, 6 of the top 20 antiviral (sensitization) hits were in common, including HIRA and CABIN1, both members of an H3.3 specific chaperone complex.
Fig. 1. Cell-type specificity of SARS-CoV-2 regulators identified by CRISPR screens.
a. Schematic of pooled screen pipeline to identify SARS-CoV-2 regulators in Vero E6 cells. b. Scatter plot showing the gene-level mean z-scores of genes when knocked out in Vero E6 cells. The top genes conferring resistance to SARS-CoV-2 are annotated and shown in blue. (n = 20,928). c. Comparison between this Vero E6 screen to the Vero E6 screen conducted by the Wilen lab20. Genes that scored among the top 20 resistance hits and sensitization hits in both screens are labeled. Pearson’s correlation coefficient r is indicated. (n = 20,928). d. Venn diagram comparing hits across screens conducted in Vero E6, A549 and Huh7.5 (or Huh7.5.1) cells (ectopically expressing ACE2 and TMPRSS2 or not)16–21. The top 20 genes from each cell line are included, with genes considered a hit in another cell line if the average z-score was > 3.
Additional genome-wide screens for SARS-CoV-2 host factors have varied in the viral isolate, CRISPR library and cell type (Supplementary Table 1)16–21. We re-processed the data via the same analysis pipeline to enable fair comparisons (see Methods; Supplementary Data 2); top-scoring genes were consistent with the analyses provided in the original publications. We next averaged gene-level z-scores and compared results across the Vero E6, A549, and Huh7.5 cell lines (Supplementary Note 1; Fig. 1d). Overall, these analyses suggest that there is a strong cell-type specificity in the identified hits and that individual cell models are particularly suited, in as yet unpredictable ways, to probe different aspects of SARS-CoV-2 host factor biology.
Bidirectional screens identify new genes regulating SARS-CoV-2 replication
Calu-3 cells are a particularly attractive model for exploring SARS-CoV-2 biology, as they naturally express ACE2 and TMPRSS2 and we have previously shown that they behave highly similarly to primary human airway epithelia (HAE) when challenged with SARS-CoV-222. Additionally, they are suited to viability-based screens, as they show high levels of CPE upon SARS-CoV-2 replication, although their slow doubling time (~5–6 days) presents challenges for scale-up. The compact Gattinara library23, known to perform as well as the larger Brunello library20, was selected for the KO screen, while the Calabrese library24 was used for the CRISPRa screen.
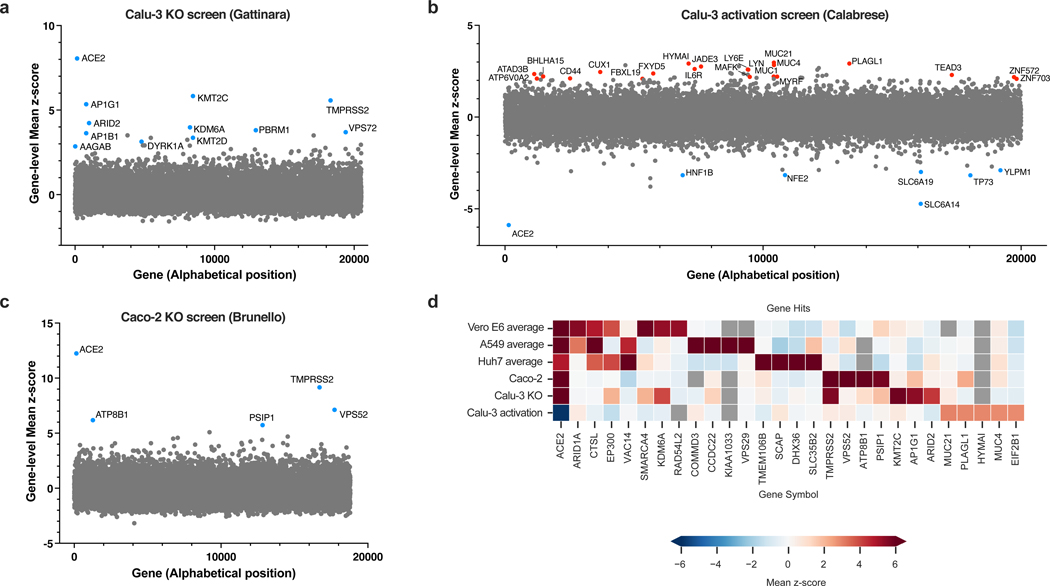
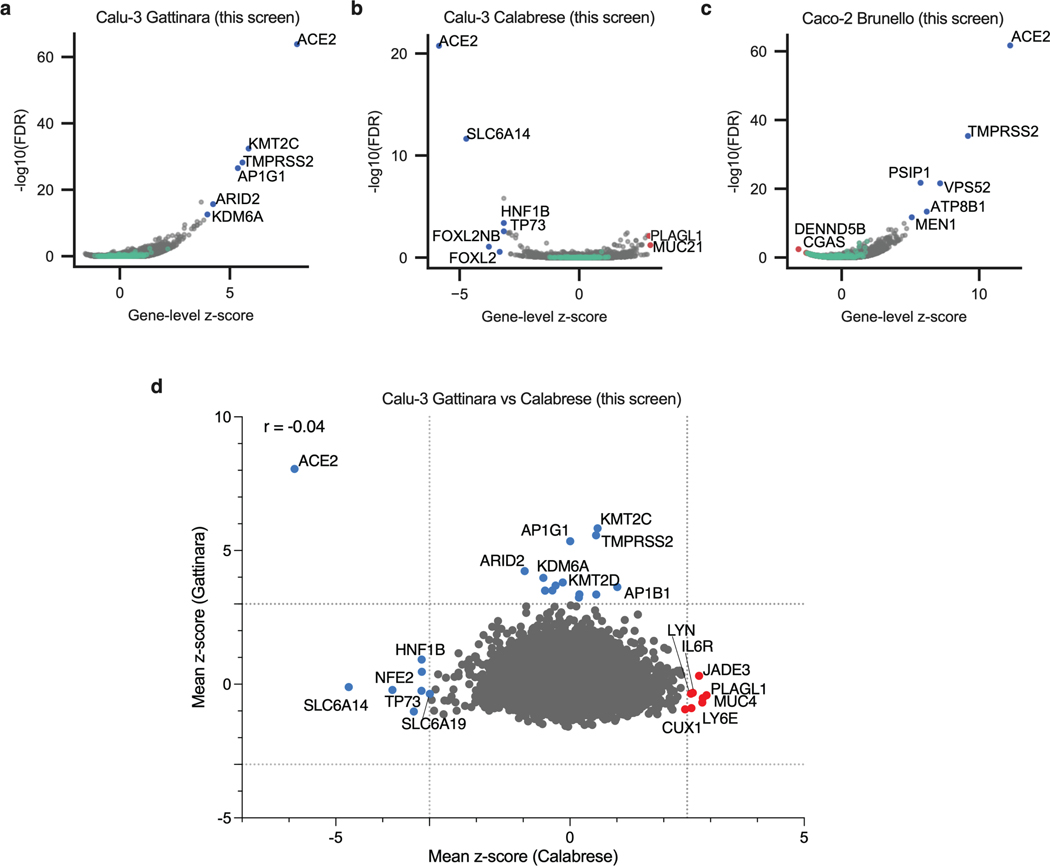
The KO screen was most powered to identify proviral factors (Extended Data Fig. 2a), and the top three genes were ACE2, KMT2C and TMPRSS2 (Fig. 2a; Supplementary Data 3). Importantly, the latter did not score in any of the cell models discussed above16–21; conversely, CTSL did not score in this screen. Interestingly, whereas the BAF-specific ARID1A scored in Vero E6 and A549 cells, PBAF-specific components ARID2 and PRBM1 scored as top hits in Calu-3 cells. Additional new hits include AP1G1, AP1B1, and AAGAB, which encode proteins that are part of, or regulate, the AP-1 complex. The latter is involved in the formation of clathrin-coated pits and vesicles, and are important for vesicle-mediated, ligand-receptor complex intracellular trafficking.
Fig. 2. Genome-wide CRISPR screens in Calu-3 reveal new regulators of SARS-CoV-2.
a. Scatter plot showing the gene-level mean z-scores of genes when knocked out in Calu-3 cells. The top genes conferring resistance to SARS-CoV-2 are annotated and shown in blue. This screen did not have any sensitization hits. (n = 20,513). b. Scatter plot showing the gene-level mean z-scores of genes when overexpressed in Calu-3 cells. The top genes conferring resistance and sensitivity to SARS-CoV-2 are annotated and shown in red and blue, respectively. (n = 20,000). c. Scatter plot showing the gene-level mean z-scores of genes when knocked out in Caco-2 cells. The top genes conferring resistance to SARS-CoV-2 are annotated and shown in blue. (n = 18,804). d. Heatmap of top 5 resistance hits from each cell line after averaging across screens in addition to genes that scored in multiple cell lines based on the criteria used to construct the Venn diagram in Fig. 1d (based on 16–21 and this study). Grey squares indicate genes that were filtered out for that particular cell line due to number of guides targeting that gene (see Methods).
In contrast to the KO screen, the CRISPRa screen detected both pro- and anti-viral genes (Fig. 2b; Extended Data Fig. 2b; Supplementary Data 4). Reassuringly, the top-scoring proviral hit was ACE2. Several solute carrier (SLC) transport channels also scored, including SLC6A19, a known partner of ACE225. On the antiviral side of the screen, a top scoring hit was LY6E, which is a known restriction factor of coronaviruses26. Additionally, MUC21, MUC4 and MUC1 all scored. Mucins are heavily glycosylated proteins and have a well-established role in host defense against pathogens27,28. Moreover, MUC4 has been recently proposed to possess a protective role against SARS-CoV-1 pathogenesis in a mouse model29.
To expand the range of cell lines examined further, we also performed a KO screen with the Brunello library20 in Caco-2 cells, which express ACE2 but were engineered to overexpress it (hereafter named Caco-2-ACE2), in order to increase CPE levels and enable viability-based screening. Similar to Calu-3 cells, ACE2 and TMPRSS2 were the top resistance hits (Fig. 2c, Extended Data Fig. 2a, c; Supplementary Data 5), indicating that Caco-2 and Calu-3 cells, unlike previously used models, rely on TMPRSS2-mediated cell entry, rather than the endocytic pathway. Assembling all the proviral genes identified across 5 cell lines, we confirmed that screen results are largely cell line dependent (Fig. 2d). Finally, we directly compared the KO and activation screens conducted in Calu-3 cells (Extended Data Fig. 2d). The only gene that scored with both perturbation modalities was ACE2, emphasizing that different aspects of biology are revealed by these screening technologies.
Hit identification is reproducible within cell line and technology in secondary screens
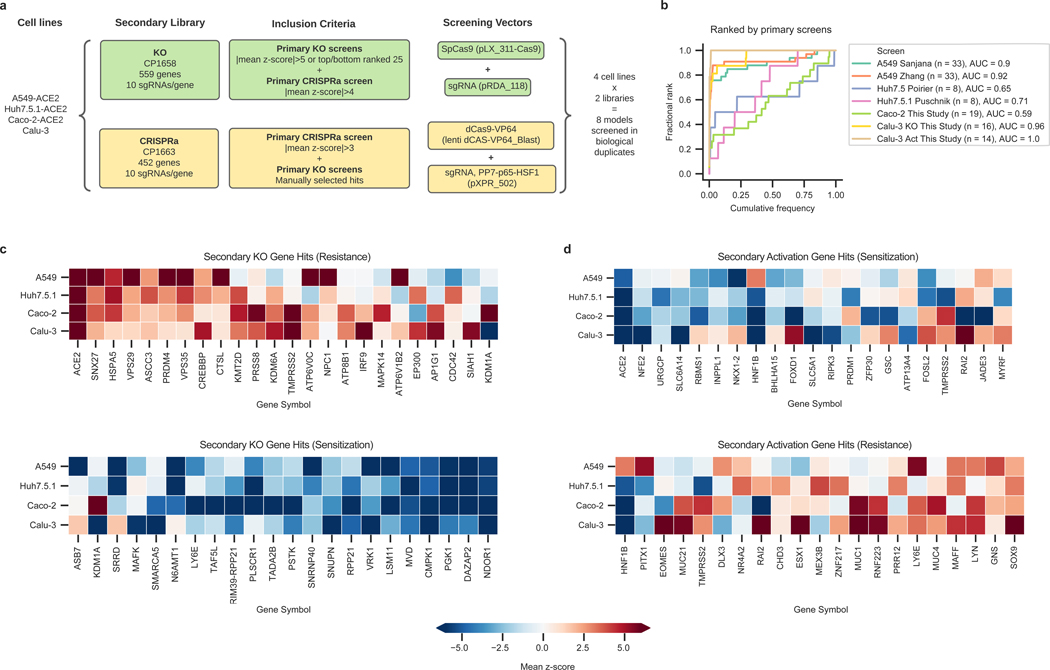
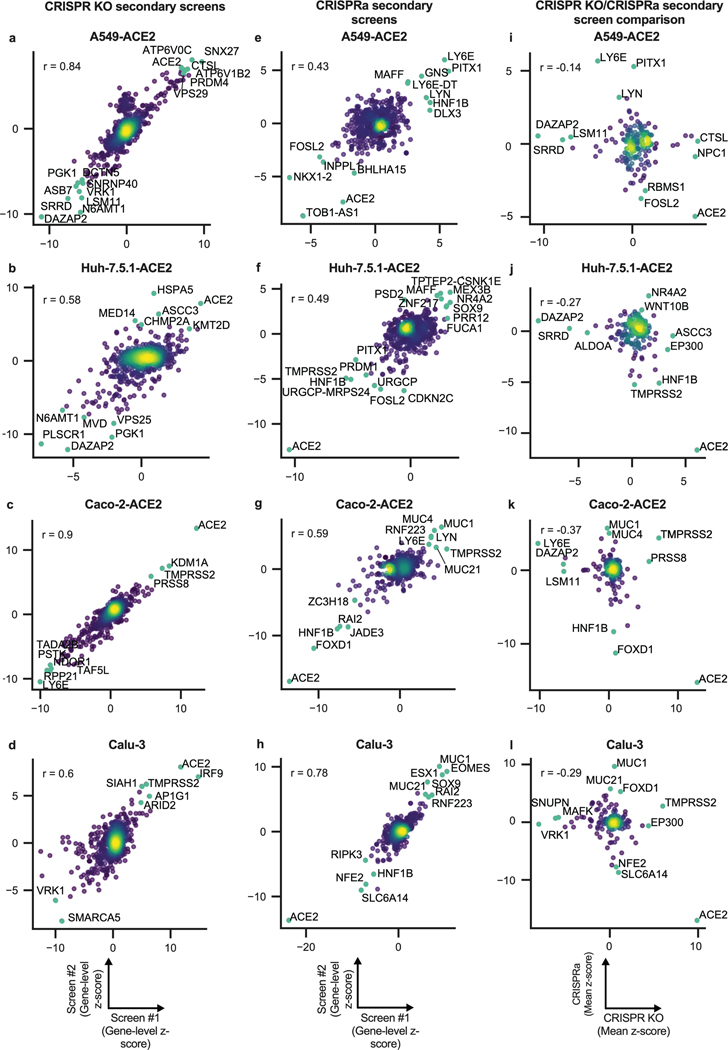
To validate the genome-wide CRISPR results, we collated hit genes from both published screens and those presented here, including 10 guides per gene and generating both KO and activation libraries (Fig. 3a; Supplementary Data 6-16). We then conducted two independent secondary screens in four human cell lines: Calu-3, Caco-2-ACE2, A549-ACE2, and Huh7.5.1-ACE2 cells. These secondary screens showed high replicate reproducibility (Extended Data Fig. 3a-d, e-h). Excellent concordance with their respective primary screens was observed for Calu-3 and A549-ACE2 cells, but a lower reproducibility was observed for Huh7.5.1 and Caco-2 cells (Fig. 3b). A detailed description of secondary screen data is provided in Supplementary Note 2.
Fig. 3. Secondary screens in Calu-3, Caco-2-ACE2, A549-ACE2 and Huh7.5.1-ACE2 cells.
a. Schematic of secondary library design and screen strategy. b. Cumulative distribution plots analyzing overlap of top hits between primary and secondary screens. Putative hit genes from the primary screen are ranked by mean z-score, and classified as validated hits based on mean z-score in the secondary screen, using a threshold of greater than 3 for KO or less than -3 for activation. AUC: area under the curve. c. Heatmap comparison of top resistance and sensitization hits from secondary KO screens across cell lines. d. Heatmap comparison of top resistance and sensitization hits from secondary activation screens across cell lines.
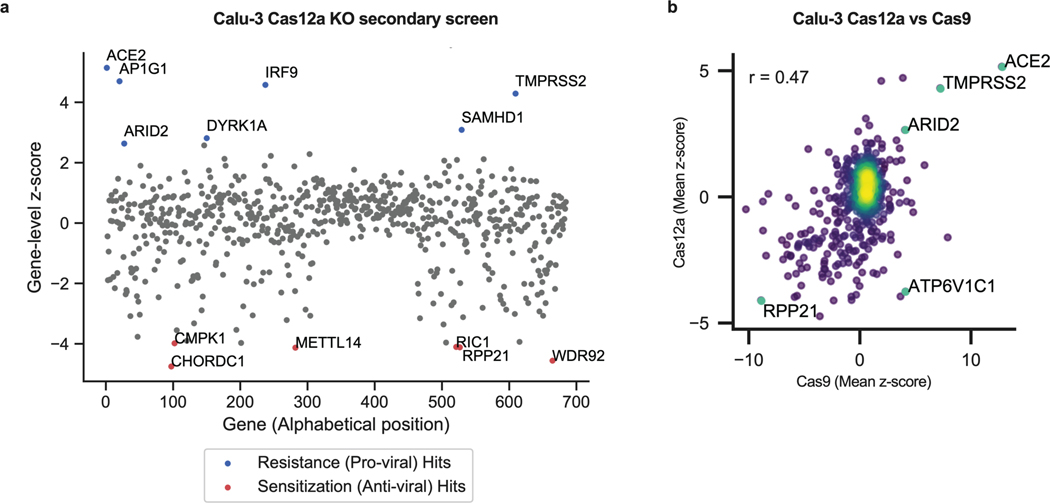
Comparisons between KO and activation screens confirmed that hits were largely directionally-dependent (Extended Data Fig. 3i-l). The secondary screens validated that the differences observed across cell systems (Fig. 3c-d) are largely attributed to true biological differences in these systems rather than both known and unknown differences in the execution of the primary CRISPR screens. Finally, a Cas12a-based secondary screen in Calu-3 cells confirmed the identification of some hits, such as AP1G1, and showed a good correlation with Cas9-based screens (Extended Data Fig. 4; Supplementary Data 12).
Individual validations confirm the identification of new proviral genes
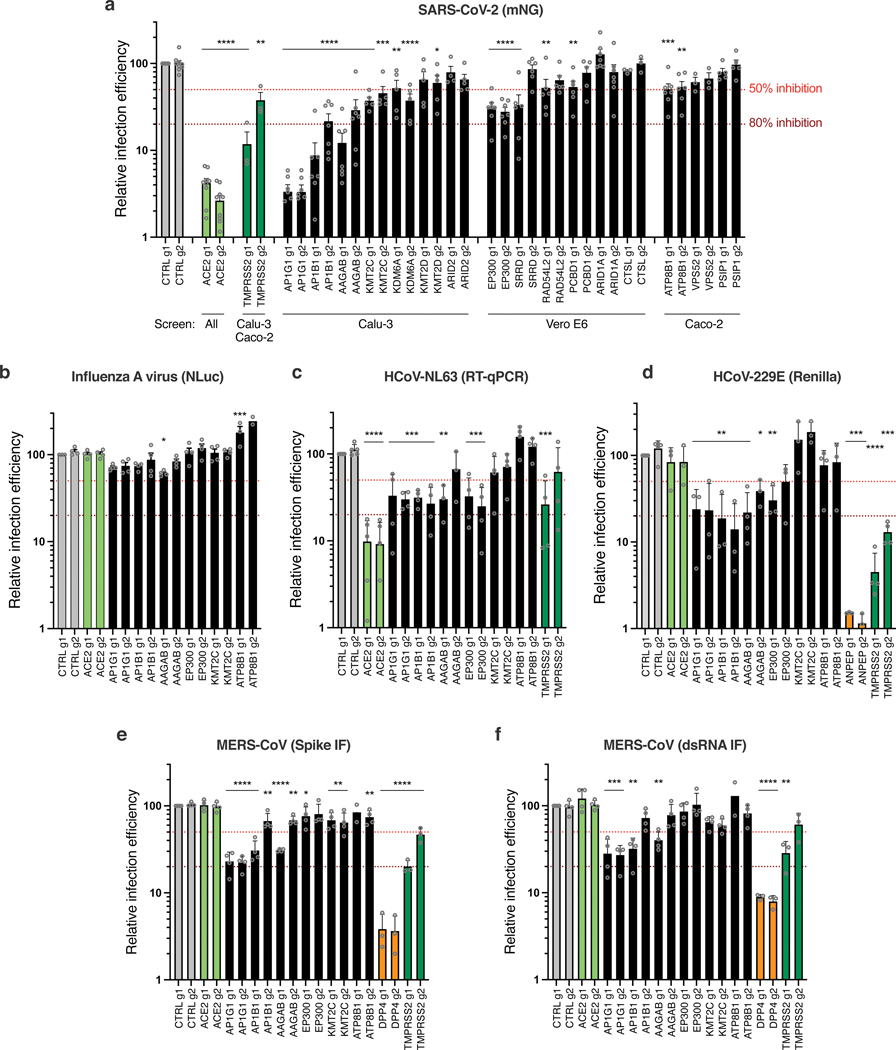
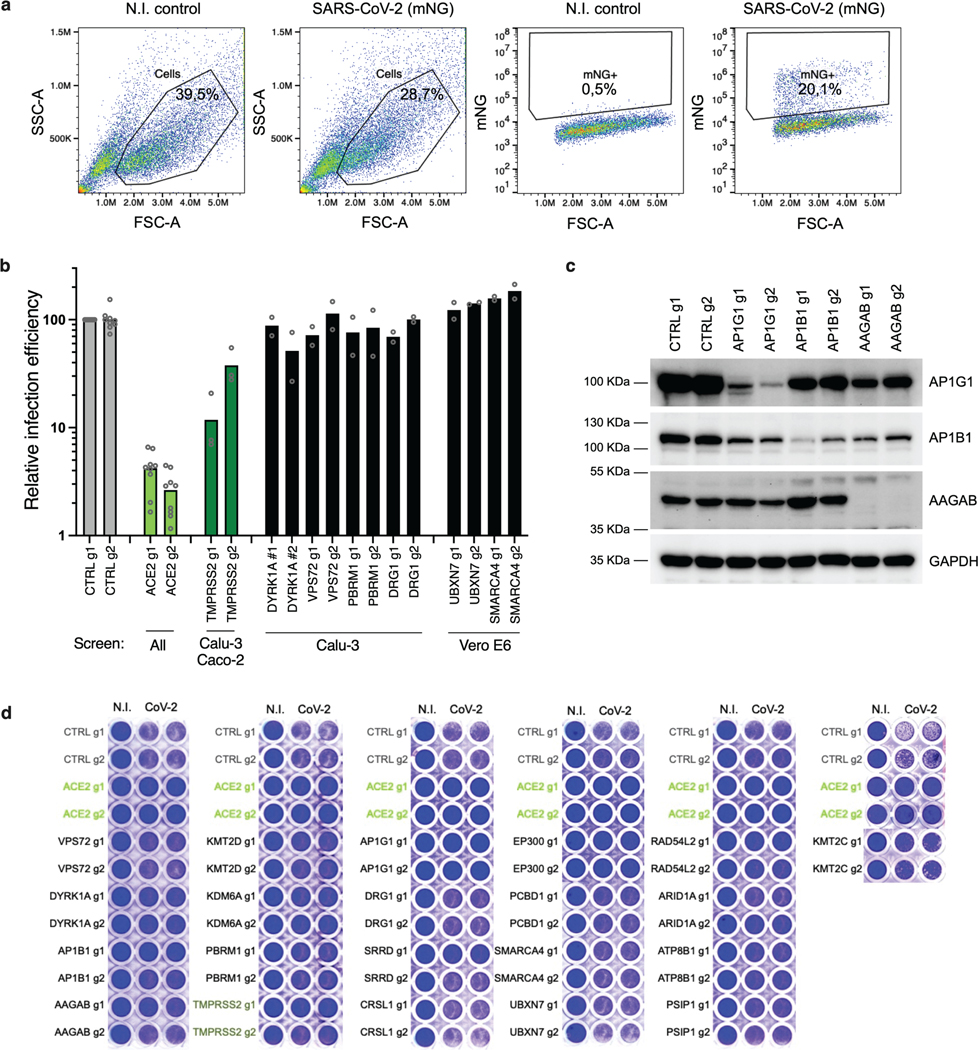
Next, we focused on proviral genes identified in our whole-genome KO screens and selected 22 candidates among the top ones identified in the screens performed in Calu-3, Vero E6 and Caco-2 cells. We designed 2 sgRNAs per candidate and generated polyclonal KO Calu-3 cell populations. Two weeks post-transduction, KO cell lines were challenged with SARS-CoV-2 bearing the mNeonGreen (mNG) reporter30 and the percentage of infected cells was scored by flow cytometry (Fig. 4a; Extended Data Fig. 5a-b). KO of around half the selected genes induced at least a 50% decrease in infection efficiency. Among them, AP1G1 KO had an inhibitory effect as drastic as ACE2 KO (>95% decrease in infection efficiency). Another gene coding an Adaptin family member, AP1B1, and a gene coding a known partner of the AP-1 complex, AAGAB, also had an important impact (~70–90% decrease in infection). Immunoblot analysis showed effective depletion of these Adaptins in KO cell populations (Extended Data Fig. 5c). As previously reported31,32, AAGAB KO had an impact on both AP1G1 and AP1B1 expression levels; AP1B1 KO impacted AP1G1 levels and vice versa (Extended Data Fig. 5c). The KO of 3 other genes, KMT2C, EP300, and ATP8B1, which code for a lysine methyltransferase, a histone acetyl transferase and a flippase, respectively, inhibited the infection efficiency by at least 50%. The KO of the other tested genes in Calu-3 cells had little to no impact on SARS-CoV-2 replication (Fig. 4a; Extended Data Fig. 5b). That a pooled screen can enrich for even a small fraction of cells harboring a knockout, whereas this flow cytometry-based assay requires that a high-fraction of cells with a given guide manifest the phenotype, may explain these different outcomes, although we cannot rule out here poor KO efficiency in some cell populations. In parallel, the KO of these candidates on SARS-CoV-2-induced CPE (Extended Data Fig. 5d) mirrored the data obtained with the reporter virus, with the exception of DYRK1A KO (Fig. 5a; Extended Data Fig. 5b).
Fig. 4. Impact of the identified proviral genes on coronaviruses SARS-CoV-2, HCoV-229E, HCoV-NL63, MERS-CoV and on orthomyxovirus influenza A.
Calu-3-Cas9 cells were stably transduced to express 2 different sgRNAs (g1, g2) per indicated gene and selected. a. Cells were infected with SARS-CoV-2 bearing the mNeonGreen (mNG) reporter and the infection efficiency was scored 48h later by flow cytometry. The cell lines/screens in which the candidates were identified are indicated below the graph. b. Cells were infected with influenza A virus bearing the Nanoluciferase (NLuc) reporter and 10h later, relative infection efficiency was measured by monitoring NLuc activity. c. Cells were infected with HCoV-NL63 and 5 days later, relative infection efficiency was determined using RT-qPCR. d. Cells were infected with HCoV-229E-Renilla and 48–72h later, relative infection efficiency was measured by monitoring Renilla activity. e-f. Cells were infected with MERS-CoV and 16h later, the percentage of infected cells was determined using anti-Spike (e) or anti-dsRNA (f) immunofluorescence (IF) staining followed by microscopy analysis (n=10 fields per condition). The mean and SEM of ≥ 3 independent experiments are shown (a-f; except in b for ATP8B1 g2, and in e and f for ATP8B1 g1, n=2). Statistical significance was determined with one-way ANOVA with Dunnett’s test (* p<0.05, ** p<0.01, *** p<0.001, **** p<0.0001) (a-f). Exact n numbers and p-values are indicated in Supplementary Data 17. The red and dark red dashed lines represent 50% and 80% inhibition, respectively.
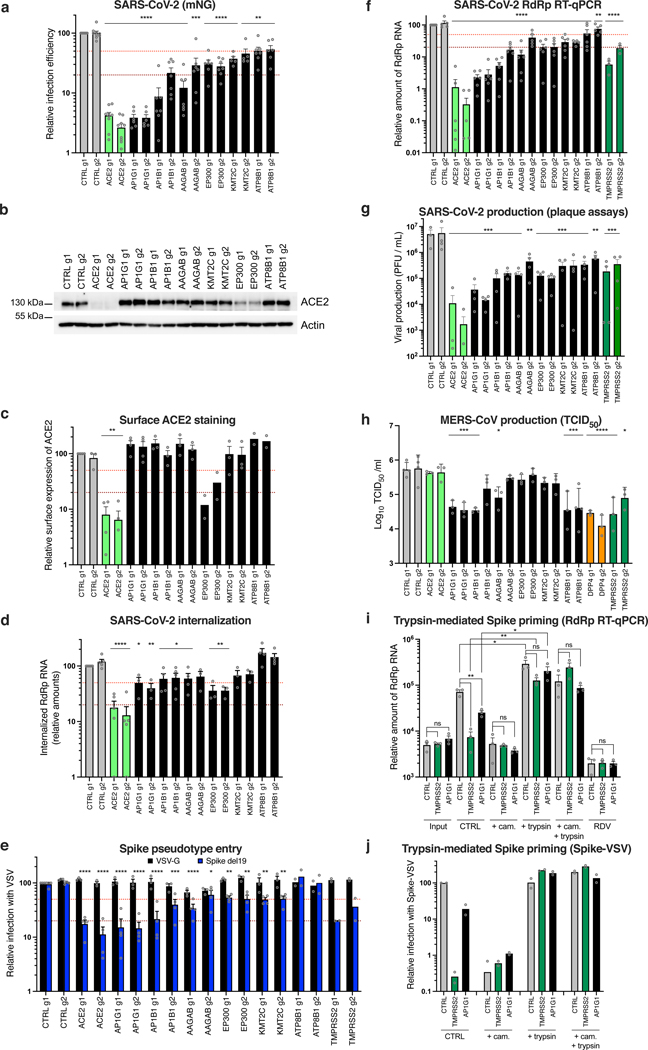
Fig. 5. Characterization of the impact of identified SARS-CoV-2 dependency factors.
Calu-3-Cas9 cells were transduced to express 2 sgRNAs (g1, g2) per gene. a. Cells were infected with SARS-CoV-2 mNG and infection efficiency was scored 48h later by flow cytometry. b. Expression levels of ACE2 were analyzed by immunoblot, Actin served as a loading control. A representative experiment (from 2 independent experiments) is shown. c. Relative surface ACE2 expression was measured using a Spike-RBD-mFc fusion followed by flow cytometry analysis. d. Cells were incubated with SARS-CoV-2 for 2h, treated with Subtilisin A followed by RNA extraction and RdRp RT-qPCR analysis. e. Cells were infected with Spike del19 and VSV-G pseudotyped, GFP-expressing VSV and infection efficiency was analyzed 24h later by flow cytometry. f. Cells were infected with SARS-CoV-2 and, 24h later, lysed for RNA extraction and RdRp RT-qPCR analysis. g. Supernatants from f were harvested and plaque assays performed. h. Cells were infected with MERS-CoV and 16h later, viral production in the supernatant was measured by TCID50. i. Cells were pre-treated with camostat mesylate (cam.) or not, or remdesivir (RDV) or not, incubated with SARS-CoV-2 for 30 min on ice and washed. Spike was then primed with trypsin or not, the media replaced and 7h later, cells were lysed for RNA extraction and RdRp RT-qPCR analysis. j. Similar to i, with Spike-pseudotyped, Firefly-expressing VSV. Cells were lysed and relative infection measured by monitoring Firefly activity 24h later. The mean and SEM of ≥ 5 (a), ≥ 3 (c, d, e, f, h, i; except for EP300 and ATP8B1 KO in c and for ATP8B1 and TMPRSS2 KO in e, n=2) or 4 (g) independent experiments, or the mean of 2 independent experiments (j) are shown. Statistical significance was analyzed using a two-sided t-test with no adjustment for multiple comparisons (a, c, i) or a one-way ANOVA with Dunnett’s test (d, e, f, g, h) (* p<0.05, ** p<0.01, *** p<0.001, **** p<0.0001). Exact n numbers and p-values are indicated in Supplementary Data 17. The red and dark red dashed lines represent 50% and 80% inhibition, respectively (a, c-f).
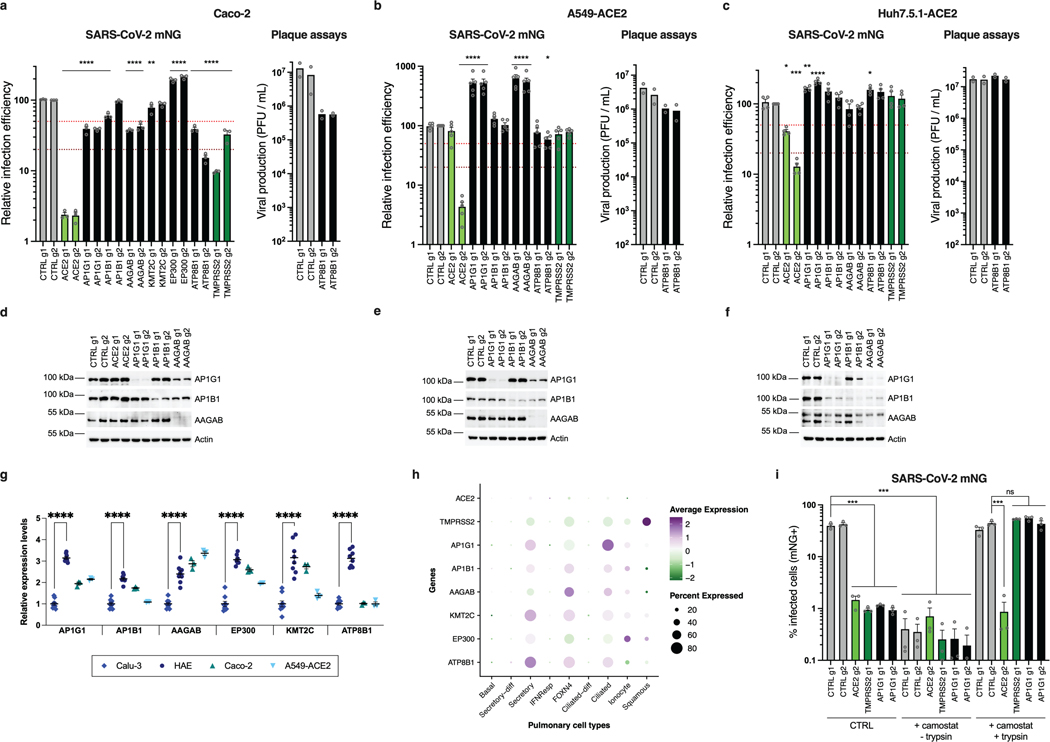
We then confirmed an important role of AP1G1, AAGAB and ATP8B1 in Caco-2 cells (Extended Data Fig. 6a). However, AP1B1 KO had little impact, but might have been insufficient (Extended Data Fig. 6a, d). EP300 and KMT2C also played little or no role in these cells (Extended Data Fig. 6a), assuming their KO was efficient. None of the tested gene KO inhibited replication in A549-ACE2 or Huh7.5.1-ACE2 cells (Extended Data Fig. 6b, c), despite a strong reduction of protein levels in KO populations (Extended Data Fig. 6e, f). Using RT-qPCR, we observed that the hits validated in Calu-3 cells (AP1G1, AB1B1, AAGAB, KMT2C, EP300 and ATP8B1) were expressed at significantly higher levels in HAE compared to Calu-3 cells, and to similar or higher levels in Caco-2 and A549-ACE2 cell lines (Extended Data Fig. 6g). Encouragingly, based on a recent scRNA-seq study33, these genes were all well expressed in SARS-CoV-2 primary target cells from the respiratory epithelia (Extended Data Fig. 6h).
Knocking-out these candidate genes had no substantial impact on the replication of another respiratory virus, the orthomyxovirus influenza A virus (IAV), arguing against a general role in viral infection (Fig. 4b). In contrast, seasonal HCoV-NL63 replication was impacted by AP1G1, AP1B1, AAGAB (g1) and EP300 KO, but not by KMT2C or ATP8B1 KO (Fig. 4c). Interestingly, seasonal HCoV-229E and highly pathogenic MERS-CoV, which do not use ACE2 for entry but ANPEP and DPP4, respectively, were both strongly affected by AP1G1, and, to some extent, by AP1B1 and AAGAB KO (Fig. 4d-f), showing a pan-coronavirus role of these genes.
Next, we aimed to determine the viral life cycle step affected by the best candidates, i.e., with a >50% effect in mNG reporter expression (Fig. 5a). Immunoblot analysis revealed similar (or higher) expression levels of ACE2 in the different KO cell lines in comparison to controls, except for ACE2 and EP300 KO cells, which had decreased levels of ACE2 (Fig. 5b). Using a recombinant Spike Receptor Binding Domain (RBD) fused to a mouse Fc fragment in order to stain ACE2 at the cell surface, no substantial decrease in ACE2 at the plasma membrane was observed, apart from ACE2 and EP300 KO cell lines, as expected (Fig. 5c). To assess the internalization efficiency of viral particles, we measured the relative amounts of internalized viruses (Fig. 5d). This showed that AP1G1, AP1B1, AAGAB and EP300 KO impacted SARS-CoV-2 internalization to at least some extent, but not ATP8B1 KO. We then used vesicular stomatitis virus (VSV) particles pseudotyped with either VSV-G glycoprotein or SARS-CoV-2 Spike, bearing a C-terminal deletion of 19 amino acids (hereafter named Spike del19) as a surrogate for viral entry34,35 (Fig. 5e). Of note, both ACE2 and TMPRSS2 KO specifically impacted Spike del19-VSV infection, confirming that the pseudotypes mimicked wild-type SARS-CoV-2 entry in Calu-3 cells. Spike del19-dependent entry was affected in most cell lines in comparison to VSV-G-mediated entry, with, again, the exception of ATP8B1 KO cells. Analysis of SARS-CoV-2 RNA replication by RdRp RT-qPCR (Fig. 5f) and viral production in the cell supernatants by plaque assays (Fig. 5g) mirrored the data obtained using the mNG reporter virus, apart from ATP8B1 KO cells. Indeed, in the latter, there was only ~50% decrease in viral RNAs or mNG expression, but more than one order of magnitude reduction in viral production, pinpointing a late block during replication (Fig. 5a, f-g). ATP8B1 KO also decreased infectious SARS-CoV-2 production in Caco-2 cells (Extended Data Fig. 6a, right panel) but had little to no impact in A549-ACE2 and Huh7.5.1-ACE2 cells (Extended Data Fig. 6b-c, right panels).
Importantly, similarly to SARS-CoV-2, MERS-CoV relied on AP1G1 and AP1B1 in Calu-3 cells, as AP1G1 and AP1B1 (g1) KO had an impact comparable to DPP4 KO on viral production (Fig. 5h). Moreover, ATP8B1 KO strongly impacted infectious MERS-CoV particle production, whereas it did not impact infection as measured by Spike or dsRNA intracellular staining (Fig. 5h and 4e-f), arguing for a common and late role of ATP8B1 in the coronavirus replicative cycle.
We next investigated the adaptin role in viral replication. Our data showed that the KO of AP1G1, AP1B1 or AAGAB specifically impacted SARS-CoV-2 infection with Spike del19-pseudotyped VSV (Fig. 5e), while not affecting ACE2 expression at the cell surface (Fig. 5c). In line with this, the KO of these factors also impacted MERS-CoV and HCoV-229E, which use different receptors (Fig. 4d-f, 5h). However, all these coronaviruses may use TMPRSS2 for Spike priming at the plasma membrane36–38. Moreover, adaptin KO did not inhibit infection in cells in which entry occurs via the endosomal pathway (Extended Data Fig. 6b-c). Adaptins, which orchestrate polarized sorting at the trans-Golgi network and recycling endosomes39, regulate surface levels of a high number of plasma membrane proteins32. Therefore, we hypothesized that they might be important for TMPRSS2 surface expression. To determine whether that was the case, we purified plasma membrane-associated proteins from control, TMPRSS2 and AP1G1 KO cell populations but were unable to specifically detect endogenous TMPRSS2 by immunoblot using various commercial antibodies. We next used mass spectrometry analyses on plasma membrane extracts and total cell lysates from these Calu-3 KO cell populations, but could not detect TMPRSS2 (Supplementary Data 18), which has been reported to be poorly abundant40. To indirectly address whether AP1G1 regulates TMPRSS2, we tested if AP1G1 KO phenotype could be bypassed by exogenous priming of Spike (Fig. 5i). The viral input control showed no difference in virus binding between CTRL, TMPRSS2 or AP1G1 KO Calu-3 cells. 7h post-infection, TMPRSS2 and AP1G1 KO showed decreased viral replication in comparison to CTRL KO, as expected. However, Spike priming with trypsin treatment rescued viral replication both in TMPRSS2 KO and AP1G1 KO cells. Similar results were obtained with SARS-CoV-2 mNG reporter (Extended Data Fig. 6i) and with Spike del19-pseudotyped VSV (Fig. 5j). Altogether, these data strongly suggested that AP1G1 regulates Spike priming, presumably in an indirect manner, by regulating TMPRSS2 levels at the plasma membrane.
CRISPRa screen reveals new genes regulating SARS-CoV-2 replication
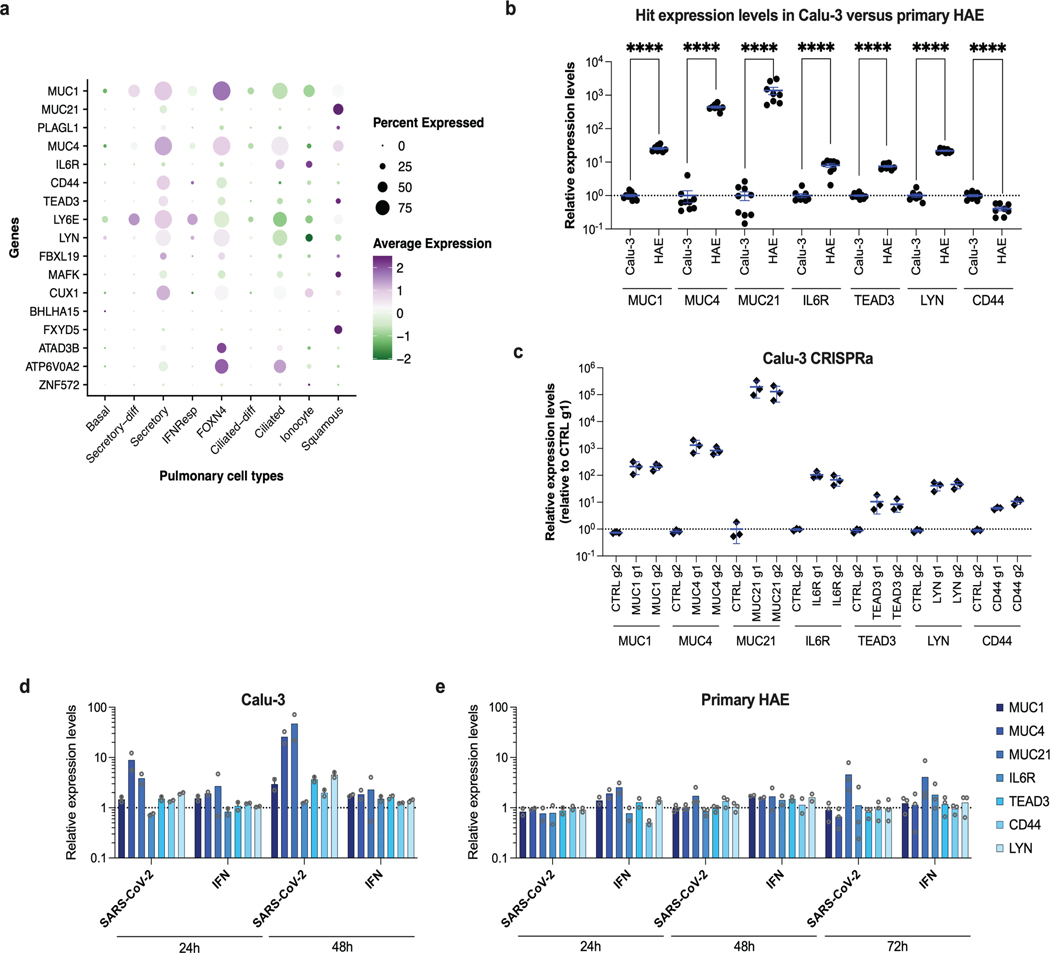
Next, 21 genes among the top-ranking hits conferring resistance to SARS-CoV-2 replication from the whole-genome CRISPRa screens were selected for individual validation, using two sgRNAs in Calu-3-dCas9-VP64 cells. In parallel, non-targeting sgRNAs and sgRNAs targeting ACE2 and IFNL2 promoters were used as controls. The sgRNA-expressing cell lines were challenged with SARS-CoV-2 mNG reporter and the percentage of infected cells scored by flow cytometry (Fig. 6a). As expected22,26,41, the induction of IFNL2 and LY6E expression potently decreased SARS-CoV-2 replication. The increased expression of the vast majority of the selected hits induced at least a 50% decrease in infection efficiency, with at least 1 sgRNA. Some genes had a particularly potent impact on SARS-CoV-2 and decreased replication levels by 80% or more, including MUC1, MUC21, MUC4, as well as CD44, PLAGL1, IL6R, TEAD3 and LYN (Fig. 6a). Additionally, published scRNA data33 showed that most of the identified antiviral genes are expressed in a substantial percentage of airway epithelial cells (Extended Data Fig. 7a). Interestingly, primary HAE expressed MUC1, MUC4, MUC21, CD44, IL6R, TEAD3 and LYN at significantly higher levels than Calu-3 cells (with the exception of CD44, which was slightly less expressed) (Extended Data Fig. 7b). Expression levels in CRISPRa Calu-3 cells were relatively similar to those observed in HAE (Extended Data Fig. 7b-c). Moreover, MUC21 was upregulated upon SARS-CoV-2 replication in HAE and Calu-3 cells, as well as MUC4 in the latter (Extended Data Fig. 7d-e).
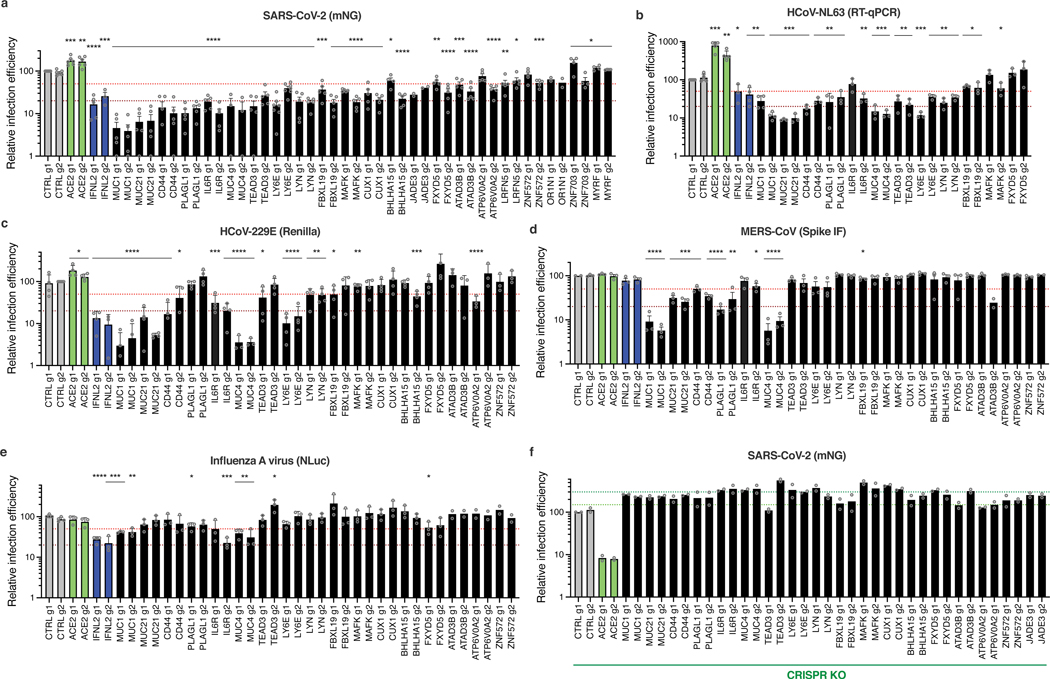
Fig. 6. Impact of the identified antiviral genes on coronaviruses SARS-CoV-2, HCoV-229E, and MERS-CoV, and on orthomyxovirus influenza A.
Calu-3-dCas9-VP64 (a-e) or Calu-3-Cas9 (f) cells were stably transduced to express 2 sgRNAs (g1, g2) per indicated gene promoter (a-e) or coding region (f), or negative controls (CTRL) and selected for at least 10–15 days. a. Cells were infected with SARS-CoV-2 bearing the mNG reporter and the infection efficiency was scored 48h later by flow cytometry. b. Cells were infected with HcoV-NL63 and infection efficiency was scored 5 days later by RT-qPCR. c. Cells were infected with HcoV-229E-Renilla and 48–72h later, relative infection efficiency was measured by monitoring Renilla activity. d. Cells were infected with MERS-CoV and 16h later, the percentage of infected cells was determined using anti-Spike IF staining followed by microscopy analysis (n=10 fields per condition). e. Cells were infected with influenza A virus bearing the NLuc reporter and 10h later relative infection efficiency was measured by monitoring NLuc activity. f. Cells were infected with SARS-CoV-2 bearing the mNG reporter and the infection efficiency was scored 48h later by flow cytometry. The mean and SEM of ≥ 3 (a, b, c, d, e; except for a, JADE3, OR1N1 KO, d, MAFK1 g1, ATAD3B g2, ZNF572 g2 KO, and e, ATAD3B, ATP6V0A2, ZNF572 KO, n=2) or 2 (f) independent experiments are shown. Statistical significance was determined by a two-sided t-test (* p<0.05, ** p<0.01, *** p<0.001, **** p<0.0001) (a-e). Exact n numbers and p-values are indicated in Supplementary Data 17. The red and dark red dashed lines indicate 50% and 80% inhibition (a-e), and the green and dark green dashed lines indicate 150% and 300% increase in infection efficiency, respectively (f).
We then examined the antiviral breadth of some validated genes. HCoV-NL63 showed high sensitivity to increased expression of MUCs, CD44, PLAGL1, TEAD3, LYN or LY6E (Fig. 6b). Interestingly, similarly to SARS-CoV-2 and HCoV-NL63, HCoV-229E was highly sensitive to the overexpression of MUCs, IL6R, LY6E, CD44, but was less or not affected by the other genes, such as PLAGL1 (Fig. 6c). MERS-CoV infection was impacted by overexpression of MUCs and to some extent by PLAGL1, CD44, IL6R, LY6E and ATAD3B, but not by the other genes (Fig. 6d). The induction of most candidate genes had no impact on IAV infection (Fig. 6e), with the exception of MUC4 and MUC1, which decreased the infection efficiency by ~60–70%, as reported previously28, and IL6R, with sgRNA g2 leading to 75% infection decrease. Finally, we assessed the impact of these antiviral genes by CRISPR KO, and showed that the KO of most of them increased SARS-CoV-2 infection efficiency, confirming their physiological relevance (Fig. 6f).
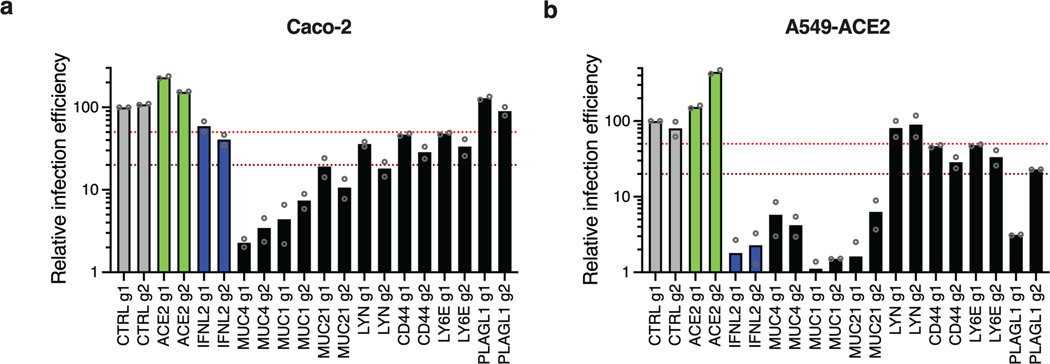
Next, we tested several candidates in Caco-2 and in A549-ACE2 cells (Extended Data Fig. 8). MUC4, MUC1 and MUC21 overexpression potently decreased SARS-CoV-2 infection in these two cell lines. Moreover, PLAGL1 also had a strong impact in A549-ACE2 cells but not in Caco-2 cells, and the opposite was true for LYN. This might suggest a potential cell type specificity for the former (e.g. lung origin) and possibly a dependence on ACE2/TMPRSS2 endogenous expression for the latter. CD44 and LY6E also had some inhibitory effect in both cell lines. Taken together, this showed that the effect of the validated candidates could be observed in other cell types than Calu-3 cells, as also shown by the secondary screens (Fig. 3d).
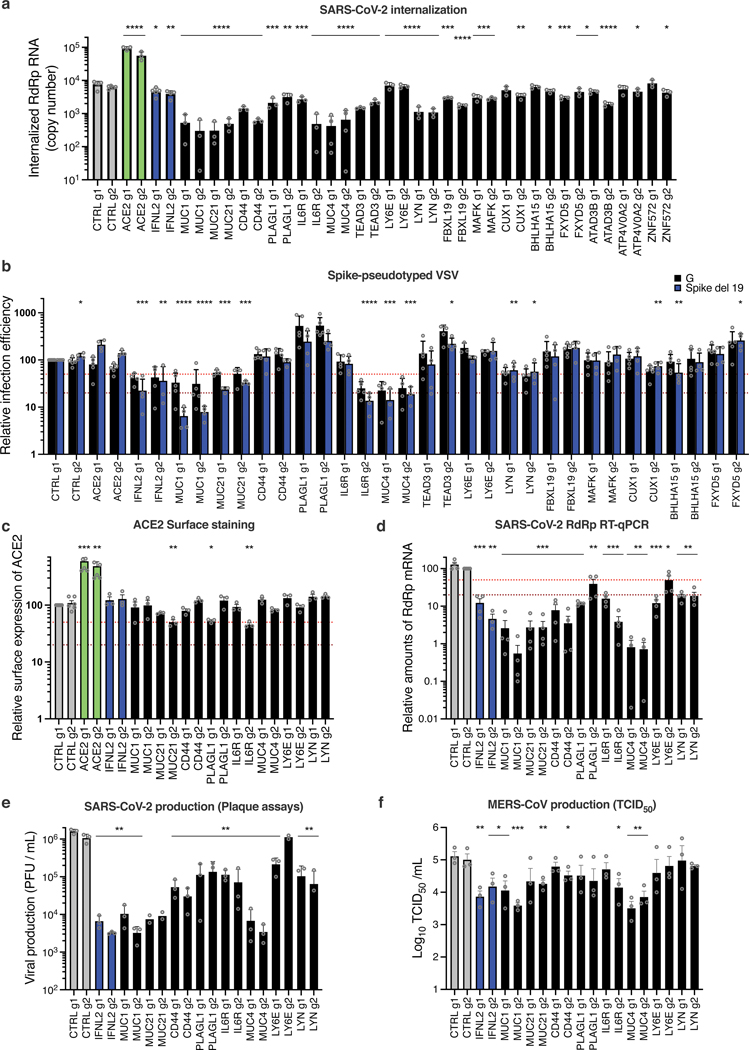
Next, the SARS-CoV-2 internalization assay (performed as in Fig. 5d), showed that most of the validated genes, including those showing the strongest inhibitory phenotypes (namely MUC1, MUC21, CD44, PLAGL1, IL6R, MUC4, and LYN) impacted viral internalization (Fig. 7a). The measure of viral entry using VSV pseudotypes globally mirrored the internalization data, and showed that G-dependent entry was also sensitive to the overexpression of Mucins, IL6R or LYN (Fig. 7b). However, whereas CD44, PLAGL1 and TEAD3 had an impact on SARS-CoV-2 entry as measured by the internalization assay, there was no effect of these genes on Spike del19-VSV pseudotype infection, perhaps highlighting subtle differences in the mechanism of entry between pseudotypes and wild-type SARS-CoV-2. Surprisingly, LY6E induction had no measurable impact on viral entry, either using the internalization assay or the pseudotypes, contrary to what was reported before26. Differences in the experimental systems used could explain the differences observed here and would require further investigation. ACE2 surface staining showed that inhibition of viral entry could not be explained by a decrease in ACE2 surface expression in most cases (Fig. 7c). Finally, the impact of the best candidates on SARS-CoV-2 and MERS-CoV replication, measured by RdRp RT-qPCR and plaque assays for SARS-CoV-2 (Fig. 7d, e) or TCID50 for MERS-CoV (Fig. 7f), recapitulated what was observed with SARS-CoV-2 mNG reporter (Fig. 6a) and MERS-CoV Spike intracellular staining (Fig. 6d).
Fig. 7. Characterization of the impact of identified SARS-CoV-2 antiviral factors.
Calu-3-dCas9-VP64 cells were stably transduced to express 2 different sgRNAs (g1, g2) per indicated gene promoter and selected for 10–15 days. a. Cells were incubated with SARS-CoV-2 for 2h and then treated with Subtilisin A followed by RNA extraction and RdRp RT-qPCR analysis. b. Cells were infected with Spike del19 and VSV-G pseudotyped, Firefly-expressing VSV and infection efficiency was analyzed 24h later by monitoring Firefly activity. c. Relative surface ACE2 expression was measured using a Spike-RBD-mFc fusion and a fluorescent secondary antibody followed by flow cytometry analysis. d. Cells were infected with SARS-CoV-2 and, 24h later, lysed for RNA extraction and RdRp RT-qPCR analysis. e. Aliquots of the supernatants from d were harvested and plaque assays were performed to evaluate the production of infectious viruses in the different conditions. f. Cells were infected with MERS-CoV and 16h later, infectious particle production in the supernatant was measured by TCID50. The mean and SEM of ≥ 3 independent experiments are shown (a, c, d, e, f; except for e, MUC21 and LY6E g2 KO, n=2). Statistical significance was determined by a two-sided t-test with no adjustment for multiple comparisons (* p<0.05, ** p<0.01, *** p<0.001, **** p<0.0001) (a-f). Exact n numbers and p-values are indicated in Supplementary Data 17. The red and the dark red (b, c, d) dashed lines represent 50% and 80% inhibition, respectively.
Noteworthy, the 3 Mucins had the strongest impact on both SARS-CoV-2 and MERS-CoV production (~2 log and ~1 log decrease, respectively) (Fig. 7e-f). The activation of IL6R, CD44, PLAGL1, and LYN also had a substantial impact on SARS-CoV-2 replication (~1 log decrease or more, for at least 1 sgRNA) but had a globally milder impact on MERS-CoV replication, with LYN having no impact at all (Fig. 7e-f). Whereas Mucins are well-known to act as antimicrobial barriers42,43, the role of antiviral genes such as IL6R, CD44 or PLAGL1 in limiting SARS-CoV-2 entry remains to be elucidated.
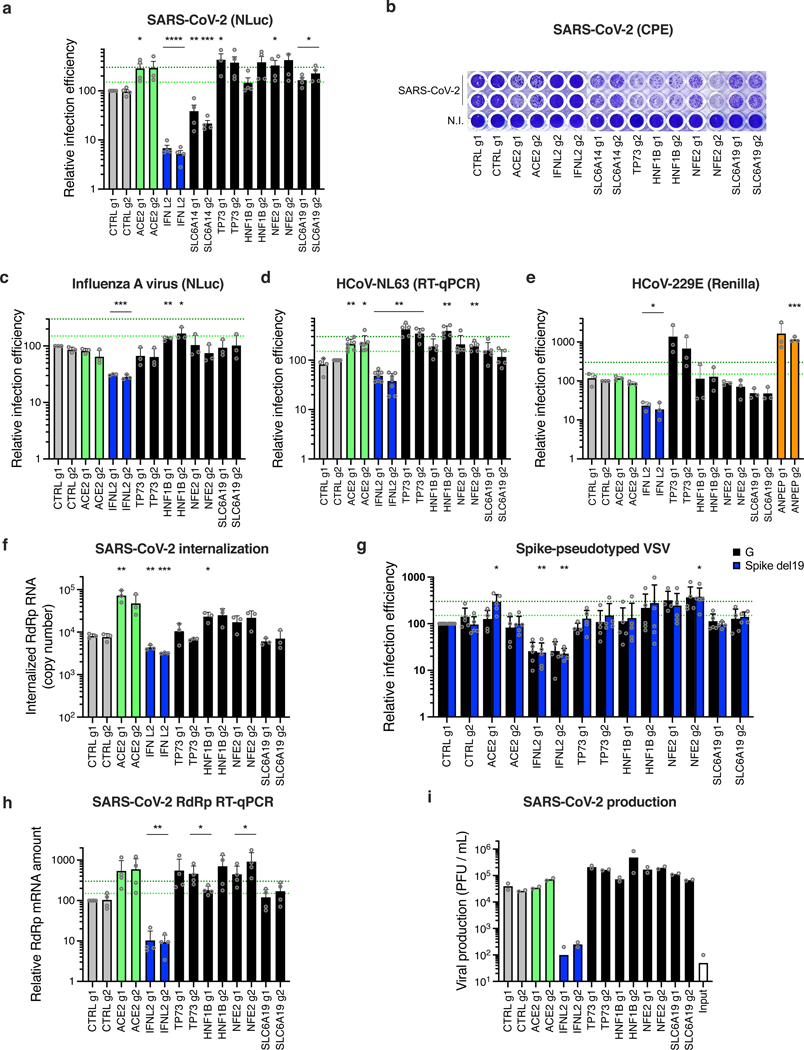
Finally, in addition to the dependency factors identified by the KO screens, we selected several of the top-ranking hits conferring sensitization to SARS-CoV-2 replication in the CRISPRa screen (Fig. 8). We used the same type of approaches as previously and notably identified TP73, NFE2 or SLC6A19 as proviral genes, as described in Supplementary Note 3 (Fig. 8; Extended Data Fig. 10).
Fig. 8. Impact of the proviral genes identified by CRISPRa on coronaviruses SARS-CoV-2, HCoV-229E, HCoV-NL63 and on orthomyxovirus influenza A.
Calu-3-dCas9-VP64 cells were stably transduced to express 2 different sgRNAs (g1, g2) per indicated gene promoter and selected. a. Cells were non infected (N.I.) or incubated with SARS-CoV-2 bearing NLuc reporter and the infection efficiency was scored 30 h later by monitoring NLuc activity. b. Cells were infected by SARS-CoV-2 at MOI 0.05 and 5 days later stained with crystal violet. Representative images from 2 independent experiments are shown. c. Cells were infected with influenza A virus bearing NLuc reporter and 10h later, relative infection efficiency was measured by monitoring NLuc activity. d. Cells were infected with HCoV-NL63 and 5 days later, infection efficiency was determined using RT-qPCR. e. Cells were infected with HCoV-229E-Renilla and 72h later, relative infection efficiency was measured by monitoring Renilla activity. f. Cells were incubated with SARS-CoV-2 for 2h and then treated with Subtilisin A followed by RNA extraction and RdRp RT-qPCR analysis as a measure of viral internalization. g. Cells were infected with Spike del19 and VSV-G pseudotyped, Firefly-expressing VSV and infection efficiency was analyzed 24h later by monitoring Firefly activity. h. Cells were infected with SARS-CoV-2 and, 24h later, lysed for RNA extraction and RdRp RT-qPCR analysis. i. Aliquots of the supernatants from h were harvested and plaque assays were performed to evaluate the production of infectious viruses in the different conditions. The mean and SEM of ≥ 3 (a, c, e, f), ≥ 4 (d, g, h), or 2 (i) independent experiments are shown. Statistical significance was determined by a two-sided t-test with (* p<0.05, ** p<0.01, *** p<0.001, **** p<0.0001) (a, c-h). Exact n numbers and p-values are indicated in Supplementary Data 17. The green and dark green dashed lines indicate 150% and 300% increase in infection efficiency, respectively (a, c-e, g-h).
Discussion
Despite intense research efforts, much remains to be discovered about host factors regulating replication of SARS-CoV-2 and other coronaviruses. Recently, a number of whole-genome CRISPR KO screens successfully identified coronavirus host-dependency factors16–21. However, most of these screens relied on ACE2 ectopic expression and were performed in cells which do not express the important cofactor for entry TMPRSS26 (with one exception19). Our meta-analysis of these screens revealed a high-level of cell type specificity in the hits identified, indicating a need to pursue such efforts in other model cell lines, in order to better define the landscape of SARS-CoV-2 cofactors. We observed differential validation rates across cell lines, perhaps reflecting greater intrinsic heterogeneity of certain models and heightened sensitivity to exact experimental conditions44.
Here, we performed bidirectional, genome-wide screens in physiologically relevant lung adenocarcinoma Calu-3 cells and KO screens in colorectal adenocarcinoma Caco-2 cells. We identified new host-dependency factors, which are essential for SARS-CoV-2 replication and other coronaviruses, namely MERS-CoV, HCoV-229E and HCoV-NL63. Furthermore, our study characterized new antiviral genes, some with potent and/or broad anti-coronavirus activity. Importantly, by using secondary libraries based on the hits retrieved from published screens and our screens, and screening in 4 human cell lines (A549-ACE2, Calu-3, Caco-2-ACE2, Huh7.5.1-ACE2), we further confirmed the reproducibility and strong cell type specificity of the hits identified in viability-based whole-genome screens. These results emphasize the value of considering multiple cell models and perturbational modalities (both CRISPR KO and CRISPRa) to better unravel the full landscape of SARS-CoV-2 host factors.
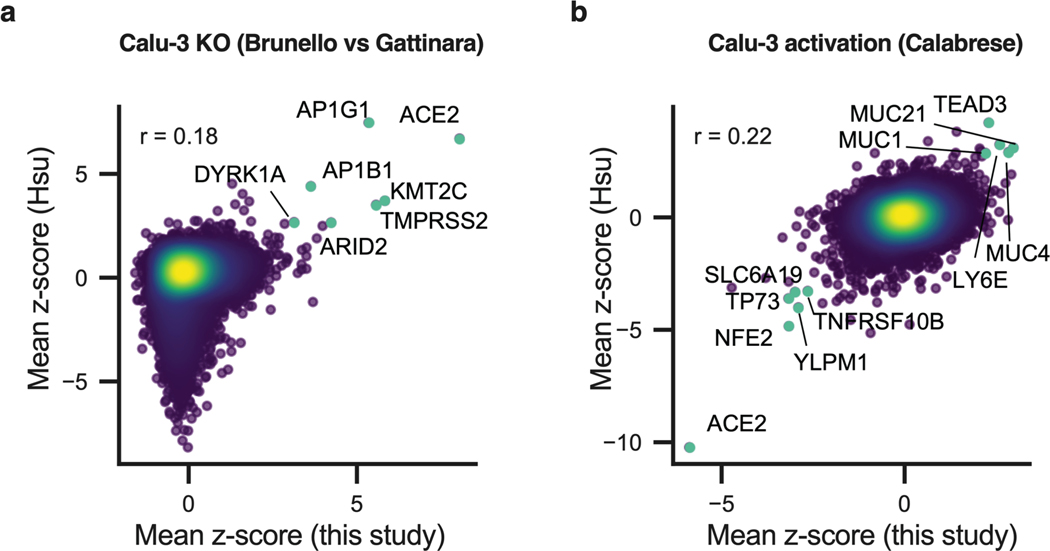
Simultaneously to our screens, bidirectional, genome-wide screens were performed in Calu-3 cells by P. Hsu and colleagues45. Comparisons between our data and theirs showed a very good overlap in the hits identified (Extended Data Fig. 10), with shared hits including host-dependency factors Adaptins AP1G1 and AP1B1, as well as the antiviral Mucins. This comparison emphasizes the reproducibility of CRISPR screens conducted across different labs, even when different libraries are used, while further highlighting that the cellular model is the primary source of variability.
Most of the identified genes impacted the early phases of the replication cycle. This observation was true for both the host dependency factors and the antiviral inhibitors, presumably emphasizing the fact that viral entry is the most critical step of the viral life cycle and probably, as such, the most easily targeted by natural defenses. Among the host-dependency factors essential for viral entry, the Adaptin AP1G1 and, to a lower extent, Adaptin AP1B1 and their partner AAGAB, surprisingly played a crucial role. The AP-1 complex regulates polarized sorting at the trans-Golgi network and/or recycling endosomes, and may play an indirect role in apical sorting39. Interestingly, AAGAB binds to and stabilizes AP1G131, and, as observed in our study, in AAGAB KO cells, AP1G1 is less abundant31, which may suggest a role of AAGAB via the regulation of AP-1 complex here. Our data showed that AP1G1, AP1B1 and AAGAB are crucial host-dependency factors in Calu-3 cells for all coronaviruses studied here. More precisely, the KO of AP1G1, AP1B1 or AAGAB impacted SARS-CoV-2 entry and this could be abrogated by exogenous (trypsin mediated) priming of SARS-CoV-2 Spike. This suggested that the adaptins are important regulators of Spike priming, presumably indirectly, via the regulation of TMPRSS2. Further work will be necessary to fully elucidate the role of the adaptins in coronavirus entry and to determine whether they are necessary for the proper expression and/or localization of TMPRSS2 at the plasma membrane.
The only proviral gene acting at a late stage of the viral life cycle was ATP8B1, which belongs to the P4-type subfamily of ATPases transporters and is a flippase translocating phospholipids from the outer to the inner leaflet of membrane bilayers46. ATP8B1 is essential for proper apical membrane structure and mutations of this gene have been linked to cholestasis. The fact that ATP8B1 was important for both SARS-CoV-2 and MERS-CoV replication highlighted a potentially conserved role for coronaviruses. Interestingly, ATP8B1 and its homologous ATP8B2 were recently identified as binding-partners of SARS-CoV-2 ORF3 and M, respectively47, suggesting that the virus might subvert their functions. Of note, TMEM41B, an integral protein of the endoplasmic reticulum known to regulate the formation of autophagosomes, lipid droplets and lipoproteins, was recently shown to be both an essential coronavirus cofactor18 and a phospholipid scramblase whose deficiency impaired the normal cellular distribution of cholesterol and phosphatidylserine48. Whether ATP8B1 could play a similar role in coronavirus replication remains to be determined.
Among the best antivirals we identified through our CRISPRa screens, the well-known antimicrobial defenses, membrane-associated Mucins played a broad and potent role at limiting coronavirus entry. Interestingly, these Mucins were upregulated in COVID-19 patients33. In the context of influenza A virus infection28,42, Mucins were proposed to trap viruses before they can access to their receptors, which would be consistent with the effect we observed on viral entry here.
In conclusion, our study revealed a network of SARS-CoV-2 and other coronavirus regulators in model cell lines physiologically expressing ACE2 and TMPRSS2. Importantly, the main natural targets of SARS-CoV-2 in the respiratory tract co-express ACE2 and TMPRSS2, which highlight the importance of the models used here. Further characterization work on this newly identified landscape of coronavirus regulators may guide future therapeutic intervention.
Methods
Plasmids and constructs
The pLX_311-Cas9 (Addgene 96924), pRDA_174 (Addgene 136476), pXPR_BRD109 (lenti dCAS-VP64_Blast49, Addgene 61425), which express Cas9, Cas12a and dCas9-VP64, respectively, have been described24,50. LentiGuide-Puro vector was a gift from Feng Zhang51,52 (Addgene 52963), pRDA_118 is a modified version of this vector, with minor modifications to tracrRNA (Addgene 133459), we have described before LentiGuide-Puro-CTRL g1 and g253 (Addgene 139455, 139456). pXPR_502 vector for sgRNA expression for CRISPRa was also described24 (Addgene 96923). Guide RNA coding oligonucleotides were annealed and ligated into BsmBI-digested LentiGuide-Puro or pXPR_502 vectors, as described (Addgene); see Supplementary Table 2 for the sgRNA coding sequences used. pcDNA3.1_spike_del19 was a gift from Raffaele De Francesco (Addgene 155297). Our lentiviral vector expressing ACE2 (pRRL.sin.cPPT.SFFV/ACE2; Addgene 145842) has been described22.
CRISPR libraries
The human Gattinara, Brunello and C. sabaeus whole-genome KO libraries have been described24,23,20 as has the human CRISPRa library Calabrese24.
The Cas9-based KO secondary library included genes from each primary KO screen (this study and 16–21), that either scored with a mean z-score greater than 5 or less than -5, or scored in the top or bottom 25 of the screen, as well as genes that scored with a mean z-score greater than 4 or less than -4 in the Calu-3 activation screen (Supplementary Data 6). The secondary KO library (CP1658) targets 559 genes, with a total of 6084 sgRNA constructs including 500 intergenic controls and an average of 10 guides per gene. The sgRNAs were cloned into pRDA_118 (Addgene 133459).
The CRISPRa secondary library included genes that scored with a mean z-score greater than 3 or less than -3 in the primary Calu-3 activation screen, as well as manually selected hits from the primary KO screens (Supplementary Data 7). The secondary CRISPRa library (CP1663) targets 452 genes, with a total of 5001 sgRNA constructs including 500 intergenic controls and an average of 10 guides per gene. The sgRNAs were cloned into pXPR_502 (Addgene 96923).
A custom secondary Cas12a-CRISPR KO library (CP1660) was designed with a total of 2736 sgRNA constructs with 4 guides per gene (with 2 guides per gene on each construct) (Supplementary Data 6). 500 intergenic control sites targeted by 250 constructs with 2 guides per construct were also included. The sgRNAs were cloned into pRDA_052 (Addgene 136474).
Cell lines
Human Calu-3, Caco-2, HEK293T, A549, Huh7 and Huh7.5.1, simian Vero E6 and LLC-MK2, dog MDCK cells were maintained in complete Dulbecco's modified Eagle medium (DMEM) (Gibco) supplemented with 10% foetal bovine serum and penicillin/streptomycin. The following cell lines were obtained from American Type Culture Collection (ATCC): human Caco-2 (ATCC HTB-37), Calu-3 (ATCC HTB-55), HEK293T (ATCC CRL-3216), A549 (ATCC CCL-185; a gift from Wendy Barclay), simian LLC-MK2 cells (ATCC CCL7.1; a gift from Nathalie Arhel), and dog MDCK cells (ATCC CCL-34; a gift from Wendy Barclay); simian Vero E6 cells were obtained from Sigma-Aldrich (reference 85020206; a gift from Christine Chable-Bessia), Huh7 and Huh7.5.1 cells have been described54,55 (and the latter provided by Raphaël Gaudin). All cell lines were regularly screened for the absence of mycoplasma contamination using Lonza MycoAlert™ detection kit.
A549 and Huh7.5.1 cells (as well as Caco-2 cells, for the primary and secondary CRISPR screens) stably overexpressing ACE2 were generated by transduction with RRL.sin.cPPT.SFFV.WPRE containing-vectors22.
For CRISPR-Cas9-mediated gene disruption, Calu-3, Caco-2(-ACE2), A549-ACE2 and Huh7.5.1-ACE2 cells stably expressing Cas9 or dCas9-VP64 were first generated by transduction with LX_311-Cas9 or XPR_BRD109, respectively, followed by blasticidin selection. WT Cas9 activity was checked using the XPR_047 assay (a gift from David Root, Addgene 107145) and was always >80% (Additional Supplementary Figure 1a). dCas9-VP64 activity was checked using the pXPR_502 vector expressing sgRNA targeting IFITM3 and MX1 promoters (Additional Supplementary Figures 1b-c). Cells were transduced with guide RNA expressing LentiGuide-Puro or XPR_502 (as indicated) or the secondary libraries (CP1658 or CP1663, see above) and selected with antibiotics for at least 10 days.
For CRISPR-Cas12a-mediated gene disruption, Calu-3 cells stably expressing Cas12a were generated by transduction with RDA_174 and selected and then transduced with the CP1660 library and selected.
Lentiviral production and transduction
Lentiviral vector stocks were obtained by polyethylenimine (PEI) or Lipofectamine 3000 (Thermo Scientific)-mediated multiple transfections of 293T cells with vectors expressing Gag-Pol, the miniviral genome, the Env glycoprotein at a ratio of 1:1:0.5. The culture medium was changed 6h post-transfection, and vector containing supernatants harvested 36h later, filtered and used directly or stored at −80°C. Transduction was performed by cell incubation with the LV in the presence of polybrene (4 μg/mL) for a few hours. When necessary, spin infection was performed for 2h at 30°C and 1000g to improve transduction efficiencies. Antibiotics were added 24–48h post-transduction.
Whole-genome and secondary CRISPR KO screens
Vero E6, Caco-2-ACE2, Calu-3, A549-ACE2 and Huh7.5.1-ACE2 cells were transduced with LX_311-Cas9 lentiviral vector at a high MOI and selected.
For the whole-genome screens, cells were grown to at least 120 million cells (40–60 millions for the Calu-3) and transduced with lentiviral vectors coding the C. sabaeus sgRNAs20 (for Vero E6), the Brunello library24 (for Caco-2-ACE2) or the Gattinara library23 (for Calu-3), at MOI ~0.3–0.5. Transduced cells were selected and re-amplified (for 10–15 days; i.e. to at least the starting amounts) prior to SARS-CoV-2 challenge at MOI 0.005. The day of the viral challenge, 40 million cells were harvested, pelleted by centrifugation and frozen down for subsequent gDNA extraction. Massive CPEs were observed 3–5 days post SARS-CoV-2 infection and cells were kept in culture for 11–13, 18–27, and 30–34 days in total prior to harvest and gDNA extraction, for Vero E6, Caco-2-ACE2 and Calu-3, respectively. The primary screens were performed in biological replicates (i.e. with independently generated KO cell populations), as follow: the screens in Vero E6 cells were performed in biological duplicates, the first of which was then further divided into three technical replicates (i.e. independent screens performed with the same KO population); the screens in Calu-3 cells were performed in biological quadruplicates, and the screens in Caco-2 cells in biological duplicates.
For the secondary CRISPR KO screens, 120 million Cas12a-expressing Calu-3 cells or 120 million Cas9-expressing Calu-3, Caco-2-ACE2, A549-ACE2 and Huh7.5.1-ACE2 were transduced with our CRISPR KO secondary library (CP1658 for Cas9, and CP1660 for Cas12a) at a low MOI as above. 10–15 days later, 40 million cells were either challenged with SARS-CoV-2 (MOI 0.005) or harvested and frozen down for subsequent gDNA extraction. CPEs were observed 3–5 days post SARS-CoV-2 infection and cells were kept in culture for 8–11 days or 13–15 days for Cas9 and Cas12a-based screens, respectively, prior to gDNA extraction. Each secondary screen was performed in independent biological duplicates, with the exception of the Cas12a screen for which one replicate couldn’t be analyzed due to poor sequencing quality.
Whole-genome and secondary CRISPRa screens
Calu-3, Caco-2-ACE2, A549-ACE2 and Huh7.5.1 cells were transduced with dCas9-VP64 (pXPR_BRD109)-expressing lentiviral vectors at a high MOI and selected.
For the whole-genome CRISPRa screens, 120 million Calu-3-dCas9-VP64 cells were transduced with the Calabrese library24 in two biological replicates (for sublibrary A) or in one replicate (for sublibrary B) at a low MOI (~0.3–0.5). 2.5 weeks later, 40 million cells were either challenged with SARS-CoV-2 (MOI 0.005) or harvested and frozen down for subsequent gDNA extraction. CPEs were observed 3–5 days post SARS-CoV-2 infection and cells were kept in culture for 11–17 days prior to gDNA extraction.
For the secondary CRISPRa screens, 120 million dCas9-VP64-expressing Calu-3, Caco-2-ACE2, A549-ACE2 and Huh7.5.1-ACE2 were transduced with our CRISPRa secondary library (CP1658) and the screens were performed in the same conditions as above, with CPEs 3–5 days post-infection and cells kept in culture for 10–13 days prior to gDNA extraction. Each secondary screen was performed in independent biological duplicates.
Genomic DNA preparation and sequencing
Genomic DNA (gDNA) was isolated using the QIAamp DNA Blood Maxi kit (Qiagen) or the NucleoSpin Blood XL kit (Macherey-Nagel), as per the manufacturer’s instructions. Isolated gDNAs were cleaned up using the OneStep™ PCR Inhibitor Removal Kit (Zymo Research, D6030). PCR products were amplified using Titanium Taq polymerase (Takara) and purified using Agencourt AMPure XP SPRI beads (Beckman Coulter, A63880). Samples were sequenced on a HiSeq2500 HighOutput (Illumina) with a 5% spike-in of PhiX (Supplementary Note 4).
Screen analysis
For each published screen, corresponding authors provided raw read counts. For the screens conducted in this paper, guide-level read counts were retrieved from sequencing data. We log-normalized read counts using the following formula:
When applicable, we averaged lognorm values across conditions (Poirier, Daelemans, Sanjana). We calculated log-fold changes for each condition relative to pDNA lognorm values. If pDNA reads were not provided for the given screen, pDNA reads from a different screen that used the same library were used (Puschnik analysis used Sanjana pDNA; Zhang analysis used Poirier pDNA). For each condition in each dataset, we fit a natural cubic spline between the control and infected conditions (Wei et al. 2021). The degrees of freedom for each spline were fit using 10-fold cross-validation. We calculated residuals from this spline and z-scored these values at the guide-level, assuming a normal distribution; p-values were calculated based on a two-tailed hypothesis test (anchors package, https://github.com/gpp-rnd/anchors). False discovery rate (FDR) values were calculated using the Benjamini-Hochberg method. Genes were filtered by number of guides per gene, which was generally one guide fewer or greater than the median number of genes per gene for that library (e.g. for Brunello screens, which has a median of 4 guides per gene, we applied a filter of 3 to 5 guides per gene). This guide-filtering step accounts for any missing values in the file compiling data across all screens (Supplementary Data 2 and 6-7), We calculated gene-level z-scores by averaging across guides and conditions, and p-values were combined across conditions using Fisher’s method. We then used these filtered gene-level z-scores to rank the genes such that the gene ranked 1 corresponded to the top pro-viral hit. The files containing the read counts and gene-level residual z-scores for each screen have been deposited on Gene Expression Omnibus (GEO) (primary screens: GSE175666; Supplementary Data 1-5) (secondary screens: GSE193834; Supplementary Data 6-16). All correlations were calculated using the Python package scipy.
Cumulative distribution plots were generated as explained in Supplementary Note 5.
Wild-type and reporter SARS-CoV-2 production and infection
Wild-type BetaCoV/France/IDF0372/2020 was supplied by Pr. Sylvie van der Werf and the National Reference Centre for Respiratory Viruses (Institut Pasteur, Paris, France). The patient sample from which this virus was isolated was provided by Dr. X. Lescure and Pr. Y. Yazdanpanah from Bichat Hospital, Paris, France. The mNeonGreen (mNG)30 and Nanoluciferase (NLuc)56 reporter SARS-CoV-2 were based on 2019-nCoV/USA_WA1/2020 isolated from the first reported case in the USA, and provided through World Reference Center for Emerging Viruses and Arboviruses (WRCEVA), and UTMB investigator, Dr. Pei Yong Shi.
WT, mNG and NLuc SARS-CoV-2 were amplified in Vero E6 cells (MOI 0.005) in serum-free media; supernatants were harvested at 48h-72h post infection when cytopathic effects were observed, cleared by centrifugation, and aliquots frozen down at −80°C. Viral supernatants were titrated by plaque assays in Vero E6 cells. Typical titers were 3.106-3.107 plaque forming units (PFU)/ml. Genome sequences of our viral stocks were verified through deep sequencing (Eurofins).
Simian and human cell infections were performed at the indicated multiplicity of infection (MOI; calculated from titers in Vero E6 cells) in serum-free DMEM and 5% serum-containing DMEM, respectively. The viral input was left for the duration of the experiment, unless specified otherwise. Viral supernatants were frozen down at −80°C prior to titration by plaque assays on Vero E6 cells. Cells were trypsinized and percentage of cells expressing mNG scored by flow cytometry (NovoCyte™, ACEA Biosciences Inc.) after fixation in PBS1X-2% paraformaldehyde (PFA), or cells were lysed in Passive Lysis buffer and NLuc activity measured using an Envision plate reader (Perkin-Elmer), or lysed in RLT buffer (Qiagen) followed by RNA extraction and RT-qPCR analysis, at the indicated time post-infection.
Seasonal coronavirus production and infection
HCoV-229E-Renilla was a gift from Volker Thiel57 and amplified for 5–7 days at 33°C in Huh7.5.1 cells, in 5% FCS-containing DMEM. HCoV-NL63 NR-470 was obtained through BEI Resources (NIAID, NIH) and amplified for 5–7 days at 33°C in LLC-MK2 simian cells, in 2% FCS-containing DMEM. Viral stocks were harvested when cells showed >50% CPEs. Viruses were titrated through TCID50 and typical titers were 1,8.109 TCID50/mL and 106 TCID50/mL for HCoV-229E-Renilla and HCoV-NL63, respectively. Infections of Calu-3 were performed at MOI 300 for HCoV-229E-Renilla (as measured on Huh7.5.1 cells) and MOI 0.1 for HCoV-NL63 (as measured on LLC-MK2 cells) and infection efficiency was analyzed 2–3 days later by measuring Renilla activity (HCoV-229E-Renilla) or 5 days later by RT-qPCR (HCoV-NL63).
MERS-CoV production and infection
HEK293T cells were transfected with a bacmid containing a full-length cDNA clone of MERS-CoV (a king gift from Dr Luis Enjuanes58) and overlaid 6h later with Huh7 cells. After lysis of Huh7 cells, cell supernatants were collected and the virus was further amplified on Huh7 cells. Viral stocks were aliquoted, frozen down, and titrated by the TCID50 method.
Calu-3 cells, seeded on glass coverslips (immunofluorescence) or in 48 well plates (infectivity titrations), were inoculated with MERS-CoV at an MOI of 0.3. Sixteen hours after inoculation, supernatants were collected and stored at −80°C. Coverslips were fixed with 3% PFA, permeabilized (0.4% Triton X-100) and blocked with 5% goat serum (GS) in PBS1X. Cells were labelled with a mixture of J2 antibody (Scicons; 1:400) and an anti-Spike antibody (Sino Biological Inc; 1:500), and then incubated with Alexa-488-conjugated donkey anti-mouse IgG and Alexa594-conjugated goat anti-rabbit IgG secondary antibodies (Jackson Immunoresearch; 1:400) in 5% GS in PBS supplemented with 1 μg/ml DAPI (4′,6-diamidino-2-phenylindole). Coverslips were mounted on microscope slides in Mowiol 4–88-containing medium. Images were acquired on an Evos M5000 imaging system (Thermo Fisher Scientific) with a 10x objective. For infectivity titrations, Huh7 cells, seeded in 96 well plates, were incubated with 100 μl of 1/10 serially diluted supernatants for 5 days at 37°C. Then, the 50% tissue culture infectious dose (TCID50) was determined by assessing CPEs in each well by light microscopy and the 50% endpoint was calculated according to the method of Reed and Muench59.
IAV-NLuc production and infection
A/Victoria/3/75 virus carrying a NanoLuciferase reporter gene generation and production have been described53. Viruses were amplified on MDCK cells cultured in serum-free DMEM containing 0.5 μg/mL L-1-p-Tosylamino-2-phenylethyl chloromethyl ketone (TPCK)-treated trypsin (Sigma-Aldrich). Stocks were titrated by plaque assays on MDCK cells (typical titers were 107 PFU/ml). IAV-NLuc challenges were performed in 96-well plates, in serum-free DMEM for 1h and the medium was subsequently replaced with DMEM containing 10% foetal bovine serum. Cells were lysed 10h later and NLuc activity was measured with the Nano-Glo assay system (Promega) and an Infinite 200 PRO plate reader (Tecan).
SARS-CoV-2 internalization assay
Calu-3 cells were incubated with SARS-CoV-2 at an MOI of 5 for 2h at 37°C, washed twice with PBS and then treated with Subtilisin A (400 μg/mL) in Subtilisin A buffer [10 mM Tris/HCl (pH 8.0), 150 mM NaCl, 5 mM CaCl2] in order to get rid of the cell surface-bound viruses, prior to washes, lysis, RNA extraction (RNeasy kit, Qiagen) and RdRp RT-qPCR to measure the relative amounts of internalized viruses.
Spike pseudotype production
293T cells were seeded in plates pre-coated with poly-Lysine (Sigma-Aldrich) and transfected with 5 μg of an expression plasmid coding either VSV-G (pMD.G) or SARS-CoV-2 Spike del19 (pcDNA3.1_spike_del19) using Lipofectamine 2000 (ThermoFisher Scientific). The culture medium was replaced after 6h. Cells were infected 24h post-transfection with VSVΔG-GFP-Firefly Luciferase (a gift from Gert Zimmer34) at a MOI of 5 for 1h at 37°C and washed 3 times with PBS. The medium was replaced with 5% FCS-supplemented DMEM containing 1 μg/mL of an anti-VSV-G antibody (CliniSciences, clone 8G5F11) to neutralize residual viral input60. Supernatants were harvested 24h later, spun at 1000g for 10 min and stored at −80°C.
RNA quantification
RNA was extracted using the RNeasy kit (Qiagen) employing on-column DNase treatment, according to the manufacturer’s instructions, reverse-transcribed and subjected to qPCR. All sequences and references of primers and probes are described in Supplementary Table 2. Triplicate reactions were run using a ViiA7 Real Time PCR system (ThermoFisher Scientific). pRdRp22 and pNL63 (which contains a fragment amplified from NL63-infected cell RNAs using primers NL63_F2 and NL63_R2 and cloned into pPCR-Blunt II-TOPO) were diluted in 20 ng/ml salmon sperm DNA to generate a standard curve, to calculate relative cDNA copy numbers and confirm the assay linearity (detection limit: 10 molecules per reaction).
ACE2 staining using Spike RBD-mFc recombinant protein and flow cytometry analysis
The SARS-CoV-2 Spike RBD sequence was obtained from RNA extracted from a patient sample collected in Montpellier University hospital and a gift from Vincent Foulongne63 (GenBank accession number MT787505.1). The predicted N-terminal signal peptide of Spike (amino acid 1–14) was fused to the RBD sequence (amino acid 319–541), C-terminally tagged with a mouse IgG1 Fc fragment (mFc) and cloned into pCSI vector64. The pCSI-SpikeRBD expression vector was transfected in HEK293T cells using the PEIpro® transfection reagent. Cells were washed 6h post transfection and grown for an additional 72–96h in serum-free Optipro medium (Invitrogen) supplemented with glutamine and non-essential amino acids. Supernatant was harvested, filtered and concentrated 100-fold on 10 kDA cut-off Amicon Ultra-15 concentrators. Samples were aliquoted and stored at −20°C until further use. The Spike RBD-mFc validation is presented in Additional Supplementary Figure 2.
For ACE2 labelling, cells were harvested using PBS-5mM EDTA, incubated 20 min at 37°C in FACS buffer (PBS1X-2% BSA) containing a 1:20 dilution of Spike RBD-mFc followed by secondary anti-mouse Alexa-488 incubation (ThermoFisher scientific; 1:1000 dilution) and several washes in FACS buffer. Flow cytometry was performed using the NovoCyte™ (ACEA Biosciences Inc.) and the analysis using FlowJo software.
Immunoblot analysis
Cells were lysed in lysis buffer [10 mM TRIS 1M pH7.6, NaCl 150 mM, Triton X100 1%, EDTA 1 mM, deoxycholate 0,1%] supplemented with sample buffer [50 mM Tris-HCl pH 6.8, 2% SDS, 5% glycerol, 100 mM DTT, 0.02% bromophenol blue], resolved by SDS-PAGE and analyzed by immunoblotting using primary antibodies against ACE2 (ProteinTech 21115–1-P; diluted 1:1000), AP1G1 (Bethyl Laboratories A304–771A; 1:1000), AP1B1 (Proteintech 16932–1-AP; 1:500), AAGAB (Bethyl Laboratories A305–593A; 1:1000), or Actin (Sigma-Aldrich A1978; 1:5000), followed by HRP-conjugated anti-rabbit or anti-mouse immunoglobulin antibodies (ThermoFisher Scientific; 1:2500), or using an anti-GAPDH antibody conjugated to HRP (Sigma-Aldrich G9295; 1:5000), and chemiluminescence Clarity or Clarity Max substrate (Bio-Rad). A Bio-Rad ChemiDoc imager was used. Unprocessed immunoblot images are available as Source Data.
TPCK-treated trypsin priming of Spike
Cells were treated or not with Camostat mesylate (Sigma-Aldrich) at a concentration of 100 μM at 37°C for 1h, placed on ice and incubated with wild-type SARS-CoV-2 (MOI 1.25), SARS-CoV-2 mNG reporter (MOI 0.01) or VSV pseudoparticles (MOI 0.1) for 30 min on ice. Cells were extensively washed with PBS1X to remove the unbound viruses (the “inputs” were collected then by lysis in RLT buffer) prior to TPCK-treated trypsin (Sigma-Aldrich) treatment, as follow.
For single-round infections (i.e. with wild-type SARS-CoV-2 and VSV pseudoparticles), exogenous priming of Spike was achieved by incubation with TPCK-treated trypsin at 100 μg/mL in serum-free DMEM at 37°C for 10 min. Cells were washed with 5% FCS-DMEM to neutralize the trypsin and cultured in 5% FCS-DMEM in the presence of 100 μM Camostat or not. For wild-type SARS-CoV-2 infections, cells were lysed in RLT buffer at 7 h post-infection, RNAs extracted (RNeasy kit, Qiagen) and SARS-CoV-2 RdRp RNAs measured by RT-qPCR. For VSV pseudoparticle infections, cells were lysed 30h post-infection in Passive Lysis buffer and Firefly luciferase activity was measured with the luciferase assay system (Promega) and the Infinite 200 PRO plate reader (Tecan).
For multiple-round SARS-CoV-2 mNG experiments, exogenous priming of Spike was achieved with the continuous presence of TPCK-treated trypsin (at 5 μg/mL) in serum-free medium, throughout the experiment. Cells were trypsinized 24h or 48h post-infection (for + camostat and CTRL conditions, respectively) and the percentage of cells expressing mNG was scored by flow cytometry (NovoCyte™, ACEA Biosciences Inc.) after fixation in PBS1X-2% PFA.
Analysis of scRNAseq data
For published scRNA-seq data analysis, Seurat objects were downloaded from figshare: (https://doi.org/10.6084/m9.figshare.12436517.v2; 33). Cell identities and CRISPR hits were selected and plotted using the DotPlot function in Seurat33.
Statistical analysis and Reproducibility
Statistical analyses were performed in the Prism software or with Excel (* p<0.05, ** p<0.01, *** p<0.001, **** p<0.0001). Experiments were performed in biological replicates and the exact number of repeats is provided in the figure legends and/or in Supplementary Data 17.
Data availability
The datasets generated during and/or analyzed during the current study have been deposited with GEO (primary screen data: GSE175666; secondary screen data: GSE193834). Additional data are available from the corresponding authors on reasonable request.
Requests for material should be addressed to Caroline Goujon or John Doench at the corresponding address above, or to Addgene for the plasmids with an Addgene number.
Source data are provided with this paper.
Code availability
All code used in this study can be found on Github (https://github.com/PriyankaRoy5/SARS-CoV-2-meta-analysis) and on Zenodo65 (DOI: 10.5281/zenodo.6499838).
Extended Data
Extended Data Fig. 1. Meta-analysis of genome-wide screens.
a. Volcano plot showing the top genes conferring resistance (right, blue) and sensitivity (left, red) to SARS-CoV-2 when knocked out in Vero E6 cells for this screen (left panel) and the screen conducted by Wei et al. 2021 (Wilen20; right panel). Controls are indicated in green. The gene-level z-score and -log10(FDR) were calculated after averaging across conditions (of note, the FDR value for ACE2 is effectively zero but has been assigned a -log(FDR) value for plotting purposes). (n = 20,928 for each plot). b. Cumulative distribution plots analyzing overlap of top hits between this screen and the Wilen screen. Left panel: Putative hit genes from the Wilen screen are ranked by mean z-score, and classified as validated hits based on mean z-score in the secondary screen, using a threshold of greater than 3. Right panel: Putative hit genes from this screen are ranked by mean z-score, and classified as validated hits based on mean z-score in the Wilen screen, using a threshold of greater than 3. c. Comparison between genome-wide screens conducted in A549 cells overexpressing ACE2 by Daniloski et al. (Sanjana17) and Zhu et al. (Zhang21) using the GeCKOv2 and Brunello libraries, respectively. Pearson’s correlation coefficient r is indicated. (n = 18,484). d. Pair-wise comparison between genome-wide screens conducted in Huh7.5.1-ACE2-TMPRSS2, Huh7.5, and Huh7 cells by Wang et al. (Puschnik19), Schneider et al. (Poirier18), and Baggen et al. (Daelemans16), respectively, using the GeCKOv2 and Brunello libraries as indicated. Annotated genes include top 3 resistance hits from each screen as well as genes that scored in multiple cell lines based on the criteria used to construct the Venn diagram in Fig. 1d. Pearson’s correlation coefficient r is indicated. (n = 18,470 for each plot).
Extended Data Fig. 2. Genome-wide CRISPR KO and CRISPRa screens in Calu-3 and Caco-2 cells.
a. Volcano plot showing the top genes conferring resistance (right, blue) to SARS-CoV-2 when knocked out in Calu-3 cells. Controls are indicated in green. This screen did not have any sensitization hits. The gene-level z-score and –log10(FDR) were calculated after averaging across replicates. (n = 20,513). b. Volcano plot showing the top genes conferring resistance (right, red) and sensitivity (left, blue) to SARS-CoV-2 when overexpressed in Calu-3 cells. Controls are indicated in green. The gene-level z-score and –log10(FDR) were calculated after averaging across replicates. (n = 20,494). c. Volcano plot showing the top genes conferring resistance (right, blue) and sensitivity (left, red) to SARS-CoV-2 when knocked out in Caco-2 cells. Controls are indicated in green. The gene-level z-score and –log10(FDR) were calculated after averaging across replicates. (n = 18,804). d. Comparison between gene hits in Calu-3 KO and activation screens. Dotted lines indicated mean z-scores of -3 and 2.5 or 3 for each screen. Proviral and antiviral genes are indicated in blue and red, respectively. Pearson’s correlation coefficient r is indicated. (n = 18,173).
Extended Data Fig. 3. Secondary screens in A549-ACE2, Huh7.5.1-ACE2, Caco-2-ACE2 and Calu-3 cells.
a-d. Scatter plots showing gene-level z-scores for each secondary activation screen with top resistance and sensitization hits annotated (A549-ACE2, Huh7.5.1-ACE2, Caco-2-ACE2 and Calu-3, respectively). Pearson’s correlation coefficient, r, is labeled (n = 677, each). e-h. Scatter plots showing gene-level z-scores for each secondary activation screen with top resistance and sensitization hits annotated (A549-ACE2, Huh7.5.1-ACE2, Caco-2-ACE2 and Calu-3, respectively). Pearson’s correlation coefficient, r, is labeled (n = 820, each). i-l. Scatter plots showing mean z-scores comparing each secondary activation screen to each secondary KO screen for each cell line with top resistance and sensitization hits annotated (A549-ACE2, Huh7.5.1-ACE2, Caco-2-ACE2 and Calu-3). Pearson’s correlation coefficient, r, is labeled (n = 179, each).
Extended Data Fig. 4. Secondary KO screen in Calu-3-Cas12a cells and comparison with Cas9-based screens.
a. Scatter plot showing the gene-level z-scores of genes when knocked out using Cas12a in Calu-3 cells. The top genes conferring resistance to SARS-CoV-2 are annotated and shown in blue. The top genes conferring sensitivity to SARS-CoV-2 are annotated and shown in red. (n = 684). Only one replicate is shown as the second replicate had low sequencing quality. b. Scatter plots showing mean z-scores comparing each Cas9 to Cas12a secondary KO screens for Calu-3 cells with top resistance and sensitization hits annotated. Pearson correlation, r, labeled (n = 600 each).
Extended Data Fig. 5. Proviral gene candidate validation in Calu-3 cells.
a. Gating strategy for flow cytometry analysis. Pseudocolored dot-plots of sorted Calu-3 cells, showing gates used for the analysis in Fig. 3a (and all figures using flow cytometry analysis). b. Impact of additional candidate gene KO (panel complementary to Fig. 4a). Calu-3-Cas9 cells were stably transduced to express 2 different sgRNAs (g1, g2) per indicated gene and selected. Cells were infected with SARS-CoV-2 bearing the mNeonGreen (mNG) reporter and the infection efficiency was scored 48 h later by flow cytometry. The cell line/screen in which the candidates were identified is indicated below the graph; data from 2 independent experiments are shown. c. AP1G1, AP1B1, and AAGAB depletion efficiency in Calu-3 KO cell populations. A representative immunoblot is shown out of 3 independent experiments; GAPDH serves as a loading control. d. SARS-CoV-2-induced cytopathic effects in KO cell lines. Calu-3-Cas9 cells were stably transduced to express 2 different sgRNAs (g1, g2) per indicated gene and selected. Cells were infected by SARS-CoV-2 at MOI 0.005 and ~5 days later stained with crystal violet. Representative images out of 2 independent experiments are shown.
Extended Data Fig. 6. Proviral gene candidate validation in other cell lines.
a. Caco-2-Cas9 cells expressing 2 sgRNAs (g1, g2) per indicated gene were infected with SARS-CoV-2 mNG reporter. Infection efficiency scored 48 h later by flow cytometry (left panel). In parallel, supernatants were collected and virus production determined by plaque assays (right panel). Mean and s.e.m. of 3 (left) and mean of 2 (right) independent experiments are shown, respectively. b. Similar to a, with A549-ACE2 cells. Mean and s.e.m. of 5 (left) and mean of 2 (right) independent experiments. c. Similar to a, with Huh7.5.1-ACE2 cells. Mean and s.e.m. of 4 independent experiments (left) or a representative experiment (with technical duplicates) is shown (right). a-c. One-way ANOVA with Dunnett’s test (* p < 0.05, ** p < 0.01, *** p < 0.001, **** p < 0.0001). Of note, ACE2 g1 targets an intron-exon junction on ACE2 endogenous sequence and cannot target ACE2 ectopic CDS in ACE2-transduced cells. d-f. Expression levels of AP1G1, AP1B1 and AAGAB in Caco-2 (d), A549-ACE2 (e) and Huh7.5.1-ACE2 (f) KO cells were analyzed by immunoblot, Actin served as a loading control. A representative immunoblot is shown (from 3 independent experiments). g. RNA samples from 9 (HAE from different donors22), 8 (Calu-3), or 3 (Caco-2, A549-ACE2) independent experiments were analyzed by RT-qPCR. Statistical significance was determined by unadjusted, two-sided Mann-Whitney test (**** p < 0.0001). h. Candidate gene expression levels in cell types from the respiratory epithelium (from Chua et al.33). Expression levels in COVID-19 versus healthy patients are color coded; the percentage of cells expressing the respective gene is size coded, as indicated. i. Cells were pretreated for 1 h with camostat mesylate or not, incubated with SARS-CoV-2 mNG on ice and washed. The media was replaced with serum-free media containing trypsin in order to prime Spike, or no trypsin. Infection efficiency was analyzed by flow cytometry after 24 h (for the + camostat conditions) or after 48 h (for CTRL). Statistical significance was determined by two-sided t-tests with no adjustment for multiple comparisons (* p < 0.05, ** p < 0.01, *** p < 0.001, **** p < 0.0001). The exact n and p-values (a, b, c, g, i) are indicated in Supplementary Data 17.
Extended Data Fig. 7. Antiviral gene expression levels.
a. Dot plot depicting the expression levels of the best validated antiviral genes in the different cell types from the respiratory epithelium, from Chua et al. data set33. Expression levels in COVID-19 versus healthy patients are color coded; the percentage of cells expressing the respective gene is size coded, as indicated. b. Relative expression levels of a selection of antiviral factors in primary human airway epithelial cells (HAE) compared to Calu-3 cells. RNA samples from 9 and 8 independent experiments for HAE and Calu-3, respectively (described in22, as in Extended Data Fig. 6g), were analyzed by RT-qPCR using the indicated taqmans (samples were normalized with ActinB and GAPDH). Statistical significance was determined by unadjusted, two-sided Mann-Whitney test (**** p < 0.0001). The exact n and p-values (b) are indicated in Supplementary Data 17. c. Relative expression levels of the antiviral hits in CRISPRa Calu-3 cells. RNA samples from 3 independent experiments (corresponding to Fig. 6) were analyzed by RT-qPCR using the indicated taqmans (samples were normalized with ActinB and GAPDH); relative expression levels compared to CTRL g1 populations are shown. d-e. Impact of SARS-CoV-2 infection and interferon treatment on antiviral factor expression in Calu-3 cells (d) and primary HAE (e), as indicated, in samples from ≥ 2 independent experiments from our previous study22.
Extended Data Fig. 8. Impact of the identified antiviral genes on SARS-CoV-2 in Caco-2 and A549-ACE2 cells.
Caco-2-dCas9-VP64 (a) and A549-ACE2-dCas9-VP64 (b) cells were stably transduced to express 2 different sgRNAs (g1, g2) per indicated gene promoter, or negative controls (CTRL) and selected prior to SARS-CoV-2 mNG infection. The percentage of infected cells was scored 48 h later by flow cytometry. The mean of relative infection efficiencies are shown for 2 independent experiments. The red and dark red dashed lines represent 50% and 80% inhibition, respectively.
Extended Data Fig. 9. Characterization of proviral genes identified by CRISPRa.
a-b. ACE2 expression in CRISPRa cell lines. Calu-3-Cas9 cells were stably transduced to express 2 different sgRNAs (g1, g2) per indicated gene and selected (parallel samples from Fig. 8). a. The cells were lysed and expression levels of ACE2 were analyzed, Actin served as a loading control A representative immunoblot (out of 2 independent experiments) is shown. b. ACE2 surface staining using Spike-RBD-mFc. Mean and SEM of 3 independent experiments. Statistical significance was determined by a two-sided t-test (* p < 0.05, ** p < 0.01, *** p < 0.001, **** p < 0.0001). c. Dot plot depicting the expression levels of the best validated proviral genes in the different cell types from the respiratory epithelium, from Chua et al. data set33. Expression levels in COVID-19 versus healthy patients are color coded; the percentage of cells expressing the respective gene is size coded, as indicated.
Extended Data Fig. 10. Bidirectional screen data comparison between this study and Hsu et al’s.
a. Comparison between this Calu-3 KO screen to the Calu-3 KO screen conducted by Hsu and colleagues45. Genes that scored among the top 20 resistance hits in both screens are annotated and shown in green. Pearson’s correlation coefficient r is indicated. b. Comparison between this Calu-3 activation screen to the Calu-3 activation screen conducted by Hsu and colleagues45. Genes that scored among the top 20 resistance hits and sensitization hits in both screens are annotated and shown in green. Pearson’s correlation coefficient r is indicated.
Supplementary Material
Acknowledgements
We are thankful to Sylvie Van der Werf from the French National Reference Centre for Respiratory Viruses (Pasteur Institute, Paris, France) for providing us with SARS-CoV-2 BetaCoV/France/IDF0372/2020 (isolated by Dr. X. Lescure and Pr. Y. Yazdanpanah, Bichat hospital), to the World Reference Center for Emerging Viruses and Arboviruses (WRCEVA) and UTMB investigator, Dr. Pei Yong Shi, for the mNeon Green and NanoLuc reporter SARS-CoV-2; to Volker Thiel for Renilla reporter HCoV-229E; to BEI Resources, NIAID, NIH for providing us with HCoV-NL63. We wish to thank Raphaël Gaudin, Lise Chauveau, Lucile Espert, Véronique Hebmann, Christine Chable-Bessia, Bruno Beaumelle, Nathalie Arhel, Marc Sitbon, Vincent Foulongne, Chen-Yong Lin, Gert Zimmer, and Raffaele De Francesco for the generous provision of reagents, and we are thankful to María Moriel-Carretero, Pierre-Yves Lozach and Laura Picas for helpful discussions. We are grateful to Christine Chable-Bessia and all CEMIPAI BSL-3 facility members for setting up excellent working conditions for SARS-CoV-2 handling.
This work was supported by the French National Research Agency ANR under the ANR-RA COVID program (ANR-20-COV6–0001, CRISPR-TARGET-CoV, to C.G.), an European Research Council (ERC) Starting Grant under the European Union's Horizon 2020 research and innovation programme (grant agreement 759226, ANTIViR, to C.G.), the Institut National de la Santé et de la Recherche Médicale (INSERM) (to C.G. & M.W.), the ‘Fondation CNRS’ (to C.G. and O.M.), institutional funds from the Centre National de la Recherche Scientifique (CNRS), Institut des Sciences Biologiques du CNRS (INSB) and Montpellier University (to C.G. and O.M.), 3-year PhD studentships from the Ministry of Higher Education and Research (to A.R., B.B., and J.M.), a 4th year PhD funding from the Fondation pour la Recherche Médicale (to B.B. and J.M.), NIAID R21AI157835 (to J.G.D.), the COVID program from CNRS (to L.D.). We acknowledge the imaging facility MRI, member of the national infrastructure France-BioImaging supported by the French National Research Agency (ANR-10-INBS-04) and the CEMIPAI BSL-3 facility.
Footnotes
Competing interests
J.G.D. consults for Agios, Microsoft Research, Phenomic AI, BioNTech, and Pfizer; J.G.D consults for and has equity in Tango Therapeutics. J.G.D.’s interests were reviewed and are managed by the Broad Institute in accordance with its conflict-of-interest policies. The other authors declare no competing interests.
References
- 1.Drosten C et al. Identification of a Novel Coronavirus in Patients with Severe Acute Respiratory Syndrome. N Engl J Med 348, 1967–1976 (2003). [DOI] [PubMed] [Google Scholar]
- 2.Peiris J et al. Coronavirus as a possible cause of severe acute respiratory syndrome. The Lancet 361, 1319–1325 (2003). [DOI] [PMC free article] [PubMed] [Google Scholar]
- 3.Zhong N et al. Epidemiology and cause of severe acute respiratory syndrome (SARS) in Guangdong, People’s Republic of China, in February, 2003. The Lancet 362, 1353–1358 (2003). [DOI] [PMC free article] [PubMed] [Google Scholar]
- 4.Zaki AM, van Boheemen S, Bestebroer TM, Osterhaus ADME & Fouchier RAM Isolation of a Novel Coronavirus from a Man with Pneumonia in Saudi Arabia. N Engl J Med 367, 1814–1820 (2012). [DOI] [PubMed] [Google Scholar]
- 5.van der Hoek L Human coronaviruses: what do they cause? Antivir. Ther. (Lond.) 12, 651–658 (2007). [PubMed] [Google Scholar]
- 6.Hoffmann M et al. SARS-CoV-2 Cell Entry Depends on ACE2 and TMPRSS2 and Is Blocked by a Clinically Proven Protease Inhibitor. Cell 181, 271–280.e8 (2020). [DOI] [PMC free article] [PubMed] [Google Scholar]
- 7.Hofmann H et al. Human coronavirus NL63 employs the severe acute respiratory syndrome coronavirus receptor for cellular entry. Proc Natl Acad Sci U S A 102, 7988–7993 (2005). [DOI] [PMC free article] [PubMed] [Google Scholar]
- 8.Li W et al. Angiotensin-converting enzyme 2 is a functional receptor for the SARS coronavirus. Nature 426, 450–454 (2003). [DOI] [PMC free article] [PubMed] [Google Scholar]
- 9.Wu K, Li W, Peng G & Li F Crystal structure of NL63 respiratory coronavirus receptor-binding domain complexed with its human receptor. Proc Natl Acad Sci U S A 106, 19970–19974 (2009). [DOI] [PMC free article] [PubMed] [Google Scholar]
- 10.Zhou P et al. A pneumonia outbreak associated with a new coronavirus of probable bat origin. Nature 579, 270–273 (2020). [DOI] [PMC free article] [PubMed] [Google Scholar]
- 11.Matsuyama S et al. Efficient activation of the severe acute respiratory syndrome coronavirus spike protein by the transmembrane protease TMPRSS2. J. Virol 84, 12658–12664 (2010). [DOI] [PMC free article] [PubMed] [Google Scholar]
- 12.Huang I-C et al. SARS coronavirus, but not human coronavirus NL63, utilizes cathepsin L to infect ACE2-expressing cells. J. Biol. Chem 281, 3198–3203 (2006). [DOI] [PMC free article] [PubMed] [Google Scholar]
- 13.Ou X et al. Characterization of spike glycoprotein of SARS-CoV-2 on virus entry and its immune cross-reactivity with SARS-CoV. Nat Commun 11, 1620 (2020). [DOI] [PMC free article] [PubMed] [Google Scholar]
- 14.Simmons G et al. Inhibitors of cathepsin L prevent severe acute respiratory syndrome coronavirus entry. Proc. Natl. Acad. Sci. U.S.A 102, 11876–11881 (2005). [DOI] [PMC free article] [PubMed] [Google Scholar]
- 15.Koch J et al. TMPRSS2 expression dictates the entry route used by SARS-CoV-2 to infect host cells. EMBO J 40, e107821 (2021). [DOI] [PMC free article] [PubMed] [Google Scholar]
- 16.Baggen J et al. Genome-wide CRISPR screening identifies TMEM106B as a proviral host factor for SARS-CoV-2. Nat Genet (2021) doi: 10.1038/s41588-021-00805-2. [DOI] [PubMed] [Google Scholar]
- 17.Daniloski Z et al. Identification of Required Host Factors for SARS-CoV-2 Infection in Human Cells. Cell 184, 92–105.e16 (2021). [DOI] [PMC free article] [PubMed] [Google Scholar]
- 18.Schneider WM et al. Genome-Scale Identification of SARS-CoV-2 and Pan-coronavirus Host Factor Networks. Cell 184, 120–132.e14 (2021). [DOI] [PMC free article] [PubMed] [Google Scholar]
- 19.Wang R et al. Genetic Screens Identify Host Factors for SARS-CoV-2 and Common Cold Coronaviruses. Cell 184, 106–119.e14 (2021). [DOI] [PMC free article] [PubMed] [Google Scholar]
- 20.Wei J et al. Genome-wide CRISPR Screens Reveal Host Factors Critical for SARS-CoV-2 Infection. Cell 184, 76–91.e13 (2021). [DOI] [PMC free article] [PubMed] [Google Scholar]
- 21.Zhu Y et al. A genome-wide CRISPR screen identifies host factors that regulate SARS-CoV-2 entry. Nat Commun 12, 961 (2021). [DOI] [PMC free article] [PubMed] [Google Scholar]
- 22.Rebendenne A et al. SARS-CoV-2 triggers an MDA-5-dependent interferon response which is unable to control replication in lung epithelial cells. J Virol (2021) doi: 10.1128/JVI.02415-20. [DOI] [PMC free article] [PubMed] [Google Scholar]
- 23.DeWeirdt PC et al. Genetic screens in isogenic mammalian cell lines without single cell cloning. Nat Commun 11, 752 (2020). [DOI] [PMC free article] [PubMed] [Google Scholar]
- 24.Sanson KR et al. Optimized libraries for CRISPR-Cas9 genetic screens with multiple modalities. Nat Commun 9, 5416 (2018). [DOI] [PMC free article] [PubMed] [Google Scholar]
- 25.Camargo SMR, Vuille-Dit-Bille RN, Meier CF & Verrey F ACE2 and gut amino acid transport. Clin Sci (Lond) 134, 2823–2833 (2020). [DOI] [PubMed] [Google Scholar]
- 26.Pfaender S et al. LY6E impairs coronavirus fusion and confers immune control of viral disease. Nat Microbiol 5, 1330–1339 (2020). [DOI] [PMC free article] [PubMed] [Google Scholar]
- 27.Chatterjee M, van Putten JPM & Strijbis K Defensive Properties of Mucin Glycoproteins during Respiratory Infections-Relevance for SARS-CoV-2. mBio 11, (2020). [DOI] [PMC free article] [PubMed] [Google Scholar]
- 28.McAuley JL et al. The cell surface mucin MUC1 limits the severity of influenza A virus infection. Mucosal Immunology 10, 1581–1593 (2017). [DOI] [PubMed] [Google Scholar]
- 29.Plante JA et al. Mucin 4 Protects Female Mice from Coronavirus Pathogenesis. bioRxiv 2020.02.19.957118 (2020) doi: 10.1101/2020.02.19.957118. [DOI] [Google Scholar]
- 30.Xie X et al. An Infectious cDNA Clone of SARS-CoV-2. Cell Host Microbe 27, 841–848.e3 (2020). [DOI] [PMC free article] [PubMed] [Google Scholar]
- 31.Gulbranson DR et al. AAGAB Controls AP2 Adaptor Assembly in Clathrin-Mediated Endocytosis. Developmental Cell 50, 436–446.e5 (2019). [DOI] [PMC free article] [PubMed] [Google Scholar]
- 32.Wan C et al. AAGAB is an assembly chaperone regulating AP1 and AP2 clathrin adaptors. Journal of Cell Science (2021) doi: 10.1242/jcs.258587. [DOI] [PMC free article] [PubMed] [Google Scholar]
- 33.Chua RL et al. COVID-19 severity correlates with airway epithelium–immune cell interactions identified by single-cell analysis. Nature Biotechnology 38, 970–979 (2020). [DOI] [PubMed] [Google Scholar]
- 34.Rentsch MB & Zimmer G A Vesicular Stomatitis Virus Replicon-Based Bioassay for the Rapid and Sensitive Determination of Multi-Species Type I Interferon. PLoS ONE 6, (2011). [DOI] [PMC free article] [PubMed] [Google Scholar]
- 35.Schmidt F et al. Measuring SARS-CoV-2 neutralizing antibody activity using pseudotyped and chimeric viruses. J Exp Med 217, (2020). [DOI] [PMC free article] [PubMed] [Google Scholar]
- 36.Kawase M, Shirato K, van der Hoek L, Taguchi F & Matsuyama S Simultaneous treatment of human bronchial epithelial cells with serine and cysteine protease inhibitors prevents severe acute respiratory syndrome coronavirus entry. J Virol 86, 6537–6545 (2012). [DOI] [PMC free article] [PubMed] [Google Scholar]
- 37.Bertram S et al. TMPRSS2 activates the human coronavirus 229E for cathepsin-independent host cell entry and is expressed in viral target cells in the respiratory epithelium. J Virol 87, 6150–6160 (2013). [DOI] [PMC free article] [PubMed] [Google Scholar]
- 38.Gierer S et al. The spike protein of the emerging betacoronavirus EMC uses a novel coronavirus receptor for entry, can be activated by TMPRSS2, and is targeted by neutralizing antibodies. J Virol 87, 5502–5511 (2013). [DOI] [PMC free article] [PubMed] [Google Scholar]
- 39.Nakatsu F, Hase K & Ohno H The Role of the Clathrin Adaptor AP-1: Polarized Sorting and Beyond. Membranes (Basel) 4, 747–763 (2014). [DOI] [PMC free article] [PubMed] [Google Scholar]
- 40.Saccon E et al. Cell-type-resolved quantitative proteomics map of interferon response against SARS-CoV-2. iScience 24, 102420 (2021). [DOI] [PMC free article] [PubMed] [Google Scholar]
- 41.Stanifer ML et al. Critical role of type III interferon in controlling SARS-CoV-2 infection, replication and spread in primary human intestinal epithelial cells. http://biorxiv.org/lookup/doi/10.1101/2020.04.24.059667 (2020) doi: 10.1101/2020.04.24.059667. [DOI] [PMC free article] [PubMed] [Google Scholar]
- 42.Dhar P & McAuley J The Role of the Cell Surface Mucin MUC1 as a Barrier to Infection and Regulator of Inflammation. Front Cell Infect Microbiol 9, 117 (2019). [DOI] [PMC free article] [PubMed] [Google Scholar]
- 43.Linden SK, Sutton P, Karlsson NG, Korolik V & McGuckin MA Mucins in the mucosal barrier to infection. Mucosal Immunology 1, 183–197 (2008). [DOI] [PMC free article] [PubMed] [Google Scholar]
- 44.Ben-David U et al. Genetic and transcriptional evolution alters cancer cell line drug response. Nature 560, 325–330 (2018). [DOI] [PMC free article] [PubMed] [Google Scholar]
- 45.Biering SB et al. Genome-wide, bidirectional CRISPR screens identify mucins as critical host factors modulating SARS-CoV-2 infection. bioRxiv 2021.04.22.440848 (2021) doi: 10.1101/2021.04.22.440848. [DOI] [PMC free article] [PubMed] [Google Scholar]
- 46.Paulusma CC & Oude Elferink RPJ The type 4 subfamily of P-type ATPases, putative aminophospholipid translocases with a role in human disease. Biochimica et Biophysica Acta (BBA) - Molecular Basis of Disease 1741, 11–24 (2005). [DOI] [PubMed] [Google Scholar]
- 47.Stukalov A et al. Multilevel proteomics reveals host perturbations by SARS-CoV-2 and SARS-CoV. Nature 1–7 (2021) doi: 10.1038/s41586-021-03493-4. [DOI] [PubMed] [Google Scholar]
- 48.Li YE et al. TMEM41B and VMP1 are scramblases and regulate the distribution of cholesterol and phosphatidylserine. J Cell Biol 220, (2021). [DOI] [PMC free article] [PubMed] [Google Scholar]
Methods-only references
- 49.Konermann S et al. Genome-scale transcriptional activation by an engineered CRISPR-Cas9 complex. Nature 517, 583–588 (2015). [DOI] [PMC free article] [PubMed] [Google Scholar]
- 50.DeWeirdt PC et al. Optimization of AsCas12a for combinatorial genetic screens in human cells. Nat Biotechnol 39, 94–104 (2021). [DOI] [PMC free article] [PubMed] [Google Scholar]
- 51.Sanjana NE, Shalem O & Zhang F Improved vectors and genome-wide libraries for CRISPR screening. Nat Methods 11, 783–784 (2014). [DOI] [PMC free article] [PubMed] [Google Scholar]
- 52.Shalem O et al. Genome-scale CRISPR-Cas9 knockout screening in human cells. Science 343, 84–87 (2014). [DOI] [PMC free article] [PubMed] [Google Scholar]
- 53.Doyle T et al. The interferon-inducible isoform of NCOA7 inhibits endosome-mediated viral entry. Nat Microbiol 3, 1369–1376 (2018). [DOI] [PMC free article] [PubMed] [Google Scholar]
- 54.Nakabayashi H, Taketa K, Miyano K, Yamane T & Sato J Growth of human hepatoma cells lines with differentiated functions in chemically defined medium. Cancer Res 42, 3858–3863 (1982). [PubMed] [Google Scholar]
- 55.Zhong J et al. Robust hepatitis C virus infection in vitro. Proc Natl Acad Sci U S A 102, 9294–9299 (2005). [DOI] [PMC free article] [PubMed] [Google Scholar]
- 56.Xie X et al. A nanoluciferase SARS-CoV-2 for rapid neutralization testing and screening of anti-infective drugs for COVID-19. Nature Communications 11, 5214 (2020). [DOI] [PMC free article] [PubMed] [Google Scholar]
- 57.van den Worm SHE et al. Reverse genetics of SARS-related coronavirus using vaccinia virus-based recombination. PLoS One 7, e32857 (2012). [DOI] [PMC free article] [PubMed] [Google Scholar]
- 58.Almazán F et al. Engineering a Replication-Competent, Propagation-Defective Middle East Respiratory Syndrome Coronavirus as a Vaccine Candidate. mBio 4, (2013). [DOI] [PMC free article] [PubMed] [Google Scholar]
- 59.REED LJ & MUENCH H A SIMPLE METHOD OF ESTIMATING FIFTY PER CENT ENDPOINTS12. American Journal of Epidemiology 27, 493–497 (1938). [Google Scholar]
- 60.Condor Capcha JM et al. Generation of SARS-CoV-2 Spike Pseudotyped Virus for Viral Entry and Neutralization Assays: A 1-Week Protocol. Front Cardiovasc Med 7, 618651 (2020). [DOI] [PMC free article] [PubMed] [Google Scholar]
- 61.Corman VM et al. Detection of 2019 novel coronavirus (2019-nCoV) by real-time RT-PCR. Euro Surveill 25, (2020). [DOI] [PMC free article] [PubMed] [Google Scholar]
- 62.Carbajo-Lozoya J et al. Replication of human coronaviruses SARS-CoV, HCoV-NL63 and HCoV-229E is inhibited by the drug FK506. Virus Res 165, 112–117 (2012). [DOI] [PMC free article] [PubMed] [Google Scholar]
- 63.Veyrenche N et al. Diagnosis value of SARS-CoV-2 antigen/antibody combined testing using rapid diagnostic tests at hospital admission. J Med Virol 93, 3069–3076 (2021). [DOI] [PMC free article] [PubMed] [Google Scholar]
- 64.Giovannini D, Touhami J, Charnet P, Sitbon M & Battini J-L Inorganic phosphate export by the retrovirus receptor XPR1 in metazoans. Cell Rep 3, 1866–1873 (2013). [DOI] [PubMed] [Google Scholar]
- 65.Roy P PriyankaRoy5/SARS-CoV-2-meta-analysis: Bidirectional genome-wide CRISPR screens reveal host factors regulating SARS-CoV-2, MERS-CoV and seasonal HCoVs. (Zenodo, 2022). doi: 10.5281/zenodo.6499838. [DOI] [PMC free article] [PubMed] [Google Scholar]
Associated Data
This section collects any data citations, data availability statements, or supplementary materials included in this article.
Supplementary Materials
Data Availability Statement
The datasets generated during and/or analyzed during the current study have been deposited with GEO (primary screen data: GSE175666; secondary screen data: GSE193834). Additional data are available from the corresponding authors on reasonable request.
Requests for material should be addressed to Caroline Goujon or John Doench at the corresponding address above, or to Addgene for the plasmids with an Addgene number.
Source data are provided with this paper.


