

ABSTRACT
Corrosion inhibitors (CIs) are extensively employed in the oil and gas industry, yet their analysis remains a challenge. To develop a suitable liquid chromatography method for a wide array of CIs, a column screening was conducted. Nine different chromatographic conditions were tested across eight RPLC and mixed‐mode columns (Accucore C18, CORTECS Shield RP18, Acquity HSS T3, Acquity Premier HSS T3, Accucore 150‐C4, Accucore PFP, Synergi Polar RP, and Acclaim WCX‐1). Seven model mixtures representative of CIs, which included quaternary ammoniums, imidazolines, and phosphoric esters, were considered to probe the columns. Each column exhibited unique analytical performances, peak shape, and separation profiles. To find a compromise to analyze all the mixtures with one method, Derringer desirability functions were used. Shielding of residual silanols proved to be a critical factor. The trifunctional grafting of the Acquity HSS T3 columns appeared to be a promising strategy to minimize residual silanol effects. However, it was the Premier technology, which protects the column's inner walls and frits against parasitic adsorption, which delivered the best overall results. Based on the desirability study, the Acquity Premier HSS T3 column was selected and the gradient was optimized, which enabled the separation of the molecules present in the model mixtures.
Keywords: adsorption, column screening, corrosion inhibitors, Derringer desirability functions, stationary phases
1. Introduction
Corrosion represents a true challenge in the oil and gas extraction industry. The cost of corrosion has been estimated to be 35 billion dollars a year for this sector alone [1]. Corrosion inhibitors (CIs) have proven to be a cost‐effective solution for mitigating this issue [2]. The most used CIs in the oil and gas industry are film‐forming corrosion inhibitors (FFCIs). A diverse array of molecules can serve as FFCIs, including phosphoric esters [3, 4, 5, 6], quaternary ammoniums [7, 8], amidoamines and imidazolines [6, 9, 10, 11, 12, 13, 14, 15, 16, 17, 18], amides, amine salts of (poly)carboxylic acids [19], polyhydroxy and ethoxylated amines or amides [20], sulfur compounds [21], polyamino acids [22], among others. Both polymers and small molecules are documented in the literature, predominantly as surfactants [23].
In order to better understand their mechanisms and to rationalize their usage, and because a misdosage of CI could lead to irreversible corrosion of infrastructures, accurate quantification of CIs is essential. The most widely used techniques to quantify CIs in produced waters are colorimetric methods [24, 25, 26, 27, 28, 29, 30]. Cheap and relatively straightforward to implement, they allow the quantification of various molecules present in CIs. However, they lack sensitivity, even for concentrations of CIs as high as 100 ppm, and are susceptible to matrix effects [31]. In contrast, liquid chromatography coupled with mass spectrometry (LC‐MS) has proven to deliver more reliable results and has become a standard practice in laboratories for CI quantification [23, 25, 32, 33, 34, 35, 36, 37]. Yet, each LC‐MS method is typically tailored for a specific chemical family with the aim of analyzing a particular CI, which limits their versatility. To the best of our knowledge, no method has been developed for the simultaneous analysis of diverse inhibitors such as quaternary ammoniums, imidazolines, and polyethylene oxide (PEO) phosphoric esters. For industrial applications, where a single laboratory may receive samples from various production sites, each using different CIs, it is crucial to have as few methods as possible. Ideally, a single method should be capable of analyzing the broadest range of molecules found in CIs.
One of the main challenges of developing such a method resides in the choice of the chromatographic column. According to Dufour et al., reversed‐phase liquid chromatography (RPLC) and mixed‐mode liquid chromatography (MMLC) are the predominant techniques employed for the analysis of surfactants in aqueous samples in the oil and gas industry, especially in the separation of PEO homologues [38, 39]. However, a wide range of RPLC and MMLC columns are available on the market, each of them providing unique performances and selectivity [40, 41, 42, 43]. Identifying one that ensures the effective separation of different molecules remains a challenge, especially in the context of analyzing CIs. This is due to their potential for non‐specific interactions, such as those with residual silanols or adsorption on the metallic parts of the column, which add to the expected hydrophobic interactions.
To find the most suitable column, a column screening can be performed. Several studies can be found in the literature comparing 4–29 chromatographic conditions for the analysis of 4–817 different molecules, mostly metabolites, peptides, or plant extracts [44, 45, 46, 47, 48, 49, 50, 51]. These studies lead to the selection of one or several complementary chromatographic conditions that represent a suitable compromise for analyzing the given set of molecules. The selection process was based on predefined criteria, utilizing different tools such as Kinetic plots [48], principal component analysis [50, 51], hierarchical clustering [50] or the Pareto‐optimality concept [51], or scoring tools [44, 45, 46, 47, 48, 51]. One notable scoring tool is the Derringer desirability function, introduced by Derringer and Suich in 1980 [52]. It is designed to identify the most favorable compromise across multiple solutions through a multicriteria selection process and has been efficiently applied in column screening literature [46, 47, 48, 51].
The objective of the present paper is to evaluate eight different stationary phases with one or two different mobile phases for the analysis of seven model mixtures. These mixtures represent various chemical families found in CIs, and the evaluation is based on several parameters, including repeatability, analysis duration, the number of detected compounds, peak asymmetry and measured area, apparent efficiency, retention, retention range, resolution, and resolution for PEO homologues. Derringer desirability functions were employed to determine the best compromise for the analysis of CIs. Finally, the mobile phase gradient was optimized on the chosen column.
2. Materials and Methods
2.1. Chemicals and Materials
LC‐MS‐grade water, LC‐MS‐grade methanol (MeOH), and formic acid > 99% were purchased from Carlo Erba.
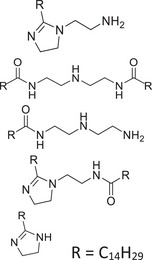
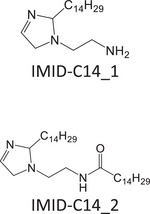
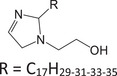
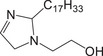
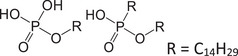
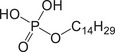
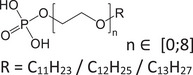
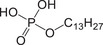
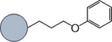
Since no standard is available for most of the molecules employed as CIs, model mixtures, comprising molecules with structures related to those found in CIs, were used for this study (Table 1). These mixtures were either provided by Rep (Gargenville, France) or synthesized by He et al. [53], and their composition is summarized in Table 1. Among them, two mixtures featured imidazolines: IMID‐C14 and IMID‐C17. The former comprises an imidazoline with a primary amine and a C14 alkyl chain. This mixture also contained all the reaction by‐products (2:1 synthesis by‐products and hydrolyzed imidazoline), similar to those found in commercial CIs. The latter imidazoline mixture was composed of an imidazoline with a hydroxyl group and a C17 alkyl chain, with up to three unsaturations. Two other mixtures contained phosphoric esters: PE‐C14 and PE‐PEO. The first one was a phosphoric ester with one or two C14 alkyl chains and the second one was a blend of PEO with a phosphoric ester end group on one side and an alkyl chain with 11–13 carbons on the other. The last two mixtures were quaternary ammonium compounds: a benzalkonium chloride mixture (BAC) featuring alkyl chains with lengths of 12, 14, or 16 carbons, and a blend containing 1‐tetradecyl‐1,4,5,6‐tetrahydropyrimidinum (THP‐C14) alongside a reaction by‐product with a second alkyl chain grafted onto the secondary amine.
TABLE 1.
Description of the mixtures and molecules included in the study.
| Mixture | Chemical family | Structures | Molecules followed in this study | CAS | pKa | Log P | Ionization polarity | m/z |
|---|---|---|---|---|---|---|---|---|
| IMID‐C14 | Imidazoline |
|
|
N/A | 5.29–9.37 | 5.09 | + |
310.3217 [M + H]+ |
| N/A | 1.26–10.25 | 10.72 | + |
534.5357 [M + H]+ |
||||
| IMID‐C17 | Imidazoline |
|
|
N/A | 10.00–15.58 | 5.95 | + |
351.3370 [M + H]+ |
| PE‐C14 | Phosphoric ester |
|
|
10054‐29‐2 | 1.81–6.83 | 5.13 | − |
293.1887 [M−H]− |
| PE‐PEO | Phosphoric ester/PEO |
|
|
56831‐62‐0 | 1.81–6.83 | 4.68 | − |
279.1731 [M−H]‐ |
| BAC | Quaternary ammonium |
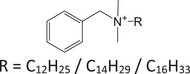
|
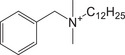
|
10328‐35‐5 | N/A | 2.63 | + |
304.2999 M+ |
| THP‐C14 | Quaternary ammonium |
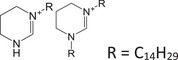
|

|
N/A | 10.63 | 5.41 | + |
281.2951 M+ |
Stock solutions of each mixture in MeOH were prepared at a concentration of 1 mg/mL. Subsequently, these solutions were diluted in water to a concentration of 1 mg/L, except for PE‐PEO, for which a solution was prepared at 10 mg/L. All solutions were then injected within 1 day after dilution of the stock solution.
2.2. Instrumentation and Conditions
2.2.1. Columns
Eight silica‐based RPLC columns were selected for this study (Table 2). As C18 columns were supposed to be of interest, four C18 columns were included. The CORTECS Shield RP18 features a carbamate group between the silica and the C18 chains, providing protection against residual silanols. The Acquity HSS T3 column has a trifunctional grafting, theoretically leading to fewer residual silanols. The Premier technology from the Acquity Premier HSS T3 column offers extra protection against adsorption, which could be useful for the analysis of CIs. In addition to these C18 columns, the Accucore 150‐C4 column was added, with a lower carbon load, potentially allowing for less retention. Other types of RPLC columns were also included to provide alternative interactions: Accucore PFP and Synergi Polar RP, featuring a pentafluorophenyl and a phenoxyalkyl‐bonded stationary phase, respectively. Lastly, a mixed‐mode column, Acclaim WCX‐1, was added due to its potential to separate PEO homologues [39]. For this column, it seemed worthwhile to perform a second run with a less acidic mobile phase to vary the charge state of the carboxylic acid ending of the grafted chains, hence the run with ammonium formate (AF).
TABLE 2.
Columns employed in the study.
| Column | Provider | Stationary phase | Length (mm) | Diameter (mm) | Particle size (µm) | Pore size (Å) | Carbon load (%) | Flow (mL/min) | |
|---|---|---|---|---|---|---|---|---|---|
| Accucore C18 | ThermoFisher Scientific | C18 | 150 | 2.1 | 2.6 (fused core) | 80 | 9 | 0.6 |

|
| CORTECS Shield RP18 | Waters | C18 with carbamate group | 150 | 2.1 | 1.6 (fused core) | 90 | 6.4 | 0.3 |

|
| Acquity HSS T3 | Waters | T3 C18 | 150 | 2.1 | 1.8 | 100 | 11 | 0.4 |

|
| Acquity Premier HSS T3 | Waters | T3 C18, protected against adsorption | 150 | 2.1 | 1.8 | 100 | 11 | 0.4 |

|
| Accucore 150‐C4 | ThermoFisher Scientific | C4 | 150 | 2.1 | 2.6 (fused core) | 150 | 2 | 0.6 |

|
| Accucore PFP | ThermoFisher Scientific | Pentafluorophenyl | 150 | 2.1 | 2.6 (fused core) | 80 | 5 | 0.6 |

|
| Synergi Polar‐RP | Phenomenex | Phenyl linked with ester | 100 | 2.0 | 2.5 | 100 | 11 | 0.3 |
|
|
Acclaim WCX‐1 Formic acid |
ThermoFisher Scientific | C18 with carboxylic acid ending | 150 | 2.1 | 3 | 120 | N/A | 0.3 |

|
|
Acclaim WCX‐1 Ammonium formate |
ThermoFisher Scientific | C18 with carboxylic acid ending | 150 | 2.1 | 3 | 120 | N/A | 0.3 |

|
2.2.2. Chromatographic Conditions
The analyses were carried out using a Vanquish Horizon system (ThermoFisher Scientific), coupled with an Orbitrap Exactive Plus mass spectrometer (ThermoFisher Scientific), equipped with a heated electrospray ionization source (HESI).
The column oven temperature was set at 35°C, and the injection volume was 5 µL. A broad generic gradient was applied to screen the eight columns, consisting of a mixture of 95/5 v/v H2O/MeOH with 0.1% formic acid (FA) (mobile phase A) and 5/95 v/v H2O/MeOH with 0.1% FA (mobile phase B). For the mixed‐mode column Acclaim WCX‐1, an additional mobile phase containing 10 mM AF instead of formic acid was utilized. The gradient for the Accucore columns began at 0% of mobile phase B, increased to 100% over 12.5 min, remained constant for 4.5 min, and then returned to 0% over 2.5 min. The column was then equilibrated for 2.5 min in the initial conditions prior to the next injection. The flow rate was 0.6 mL/min, adjusted depending on the maximal pressure withstood by each column. The gradient profile was scaled for lower flow rates and/or alternative column dimensions to maintain equal gradient steepness [54]. All gradient profiles are presented in Figure S1. Each model mixture was individually injected, followed by a blank injection. The whole sequence was repeated three times.
A split was employed between the UHPLC system and the HESI source to divert approximately one‐third of the total flow rate to the source, while the remainder was discarded. Ionization was performed in either positive or negative mode, depending on the compound (positive mode: IMID‐C14, IMID‐C17, BAC, THP‐C14; negative mode: PE‐PEO, PE‐C14). In positive mode, the sheath, auxiliary, and sweep gases were set to 10, 20, and 5, respectively (arbitrary units). In negative mode, they were set to 10, 5, and 10 (arbitrary units). The source voltage was set to 4.5 kV in positive mode and 3.5 kV in negative mode. The S‐lens level was set to 80 in positive mode and 70 in negative mode. The capillary temperature was maintained at 300°C, and the analyses were conducted in full scan mode, with a mass‐to‐charge ratio (m/z) range of 100–1200. The AGC target was set at 3.106, and the maximum injection time was set at 200 ms. Data were acquired at a scan rate of 1 Hz, with a resolution of 140,000 at m/z 200. Instrument control and data acquisition were achieved using Excalibur 4.1 (ThermoFisher Scientific).
2.3. Measured Chromatographic Properties
Data processing was conducted using Freestyle 1.8 SP 2 (ThermoFisher Scientific). The chromatographic properties were determined based on the extracted ion chromatograms (EICs). The EIC was extracted solely for the molecule, or the two molecules, that exhibited the most intense signal for each mixture (Table 1). The extraction was conducted within a window of ± 10 ppm.
Several parameters were measured from EICs (Figure S2): retention time (), peak area (), width at 10% of the peak height (), and width at 50% of the peak height ().
Using these parameters, the other responses were calculated. To take into account the different flow rates and column dimensions, the apparent retention factor () was used. The asymmetry factor () was determined by
| (1) |
Apparent efficiency () was also calculated:
| (2) |
Relative standard deviations () were calculated for retention times to evaluate analysis repeatability.
The retention range () was defined as the difference between the apparent retention factor of the last eluted compound and the first eluted compound:
| (3) |
Resolution () between two consecutive peaks was calculated as
| (4) |
Additionally, to assess the separation of homologues within a polymer series, the resolution between the peaks at m/z 279.1731 and m/z 323.1993 in the PE‐PEO mixture was calculated (). These two molecules are separated only by one ethylene oxide pattern.
It has been observed that not all the molecules in every model mixture were detected with each column. Indeed, in some cases, the intensity for certain molecules may fall below the limit of detection of the method owing to the excessive width of the peak. Moreover, some mixtures contain isomers that may or may not be separated from each other. For these reasons, the total number of peaks () was counted.
Finally, the duration of the analysis was estimated using the retention time of the last eluted compound ().
The final values represent the average of the values measured for the three repetitions. To better discriminate columns, the log of the response was considered for the area and the apparent efficiency.
The different responses were categorized into three groups: analytical performances (, , ), peak shape (, , ), and separation (, , , ).
2.4. Derringer Desirability Functions
Derringer desirability functions are a useful tool for multicriteria optimization [46, 47, 48, 52]. They allow the ranking of the different columns based on a series of chosen criteria, with the attribution of a dimensionless score to each of them. Each criterion is assigned a score between 0 and 1, where 0 indicates an unacceptable situation and 1 signifies that the criterion is fully met. If the criterion is only partially met, the score falls between 0 and 1 according to a predefined desirability function. Usually, the global desirability score is then established as the geometric (or less frequently, arithmetic) mean of all individual desirability scores.
For our column comparison, ten desirability functions were defined, each corresponding to the responses described above. These functions allowed to attribute ten desirability scores to each column: , , , , , , , , , and . As they referred to parameters measured for each molecule individually, desirability functions for , , , , and were applied to each of the seven molecules selected in our model mixtures for each of the eight columns. The desirability score for one of these criteria in a given column was calculated as the geometrical mean of the desirability scores for that criterion across all molecules. Similarly, the score was the geometrical mean of the scores obtained for all adjacent peaks on a single column. On the contrary, only one value was attributed to the scores , , , and per column. For each function, inferior (inf) and superior (sup) limits were chosen. These limits might be component‐dependent if the disparities between values were too high. Then, depending on whether the criterion should be minimized or maximized, a function was defined as follows (Figure S3):
If the criterion should be minimized:
| (5) |
If the criterion should be maximized:
| (6) |
We can refine the desirability scores by assigning weights to prioritize certain criteria over others: , , , , , , , , , and .
Three subtotal scores (, , and ) and a total score were then defined:
| (7) |
| (8) |
| (9) |
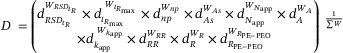 |
(10) |
3. Results and Discussion
3.1. Preliminary Results on the Accucore C18 Column
C18 columns are commonly used in literature for the analysis of CIs [23, 31, 33, 35, 36, 37, 55, 56, 57]. The Accucore C18 column had been previously used for the analysis of surfactants [39], and was, therefore, the starting point of this study. The superimposed EICs of the seven molecules from the model mixtures on the Accucore C18 column are presented in Figure 1.
FIGURE 1.

Superposition of EICs of the molecules used in the study (m/z ± 10 ppm) on the Accucore C18 column.
Despite some degree of separation between the molecules, the broadness of most of the peaks resulted in low resolutions, the lowest being 0.06 for IMID‐C14_2 and PE‐C14. All molecules were retained, but they exhibited similar apparent retention factors (17 < < 26). Furthermore, the peaks were tailing, with asymmetry factors exceeding 2.9 for all molecules and apparent efficiencies below 1000, except for IMID‐C14_2, IMID‐C17, and BAC. This tailing could be attributed to interactions with residual silanols or strong adsorption of molecules in the column. The most irregular peak shape was observed for IMID‐C14_1, with an asymmetry factor of 16 and an apparent efficiency below 100. This peak was very wide, causing its intensity to approach the limit of detection of the Orbitrap instrument.
The overall separation was poor, especially because no isomers were separated. For instance, it was known that at least four isomers could be detected with a m/z of 293.1887 in the PE‐C14 mixture, but they were not separated with this column. Likewise, the PEO homologues were not separated in the PE‐PEO mixture, as evidenced by the resolution of 0.6 between the first two homologues, at m/z 279.1731 and 323.1993.
In summary, the separation on the Accucore C18 column was adversely affected by high peak tailing. The gradient could be adjusted to enhance the separation, or a different mobile phase additive could be used instead of formic acid. However, formic acid was the optimal additive for the ionization of our compounds, and the utilization of neither AF nor acetic acid would improve peak shape. Similarly, substituting MeOH with acetonitrile yielded an equally unsatisfactory peak shape. Given that the issue likely stemmed from residual unprotected silanols, it was decided to extend the study to the other columns.
Each of these columns performed differently for each molecule, with varying peak shapes and separation. The superimposed EICs of the seven molecules from the model mixtures on all columns are presented in Figure 2. The overall analytical performances, including the repeatability, the analysis duration, and the number of detected peaks also varied from one column to another. Since no column achieved perfect separation with thin and symmetric peaks for all molecules, the Derringer desirability functions were used to determine an acceptable compromise based on the criteria described above.
FIGURE 2.
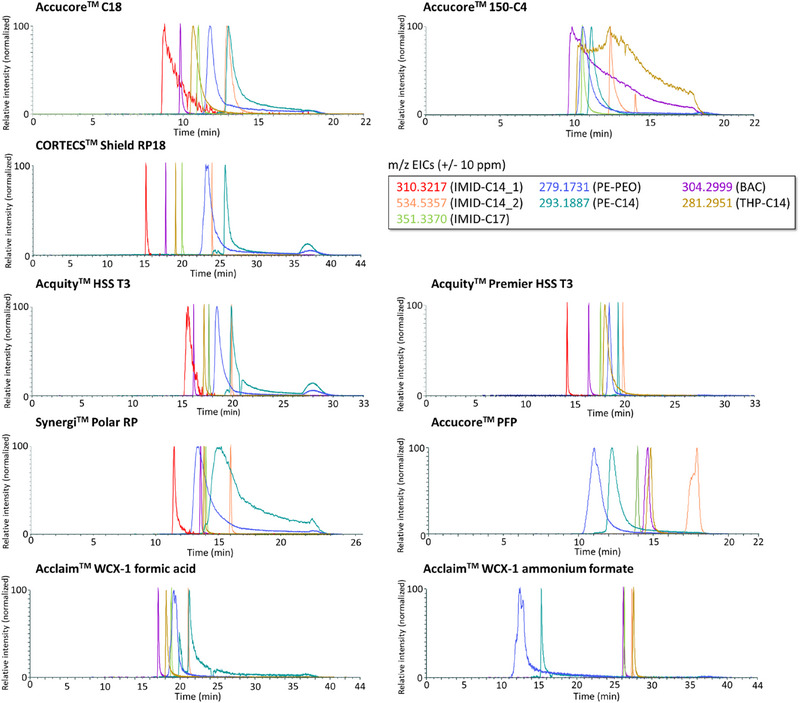
Superposition of EICs of the molecules involved in the study (m/z ± 10 ppm) for all nine chromatographic conditions.
3.2. Definition of the Derringer Desirability Functions Limits
The inferior and superior limits of each desirability function were arbitrarily chosen according to the study goals and are summarized in Table 3. To prevent the exclusion of a column from the study due to a score of 0, all limits were chosen to ensure that no score reaches 0.
TABLE 3.
Definition of the desirability functions limits.
| inf/sup desirability functions | |||||||||||
|---|---|---|---|---|---|---|---|---|---|---|---|
| Response | Desirability score | Max/min | Weight | IMID‐C14_1 | IMID‐C14_2 | IMID‐C17 | PE‐C14 | PE‐PEO | BAC | THP‐C14 | |
| Analytical performances | |||||||||||
| Relative standard deviation on retention times |
|
min | 2 | 0.2%/4% | |||||||
| Maximal retention time |
|
min | 1 | 15 min/30 min | |||||||
| Number of peaks |
|
Max | 2 | 20/40 | |||||||
| Peak shape | |||||||||||
| Asymmetry factor |
|
min | 2 | 1.5/18 | 1.5/9 | 1.5/8 | 1.5/21 | 1.5/6 | 1.5/30 | 1.5/7 | |
| Apparent efficiency (log) |
|
Max | 2 | 1.5/4 | 3/5.5 | 3/5 | 1/4 | 2/4 | 1/5 | 1/4 | |
| Area (log) |
|
Max | 1 | 6/7 | 7.5/8.5 | 7/7.5 | 7/8 | 7/8 | 8 / 9 | 8/8.5 | |
| Separation | |||||||||||
| Apparent retention factor |
|
Max | 2 | 0/2 | |||||||
| Retention range |
|
Max | 1 | 0/10 | |||||||
| Resolution |
|
Max | 1 | 0/1.2 | |||||||
| Resolution for PE‐PEO |
|
Max | 1 | 0/1.2 | |||||||
First, for the analytical performances, the should be as low as possible. Therefore, was set to 0 if was above 4.5% and to 1 if was below 0.2%. A shorter indicates a shorter analysis time, hence it should also be minimized, with a score of 1 attributed to if was below 15 min, and 0 if was above 30 min. On the contrary, the number of peaks should be maximized, with a lower limit at 20 detected peaks ( = 0 if ≤ 20) and a target of 40 peaks detected ( = 1 if ≥ 40).
Next, each peak should be as symmetric and thin as possible, with a maximum area. For these criteria, the limits varied depending on the compound, as the values may differ notably. The asymmetry factor should be lower than 1.5 ( = 1 if ≤ 1.5) for all molecules. The superior limit was chosen for each molecule, as small as possible while ensuring values were strictly greater than 0. The apparent efficiency and the area were also maximized. Since the compound IMID‐C14_1 was not detected on the Accucore 150‐C4, Accucore PFP, and Acclaim WCX‐1 columns (using both FA and AF), an arbitrary score of 0.1 was assigned to these three criteria when the molecule was not detected.
Finally, every compound should be retained on the column and separated from the others. Therefore, was set at 1 for above 2. A long retention range implies a significant difference in elution strength needed for the first and last compound, hence the maximization of this criterion. Based on the results, a retention range of 10 was deemed acceptable ( = 1 if ≥ 10). Resolution for adjacent peaks and for PEO should be above 1.2 ( = 1 if ≥ 1.2 and = 1 if ≥ 1.2).
The independence of every criterion from one another was assessed by calculating the correlation coefficient (r) for each pair of functions (Figure S4). The r values ranged from −0.8 to 0.8, with the majority falling between −0.6 and 0.6, indicating a low correlation between criteria. Moreover, no leverage points that could distort the correlation factor values were identified.
As for the ponderations, the greater weight of 2 rather than 1 was assigned to criteria that are challenging to enhance through simple gradient adjustment: , , , , and . No criterion was deemed critical enough to justify a higher weight.
3.3. Column Comparison
The study results are summarized in Figure 3. The analytical performance criteria negatively singled out one column, WCX‐1 with AF, which produced extended run duration and failed to separate nearly all isomers, leading to a reduced number of detected peaks. The Accucore 150‐C4 exhibited inconsistencies in repeatability, with retention times fluctuating between runs. This column also scored the lowest in peak shape, as the majority of the molecules produced broad and asymmetric peaks. In contrast, all other columns demonstrated superior performances, with three columns performing especially well: CORTECS Shield RP18, Acquity HSS T3, and Acquity Premier HSS T3, all of which achieved separation scores above 0.5, meaning that all columns allowed some separation of our molecules and peak shape scores above 0.9. Given that all molecules were retained in every column, the criterion based on apparent retention factors did not serve as a differentiating factor among these columns. However, PEO was poorly separated, except in the case of the CORTECS Shield RP18 and the Acquity Premier HSS T3 columns, resulting in low values of . This preliminary overview, supported by the global desirability function scores, identified two columns as potentially acceptable compromises for the analysis of our set of molecules: Acquity Premier HSS T3 (D = 0.86) and CORTECS Shield RP18 (D = 0.83). On the contrary, the Accucore 150‐C4 column was deemed unsuitable (D = 0.44). For a more comprehensive understanding of the results, a detailed examination of each column is necessary.
FIGURE 3.
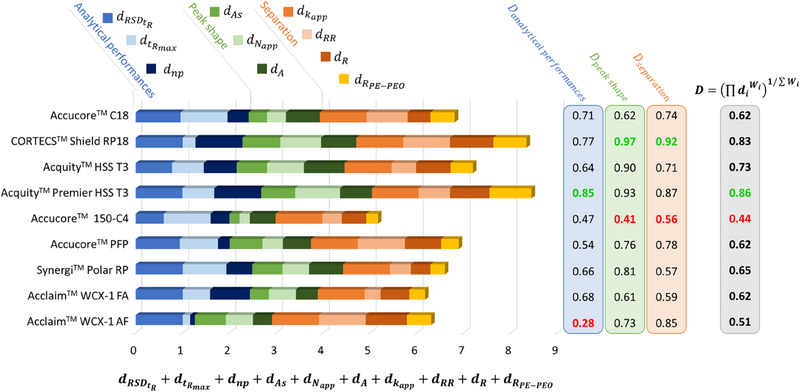
Derringer desirability scores obtained for the nine chromatographic separation conditions. On the left, the scores are summed, depicting the contribution of each criterion to the final score. On the right, the subtotal scores , and are calculated, as well as the global score is calculated, according to Equations (7)–(10).
3.3.1. Accucore C18 and Accucore 150‐C4
As discussed above, the Accucore C18 column gave satisfying results in terms of separation but with very poor peak shape, in particular for phosphoric esters (PE‐C14 and PE‐PEO). These molecules exhibited wide and tailing peaks, with asymmetry factors as high as 12. Tailing was also observed for other molecules, resulting in relatively low apparent efficiency and resolution.
The Accucore 150‐C4 column, which had shorter alkyl chains and a lower carbon load (2% vs. 9%), surprisingly exhibited similar apparent retention factors. However, the peak shape was significantly worse with this column, with high asymmetry factors and low apparent efficiencies, leading to poor separation. This deterioration in peak shape was most pronounced for quaternary ammoniums (BAC and THP‐C14), supporting the hypothesis of uncontrolled interactions with residual unprotected silanols on the stationary phase. This is despite ThermoFisher Scientific's claim of no ion exchange capacity at pH 2.7 for both columns. The tests performed by the supplier, based on the work of Tanaka et al. [40, 58], employed different molecules that may not interact with residual silanols in the same way as our compounds. These silanols are likely to be even more accessible with a shorter carbon chain [59], which explains the unacceptable peak shape with the Accucore 150‐C4 column. Additionally, these uncontrolled interactions were likely responsible for the poor repeatability of analyses with the Accucore 150‐C4 column. An example of this was the BAC quaternary ammonium, which displays an RSD in its retention time exceeding 4%.
3.3.2. CORTECS Shield RP18
In contrast to the two previous columns, the CORTECS Shield RP18 column has a carbamate group situated between the silica and the C18 carbon chains. This group acts as a protective barrier, effectively preventing interactions with residual silanols. This shielding was particularly efficient for quaternary ammoniums and imidazolines, resulting in narrow, symmetrical peaks that were well‐separated. The small particle size (1.6 µm) and the length of the column (150 mm) contributed to very high apparent efficiencies, reaching up to 106. The CORTECS Shield RP18 was by far the best column for the separation of quaternary ammoniums and imidazolines. However, it performed poorly with the negatively charged phosphoric esters, which produced very wide and asymmetric peaks. All in all, while the CORTECS Shield RP18 column excelled with positively charged compounds, it was not the optimal choice for a comprehensive analysis encompassing various types of molecules.
3.3.3. Acquity HSS T3 vs. Acquity Premier HSS T3
Another strategy to shield residual silanols is the use of trifunctional grafting, as used in the Acquity HSS T3 column. The comparison between the Acquity HSS T3 and the Acquity Premier HSS T3 columns was particularly interesting due to their similarities. Indeed, both columns share the same dimensions, particle size, and stationary phase. The key distinction lies in the “Premier” technology applied to the latter. This technology involves a hybrid coating covering the metallic parts of the column, aiming to reduce the adsorption of molecules onto these parts [60]. Although initially developed for biological molecules, the technology's potential benefited the molecules in this study, which are prone to adsorption on metallic surfaces, making the comparison between the two HSS T3 columns particularly relevant.
Both Acquity and Acquity Premier Columns demonstrated high average efficiency above 105, with asymmetry factors for quaternary ammonium and imidazoline substances maintained below 6, ensuring most molecules are well‐separated. On the whole, the trifunctional grafting appeared to be an effective strategy for shielding against residual silanols for the analysis of our model mixtures. However, for almost all the criteria, the Acquity Premier Column showed higher scores (Figure 4A). A closer examination of each molecule's contribution to the peak shape score (Figure 4B) indicated that the most significant difference was observed with phosphoric esters. This comparison highlighted the role of parasitic adsorption in the retention process, particularly its contribution to peak widening and tailing for phosphoric esters, even though the inner metallic surface of the column is approximately 105 times smaller than the surface area provided by the silica. The resolution between the first two peaks of the PEO distribution in the PE‐PEO mixture was notably lower on the Acquity column (0.6) compared to the Acquity Premier column (1.1). The Acquity Premier column excelled in separating ethylene oxide polymers, a critical aspect of this study. The adsorption phenomenon could also be observed with IMID‐C14_1, which was more retained on the Acquity column than on the Acquity Premier. The sole molecule that seemed to be adversely affected by the Premier technology was THP‐C14, possibly due to some interactions with the hybrid material. Nonetheless, the Acquity Premier HSS T3 column stood out as the only column in this selection that allowed acceptable peak shapes for both phosphoric esters while preserving good peak shapes for other molecules, thereby establishing itself as the best compromise for analyzing the study's set of molecules.
FIGURE 4.
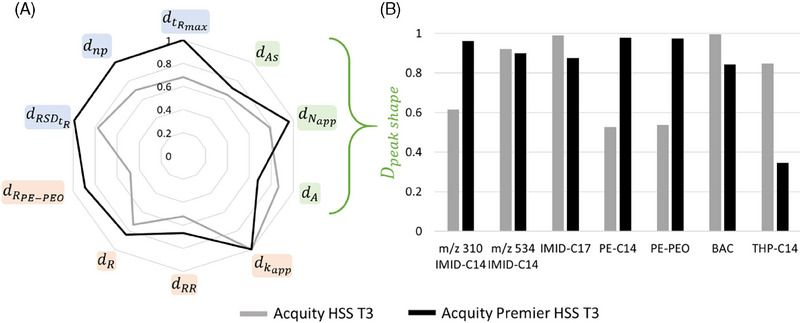
Comparison of two columns: Acquity HSS T3 and Acquity Premier HSS T3. (A) Radar plot of each score for Acquity HSS T3 and Acquity Premier HSS T3 columns. (B) Contribution of each molecule to the score for the two columns.
3.3.4. Accucore PFP, Synergi Polar RP, and Acclaim WCX‐1
In view of the retention and separation potential demonstrated by the various columns with C18 stationary phases, it could also be interesting to evaluate the potential of other types of stationary phases for reverse phase separation (Accucore PFP, Synergi Polar RP) but also in mixed mode (Acclaim WCX‐1). The Accucore PFP column resulted in larger peaks, leading to reduced apparent efficiencies. The Synergi Polar RP column showed potential for quaternary ammonium and imidazoline substances but was less effective for phosphoric esters (101 < R < 2 × 10² for PE‐C14 and PE‐PEO). The Acclaim WCX‐1 column's performance varied significantly with the mobile phase pH due to the charge state of the carboxylic acid group in the stationary phase. Indeed, at pH above carboxylic acids pKa, the deprotonated carboxylic acid allowed for weak cation exchange in addition to reversed phase mechanisms. With formic acid as an additive in the mobile phases (pH 2.7), the separation mode was primarily reversed phase, causing several molecules to coelute and resulting in the lowest retention range among all tested columns (RR = 3.4 min). With AF (pH 6.2), amines were well separated from phosphoric esters, though not from each other, and once again, phosphoric esters were not well separated with this column. Despite this, the Acclaim WCX‐1 column presented a valuable alternative to conventional reversed‐phase columns, providing the ability to alter interactions with the stationary phase solely by adjusting the pH of the mobile phase. This adaptability is particularly useful when analyzing a diverse set of molecules, including anionic, cationic, and non‐ionic surfactants. However, as this column has yet to be developed for UHPLC, its results were not fully comparable with those from other columns designed for UHPLC with sub‐2 µm or fused core particles. Overall, even if these columns showed satisfactory results for some molecules, they failed to be a good compromise for the entire set.
3.4. Column Selection
The results of the study led to the selection of the Acquity Premier HSS T3 column. It has been revealed that for the analysis of our set of molecules, both silanol interactions and parasitic adsorption could play a major role in retention. Consequently, new technologies developed to mitigate these effects are particularly pertinent. Furthermore, the phosphoric esters were identified as critical molecules in this study due to their tendency to produce wide and asymmetric peaks on most tested columns. Only three columns achieved scores above 0.6 for the peak shape function for both phosphoric esters. The Acquity Premier HSS T3 column was the only one to exhibit minimal peak tailing and high resolution for both phosphoric esters while maintaining satisfactory performance for amines and minimal coelutions, hence its favorable overall score. It is important to note that the study's outcomes could vary depending on the definition of the Derringer desirability functions. In the present study, the emphasis was on achieving optimal peak shape for the maximum number of detected compounds in the shortest possible time, with less focus on separation, although it was considered.
3.5. Gradient Modification
The gradient used for the column screening was a broad generic gradient and was not optimized for the separation of the target molecules. Although the Acquity Premier HSS T3 column provided satisfactory results, the separation could be further improved with a gradient adjustment. The goal was to achieve the best separation possible with the same mobile phases and, if possible, to reduce the total analysis duration. The optimized gradient began at 75% of mobile phase B, increased to 80% over 2 min, remained constant for 2 min, increased to 90% in 5 min, then to 100% in 1 min, and remained constant for 3 min before decreasing to 75% in 1 min. The column was then equilibrated for 5 min in the initial conditions prior to the next injection. The EICs of the molecules from this study are presented in Figure 5A.
FIGURE 5.
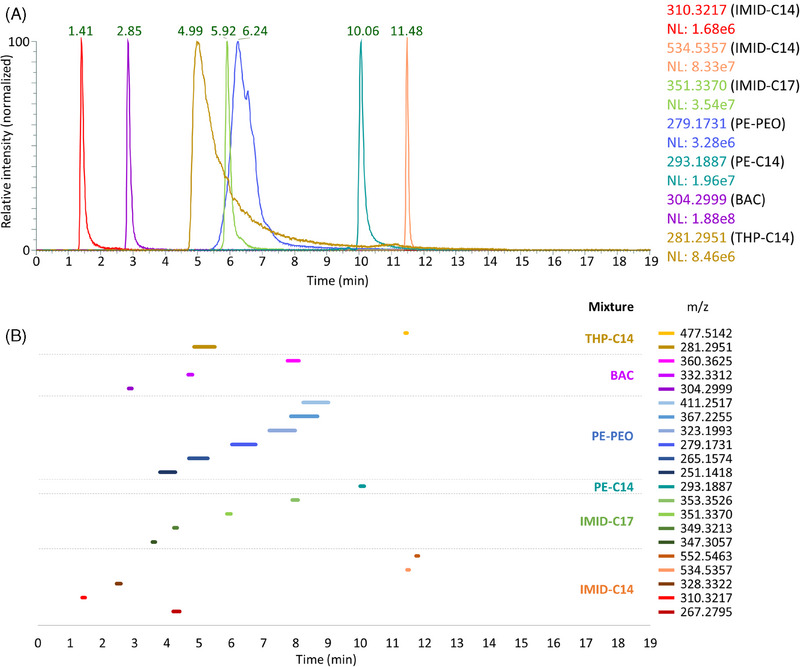
Separation of model mixtures on the Acquity Premier HSS T3 column, with an optimized gradient. (A) Superposition of EICs of the seven molecules selected for the study (m/z ± 10 ppm). (B) Visualization of a selection of 21 molecules from the model mixtures. Each line represents the chromatographic peak derived from the corresponding EIC (m/z ± 10 ppm), measured at 50% of its maximum height.
This gradient allowed the separation of the seven molecules in less than 12 min. The peak widths of THP‐C14 and PE‐PEO resulted in coelution, which is resolved through HRMS. Moreover, the model mixtures do not contain only one or two molecules, but in fact several homologues. To represent the diversity of molecules across the chromatogram, 21 molecules were selected (Figure 5B). These molecules encompass the entirety of the molecules present in each model mixture, with the exception of PE‐PEO. For this mixture, only the first molecule of each distribution was represented for the sake of clarity. This corresponded to a phosphoric ester with no EO and carbon chains with 11, 12, or 13 carbons (m/z 251.1418, 265.1574, and 279.1731). Additionally, the first four molecules of the PEO with 13 carbons in the alkyl chain were represented (m/z 279.1731, 323.1993, 367.2255, and 411.2517). In instances where multiple isomers were separated and detected, only the isomer producing the most intense signal was considered. The optimized gradient on the Acquity Premier HSS T3 column ensured effective separation of each molecule within the mixtures, as well as a good spread in the chromatogram of the different species. The developed method did not allow a perfect separation of all the molecules but rather provided a unique method that is applicable to a broad spectrum of commercial additives.
4. Conclusion
Eight reversed‐phase chromatography columns were screened in order to find the best compromise for the analysis of six model mixtures, based on seven representative molecules. All mixtures were injected under identical conditions across the different columns to ensure comparability of results, except for the Acclaim WCX‐1 column for which two different mobile phase pH levels were used. The Derringer desirability functions proved to be a powerful tool to easily have an objective comparison of columns. The chosen criteria took into account the overall analytical performances, the peak, shape, and the separation of molecules. The Acquity Premier HSS T3 column stood out as the optimal compromise for the selected set of molecules, despite punctual superior performances for some specific compounds from other columns, such as the CORTECS Shield RP18, which demonstrated apparent efficiencies exceeding 105 for all amines. The protection against both residual silanol interactions and adsorption proved crucial for the analysis of CIs, given the nature of the molecules typically found in such additives. In the end, the mobile phase gradient was adjusted for the chosen column, resulting in one method capable of analyzing a broad spectrum of molecules.
The column selection strategy proposed in this study for corrosion inhibitors is straightforward to implement and could be easily extended to other molecules and columns or applied to different fields.
Author Contributions
Laetitia Furno: investigation and writing. Audrey Combès: supervision and review. Didier Thiébaut: conceptualization and review. Aurore Méré: supervision and resources. Nicolas Passade‐Boupat: supervision. Jérôme Vial: conceptualization, methodology and review.
Conflicts of Interest
The authors declare no conflict of interest.
Supporting information
Supporting Information
Acknowledgments
This work was a collaboration between the École Supérieure de Physique et de Chimie Industrielles (ESPCI) at Paris, France and TotalEnergies at Lacq, France.
This paper is included in the Special Collection ‘Stationary Phase and Column Technologies’ edited by Michael Laemmerhofer.
Data Availability Statement
Data are available on request from the authors.
References
- 1. Ropital F., “Corrosion des matériaux dans l'industrie pétrolière. Corrosion Vieillissement [Internet],” Techniques de l'ingénieur, last modified February 24, 2017, https://www.techniques‐ingenieur.fr/doi/10.51257/a/v1/cor750.
- 2. Koch G. H., Brongers M. P. H., Thompson N. G., Virmani Y. P., and Payer J. H., “Chapter 1 ‐ Cost of Corrosion in the United States,” in Handbook of Environmental Degradation of Materials, eds. M. Kutz (Amsterdam, the Netherlands: Elsevier, 2005), 3–24. [Google Scholar]
- 3. Naraghi A. and Grahmann N., Corrosion Inhibitor Blends with Phoshate Esters, United States Patent: US5611992 (1997) [Google Scholar]
- 4. Bellos T. J., Corrosion Inhibitor for Highly Oxygenated Systems, United States Patent US4311662 (1982).
- 5. Outlaw B. T., Oude Alink B. A., Kelley J. A., and Claywell C. S. Corrosion Inhbition in Deep Gas Wells by Phosphate Esters of Poly‐Oxyalkylated Thiols, United States Patent: US4511480 (1985). [Google Scholar]
- 6. Wang X., Yang J., Chen X., Liu C., and Zhao J., “Synergistic Inhibition Properties and Microstructures of Self‐Assembled Imidazoline and Phosphate Ester Mixture for Carbon Steel Corrosion in the CO2 Brine Solution,” Journal of Molecular Liquids 357 (2022): 119140. [Google Scholar]
- 7. Meyer G. R., Zwitterionic Water‐Soluble Substituted Imine Corrosion Inhibitors, United States Patent US6171521 B1 (2001).
- 8. Wang Y., Yang Z., Hu H., Wu J., and Finšgar M., “Indolizine Quaternary Ammonium Salt Inhibitors: The Inhibition and Anti‐Corrosion Mechanism of New Dimer Derivatives From Ethyl Acetate Quinolinium Bromide and n‐Butyl Quinolinium Bromide,” Colloids and Surfaces A: Physicochemical and Engineering Aspects 651 (2022): 129649. [Google Scholar]
- 9. Ramachandran S., Tsai B. L., Blanco M., Chen H., Tang Y., and Goddard W. A., “Self‐Assembled Monolayer Mechanism for Corrosion Inhibition of Iron by Imidazolines,” Langmuir 12, no. 26 (1996): 6419–6428. [Google Scholar]
- 10. Gulabani R., King S. W., Dicholkar D., and Ku S. Y., Bis‐Imidazoline Compounds as Corrosion Inhibitors and Preparation of Thereof, United States Patent: US10487406B2 (2015). [Google Scholar]
- 11. El‐Haddad M. N. and Fouda A. S., “Electroanalytical, Quantum and Surface Characterization Studies on Imidazole Derivatives as Corrosion Inhibitors for Aluminum in Acidic Media,” Journal of Molecular Liquids 209 (2015): 480–486. [Google Scholar]
- 12. Mishra A., Aslam J., Verma C., Quraishi M. A., and Ebenso E. E., “Imidazoles as Highly Effective Heterocyclic Corrosion Inhibitors for Metals and Alloys in Aqueous Electrolytes: A Review,” Journal of the Taiwan Institute of Chemical Engineers 114 (2020): 341–358. [Google Scholar]
- 13. Shamsa A., Barker R., Hua Y., Barmatov E., Hughes T. L., and Neville A., “Impact of Corrosion Products on Performance of Imidazoline Corrosion Inhibitor on X65 Carbon Steel in CO2 Environments,” Corrosion Science 185 (2021): 109423. [Google Scholar]
- 14. Zheng Z., Hu J., Eliaz N., Zhou L., Yuan X., and Zhong X., “Mercaptopropionic Acid‐Modified Oleic Imidazoline as a Highly Efficient Corrosion Inhibitor for Carbon Steel in CO2‐Saturated Formation Water,” Corrosion Science 194 (2022): 109930. [Google Scholar]
- 15. Zhang J., Qiao G., Hu S., Yan Y., Ren Z., and Yu L., “Theoretical Evaluation of Corrosion Inhibition Performance of Imidazoline Compounds With Different Hydrophilic Groups,” Corrosion Science 53, no. 1 (2011): 147–152. [Google Scholar]
- 16. Mazumder M. A. J., HA A.l‐M., and Ali S. A., “The Effects of N‐Pendants and Electron‐Rich Amidine Motifs in 2‐(p‐Alkoxyphenyl)‐2‐Imidazolines on Mild Steel Corrosion in CO2‐Saturated 0.5 M NaCl,” Corrosion Science 90 (2015): 54–68. [Google Scholar]
- 17. Zhang G., Chen C., Lu M., Chai C., and Wu Y., “Evaluation of Inhibition Efficiency of an Imidazoline Derivative in CO2‐Containing Aqueous Solution,” Materials Chemistry and Physics 105, no. 2–3 (2007): 331–340. [Google Scholar]
- 18. Usman B. J. and Ali A., “Carbon Dioxide Corrosion Inhibitors: A Review,” Arabian Journal for Science and Engineering 43, no. 1 (2018): 1–22. [Google Scholar]
- 19. Naraghi A. and Prince P., Composition and Methods for Inhibiting Corrosion, WO97/08264 (1997).
- 20. Pou T. E. and Fouquay S., Polymethylenepolyaminedipropionamides as Environmentally Safe Inhibitors of the Carbon Corrosion of Iron, United States Patent US6365100B1 (2002).
- 21. Kakaei M. N. and Neshati J., “Corrosion Inhibition of Carbon Steel in Diethanolamine–H2O–CO2 System by Some Organic Sulphur Compounds,” Corrosion Engineering, Science and Technology 54, no. 5 (2019): 413–421. [Google Scholar]
- 22. Benton W. J. and Koskan L. P., Inhibition of Carbon Dioxide Corrosion of Metals, United States Patent US5607623 (1997).
- 23. Zhu Y., Free M. L., Woollam R., and Durnie W., “A Review of Surfactants as Corrosion Inhibitors and Associated Modeling,” Progress in Materials Science 90 (2017): 159–223. [Google Scholar]
- 24. Xiong Y., Pacheco J. L., and Desai S., “A Parametric Study of Corrosion Inhibitor Partitioning in Oil and Water Phases” (paper presentation CORROSION 2016, Vancouver, Canada, March 2016), NACE‐2016‐7398. [Google Scholar]
- 25. Anthony J., Harrington R., Durnell C., et al. “Lessons Learned from Residual Corrosion Inhibitor Measurements by LC‐MS in a Mature North Sea Gas/Condensate/MEG Production System” (paer presentation, SPE International Oilfield Corrosion Conference and Exhibition, Aberdeen, UK, June 2018), SPE‐190902‐MS [Google Scholar]
- 26. Evtushenko Y. M., Ivanov V. M., and Zaitsev B. E., “Photometric Determination of Octadecylamine With Methyl Orange,” Journal of Analytical Chemistry 57, no. 1 (2002): 8–11. [Google Scholar]
- 27. Jackson T., Smith D., Vargas J., and Andrews B., “Corrosion Inhibitor Deliverability—A Corrosion Inhibitor Residual Success Story” (paper presentation, CORROSION 2020, June 2020), NACE‐2020‐14998.
- 28. Son A. J., “Developments in the Laboratory Evaluation of Corrosion Inhibitors: A Review” (paper presentation, CORROSION 2007, Nashville, TN, March 2007), NACE–07618. [Google Scholar]
- 29. Fogh J., Rasmussen P. O. H., and Skadhauge K., “Colorimetric Method for Quantitative Microdetermination of Quaternary Ammonium Compounds,” Analytical Chemistry 26, no. 2 (1954): 392–395. [Google Scholar]
- 30. Lendi M., Method for the Determination of Film‐Forming Amines, United States Patent US9588090B2 (2014).
- 31. Fortenberry C. L. Jr., Grahmann N. J., Miller C. D., and Son A. J., “Analysis of Residual Corrosion Inhibitors in Oilfield Brines” (paper presentation, SPE Annual Technical Conference and Exhibition, Houston, TX, October 1993), SPE‐26607‐MS. [Google Scholar]
- 32. Gough M. A. and Langley G. J., “Analysis of Oilfield Chemicals by Electrospray‐Mass Spectrometry,” Rapid Communications in Mass Spectrometry 13, no. 4 (1999): 227–236. [Google Scholar]
- 33. Elia A. A., “Application of Chromatography and Mass Spectrometry to the Determination of Chemicals Additives in Oilfield Fluids” (PhD diss., University of Southampton, 2017). [Google Scholar]
- 34. Weiss S. and Reemtsma T., “Determination of Benzotriazole Corrosion Inhibitors From Aqueous Environmental Samples by Liquid Chromatography‐Electrospray Ionization‐Tandem Mass Spectrometry,” Analytical Chemistry 77, no. 22 (2005): 7415–7420. [DOI] [PubMed] [Google Scholar]
- 35. Bassarab P., Williams D., Dean J. R., Ludkin E., and Perry J. J., “Determination of Quaternary Ammonium Compounds in Seawater Samples by Solid‐Phase Extraction and Liquid Chromatography–Mass Spectrometry,” Journal of Chromatography A 1218, no. 5 (2011): 673–677. [DOI] [PubMed] [Google Scholar]
- 36. Jackson T. and Vargas J., “Selective Loss of Bulk Corrosion Inhibitor Species When Exposed to Glass, Plastic, and Steel” (paper presentation CORROSION 2020, June 2020), NACE‐2020‐14999.
- 37. Xue Y., Vughs D., Hater W., et al., “Liquid Chromatography–High‐Resolution Mass Spectrometry‐Based Target and Nontarget Screening Methods to Characterize Film‐Forming Amine‐Treated Steam‐Water Systems,” Industrial & Engineering Chemistry Research 59, no. 51 (2020): 22301–22309. [Google Scholar]
- 38. Dufour A., Caractérisation des Tensioactifs Polydisperses Industriels par Spectrométrie De Masse et Chromatographie en Phase Liquide (Paris, France: Université PSL, 2020). [Google Scholar]
- 39. Dufour A., Thiébaut D., Ligiero L., Loriau M., and Vial J., “Chromatographic Behavior and Characterization of Polydisperse Surfactants Using Ultra‐High‐Performance Liquid Chromatography Hyphenated to High‐Resolution Mass Spectrometry,” Journal of Chromatography A 1614 (2020): 460731. [DOI] [PubMed] [Google Scholar]
- 40. Kimata K., Iwaguchi K., Onishi S., et al., “Chromatographic Characterization of Silica C18 Packing Materials. Correlation Between a Preparation Method and Retention Behavior of Stationary Phase,” Journal of Chromatographic Science 27, no. 12 (1989): 721–728. [Google Scholar]
- 41. Le Mapihan K., Vial J., and Jardy A., “Reversed‐Phase Liquid Chromatography Column Testing and Classification: Physicochemical Interpretation Based on a Wide Set of Stationary Phases,” Journal of Chromatography A 1144, no. 2 (2007): 183–196. [DOI] [PubMed] [Google Scholar]
- 42. Cruz E., Euerby M. R., Johnson C. M., and Hackett C. A., “Chromatographic Classification of Commercially Available Reverse‐Phase HPLC Columns,” Chromatographia 44, no. 3–4 (1997): 151–161. [Google Scholar]
- 43. Visky D., Vander Heyden Y., Iványi T., et al., “Characterisation of Reversed‐Phase Liquid Chromatographic Columns by Chromatographic Tests. Evaluation of 36 Test Parameters: Repeatability, Reproducibility and Correlation,” Journal of Chromatography A 977, no. 1 (2002): 39–58. [DOI] [PubMed] [Google Scholar]
- 44. Diamantidou D., Sampsonidis I., Liapikos T., Gika H., and Theodoridis G., “Liquid Chromatography‐Mass Spectrometry Metabolite Library for Metabolomics: Evaluating Column Suitability Using a Scoring Approach,” Journal of Chromatography A 1690 (2023): 463779. [DOI] [PubMed] [Google Scholar]
- 45. Pezzatti J., González‐Ruiz V., Codesido S., et al., “A Scoring Approach for Multi‐Platform Acquisition in Metabolomics,” Journal of Chromatography A 1592 (2019): 47–54. [DOI] [PubMed] [Google Scholar]
- 46. Periat A., Guillarme D., Veuthey J. L., et al., “Optimized Selection of Liquid Chromatography Conditions for Wide Range Analysis of Natural Compounds,” Journal of Chromatography A 1504 (2017): 91–104. [DOI] [PubMed] [Google Scholar]
- 47. Sampsonidis I., Witting M., Koch W., et al., “Computational Analysis and Ratiometric Comparison Approaches Aimed to Assist Column Selection in Hydrophilic Interaction Liquid Chromatography–Tandem Mass Spectrometry Targeted Metabolomics,” Journal of Chromatography A 1406 (2015): 145–155. [DOI] [PubMed] [Google Scholar]
- 48. D'Hondt M., Verbeke F., Stalmans S., Gevaert B., Wynendaele E., and De Spiegeleer B., “Derringer Desirability and Kinetic Plot LC‐Column Comparison Approach for MS‐Compatible Lipopeptide Analysis,” Journal of Pharmaceutical Analysis 4, no. 3 (2014): 173–182. [DOI] [PMC free article] [PubMed] [Google Scholar]
- 49. Wernisch S. and Pennathur S., “Evaluation of Coverage, Retention Patterns, and Selectivity of Seven Liquid Chromatographic Methods for Metabolomics,” Analytical and Bioanalytical Chemistry 408, no. 22 (2016): 6079–6091. [DOI] [PMC free article] [PubMed] [Google Scholar]
- 50. Van Dorpe S., Vergote V., Pezeshki A., Burvenich C., Peremans K., and De Spiegeleer B., “Hydrophilic Interaction LC of Peptides: Columns Comparison and Clustering,” Journal of Separation Science 33, no. 6–7 (2010): 728–739. [DOI] [PubMed] [Google Scholar]
- 51. Van Gyseghem E., Jimidar M., Sneyers R., et al., “Selection of Reversed‐Phase Liquid Chromatographic Columns With Diverse Selectivity Towards the Potential Separation of Impurities in Drugs,” Journal of Chromatography A 1042, no. 1–2 (2004): 69–80. [DOI] [PubMed] [Google Scholar]
- 52. Derringer G. and Suich R., “Simultaneous Optimization of Several Response Variables,” Journal of Quality Technology 12, no. 4 (1980): 214–219. [Google Scholar]
- 53. He Y.i., Ren S., Wang X.i., et al., “Delinkage of Metal Surface Saturation Concentration and Micellization in Corrosion Inhibition,” Corrosion Journal 78, no. 7 (2022): 625–633. [Google Scholar]
- 54. Guillarme D., Nguyen D. T. T., Rudaz S., and Veuthey J. L., “Method Transfer for Fast Liquid Chromatography in Pharmaceutical Analysis: Application to Short Columns Packed With Small Particle. Part II: Gradient Experiments,” European Journal of Pharmaceutics and Biopharmaceutics 68, no. 2 (2008): 430–440. [DOI] [PubMed] [Google Scholar]
- 55. Ferrer I. and Furlong E. T., “Identification of Alkyl Dimethylbenzylammonium Surfactants in Water Samples by Solid‐Phase Extraction Followed by Ion Trap LC/MS and LC/MS/MS,” Environmental Science & Technology 35, no. 12 (2001): 2583–2588. [DOI] [PubMed] [Google Scholar]
- 56. Hampson J. W., Bistline R. G., and Linfield W. M., “High Performance Liquid Chromatographie Separation of Fatty Imidazolines From Their Diamide Hydrolysis Derivatives,” Journal of the American Oil Chemists Society 60, no. 9 (1983): 1676–1677. [Google Scholar]
- 57. Wang X. and Kasperski K. L., “Quantitative Determination of Multiple Surfactants in Water Using HPLC‐MS/MS,” Analytical Methods 10, no. 21 (2018): 2512–2525. [Google Scholar]
- 58. Euerby M. R. and Petersson P., “Chromatographic Classification and Comparison of Commercially Available Reversed‐Phase Liquid Chromatographic Columns Using Principal Component Analysis,” Journal of Chromatography A 994, no. 1–2 (2003): 13–36. [DOI] [PubMed] [Google Scholar]
- 59. D'Atri V., Murisier A., Fekete S., Veuthey J. L., and Guillarme D., “Current and Future Trends in Reversed‐Phase Liquid Chromatography‐Mass Spectrometry of Therapeutic Proteins,” TrAC Trends in Analytical Chemistry 130 (2020): 115962. [Google Scholar]
- 60. Isaac G. and Plumb R. S., ACQUITY Premier LC Technology Significantly Improves Sensitivity, Peak Shape and Recovery for Phosphorylated and Carboxylate Lipids. Waters Application Note 720007092 (2023).
Associated Data
This section collects any data citations, data availability statements, or supplementary materials included in this article.
Supplementary Materials
Supporting Information
Data Availability Statement
Data are available on request from the authors.