Summary
This study aims to explore the correlation between renal blood perfusion (RBP) and diabetic nephropathy (DN). Methods: A total of 72 mice included db/db and db/m mice at the ages of 6, 14, and 22 weeks, forming six groups. RBP was assessed using Laser Speckle Contrast Imaging (LSCI). Kidney function markers and the extent of pathological damage were evaluated. Pearson correlation analysis was employed to predict the relationship between RBP and various indicators of kidney damage. Results: Compared to db/m mice of all ages, 6-week-old db/db mice showed no significant difference in kidney function markers and had no apparent pathological damage. However, db/db mice at other ages showed deteriorating kidney functions and evident pathological damage, which worsened with age. The RBP in db/m mice of all ages and 6-week-old db/db mice showed no significant difference; however, RBP in db/db mice demonstrated a significant declining trend with age. The correlation between RBP and kidney damage indicators was as follows: 24 h urinary microalbumin (r=−0.728), urinary transferrin (r=−0.834), urinary β2-microglobulin (r=−0.755), urinary monocyte chemoattractant protein-1 (r=−0.786), Masson’s trichrome staining (r=−0.872), and Periodic Acid-Schiff staining (r=−0.908). Conclusion: RBP is strongly correlated with the extent of diabetic kidney damage.
Keywords: Diabetic Nephropathy, db/db Mice, Laser Speckle Contrast Imaging, Renal Blood Perfusion, Renal Fibrosis
Introduction
Globally, approximately 537 million adults suffer from diabetes mellitus (DM), most of whom have type 2 diabetes mellitus (T2DM). This number is expected to rise to 783 million by 2045 [1]. T2DM is associated with an increased risk of microvascular complications such as retinopathy, neuropathy, and nephropathy [2]. These complications significantly impair the quality of life of patients and impose a substantial socio-economic burden. Diabetic nephropathy (DN), one of the most common complications of T2DM, is a major disease leading to end-stage renal disease (ESRD) or requiring dialysis treatment [3]. Histologically, DN is characterized by diffuse thickening of the glomerular basement membrane (GBM), effacement of podocyte foot processes, mesangial expansion, and nodular sclerosis [4]. Unfortunately, the pathogenesis of DN is not fully understood, but current research indicates that in a high glucose environment, mesangial cells (MCs) can secrete various cytokines, leading to capillary dysfunction, pathological angiogenesis in the kidneys, activation of the coagulation system, and microthrombus formation, resulting in microvascular lesions in the kidneys [5].
Some scholars believe that appropriate renal blood flow is crucial for maintaining normal blood pressure, kidney function, and water and electrolyte homeostasis [6]. Evidence suggests that in the early stages of DN (stages 1 and 2), during the normoalbuminuric phase, there is already a reduction in renal plasma flow and peritubular capillary blood flow [7]. The continuous decrease in renal blood perfusion (RBP) in DN indicates the occurrence of microcirculatory disorders in the kidneys. Current studies consider that microcirculatory dysfunction in T2DM-induced kidneys, leading to chronic hypoxia, is one of the main mechanisms causing renal damage [8–10]. Pathological changes in DN mainly include glomerulosclerosis, tubular atrophy, interstitial fibrosis, reduction of peri-tubular capillaries, and inflammatory response [11], all of which contribute to the reduction in RBP. Through these studies, we understand that the reduction in RBP under T2DM conditions might be associated with renal damage, but so far, no studies have directly elucidated their correlation.
Over the past two decades, laser speckle contrast imaging (LSCI) has emerged as one of the primary tools for blood flow imaging in both basic and clinical research [12]. The LSCI perfusion signal can analyze changes in red blood cell velocity and concentration [13]. This technique allows for the detection of changes in renal microperfusion with high spatial and temporal resolution and has been used for the assessment of renal hemodynamics [14].
The db/db mouse, characterized by a congenital leptin receptor gene mutation leading to obesity-associated T2DM, exhibits hyperglycemia, hyper-insulinemia, and hyperlipidemia [15]. After the onset of T2DM, db/db mice develop progressive kidney disease similar to human DN, making them a commonly used animal model for DN research [16]. Conversely, db/m mice serve as the non-diabetic control.
In this study, we aim to detect RBP in T2DM model animals (db/db mice) of different ages using visual technology means (LSCI), while also assessing multiple renal damage markers, and ultimately analyzing the correlation between RBF and these renal damage markers.
Materials and Methods
Experimental animals and grouping
This animal study was approved by the Animal Management and Ethics Committee of Hebei University of Chinese Medicine (Approval No.: DWLL202302014). Male db/db mice (25–30 g, n=36) and db/m mice (18–20 g, n=36) aged 5 weeks were purchased from Changzhou Cavins Laboratory Animal Co., Ltd. Mice had free access to food and tap water and were housed in a specific pathogen-free facility at a constant temperature (23–25 °C), with 50 % humidity and a 12-hour light/dark cycle. After a week of acclimatization, mice were randomly divided into six groups: 6-week-old db/db mice (to be euthanized at the age of 6 weeks, n=12) (6W-db/db), 14-week-old db/db mice (to be euthanized at the age of 14 weeks, n=12) (14W-db/db), 22-week-old db/db mice (to be euthanized at the age of 22 weeks, n=12) (22W-db/db); 6-week-old db/m mice (to be euthanized at the age of 6 weeks, n=12) (6W-db/m), 14-week-old db/m mice (to be euthanized at the age of 14 weeks, n=12) (14W-db/m), and 22-week-old db/m mice (to be euthanized at the age of 22 weeks, n=12) (22W-db/m).
Baseline measurements
The body weight, average daily food intake, average daily water intake, and fasting blood glucose (FBG) of db/db mice and db/m mice were measured and compared at 6, 8, 10, 12, 14, 16, 18, 20, and 22 weeks of age. Mice were fasted overnight with water ad libitum, and blood was collected from the tail vein to measure FBG using the Roche Accu-Chek active glucose meter, Germany.
Oral glucose tolerance test (OGTT)
OGTTs were performed at 6, 14, and 22 weeks. After overnight fasting with water ad libitum, blood glucose levels (G0) were measured, followed by oral gavage of a glucose solution at 2 g/kg body weight. Blood glucose levels were measured again at 30 min (G30), 60 min (G60), and 120 min (G120) after gavage, and the area under the curve (AUC) was calculated:
| [ 17]. |
RBP measurement
Prior to euthanasia, RBP in each group of mice was detected in vivo using LSCI (PerCam PSI PERIMED Sweden). The device is equipped with a monochromatic laser with a wavelength of 785 nm. When the tissue is irradiated, a random interference pattern (also known as a speckle pattern) is generated on the tissue surface. The speckle pattern is recorded by the PeriCam PSI scanning head’s built-in data monitoring camera (2448×2048 pixels) and transferred to a computer for data processing, generating blood perfusion images. During detection, the environmental temperature should be maintained at about 23 °C, curtains drawn, doors and windows closed, and lighting facilities turned off. The scanning head is positioned 12.5 cm from the kidney, with an image acquisition rate of 5 images per second.
Biochemical indicators
Sample collection
Prior to euthanasia, urine samples were collected from each group of mice under fasting conditions using metabolic cages and stored at −80 °C for the analysis of 24-hour urinary microalbumin (24 h mALB), transferrin (TRF), β2-microglobulin (β2-MG), and monocyte chemoattractant protein-1 (MCP-1).
Immunoturbidimetry
The concentration of mALB in mouse urine over 24 h was determined using a Urine microalbumin assay kit (Nanjing Jiancheng Bioengineering Institute, #E038-1-1, China) and measured with a UV-visible spectrophotometer (Beijing Puxi General Instrument Co., Ltd, #T6, China).
Enzyme-Linked Immunosorbent Assays (ELISA)
The concentrations of TRF and β2-MG in mouse urine were determined using a Mouse TRF ELISA Kit (Shanghai Tongwei Industry Co., Ltd, #TW11435, China) and a Mouse β2-MG ELISA Kit (Shanghai Tongwei Industry Co., Ltd, #TW8471, China), respectively, measured with a microplate reader (Thermofischer MULTISKAN FC, America). The concentration of MCP-1 in mouse urine was determined using a Mouse MCP-1 ELISA Kit (ZCIBIO Technology Co., Ltd, #ZC38075, China) and measured with an ELISA analyzer (Rayto, #RT-6100, China).
Histological analysis
Evaluation of renal pathological changes
Mice were euthanized by an overdose of isoflurane anesthesia, kidneys were immediately harvested and fixed in 10 % neutral buffered formalin for 24–48 h, dehydrated in graded alcohols, cleared in xylene, and embedded in paraffin. Sections of 3 μm thickness were cut and stained with Hematoxylin and Eosin (HE). Twenty fields per mouse were randomly selected and examined at 400× magnification under a light microscope (Olympus, #BX53, Japan) to evaluate renal pathological changes.
Evaluation of renal fibrosis
Paraffin-embedded kidney sections were stained with Masson’s trichrome to observe positive staining areas. At 400× magnification under a light microscope (Olympus, #BX53, Japan), twenty fields per mouse were randomly selected, and collagen deposition was semi-quantitatively analyzed using Image J 2.1.0 software. The ratio of Masson’s trichrome-positive area to the total field area was calculated to evaluate the extent of renal fibrosis.
Assessment of renal glycogen deposition
Paraffin-embedded kidney sections were stained with Periodic Acid-Schiff (PAS) to observe positive staining areas at 400× magnification under a light microscope (Olympus, #BX53, Japan), twenty fields per mouse were randomly selected, and glycogen deposition was semi-quantitatively analyzed using Image J 2.1.0 software. The ratio of PAS-positive area to the total field area was calculated to assess changes in glycogen deposition.
Statistical analysis
Statistical analyses were performed using SPSS 26.0. The measurement data were expressed as mean ± standard deviation (SD). If the data followed a normal distribution and passed the homogeneity of variance test, an independent t-test was used for comparisons between groups, and ANOVA was used for comparisons at different time points within the same group. Non-parametric tests were used to compare non-normally distributed data between groups. Results with P<0.05 were considered statistically significant. Pearson correlation was used to determine the correlation between RBP and indicators such as 24 h mALB, TRF, β2-MG, MCP-1, renal fibrosis, and glycogen deposition.
Results
Baseline parameters
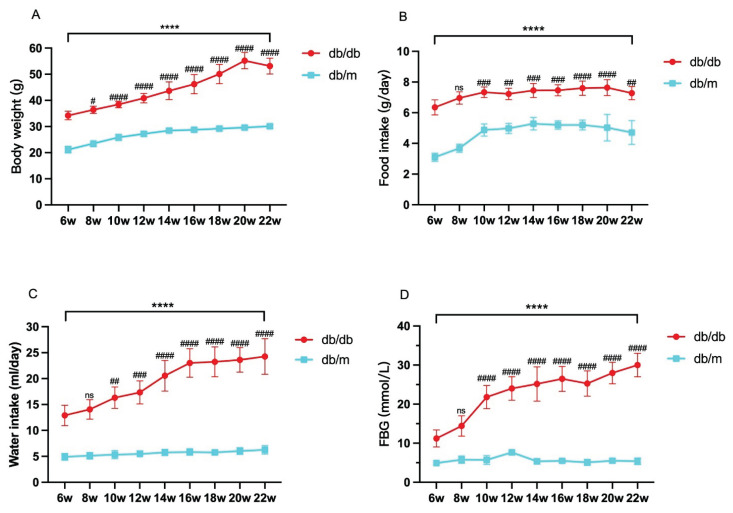
The body weight, average daily food intake, average daily water intake, and FBG levels of db/db mice at each age were significantly higher than those of age-matched db/m mice (P<0.05), showing a progressive increase with the age of db/db mice (Fig. 1A–D).
Fig. 1.
Monitoring mouse weight (A), average daily food intake (B), average daily water intake (C), and fasting blood glucose (FBG) (D) at 6, 8, 10, 12, 14, 16, 18, 20, and 22 weeks of age. Data are expressed as mean ± standard deviation (SD), n=6–8. Compared with age-matched db/m mice, **** indicates P<0.0001; compared with 6W-db/db, # indicates P<0.05, ## indicates P<0.01, ### indicates P<0.001, #### indicates P<0.0001, and ns indicates not significant.
Oral Glucose Tolerance Test (OGTT)
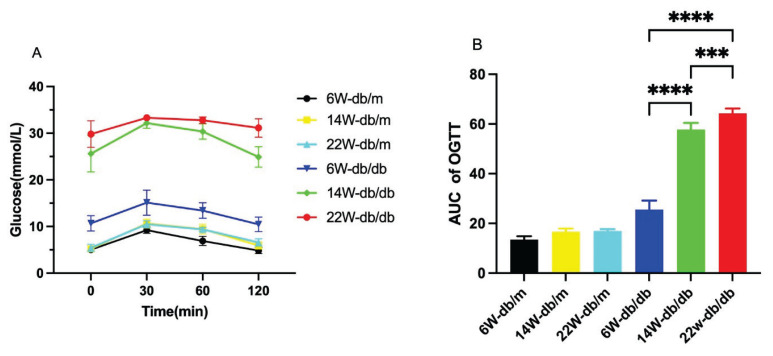
db/m mice performed better in the OGTT, with no difference among the ages, while db/db mice showed worsening performance with age (P<0.05, Fig. 2A). There was no difference in the area under the curve (AUC) among db/m mice of different ages, while the AUC increased with age in db/db mice (P<0.05, Fig. 2B).
Fig. 2.
Blood glucose response curves (A) and area under the curve (AUC) (B) for the Oral Glucose Tolerance Test (OGTT) of each group of mice. Data are expressed as mean ± standard deviation (SD), n=6. For B: *** P<0.001; **** P<0.0001.
Renal Blood Perfusion (RBP)
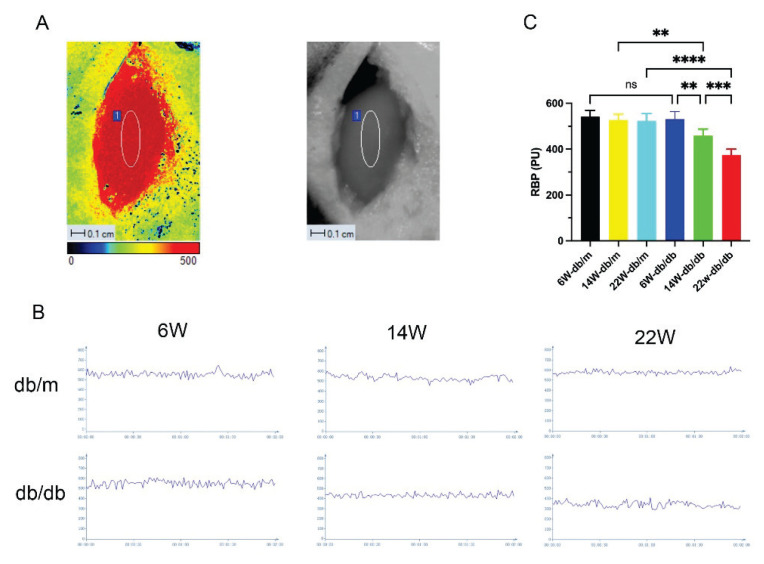
LSCI detected no difference in RBP among db/m mice of different ages. Compared to db/m mice, the average RBP of db/db mice at 14 and 22 weeks of age was significantly reduced (P<0.05), and RBP showed a progressive decline with the age of db/db mice (P<0.05, Fig. 3C).
Fig. 3.
Live images of mice renal blood perfusion (RBP) detected by laser speckle contrast imaging (LSCI) (A); real-time RBP images (B) and RBP bar graphs (C) for each group of mice. Data are expressed as mean ± standard deviation (SD), n=6. For C: ** P<0.01; *** P<0.001; **** P<0.0001; ns, not significant.
Biochemical indicators
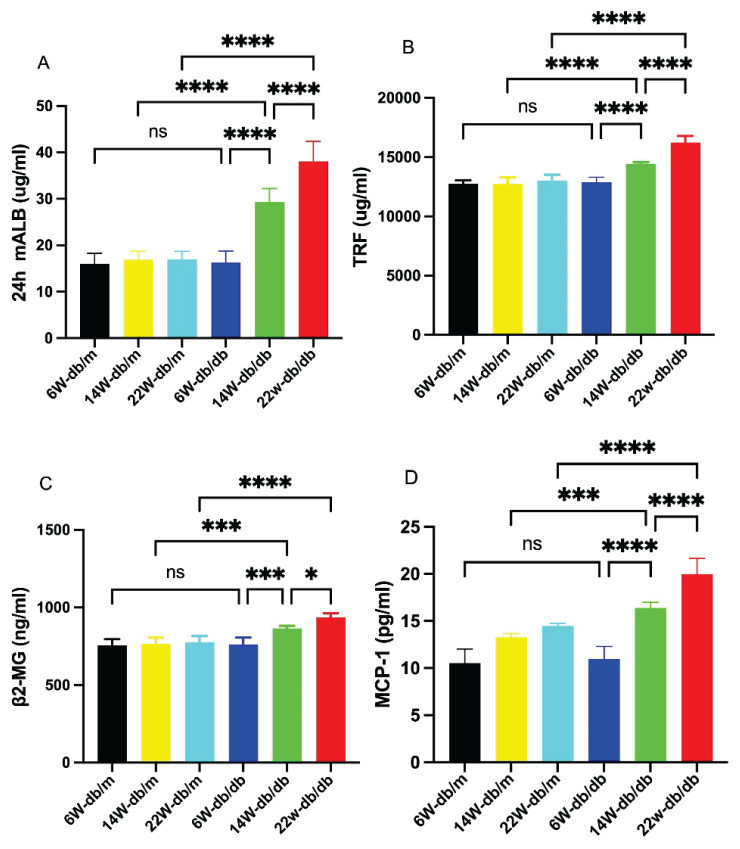
Immunoturbidimetry detected the concentration of 24 h mALB, revealing no difference among db/m mice of various ages. Compared to db/m mice, the concentration significantly increased in db/db mice at 14 and 22 weeks of age (P<0.05), and showed a progressive increase with the age of db/db mice (P<0.05, Fig. 4A).
Fig. 4.
Bar graphs showing concentrations of 24-hour urinary microalbumin (24 h mALB), transferrin (TRF), β2-microglobulin (β2-MG), and monocyte chemoattractant protein-1 (MCP-1) in each group of mice (A–D). Data are expressed as mean ± standard deviation (SD), n=6. * P<0.05; *** P<0.001; **** P<0.0001; ns, not significant.
ELISA was used to measure the concentrations of TRF, β2-MG, and MCP-1, showing no difference among db/m mice of different ages. Compared to db/m mice, the concentrations of these markers were significantly increased in db/db mice at 14 and 22 weeks of age (P<0.05), and showed a progressive increase with the age of db/db mice (P<0.05, Fig. 4B–D).
Pathological changes
Renal pathological changes in db/db mice of different ages
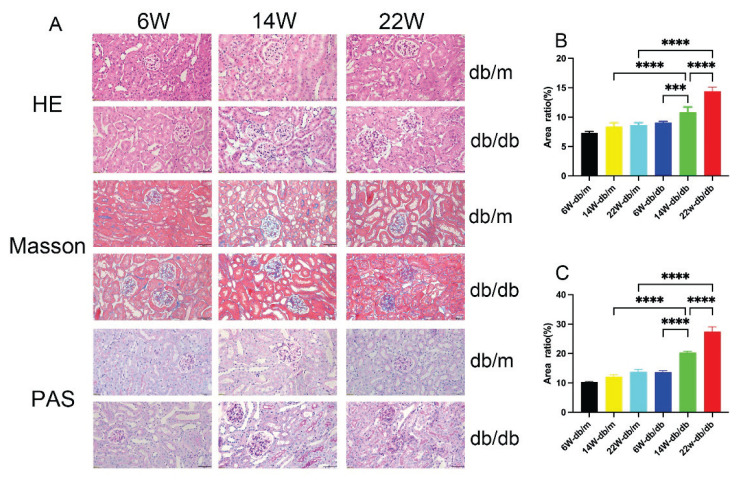
HE staining results showed: The renal tissue structure of db/m mice at all ages was normal, with regular morphology without atrophy or hypertrophy, orderly cell arrangement, and no inflammatory cell infiltration or cell proliferation. Compared to db/m mice, 6-week-old db/db mice showed no significant pathological changes; compared to 6-week-old db/db mice, 14-week-old db/db mice had enlarged and irregularly shaped glomeruli, increased and disordered glomerular cells with inflammatory cell infiltration, dilated capillaries, narrowing of the renal capsular space, and epithelial cells of renal tubules showing edema and vacuolar degeneration. 22-week-old db/db mice exhibited thickening of the capillary walls and tumor-like expansions, with diffuse and mild nodular sclerosis occurring in the mesangial areas (Fig. 5A).
Fig. 5.
Kidney tissue Hematoxylin and Eosin (HE) staining, Masson’s trichrome staining, and Periodic Acid-Schiff (PAS) staining of each group of mice (A), Scale bar = 50 μm, 400× magnification. Bar graphs of semi-quantitative analysis using Image J of the ratio of positive area to total field area for Masson’s trichrome and PAS staining (B–C). Data are expressed as mean ± standard deviation (SD), n=6. For B and C: *** P<0.001; **** P<0.0001.
Renal fibrosis in db/db mice of different ages
Masson’s trichrome staining revealed no significant collagen deposition in db/m mice and 6-week-old db/db mice, but extensive collagen fibers were present in the interstitium and glomeruli of 14-week-old and 22-week-old db/db mice (Fig 5A). Quantitative analysis of collagen fiber deposition showed a significantly higher ratio of stained positive area to total field area in 14-week-old and 22-week-old db/db mice compared to db/m mice of the same age (P<0.05). The ratio significantly increased with the age of db/db mice (P<0.05, Fig. 5B).
Changes in renal glycogen deposition in db/db mice of different ages
PAS staining showed no significant glycogen deposition in db/m mice and 6-week-old db/db mice, but clear increases in 14-week-old and 22-week-old db/db mice (Fig. 5A). Quantitative analysis of glycogen deposition showed a significantly higher ratio of stained positive area to total field area in 14-week-old and 22-week-old db/db mice compared to db/m mice of the same age (P<0.05). This ratio significantly increased with the age of db/db mice (P<0.05, Fig. 5C).
Strong correlation between RBP and the extent of renal damage in db/db mice
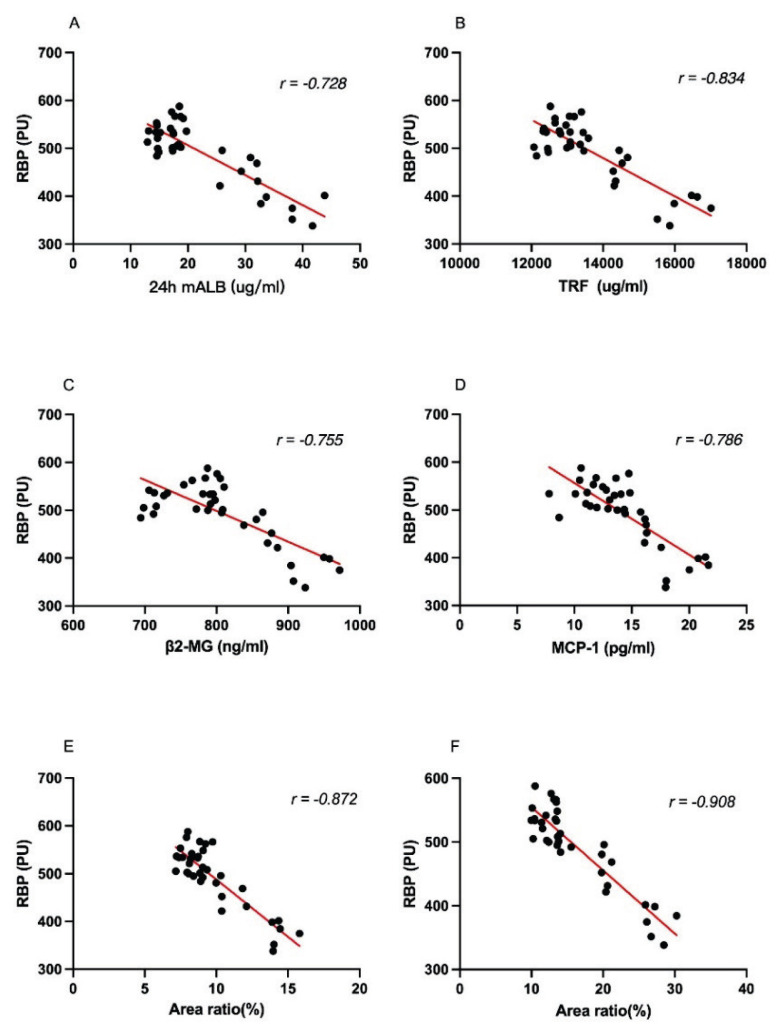
There was a strong negative correlation between RBP and 24 h mALB (r=−0.728), TRF (r=−0.834), β2-MG (r=−0.755), MCP-1 (r=−0.786), Masson’s trichrome staining (r=−0.872), and PAS staining (r=−0.908) (Fig. 6A–F).
Fig. 6.
Correlation analysis of RBP with the ratio of positive areas of 24 h mALB, TRF, β2-MG, MCP-1, Masson’s trichrome staining, and PAS staining to the total field of view (A–F).
Discussion
Studies have shown that male db/db mice on a C57BLKS/J background begin to exhibit elevated blood glucose levels at 4 weeks of age, rapidly develop hyperglycemia between 6–10 weeks, exhibit albuminuria at 10–12 weeks, and display evident albuminuria and late-stage T2DM kidney injury characteristics at 20 weeks [16,18,19]. Researchers often choose 12, 14, or 16-week-old db/db mice for early-stage DN studies [19–23], as these mice share similar pathological features with early-stage human DN. At the early stages of DN, db/db mice exhibit glomerular enlargement and mesangial matrix expansion [24]. Some researchers use 18-week-old db/db mice as an animal model for late-stage DN [25]. Based on these research advancements, our study selected 6-week-old (hyperglycemic), 14-week-old (early DN), and 22-week-old (late DN) db/db mice as experimental subjects.
Biomarkers play a crucial role in the early detection of DN, with microalbuminuria (mALB) being the most notable, reflecting damage to both glomeruli and tubules. mALB is also a marker of the endothelial dysfunction prevalent in DM, making it a gold standard biomarker for DN [26]. Research has found that TRF levels in urine of patients with T2DM and normoalbuminuria (before the appearance of microalbuminuria) are elevated, thus considered a biomarker for early glomerular damage in DN [26,27]. Additionally, an increase in urine β2-MG precedes the occurrence of mALB, leading to suggestions of using a panel of urinary markers, including β2-MG, for early DN diagnosis [28]. Macrophages play a crucial role in kidney fibrosis, with their accumulation in T2DM kidneys signaling a decline in renal function. The absence of MCP-1 in db/db mice reduces macrophage infiltration and histological damage [29]. Further research has found increased levels of MCP-1 in serum and urine in early DN, suggesting potential roles as biomarkers and mediators in DN progression [30]. Our study assessed the extent of T2DM kidney damage using these four urinary biomarkers and renal pathological changes, finding that 24 h mALB, TRF, β2-MG, and MCP-1 levels increased with mouse age, indicating ongoing renal function decline. H&E staining revealed progressively worsening kidney tissue damage with age, while Masson’s trichrome and PAS staining showed increasing fibrosis and glycogen deposition, respectively.
Several methods exist for measuring RBP, including ultrasound contrast for early T2DM kidney damage assessment [31], arterial spin labeling magnetic resonance imaging for early DN hemodynamic changes [32], color Doppler ultrasound for renal cortical perfusion measurement in patients with renal insufficiency [33], and laser Doppler for microvascular function evaluation [34]. We used LSCI to measure RBP, a technique increasingly applied in hemodynamics research [12,35]. It can achieve high-resolution, non-contact, non-invasive, real-time monitoring of tissue perfusion dynamics, without the need for contrast agents, fluorescent agents, or other substances, making its operation straightforward [36–38]. However, LSCI does have certain limitations, as it is restricted to measuring blood flow in superficial tissues and cannot assess blood flow in deep tissues [37].
In this study, the RBP of db/db mice decreased as their age increased. One reason for the decrease in RBP is the excessive production of angiotensin II following the activation of the renin-angiotensin-aldosterone system (RAAS), which continuously acts on the efferent arterioles of the glomeruli, causing a greater influx than outflow in the afferent arterioles and leading to an increase in glomerular internal pressure [39,40]. As the internal pressure of the glomerulus rises, so does its perfusion resistance [31]. Persistent low perfusion may also exacerbate kidney damage in db/db mice. At 6 weeks of age, there was hardly any difference in renal damage indicators between db/db and db/m mice, but by 14 weeks of age, there was a significant difference between db/db and db/m mice (P<0.05), likely due to persistent low perfusion. We conducted a correlation analysis between mouse RBP and 24 h mALB, TRF, β2-MG, and MCP-1, finding significant negative correlations between them. Sustained low perfusion can lead to hypoxia in MCs, an increase in extracellular matrix production, and gradual accumulation of collagen fibers [41]. A correlation analysis between the Masson’s trichrome staining positive area ratio to the total field of view and RBP resulted in a Wilson coefficient of −0.872, indicating a significant negative correlation and suggesting that persistent low perfusion might increase collagen fiber deposition.
In this study, the RBP of 6-week-old db/db mice and db/m mice of various ages showed no significant difference, but at 14 and 22 weeks of age, the RBP of db/db mice significantly decreased (P<0.05), indicating that worsening kidney damage could exacerbate the decrease in RBP. Some studies suggest that the irreversible loss of RBP and function in the later stages of DN is due to impaired vascular homeostasis and nitric oxide production [42]. Uncontrolled T2DM endothelial dysfunction in the later stages leads to the loss of glomerular capillaries, a decrease in the cross-sectional area of the renal vasculature, and ultimately a reduction in RBP [43].
This study confirmed a strong correlation between RBP and kidney damage indicators in T2DM mice, highlighting the importance of microcirculatory disorder in understanding DN pathogenesis. However, it did not establish a causal relationship, which we aim to address in future research.
Acknowledgements
The authors thank academician Bin Cong of the Chinese Academy of Engineering for his support and help in the project design. This work was funded by Major Special Project of National Natural Science Foundation of China (grant number 32141005) and Hebei Province Graduate Innovation Funding Project (grant number XCXZZBS2024001).
Footnotes
Conflict of Interest: There is no conflict of interest.
References
- 1.Ahmad E, Lim S, Lamptey R, Webb DR, Davies MJ. Type 2 diabetes. Lancet. 2022;400:1803–1820. doi: 10.1016/S0140-6736(22)01655-5. [DOI] [PubMed] [Google Scholar]
- 2.Thipsawat S. Early detection of diabetic nephropathy in patient with type 2 diabetes mellitus: A review of the literature. Diab Vasc Dis Res. 2021;18:14791641211058856. doi: 10.1177/14791641211058856. [DOI] [PMC free article] [PubMed] [Google Scholar]
- 3.Maekawa M, Maekawa T, Sasase T, Takagi K, Takeuchi S, Kitamoto M, Nakagawa T, Toyoda K, Konishi N, Ohta T, Yamada T. Pathophysiological analysis of uninephrectomized db/db mice as a model of severe diabetic kidney disease. Physiol Res. 2022;71:209–217. doi: 10.33549/physiolres.934784. [DOI] [PMC free article] [PubMed] [Google Scholar]
- 4.Mohandes S, Doke T, Hu H, Mukhi D, Dhillon P, Susztak K. Molecular pathways that drive diabetic kidney disease. J Clin Invest. 2023;133:e165654. doi: 10.1172/JCI165654. [DOI] [PMC free article] [PubMed] [Google Scholar]
- 5.Pang X, Zhang Y, Peng Z, Shi X, Han J, Xing Y. Hirudin reduces nephropathy microangiopathy in STZ-induced diabetes rats by inhibiting endothelial cell migration and angiogenesis. Life Sci. 2020;255:117779. doi: 10.1016/j.lfs.2020.117779. [DOI] [PubMed] [Google Scholar]
- 6.Guan Z, Makled MN, Inscho EW. Purinoceptors, renal microvascular function and hypertension. Physiol Res. 2020;69:353–369. doi: 10.33549/physiolres.934463. [DOI] [PMC free article] [PubMed] [Google Scholar]
- 7.Futrakul N, Futrakul P. Biomarker for early renal microvascular and diabetic kidney diseases. Ren Fail. 2017;39:505–511. doi: 10.1080/0886022X.2017.1323647. [DOI] [PMC free article] [PubMed] [Google Scholar]
- 8.Nangaku M. Chronic hypoxia and tubulointerstitial injury: a final common pathway to end-stage renal failure. J Am Soc Nephrol. 2006;17:17–25. doi: 10.1681/ASN.2005070757. [DOI] [PubMed] [Google Scholar]
- 9.Chinese Association of Diabetes and Microcirculation Chinese experts consensus for drug therapy of microcirculatory dysfunction in diabetes mellitus: 2021 updated Chinese J Front Med Sci (Electronic Version) 20211349–57.. [Google Scholar]
- 10.Okada H, Tanaka M, Yasuda T, Okada Y, Norikae H, Fujita T, Nishi T, et al. Decreased microcirculatory function measured by perfusion index is a novel indicator of diabetic kidney disease in patients with type 2 diabetes. J Diabetes Investig. 2020;11:681–687. doi: 10.1111/jdi.13193. [DOI] [PMC free article] [PubMed] [Google Scholar]
- 11.Zhao P, Li N, Lin L, Li Q, Wang Y, Luo Y. Correlation between serum cystatin C level and renal microvascular perfusion assessed by contrast-enhanced ultrasound in patients with diabetic kidney disease. Ren Fail. 2022;44:1732–1740. doi: 10.1080/0886022X.2022.2134026. [DOI] [PMC free article] [PubMed] [Google Scholar]
- 12.Lee B, Sosnovtseva O, Sørensen CM, Postnov DD. Multi-scale laser speckle contrast imaging of microcirculatory vasoreactivity. Biomed Opt Express. 2022;13:2312–2322. doi: 10.1364/BOE.451014. [DOI] [PMC free article] [PubMed] [Google Scholar]
- 13.Tew GA, Klonizakis M, Crank H, Briers JD, Hodges GJ. Comparison of laser speckle contrast imaging with laser Doppler for assessing microvascular function. Microvasc Res. 2011;82:326–332. doi: 10.1016/j.mvr.2011.07.007. [DOI] [PubMed] [Google Scholar]
- 14.Heeman W, Maassen H, Calon J, van Goor H, Leuvenink H, van Dam GM, Boerma EC. Real-time visualization of renal microperfusion using laser speckle contrast imaging. J Biomed Opt. 2021;26:056004. doi: 10.1117/1.JBO.26.5.056004. [DOI] [PMC free article] [PubMed] [Google Scholar]
- 15.Fellmann L, Nascimento AR, Tibiriça E, Bousquet P. Murine models for pharmacological studies of the metabolic syndrome. Pharmacol Ther. 2013;137:331–340. doi: 10.1016/j.pharmthera.2012.11.004. [DOI] [PubMed] [Google Scholar]
- 16.Tesch GH, Lim AK. Recent insights into diabetic renal injury from the db/db mouse model of type 2 diabetic nephropathy. Am J Physiol Renal Physiol. 2011;300:F301–F310. doi: 10.1152/ajprenal.00607.2010. [DOI] [PubMed] [Google Scholar]
- 17.Wu Y, Sun B, Guo X, Wu L, Hu Y, Qin L, Yang T, et al. Zishen Pill alleviates diabetes in Db/db mice via activation of PI3K/AKT pathway in the liver. Chin Med. 2022;17:128. doi: 10.1186/s13020-022-00683-8. [DOI] [PMC free article] [PubMed] [Google Scholar]
- 18.Thomsen LH, Fog-Tonnesen M, Nielsen Fink L, Norlin J, García de Vinuesa A, Hansen TK, de Heer E, et al. Disparate phospho-Smad2 levels in advanced type 2 diabetes patients with diabetic nephropathy and early experimental db/db mouse model. Ren Fail. 2017;39:629–642. doi: 10.1080/0886022X.2017.1361837. [DOI] [PMC free article] [PubMed] [Google Scholar]
- 19.Wang F, Fan J, Pei T, He Z, Zhang J, Ju L, Han Z, Wang M, Xiao W. Effects of Shenkang Pills on Early-Stage Diabetic Nephropathy in db/db Mice via Inhibiting AURKB/RacGAP1/RhoA Signaling Pathway. Front Pharmacol. 2022;13:781806. doi: 10.3389/fphar.2022.781806. [DOI] [PMC free article] [PubMed] [Google Scholar]
- 20.Luo B, Wen S, Chen YC, Cui Y, Gao FB, Yao YY, Ju SH, Teng GJ. LOX-1-Targeted Iron Oxide Nanoparticles Detect Early Diabetic Nephropathy in db/db Mice. Mol Imaging Biol. 2015;17:652–660. doi: 10.1007/s11307-015-0829-5. [DOI] [PubMed] [Google Scholar]
- 21.Xu Z, Dai XX, Zhang QY, Su SL, Yan H, Zhu Y, Shang EX, Qian DW, Duan JA. Protective effects and mechanisms of Rehmannia glutinosa leaves total glycoside on early kidney injury in db/db mice. Biomed Pharmacother. 2020;125:109926. doi: 10.1016/j.biopha.2020.109926. [DOI] [PubMed] [Google Scholar]
- 22.Wang WX, Luo SB, Jiang P, Xia MM, Hei AL, Mao YH, Li CB, Hu GX, Cai JP. Increased Oxidative Damage of RNA in Early-Stage Nephropathy in db/db Mice. Oxid Med Cell Longev. 2017;2017:2353729. doi: 10.1155/2017/2353729. [DOI] [PMC free article] [PubMed] [Google Scholar]
- 23.Tamura Y, Murayama T, Minami M, Matsubara T, Yokode M, Arai H. Ezetimibe ameliorates early diabetic nephropathy in db/db mice. J Atheroscler Thromb. 2012;19:608–618. doi: 10.5551/jat.11312. [DOI] [PubMed] [Google Scholar]
- 24.Sharma K, McCue P, Dunn SR. Diabetic kidney disease in the db/db mouse. Am J Physiol Renal Physiol. 2003;284:F1138–F1144. doi: 10.1152/ajprenal.00315.2002. [DOI] [PubMed] [Google Scholar]
- 25.Loeffler I, Rüster C, Franke S, Liebisch M, Wolf G. Erythropoietin ameliorates podocyte injury in advanced diabetic nephropathy in the db/db mouse. Am J Physiol Renal Physiol. 2013;305:F911–F918. doi: 10.1152/ajprenal.00643.2012. [DOI] [PubMed] [Google Scholar]
- 26.Gluhovschi C, Gluhovschi G, Petrica L, Timar R, Velciov S, Ionita I, Kaycsa A, Timar B. Urinary Biomarkers in the Assessment of Early Diabetic Nephropathy. J Diabetes Res. 2016;2016:4626125. doi: 10.1155/2016/4626125. [DOI] [PMC free article] [PubMed] [Google Scholar]
- 27.Narita T, Sasaki H, Hosoba M, Miura T, Yoshioka N, Morii T, Shimotomai T, Koshimura J, Fujita H, Kakei M, Ito S. Parallel increase in urinary excretion rates of immunoglobulin G, ceruloplasmin, transferrin, and orosomucoid in normoalbuminuric type 2 diabetic patients. Diabetes Care. 2004;27:1176–1181. doi: 10.2337/diacare.27.5.1176. [DOI] [PubMed] [Google Scholar]
- 28.Ekrikpo UE, Effa EE, Akpan EE, Obot AS, Kadiri S. Clinical Utility of Urinary β2-Microglobulin in Detection of Early Nephropathy in African Diabetes Mellitus Patients. Int J Nephrol. 2017;2017:4093171. doi: 10.1155/2017/4093171. [DOI] [PMC free article] [PubMed] [Google Scholar]
- 29.Haller H, Bertram A, Nadrowitz F, Menne J. Monocyte chemoattractant protein-1 and the kidney. Curr Opin Nephrol Hypertens. 2016;25:42–49. doi: 10.1097/MNH.0000000000000186. [DOI] [PubMed] [Google Scholar]
- 30.Scurt FG, Menne J, Brandt S, Bernhardt A, Mertens PR, Haller H, Chatzikyrkou C. Monocyte chemoattractant protein-1 predicts the development of diabetic nephropathy. Diabetes Metab Res Rev. 2022;38:e3497. doi: 10.1002/dmrr.3497. [DOI] [PubMed] [Google Scholar]
- 31.Dong Y, Wang WP, Lin P, Fan P, Mao F. Assessment of renal perfusion with contrast-enhanced ultrasound: Preliminary results in early diabetic nephropathies. Clin Hemorheol Microcirc. 2016;62:229–238. doi: 10.3233/CH-151967. [DOI] [PubMed] [Google Scholar]
- 32.Mora-Gutiérrez JM, Garcia-Fernandez N, Slon Roblero MF, Páramo JA, Escalada FJ, Wang DJ, Benito A, Fernández-Seara MA. Arterial spin labeling MRI is able to detect early hemodynamic changes in diabetic nephropathy. J Magn Reson Imaging. 2017;46:1810–1817. doi: 10.1002/jmri.25717. [DOI] [PubMed] [Google Scholar]
- 33.Lubas A, Zegadło A, Frankowska E, Klimkiewicz J, Jędrych E, Niemczyk S. Ultrasound Doppler Flow Parameters Are Independently Associated with Renal Cortex Contrast-Enhanced Multidetector Computed Tomography Perfusion and Kidney Function. J Clin Med. 2023;12:2111. doi: 10.3390/jcm12062111. [DOI] [PMC free article] [PubMed] [Google Scholar]
- 34.Cracowski JL, Minson CT, Salvat-Melis M, Halliwill JR. Methodological issues in the assessment of skin microvascular endothelial function in humans. Trends Pharmacol Sci. 2006;27:503–508. doi: 10.1016/j.tips.2006.07.008. [DOI] [PubMed] [Google Scholar]
- 35.Legrand M, Bezemer R, Kandil A, Demirci C, Payen D, Ince C. The role of renal hypoperfusion in development of renal microcirculatory dysfunction in endotoxemic rats. Intensive Care Med. 2011;37:1534–1542. doi: 10.1007/s00134-011-2267-4. [DOI] [PMC free article] [PubMed] [Google Scholar]
- 36.Konovalov A, Gadzhiagaev V, Grebenev F, Stavtsev D, Piavchenko G, Gerasimenko A, Telyshev D, Meglinski I, Eliava S. Laser Speckle Contrast Imaging in Neurosurgery: A Systematic Review. World Neurosurg. 2023;171:35–40. doi: 10.1016/j.wneu.2022.12.048. [DOI] [PubMed] [Google Scholar]
- 37.Dunn AK. Laser speckle contrast imaging of cerebral blood flow. Ann Biomed Eng. 2012;40:367–377. doi: 10.1007/s10439-011-0469-0. [DOI] [PMC free article] [PubMed] [Google Scholar]
- 38.Zhai L, Fu Y, Du Y.Advances in Laser Speckle Contrast Imaging: Key Techniques and Applications Chin J Lasers 20235052–79.. [Google Scholar]
- 39.Ambinathan JPN, Sridhar VS, Lytvyn Y, Lovblom LE, Liu H, Bjornstad P, Perkins BA, et al. Relationships between inflammation, hemodynamic function and RAAS in longstanding type 1 diabetes and diabetic kidney disease. J Diabetes Complications. 2021;35:107880. doi: 10.1016/j.jdiacomp.2021.107880. [DOI] [PubMed] [Google Scholar]
- 40.Samsu N. Diabetic Nephropathy: Challenges in Pathogenesis, Diagnosis, and Treatment. Biomed Res Int. 2021;2021:1497449. doi: 10.1155/2021/1497449. [DOI] [PMC free article] [PubMed] [Google Scholar]
- 41.Hou B, Ma P, Yang X, Zhao X, Zhang L, Zhao Y, He P, Zhang L, Du G, Qiang G. In silico prediction and experimental validation to reveal the protective mechanism of Puerarin against excessive extracellular matrix accumulation through inhibiting ferroptosis in diabetic nephropathy. J Ethnopharmacol. 2024;319:117281. doi: 10.1016/j.jep.2023.117281. [DOI] [PubMed] [Google Scholar]
- 42.Futrakul N, Kulaputana O, Futrakul P, Chavanakul A, Deekajorndech T. Enhanced peritubular capillary flow and renal function can be accomplished in normoalbuminuric type 2 diabetic nephropathy. Ren Fail. 2011;33:312–315. doi: 10.3109/0886022X.2011.560405. [DOI] [PubMed] [Google Scholar]
- 43.Futrakul N, Butthep P, Futrakul P, Sitprija V. Improvement of renal function in type 2 diabetic nephropathy. Ren Fail. 2007;29:155–158. doi: 10.1080/08860220601095835. [DOI] [PubMed] [Google Scholar]


