

Abstract
Breast cancer is an alarming global health concern, including a vast and varied set of illnesses with different molecular characteristics. The fusion of sophisticated computational methodologies with extensive biological datasets has emerged as an effective strategy for unravelling complex patterns in cancer oncology. This research delves into breast cancer staging, classification, and diagnosis by leveraging the comprehensive dataset provided by the The Cancer Genome Atlas (TCGA). By integrating advanced machine learning algorithms with bioinformatics analysis, it introduces a cutting-edge methodology for identifying complex molecular signatures associated with different subtypes and stages of breast cancer. This study utilizes TCGA gene expression data to detect and categorize breast cancer through the application of machine learning and systems biology techniques. Researchers identified differentially expressed genes in breast cancer and analyzed them using signaling pathways, protein–protein interactions, and regulatory networks to uncover potential therapeutic targets. The study also highlights the roles of specific proteins (MYH2, MYL1, MYL2, MYH7) and microRNAs (such as hsa-let-7d-5p) that are the potential biomarkers in cancer progression founded on several analyses. In terms of diagnostic accuracy for cancer staging, the random forest method achieved 97.19%, while the XGBoost algorithm attained 95.23%. Bioinformatics and machine learning meet in this study to find potential biomarkers that influence the progression of breast cancer. The combination of sophisticated analytical methods and extensive genomic datasets presents a promising path for expanding our understanding and enhancing clinical outcomes in identifying and categorizing this intricate illness.
Keywords: breast cancer, TCGA, cancer staging, ontology, machine learning, transcription factors
Introduction
Breast cancer is the second most common cancer among women, following skin cancer, and is the second leading cause of cancer-related mortality, after lung cancer [1]. Globally, breast cancer has surpassed lung cancer as the most frequently diagnosed cancer in women. In 2020, an estimated 2 261 419 women worldwide were diagnosed with breast cancer [2]. According to the American Society for Clinical Oncology, it is projected that in 2023, 297 790 women in the USA will be diagnosed with invasive breast cancer, while 55 720 will be diagnosed with noninvasive (in situ) breast cancer. Since the mid-2000s, the incidence of invasive breast cancer in women has increased by ~0.5% annually, likely driven by factors such as declining fertility rates, delayed age of first childbirth, and rising obesity rates. Additionally, invasive breast cancer is expected to affect ~2800 men in the USA in 2023 [3]. Early detection of breast cancer is critical for selecting appropriate treatments and reducing the risk of metastasis [4]. Breast cancer is a heterogeneous and evolving disease, marked by various somatic mutations and changes in gene and protein expression. It is classified into several subtypes based on the expression of the progesterone receptor (PR), estrogen receptor (ER), and human epidermal growth factor receptor 2 (HER2). Each subtype requires specific treatment approaches, which can affect drug resistance, cancer recurrence, and mortality rates [5, 6]. Identifying novel clinical biomarkers is essential for better patient stratification; enhancing the accuracy of initial diagnoses; and monitoring the progression, metastasis, and recurrence of breast cancer [7].
In present days, tumor markers have become increasingly prevalent in areas of cancer detection and therapy. For tumor screening, diagnosis, efficacy and prognosis evaluation, recurrence detection, and so forth, the optimal tumor marker should possess high specificity and the ability to recognize tiny lesions and quantify the tumor burden [8]. Staging a cancer is the process of quantifying the extent of the cancer’s metastasis throughout the body. The process of measuring and evaluating the extent to which cancer has progressed to various sections of the body is referred to as cancer staging. It is helpful in choosing the most efficient kind of therapy as well as detecting the degree to which the cancer has spread. Additionally, it is used by physicians in the process of calculating survival rates. The Joint Working Committee for Cancer Tumor-Lymph Node-Metastasis states that there are typically five different stages of cancer: Stages 0, I, II, III, and IV [9].In addition to determining the cancer’s size and location, the stage of the disease will also impact the existence of indicators of cancer spread and how much cancer has progressed to neighboring tissues, lymph nodes, and other body regions [10]. For individuals between the ages of 18 and 55 who suffer from breast cancer, with the greatest grade detected at stage I, the 5-year survival rate is 97% and can be cured with the right care, whereas the projected 5-year survival rates of stages II, III, and IV are 92%, 77%, and 28%, respectively [11]. Among all cancers, breast cancer mutations are the most prevalent and lethal. A patient’s chances of survival are significantly increased when the illness is identified in its early stages [12].
Machine learning could uncover correlations that are difficult to recognize in vast, noisy, or complicated datasets. This skill is specifically appropriate for data analysis applications in the healthcare sector, particularly those requiring intricate proteomics and genomic expression–based applications, which have been employed commonly in recent years for the identification and treatment of cancer [13]. In the medical area, machine learning techniques are commonly employed including random forests (RFs) [14], support vector machine (SVM) [15–17], and decision trees (DTs) [18, 19]. Applications like Xie et al.’s [20] employed spectral data to create SVM models with an average accuracy of 100% for quick and noninvasive keratitis detection, and SVM and DT models were utilized by Chen et al. [21] to quickly detect gliomas with a predictive accuracy of ~90%. It demonstrates even more that machine learning is more applicable to the diagnosis of diseases. A supervised learning model called SVM is capable of handling both linear and nonlinear problems. It works to address issues with classification and regression. The ultimate class of a test object is determined by combining a collection of DTs that are randomly chosen from the training set. RFs are a powerful force in machine learning because DTs, which are renowned for their adaptability, excel in classification and regression tasks.
In the field of biomedicine, there have been some encouraging results using gene network–based cancer prediction and biomarker screening. Jubair et al.’s [22] subtype-specific network biomarker approach, for example, has demonstrated high predictive effectiveness for identifying the survivorship of breast cancer patients with it. Li et al. [23] constructed a model to predict the prognosis of cervical cancer patients using the weighted gene coexpression network paired alongside the Least Absolute Shrinkage and Selection Operator (LASSO) technique and showed that the approach is legitimate and reliable. In this work, we first performed a differential expression analysis between breast cancer and healthy controls. The LASSO feature selection approach has been employed in a variety of biological applications. Lasso is a well-known feature selection approach that takes into account an L1 type penalty, which places a restriction on the combined value of all absolute values for the feature parameters to ensure global optimal performance as well as computing efficiency [24]. The 2021 IEEE International Conference on Bioinformatics and Biomedicine found that LASSO consistently beats other methods in several key classification parameters, especially the area under the curve (AUC), and that the LASSO framework can generate more meaningful feature selection algorithms relative to similar feature selection methods for features [25]. Furthermore, Maurya et al. [26] effectively utilized the Lasso algorithm in the field of cancer by extracting signature genes by LASSO and other techniques, leading to the discovery of TMEM236—a new biomarker for the detection of colorectal cancer. Additionally, two separate groups of the first three stages of breast cancer were identified to carry out the differential expression analysis: the first stage versus the subsequent three phases and early-stage disease versus advanced or metastatic cancer, respectively [27]. Depending on whether the breast cancer had spread to nearby lymph nodes or somewhere else, it was split into two groups. For the staging groups, differential expression analysis was performed. Following PPI analysis, the final feature genes used for classification were searched for prognostic genes. Breast cancer and breast cancer staging were finally classified using machine learning algorithms such as the SVM, RF, and DTs. In this case, the results of the model constructed using the features we extracted produced better results for the early and late diagnosis of breast cancer, and the prognostic genes that were examined provided further recommendations for the treatment of breast cancer.
This work presents a new strategy in breast cancer research by combining systems biology methods and machine learning algorithms—an unusual combination. In addition to providing a greater understanding of the molecular pathways underlying the disease, this dual approach improves the accuracy of cancer diagnosis and staging. Furthermore, the discovery of certain proteins (MYH2, MYL1, MYL2, MYH7) and microRNAs (hsa-let-7d-5p) linked to the advancement of breast cancer offers new, prospective biomarkers for diagnosis and therapy, opening the door for innovative therapeutic approaches. The work increases our understanding of breast cancer by applying sophisticated computational algorithms to uncover stage-specific genetic markers using the extensive TCGA dataset, one of the biggest cancer datasets available. Some of the significant contributions of our work are outlined as follows:
i) Diagnosis of breast cancer using gene expression profiling data from the TCGA dataset.
ii) Establishment of protein–protein interaction (PPI) network of the differentially expressed genes (DEGs).
iii) Classification of different stages of breast cancer using the TCGA dataset with machine learning analysis.
Materials and methods
Workflow of the analytical approach
To progress the work, we start by acquiring the TCGA-BRCA dataset from the Genomic Data Commons (GDC) portal; RNAseq data and clinical data from TCGA-BRCA are collected and downloaded for further progress. To find the marker genes, we performed an analytical approach presented in Fig. 1. First, we identified the DEGs in the BRCA dataset using the gene expression counts matrix. After this, some DEGs were amended based on potential DEG selection criteria, which is |logFC| > 1.0 & adj.P < 0.05. From the selected DEGs, top 10 unregulated and top 10 downregulated DEGs were used for further examination of PPIs, ontological and enrichment analysis, regulatory analysis, and prediction of drug and chemical compounds. Later on, from survival analysis, the survival curves of the most influential genes from the top 10 up and downregulated genes were found. The identification of signaling and ontological terms was fourth from gene enrichment analysis. Potential hub proteins were identified from the PPI network analysis. TFs (transcription factors) and miRNAs were identified from the gene regulatory network analysis. Furthermore, samples from the TCGA-BRCA project were employed in the experiment for the diagnosis of breast cancer and general health. Following feature extraction, important genes have been selected as diagnostic classification features. SVMs, RF, DTs, XGBoost, and AdaBoost are the classifiers used in this experiment by the researchers.
Figure 1.

Working flowchart of the analytical study performed in this research.
Dataset description
We collected the TCGA-BRCA gene expression data from the GDC portal (https://portal.gdc.cancer.gov/repository). The transcriptome gene expression data from the TCGA-BRCA projects were chosen for this study, and, from these, 1224 samples of 1111 tumor tissue samples and 113 normal tissue samples were obtained for further analysis.
Analysis of differential expression gene
Examining transcriptomic data using differential expression (DE) analysis allows for analyzing variations in gene expression across the entire genome linked to significant biological conditions [28]. DEGs play a vital role in order to gain additional biological insights, such as identifying enriched functional pathways, gene ontologies, and PPI analysis. In this study, the R package limma [29] with |logF C| > 1.0 and adj.P.Val < 0.05 was used to perform the differential expression analysis. Breast cancer tissues were compared to normal tissues to identify genes that were differentially expressed. Later on, the top 10 upregulated and downregulated genes were selected based on the logFC values from the DEGs that were used for analyzing further processes.
Analysis of the enrichment of gene set
A computational and statistical approach known as “gene set enrichment analysis” is typically used to determine if a collection of determined genes exhibits statistical significance under various biological circumstances [30]. The structural and computational data pertaining to gene product–based functions can be found in the Gene Ontology (GO) resources [31]. Molecular function, biological process, and cellular component are the three subcategories of GO that can be used to annotate gene products [32]. In this research, the online web tool “Enrichr” was utilized for performing gene enrichment and ontology analysis. Enrichr is a user-friendly, web-based enrichment analysis application that offers a variety of visualization summaries of the combined activities of gene lists [33]. We assessed the biological relevance of the top 10 upregulated and top 10 downregulated DEGs of BRCA using signaling and gene ontology terms. In gene enrichment analysis, we selected pathways based on adjusted P-value <0.05. The top signaling pathways were found using three databases: Kyoto Encyclopedia of Genes and Genomes (KEGG), BioPlanet, and BioCarta. Top gene ontology terms of molecular function, biological activity, and cellular components were also identified using EnrichR.
Identification hub-bottleneck proteins from protein–protein interaction network
Analysis of PPIs yields prominent insights into the functions of proteins and is considered the first step in systems biology and drug discovery [34]. We utilized the top 10 upregulated and downregulated DEGs of BRCA to design a PPI interaction network using the NetworkAnalyst tool. NetworkAnalyst is a web-based application that allows bench researchers to conduct both simple and complex meta-analyses of gene expression data [35]. We obtained the hub bottleneck genes from PPI analysis by using Cytohubba in Cytoscape software. Cytoscape is an open-source software framework that can integrate complicated network visualizations with any kind of attribute data [36]. Cytohubba is a Cytoscape plugin that can predict and investigate key nodes and subnetworks inside a given network [37]. In a complex PPI network, hub nodes are often identified by their extensive connectivity [38]. Hub nodes play a crucial role in both regulating several biological processes and maintaining the structural integrity of PPI networks.
Analysis of gene regulatory networks
To understand the functions of TFs and microRNAs (miRNAs), which play a significant role in modifying the expression of DEGs linked to breast cancers, the gene regulatory network analysis was performed. Comprehensive studies are completed with the help of the online tool NetworkAnalyst [35], which utilizes databases like the TarBase [39] and miRTarBase [40] for DEG–miRNA interactions and the JASPAR database [41] for TF-DEGs interactions. The target of these experiments is to gain a clear concept of the complex transcriptional and post-transcriptional regulatory mechanisms affecting gene expression in breast cancer. Understanding the molecular mechanisms underlying the pathogenesis of breast cancer is improved by defining these regulatory relationships.
Prediction of drugs and chemical compounds
Using the top 10 upregulated and downregulated genes of BRCA, we were able to create networks of interactions between proteins and chemicals and drugs in this analysis. The combined protein–drug and protein–chemical interactions are obtained using the NetworkAnalyst web tool. Analyzing protein–drug interactions is crucial to comprehending the structural features required for receptor sensitivity [42]. Protein–chemical interaction analysis is essential for advancing our understanding of biology, accelerating drug discovery efforts, and improving diagnostics and treatments for various diseases.
Survival analysis
One widely used characteristic in research to predict and identify gene signatures in cancer is patient survival analysis, which combines both gene expression and clinical data [43]. The top 10 upregulated and downregulated genes from DEG analysis were subjected to survival analysis to find genes affecting breast cancer survival. Survival analysis of the top 10 upregulated and top 10 downregulated genes was performed using GEPIA2 (http://gepia2.cancer-pku.cn/#index). GEPIA2 is an upgraded web server designed for interactive assessment and large-scale gene analysis. GEPIA2 facilitates the investigation of a particular cancer subtype and subgroup comparison, extending gene expression measurement from the genetic level to the transcripts level [44].
Building the model
In this study, 1224 samples from the TCGA-BRCA research were utilized for the diagnosis and classification of breast cancer stages. These samples included 1111 tumor tissue samples and 113 corresponding control tissue samples. The primary objective was to identify DEGs to serve as classification features, which were then used to diagnose early and late stages of breast cancer. The dataset comprised 918 samples in the early stage and 306 samples in the late stage. Early-stage breast cancer generally refers to Stages I and II and late-stage breast cancer usually encompasses Stages III and IV. Differential analysis was conducted on these samples to identify DEGs, highlighting the genes that are significantly upregulated or downregulated in breast cancer tissues compared to control tissues, providing vital information for accurate diagnosis and staging of the disease.
The study employed multiple classifiers to ensure robust and accurate predictions. These classifiers include Gaussian Naive Bayes (GNB), RF, DT, K-Nearest Neighbors (KNNs), XGBoost, and SVM with RBF Kernel Function. To guarantee that the features were on a similar scale, each classifier started by normalizing the data. This is an important step for enhancing performance, particularly for algorithms that are sensitive to data scale. The dataset was split at random into a test set (30%) and a training set (70%) to give enough information for learning while keeping a sizeable amount for objective assessment. The Synthetic Minority Over-sampling Technique (SMOTE) is used to solve the problem of sample imbalance, particularly between the early and late stages of breast cancer. To balance the class distribution and improve the model’s capacity to generalize and perform well in minority classes, SMOTE creates synthetic examples for the training set. The test set data were used to assess the trained models, and the performance metric was the AUC of the receiver operating characteristic (ROC) curve. A higher AUC denotes greater performance. The AUC gives an indication of how well the model can discriminate across classes. The outcomes were averaged across 10 runs using cross-validation, a resampling technique used to assess machine learning models on a small data sample, in order to assure robustness and reliability. The decision function for SVM with RBF kernel can be represented as: With an RBF kernel, the SVM decision function is expressed as:
 |
In this case, the Lagrange multipliers are represented by αi, the class labels by  the kernel function by K, the bias term by b, and the support vectors by xi.
The projected outcome for RF may be shown as:
 |
where the individual tree predictions are denoted by y1, y2, ..., yn and the predicted class is represented by 
One way to describe the DT decision rule is as:
 |
Given the GNB features, the likelihood of a class may be expressed as follows:
 |
The XGBoost forecast can be shown as:
 |
where the forecast of the  tree is denoted by
  and M is the number of trees.
Results
Identification of differentially expressed genes
Seven thousand six hundred thirty-seven genes were ultimately found to be differentially expressed when breast cancer tissues were compared to normal tissues for differential expression analysis. Figure 2 depicts the volcano plot of differential expression results where red dots represent upregulated DEGs and blue dots represent downregulated DEGs. Table 1 describes the top 10 upregulated and top 10 downregulated DEGs of the BRCA dataset.
Figure 2.

Volcano plot of DEGs. The DEGs are obtained based on criteria of log fold-change (LogFC) <1 for downregulated genes and (IogFC) > 1 for upregulated genes with a P-value < 0.05.
Table 1.
Top 10 upregulated and top 10 downregulated DEGs of BRCA.
| Gene symbol | Description | Regulation |
|---|---|---|
| UCN3 | Urocortin-3 | Upregulated |
| MUC2 | Mucin 2 | Upregulated |
| CGA | Glycoprotein hormones, alpha polypeptide | Upregulated |
| CSAG1 | Chondrosarcoma-associated gene | Upregulated |
| MAGEA12 | MAGE family member A12 | Upregulated |
| ACTL8 | Actin like 8 | Upregulated |
| MAGEA1 | MAGE family member A1 | Upregulated |
| IBSP | Integrin binding sialoprotein | Upregulated |
| KLHL1 | Kelch-like family member 1 | Upregulated |
| MAGEA3 | MAGE family member A3 | Upregulated |
| MYH2 | Myosin heavy chain 2 | Downregulated |
| CKM | Creatine kinase | Downregulated |
| MIR1–1HG | MIR1–1 host gene | Downregulated |
| MYL2 | Myosin Light Chain 2 | Downregulated |
| MYH7 | Myosin Heavy Chain 7 | Downregulated |
| PPP1R3A | Protein Phosphatase 1 Regulatory Subunit 3A | Downregulated |
| MYL1 | Myosin Light Chain 1 | Downregulated |
| STRIT1 | Small Transmembrane Regulator of Ion Transport 1 | Downregulated |
| C10orf71 | Chromosome 10 Open Reading Frame 71 Protein Coding Gene | Downregulated |
| NRAP | Nebulin-related anchoring protein | Downregulated |
Analysis of protein–protein interaction
In order to obtain hub-bottleneck genes, we have generated a PPI network using the top 10 upregulated and top 10 downregulated genes from the DEGs. Figure 3 represents the PPI network of the top 10 upregulated and top 10 downregulated genes of BRCA. We have identified four hub-bottleneck genes, i.e. MYH2, MYL1, MYL2, and MYH7 from the PPI analysis.
Figure 3.
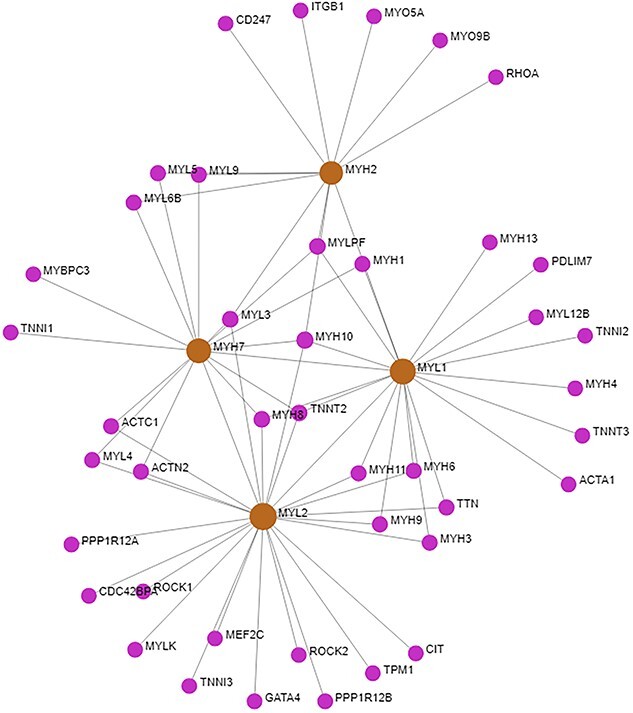
The PPI network of the top 10 upregulated and top 10 downregulated genes of BRCA. The bigger circle with different colors represents the top 4 hub proteins.
Identification of signaling and gene ontology terms
We employed a gene set enrichment analysis to obtain ontological and signaling pathways. In this analysis, we used the top 10 upregulated and top 10 downregulated genes from the obtained DEGs to identify signaling pathways using five global pathway databases, including KEGG, BioPlanet, and BioCarta. Molecular function, biological process, and cellular component were the three classifications from which the ontological pathways were obtained. The top 10 signaling and ontological pathways based on the adj P-value are represented in Tables 2 and 3, respectively.
Table 2.
The top 10 signaling pathways of the DEGs obtained from BRCA.
| Category | Pathway | Genes in the pathway | P-value |
|---|---|---|---|
| KEGG | Cardiac muscle contraction | MYL2,MYH7 | .003377564 |
| Hypertrophic cardiomyopathy | MYL2, MYH7 | .003609434 | |
| Dilated cardiomyopathy MYL2,MYH7 0.004094897 | MYL2,MYH7 | .004094897 | |
| Adrenergic signaling in cardiomyocytes | MYL2,MYH7 | .009716646 | |
| Focal adhesion | IBSP,MYL2 | .016953582 | |
| Neuroactive ligand–receptor interaction | UCN3,CGA | .044995524 | |
| Arginine and proline metabolism | CKM | .04885255 | |
| Ovarian steroidogenesis | CGA | .049806079 | |
| Autoimmune thyroid disease | CGA | .051710413 | |
| Regulation of lipolysis in adipocytes | CGA | .053611122 | |
| BioPlanet | Tight junction | MYH2,MYL2,MYH7 | 3.02E-04 |
| Striated muscle contraction | MYL1,MYL2 | 6.54E-04 | |
| Muscle contraction | MYL1,MYL2 | .001086179 | |
| Retinoblastoma protein regulation | CKM,MYL1 | .001961104 | |
| NFAT involvement in hypertrophy of the heart | MYH2,MYL2 | .002141024 | |
| Viral myocarditis | MYH2,MYH7 | .002265166 | |
| Cardiac muscle contraction | MYL2,MYH7 | .00286498 | |
| Dilated cardiomyopathy | MYL2,MYH7 | .0044345 | |
| Glycoprotein hormones | CGA | .004990441 | |
| SARS coronavirus protease | CKM | .006979996 | |
| BioCarta | Regulators of Bone Mineralization Homo sapiens h npp1Pathway | IBSP | .01094778 |
| PKC-catalyzed phosphorylation of inhibitory phosphoprotein of myosin phosphatase H. sapiens h myosinPathway M | MYL2 | .020801468 | |
| CCR3 signaling in Eosinophils H. sapiens h CCR3Pathway | MYL2 | .022760983 | |
| ALK in cardiac myocytes H. sapiens h alkPathway | MYL2 | .026668846 | |
| NFkB activation by nontypeable Hemophilus influenzae H. sapiens h nthiPathway | MYL2 | .028617205 | |
| Rho cell motility signaling pathway H. sapiens h rhoPathway | MYL2 | .0315328 | |
| Rac 1 cell motility signaling pathway H. sapiens h rac1Pathway | MYL2 | .03540733 | |
| Trefoil factors initiate mucosal healing H. sapiens h tffPathway | MUC2 | .03540733 | |
| NFAT and hypertrophy of the heart H. sapiens h nfatPathway | MYL2 | .043112259 |
Table 3.
The top 10 gene ontology terms of the DEGs obtained from BRCA.
| Category | Pathway | Genes in the pathway | P-value |
|---|---|---|---|
| Molecular function | Histone deacetylase binding | MAGEA12, MAGEA1, MAGEA3 | 1.26E-04 |
| Actin binding | MYL2, NRAP, KLHL1 | 7.66E-04 | |
| Myosin heavy chain binding | MYL2 | .005985691 | |
| Cuprous ion binding | MUC2 | .007973357 | |
| Caspase binding | MAGEA3 | .012926021 | |
| Peptide hormone receptor binding | UCN3 | .012926021 | |
| Muscle alpha-actinin binding | NRAP | .013913732 | |
| Neuropeptide receptor binding | UCN3 | .016871235 | |
| Protein phosphatase 1 binding | PPP1R3A | .016871235 | |
| Actin monomer binding | MYL2 | .022760983 | |
| Alpha-actinin binding | NRAP | .022760983 | |
| Copper ion binding | MUC2 | .044071254 | |
| Myosin binding | MYL2 | .05266122 | |
| Hormone activity | CGA | .071488248 | |
| Biological process | Actin-myosin filament sliding | MYH2, MYL1, MYH7 | 4.25E-05 |
| Muscle filament sliding | MYL1, MYH7 | 9.90E-05 | |
| Cardiac myofibril assembly | MYL2, NRAP | 1.08E-04 | |
| Muscle contraction | MYH2, MYL1, MYH7 | 2.81E-04 | |
| Ventricular cardiac muscle tissue development | MYL2, MYH7 | 4.34E-04 | |
| Cardiac muscle tissue morphogenesis | MYL2, MYH7 | 4.92E-04 | |
| Cardiac muscle contraction | MYL2, MYH7 | 4.92E-04 | |
| Ventricular cardiac muscle tissue morphogenesis | MYL2, MYH7 | 4.92E-04 | |
| Positive regulation of intracellular transport | MYL1, STRIT1 | 6.89E-04 | |
| Heart contraction | MYL2, MYH7 | 7.61E-04 | |
| Cardiac ventricle morphogenesis | MYL2, MYH7 | 7.99E-04 | |
| Myofibril assembly | MYL2, MYH7 | 9.58E-04 | |
| Striated muscle contraction | MYL2, MYH7 | .001467055 | |
| Host-mediated regulation of intestinal microbiota composition | MUC2 | .005985691 | |
| Cellular component | Myofibril | MYH2, MYL1, MYL2, MYH7 | 1.70E-08 |
| Muscle myosin complex | MYH2, MYL1, MYH7 | 3.09E-07 | |
| Myosin filament | MYH2, MYH7 | 9.90E-05 | |
| Supramolecular fiber | MYH2, MYH7 | 5.86E-04 | |
| Golgi lumen | MUC2, CGA | .0044345 | |
| Sarcoplasmic reticulum membrane | STRIT1 | .026668846 | |
| Intercalated disc | NRAP | .03056186 | |
| Cell–cell junction | MYH2, NRAP | .035451148 | |
| Actin cytoskeleton | MYL2, ACTL8 | .04171588 | |
| Sarcoplasmic reticulum | STRIT1 | .044071254 | |
| Caveola | MYL1 | .06023514 | |
| Actin filament | ACTL8 | .068687033 |
Identification of differentially expressed genes–microRNA and transcription factor–gene interaction
With the top 10 up- and downregulated DEGs from BRCA, we were able to obtain regulatory components from miRNA–DEGs and TF–DEGs interactions. Figure 4 represents the miRNA–DEGs interactions. In Fig. 4, purple squares represent the miRNAs, and sky-blue circles represent the DEGs.
Figure 4.
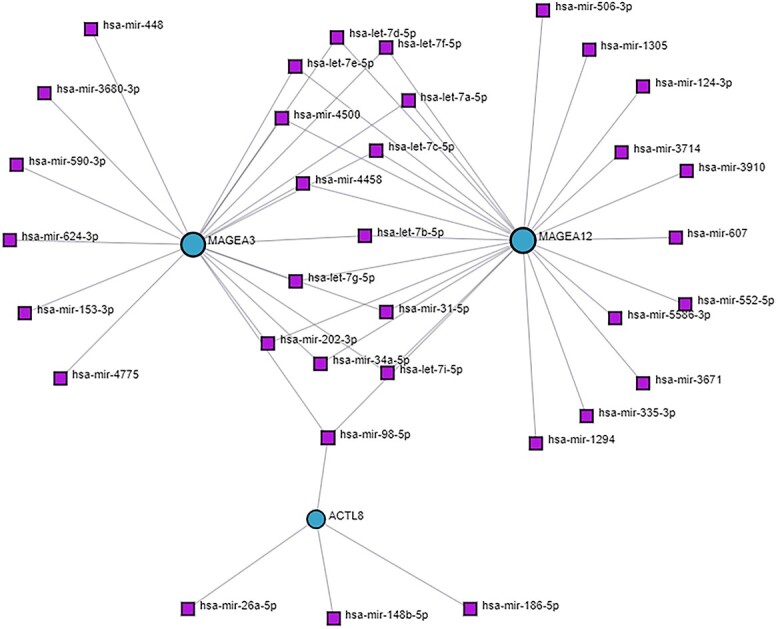
miRNA–gene interaction regulatory network. Target regulatory molecules are represented by square nodes, while associated genes are represented by circular nodes.
Figure 5 represents the TF–DEGs interactions based on the top 10 up- and downregulated genes. In Fig. 5, indigo-blue rhombus shape nodes represent the TFs, and the red circular shape nodes represent the associated DEGs. Based on the degree of a node, its dimension is generated. Four red circular nodes, namely, MYL1, MYH2, MYL2, and ACTL8, are considered as significant hub genes, and four rhombus TFs, namely, YY1, FOXC1, FOXL1, and MEF2A, are considered as regulatory molecules.
Figure 5.
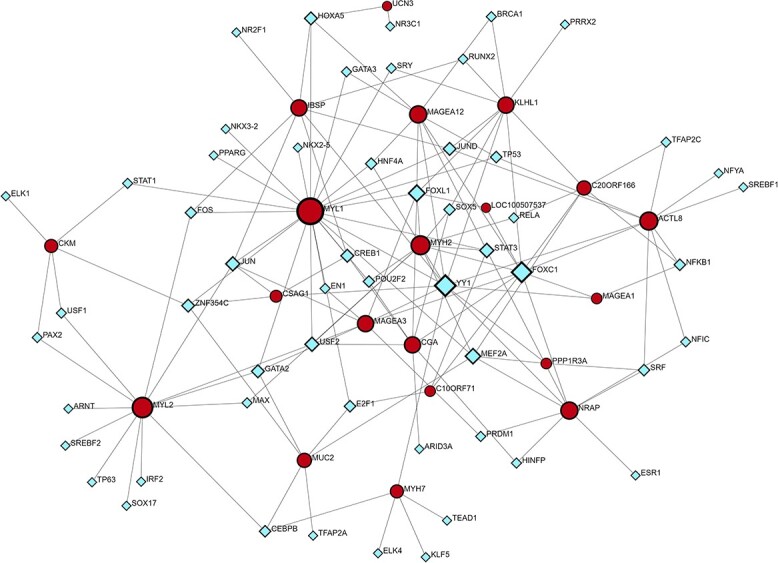
TF–gene interaction regulatory network. Square nodes indicate target regulatory molecules (TFs), and circular shape nodes represent the associated DEGs.
Identification of protein–drug and protein–chemical interactions
Figure 6 represents the combined protein–drug and protein–chemical network based on the top 10 up- and downregulated genes obtained from BRCA. In Fig. 6, the red circular nodes indicate drugs, and the blue pentangle nodes represent the chemical compounds that have an impact on how genes are expressed. The proteins MAGFA1, MUC2, IBSP, CKM, and MYH2 were considered as the highly expressed therapeutic targets in the combined network.
Figure 6.

Combined protein–drug and protein–chemical interaction network. Pentangle nodes indicate chemical compounds and rhombus nodes indicate drug regulatory molecules.
Survival analysis results
Survival analysis revealed that only 4 genes among the top 10 upregulated genes and downregulated genes found from DEG analysis were associated with the prognosis of breast cancer, namely, ACTL8, CGA, IBSP, and MUC2 genes, and their survival curves are shown in Fig. 7.
Figure 7.

Overall survival rate of the genes ACTL8, CGA, IBSP, and MUC2.
Results of different machine learning models
Table 4 shows the assessment metrics for several machine learning models used to classify different stages of breast cancer. Each model was evaluated using numerous performance indicators, including accuracy, precision, recall, F1 score, and specificity. The stages of breast cancer were divided into three categories: I–II, III, IV, V; I, II–III, IV, V; and I, II, III–IV, V, allowing for a thorough examination across stages. Notably, RF and XGBoost consistently achieved good accuracy, precision, recall, and F1 scores across different stages of breast cancer. These models’ accuracy evaluations, which indicate their capacity to distinguish between different cancer stages, varied from 85.51% to 97.19% for RF and from 85.51% to 95.23% for XGBoost. Excellent accuracy ratings were generated by both RF and XGBoost, ranging from 85.58% to 97.20% for RF and from 85.59% to 95.34% for XGBoost. These results show that both methods can consistently recognize real positive circumstances. The high-recall figures (85.51%–97.19% for RF and 85.51%–95.23% for XGBoost) show that both techniques were successful in gathering all positive examples. Moreover, RF and XGBoost routinely had high F1 ratings, which show the harmonic mean of accuracy and recall, indicating their overall efficacy. With an accuracy range of 63.30%–85.19%, the SVM also performed well, most notably in differentiating between phases I–II and III, IV, and V.
Table 4.
Model evaluation metrics.
| Stage | Model | Accuracy | Precision | Recall | F1 | Specificity |
|---|---|---|---|---|---|---|
| I–II, III, IV, V | RF | 94.46% | 94.61% | 94.46% | 94.45% | 93.77% |
| SVM | 85.19% | 84.19% | 85.19% | 84.98% | 77.16% | |
| DT | 83.66% | 83.44% | 84.66% | 83.47% | 67.50% | |
| GaussianNB | 79.76% | 68.02% | 73.33% | 69.42% | 36.23% | |
| KNN | 80.63% | 68.02% | 73.33% | 69.42% | 60.89% | |
| XGBoost | 93.01% | 93.27% | 93.01% | 92.99% | 92.38% | |
| I, II–III, IV, V | RF | 97.19% | 97.20% | 97.19% | 97.18% | 92.88% |
| SVM | 77.95% | 77.95% | 77.95% | 76.56% | 83.90% | |
| DT | 85.19% | 84.19% | 85.19% | 84.98% | 77.16% | |
| GaussianNB | 83.74% | 86.25% | 83.74% | 82.65% | 97.36% | |
| KNN | 77.77% | 80.23% | 77.70% | 73.46% | 96.08% | |
| XGBoost | 95.23% | 95.34% | 95.23% | 95.23% | 87.45% | |
| I, II, III–IV, V | RF | 85.51% | 85.58% | 85.51% | 85.53% | 89.71% |
| SVM | 63.30% | 63.43% | 63.30% | 61.87% | 82.69% | |
| DT | 67.22% | 67.00% | 67.22% | 67.00% | 74.44% | |
| GaussianNB | 74.82% | 77.85% | 74.82% | 72.67% | 96.13% | |
| XGBoost | 85.51% | 85.84% | 85.51% | 85.59% | 88.78% |
However, compared to RF and XGBoost, the SVM has a lower specificity, suggesting that it would have trouble correctly identifying actual negative scenarios. Phase-by-phase variations in the DT’s accuracy ranged from 67.22% to 85.19%. While the DT had poorer accuracy than RF and XGBoost, it nevertheless obtained acceptable performance metrics, demonstrating its potential value in specific applications. GNB showed lower accuracy than other models, ranging from 63.30% to 83.74%. This shows that GNB may be less efficient at reflecting the complexity of breast cancer staging than more advanced models such as RF and XGBoost. KNNs achieved reasonable accuracy, ranging from 77.77% to 80.63%. While the KNN demonstrated lesser accuracy than RF and XGBoost, its performance was nonetheless respectable, demonstrating its potential use in certain scenarios.
Overall, the results show that RF and XGBoost are successful in properly classifying different stages of breast cancer, implying that they might be used in clinical practice for precise diagnosis and treatment planning. Figure 8 displays the precision–recall curve, while Fig. 9 displays the ROC curve for the four distinct models.
Figure 8.

Precision–recall curve of machine learning models RF, GNB, KNNs, and XGB (XGBoost).
Figure 9.

ROC curve of machine learning models RF, GNB, KNN, and XGB.
Discussion
In women globally, breast cancer is the primary cause of cancer-related death. In both developed and developing nations, it comes in second place among the main causes of cancer-related deaths. Treatment effectiveness dramatically reduces metastasis and postcarcinogenesis, highlighting how crucial early identification is. Not only does prompt diagnosis increase patient survival rates, but it also makes it easier to put therapies into place that can reduce morbidity and increase overall survival rates [45]. Breast cancer screening in various European countries is mostly performed via mammography or breast magnetic resonance imaging (MRI), although these technologies present problems. Although breast MRI can be costly and has certain drawbacks, radiologists’ experience is crucial in interpreting mammograms. Both screening techniques are widely used; however, it is important to carefully weigh their advantages and disadvantages [46]. In this study, we focus on identifying and classifying breast cancer using system biology and machine learning approaches. We have studied the breast cancer gene expression data from TCGA datasets. First of all, we utilized the DEGs of the gene expression data of TCGA datasets, and then, we found 20 DEGs including 10 upregulated and 10 downregulated genes of breast cancer (Table 1). To discover prospective therapeutic targets, we examined differentially expressed breast cancer genes using PPI, molecular signaling pathway, ontology, and regulatory analysis. Similarly, system biology studies were done to study the molecular markers and therapeutic targets by Barua et al. [47–49]. We utilized gene enrichment analysis to obtain the responsible genes of breast cancer by discovering gene ontologies and pathways. We identified 20 DEGs using gene ontological exploration based on P-value to obtain insight into the molecular importance of breast cancer. The three types of GO analysis such as molecular function (molecular-level performance), biological process (biological activities), and cellular component (gene regulatory activities) were employed from the GO database using Enrichr as an annotation source [50]. In the molecular function, histone deacetylase binding and actin binding activity are significant among the top GO terms. Actin-myosin filament sliding and muscle filament sliding for biological processes and myofibril and muscle myosin complex for cellular components are among the top GO terms.
Myofibrils are the complex structures found inside muscle cells. They are essential for enabling muscular contraction, which is a basic mechanism that is necessary for movement and body function. This process also greatly contributes to general physiological balance. Several muscle diseases and ailments that impair movement and physical well-being may be related to myofibril dysfunction or dysregulation [51]. Histone deacetylases (HDACs) in breast cancer regulate gene expression by altering histone proteins. This can affect the expression of genes involved in cell growth, metastasis, and medication resistance [52]. HDAC inhibitors have shown promise as possible therapies because they reverse these processes and make cancer cells more susceptible to therapy. Another study showed that alterations in cytoskeletal dynamics, including gactin–myosin interactions, can indirectly influence various aspects of breast cancer progression [53, 54]. Enrichment analysis is an important tool for identifying correlations unique to breast cancer and other disorders [55, 56]. The KEGG pathway of the DEGs revealed the top four pathways: cardiac muscle contraction, hypertrophic cardiomyopathy, dilated cardiomyopathy, and adrenergic signaling in cardiomyocytes. In a study, cardiac muscle contraction pathways could potentially impact breast cancer growth by common molecular processes or systemic consequences, as shown by the linked signaling networks in cancer-associated fibroblasts and the tumor microenvironment [57]. According to some research, there seems to be a link between the advancement of breast cancer and chronic stress, which can trigger adrenergic signaling pathways [58]. In addition, Tight junction and Striated muscle contraction for BioPlanet pathway, and Regulators of Bone Mineralization Homo sapiensh npp1Pathway and PKC-catalyzed phosphorylation of inhibitory phosphoprotein of myosin phosphatase H. sapiens h myosinPathway for BioCarta pathway were revealed as the top significant pathways (Table 2). It has been found that frequent exercise, which burns calories through muscular contraction and may affect the metabolism of creatine, lowers the risk of breast cancer [59, 60]. Moreover, abnormal metabolism including the metabolism of creatine may contribute to the advancement of cancer [61, 62]. The Striated Muscle Contraction Pathway, PtdIns 4 5 P2 In Cytokinesis Pathway, and Osteoblast Signaling are all thought to have a role in breast cancer. While these pathways are largely concerned with muscle function, cell division, and bone growth, there may be indirect links or common regulatory mechanisms with breast cancer. Dysregulation of cell division signaling pathways, such as cytokinesis, has been linked to the development of cancer. Furthermore, modifications in bone signaling pathways may impact the bone microenvironment, influencing the course of breast cancer bone metastases [63, 64]. Analysis of protein–protein networks is a crucial method for determining the processes behind the development of illness [65, 66]. In order to acquire hub proteins, we built a network of interactions between proteins. The PPI analysis revealed four hub proteins that are MYH2, MYL1, MYL2, and MYH7. It’s worth noting that changes in numerous cytoskeleton components, such as myosin and myosin-associated proteins, have been linked to cancer development, particularly breast cancer. These modifications can impact cell motility, invasion, and metastasis, which are important factors in cancer growth [67, 68]. miRNAs and TFs regulate gene expression through post-transcriptional and transcriptional mechanisms. The dysregulation of miRNAs and TFs has emerged as a critical mechanism in breast cancer pathogenesis, impacting multiple aspects of tumor initiation, development, and metastasis. Several studies have highlighted the deregulation of certain microRNAs in breast cancer, such as miR-21, miR-155, and miR-221, which are typically overexpressed and linked with poor prognosis [69, 70]. By specifically targeting oncogenes or important tumor suppressor genes, these miRNAs can alter vital signaling pathways that are involved in invasion, apoptosis, and cell proliferation. Furthermore, abnormal expression of TFs, including members of the E2F, FOX, and AP-1 families, has been linked to breast cancer development [71, 72]. TFs control the expression of genes involved in a variety of biological functions. When TFs are dysregulated, normal gene expression patterns can be disrupted, which can contribute to the development of cancer. We identified the top significant miRNA targets (hsa-let-7d-5p, hsa-mir-4500, hsa-mir-34a-5p, hsa-let-7a-5p, and hsalet-7c-5p) which may be interconnected with pathways of breast cancer (Fig. 3). The target miRNAs may be regarded biomarkers and therapeutic targets to treat breast cancer [73, 74]. The top significant regulatory TFs (YY1, FOXC1, FOXL1, and MEF2A) may be responsible for the related pathways of the breast cancer cellular process of disease development. Among the discovered TFs, YY1 has been implicated in tumor aggressiveness and medication resistance through the regulation of cell cycle control and metastasis-related genes [75]. FOXC1, on the other hand, promotes tumor growth and metastasis by regulating genes associated with epithelial–mesenchymal transition and angiogenesis, contributing to poor clinical outcomes [76]. In another study [77], researchers discovered that while the specific role of FOXL1 in breast cancer remains unclear, accumulating evidence shows that it may have tumor-suppressive activities, reducing proliferation and invasion in breast cancer cells. Meanwhile, MEF2A has been linked to boosting tumor development and metastasis via modulating genes involved in cell proliferation and survival, indicating a bad prognosis in breast cancer patients [78].
Apart from clarifying the functions of TFs in breast cancer, protein–chemical interaction research has discovered other possible targets for treatment. Because it inhibits dihydrofolate reductase and messes with DNA synthesis, methotrexate, a commonly used chemotherapeutic treatment, has demonstrated success in treating a variety of malignancies, including breast cancer [79]. Because of its capacity to cause DNA damage and encourage carcinogenesis, benzopyrene, a polycyclic aromatic hydrocarbon present in tobacco smoke, has been linked to the development of breast cancer [80]. 4-[4-(2,5-Dioxo-pyrroldin-1-yl)-phenylamino] is the compound. Despite not having been well researched, -4-hydroxy-butyric acid shows promise as a therapeutic agent since it targets particular biochemical pathways that are implicated in the advancement of breast cancer [81].
Furthermore, machine learning analysis is implemented to improve the accuracy of breast cancer stage classifications. Notably, RF and XGBoost consistently delivered excellent accuracy, precision, recall, and F1 scores throughout all stages, with RF ranging from 85.51% to 97.20% and XGBoost from 85.51% to 95.34%. The SVM was effective in distinguishing between phases I–II and III, IV, and V, with accuracy ranging from 63.30% to 85.19%. However, the SVM had poorer specificity than RF and XGBoost. DT performance varied, although GNB accuracy was lower. KNNs demonstrated reasonable accuracy. Overall, RF and XGBoost indicate potential for therapeutic usage in precise breast cancer staging.
This research has several benefits for the identification, categorization, and staging of breast cancer. The TCGA dataset combines bioinformatics and machine learning to offer a thorough examination of molecular markers and cancer development. High diagnosis accuracy (97.19% and 95.23%, respectively) is obtained by the application of machine learning models like RF and XGBoost, which may be very helpful for clinical practice. More focused treatment approaches are also made possible by the discovery of possible therapeutic targets through the examination of signaling cascades, PPIs, and DEGs. Finding important proteins and miRNAs connected to the development of cancer also provides useful biomarkers for early identification and individualized treatment. Through the implementation of systems biology methods, the research expands our knowledge of the molecular pathways underlying breast cancer and helps to advance personalized medicine strategies that customize treatment regimens based on the unique characteristics of each patient. All things considered, this research offers a strong foundation for improving breast cancer detection, staging, and treatment advancement. The code of the project is available at the following link: https://github.com/dassaurav404/Breast-Cancer-Classification-using-Machine-Learning-andBioinformatics-Approach.git.
Conclusions
The complete investigation of breast cancer utilizing systems biology and machine learning methodologies has revealed important information about disease processes and prospective treatment targets. Significant molecular activities such as histone deacetylase binding and actin binding were found among the elevated genes, suggesting that they have active roles in cancer development. Similarly, downregulated genes were linked to key biological processes such as muscle filament sliding, indicating a possible imbalance in cellular functions. Enrichment analysis helped to understand the pathways that stimulate breast cancer development. The main pathways identified, including heart muscle contraction and adrenergic signaling, indicate possible linkages between cancer and systemic processes such as chronic stress. Furthermore, the enrichment of pathways associated with muscle contraction and cytokinesis emphasizes the role of cytoskeletal dynamics in cancer development, opening up new possibilities for therapeutic intervention. The PPI study revealed hub proteins such as MYH2 and MYH7, demonstrating the role of cytoskeletal components in breast cancer etiology. MicroRNA and TF studies revealed dysregulation of key regulators such as hsa-let-7d-5p and YY1, indicating their potential as diagnostic indicators and therapeutic targets. Furthermore, the discovery of chemicals with therapeutic potential, such as methotrexate and 4-hydroxy-butyric acid, emphasizes the need to address particular biochemical pathways in cancer treatment. In addition, machine learning studies showed that models such as RF and XGBoost can reliably detect breast cancer stages, with RF attaining an accuracy range of 85.51%–97.20% and XGBoost ranging from 85.51% to 95.34%. The SVM has shown success in differentiating between phases I–II and III, IV, and V, with an accuracy range of 63.30%–85.19%. However, the SVM has lower specificity than RF and XGBoost. One key limitation of the study is the lack of clinical trials to validate the findings. While the machine learning models show high accuracy in cancer classification, their clinical applicability requires further testing to confirm their effectiveness in real-world settings. Additionally, the study primarily focuses on specific subtypes and stages of breast cancer, necessitating further research to assess the methodology’s effectiveness across a broader range of breast cancer types and diverse patient populations. Another key limitation of this study is the lack of clinical trials to validate the findings, as the machine learning models, while demonstrating high accuracy in classification, require further testing to assess their clinical applicability. Additionally, the study’s focus on specific subtypes and stages of breast cancer limits its scope, and further research is needed to evaluate the methodology’s effectiveness across a wider range of breast cancer types and diverse patient populations. Despite the use of SMOTE to address class imbalance, the dataset’s imbalance, particularly in later-stage cancers, may still impact model performance and its ability to generalize effectively. The study’s research findings can be used in laboratory studies to better understand potential therapeutic targets for breast cancer treatments.
Key Points
Determine the genes responsible for breast cancer and construct a protein–protein interaction (PPI) network.
Predict candidate drugs based on the PPI network’s hub nodes and identify the diseases associated with the hub genes.
Role of biomarkers.
Cross-validate the expression level of the hub genes and perform survival analysis.
Application of machine learning in cancer diagnosis.
Supplementary Material
Contributor Information
Saurav Chandra Das, Department of Computer Science and Engineering, Jagannath University, Dhaka-1100, Bangladesh; Department of Internet of Things and Robotics Engineering, Bangabandhu Sheikh Mujibur Rahman Digital University, Bangladesh, Kaliakair, Gazipur-1750, Bangladesh.
Wahia Tasnim, Department of Computer Science and Engineering, Green University of Bangladesh, Narayanganj-1461, Dhaka, Bangladesh.
Humayan Kabir Rana, Department of Computer Science and Engineering, Green University of Bangladesh, Narayanganj-1461, Dhaka, Bangladesh.
Uzzal Kumar Acharjee, Department of Computer Science and Engineering, Jagannath University, Dhaka-1100, Bangladesh.
Md Manowarul Islam, Department of Computer Science and Engineering, Jagannath University, Dhaka-1100, Bangladesh.
Rabea Khatun, Department of Computer Science and Engineering, Green University of Bangladesh, Narayanganj-1461, Dhaka, Bangladesh.
Conflict of interest: None declared.
Funding
This work is partially supported by a grant for the ‘Research Fellowship (2022–2023)’ funded by the Information and Communication Technology Division, Ministry of Telecommunications and Information Technology, Government of Bangladesh. This work is also partially supported by a grant from the JnU Research Cell, obtained through the research grant (Grant ID: JnU/Research/2022-2023/Science/44).
Data availability
The datasets for this study were collected from the Genomic Data Commons (GDC) Data Portal (https://portal.gdc.cancer.gov/repository), a publicly available repository for cancer analysis.
Author contributions
Saurav Chandra Das contributed to the conceptualization, methodology, formal analysis, data curation, software development, visualization, and drafting of the original manuscript, as well as reviewing and editing. Wahia Tasnim contributed to data curation, visualization, and drafting of the original manuscript. Dr. Uzzal Kumar Acharjee supervised the study, managed the project, provided resources, and contributed to reviewing and editing the manuscript. Md. Manowarul Islam served as the co-supervisor, providing guidance throughout the study. Humayan Kabir Rana participated in the investigation and review of the manuscript. Rabea Khatun contributed to the validation of the study. All authors have reviewed and approved the final version for submission.
Ethics approval
Not applicable.
Consent to participate
Not applicable.
Consent for publication
Not applicable.
References
- 1. Cancer.org . https://www.cancer.org/cancer/types/breast-cancer.html, [Accessed 17-11-2023].
- 2. Siegel RL, Miller KD, Fuchs HE. et al. Cancer statistics, 2021. CA Cancer J Clin 2021;71:7–33. 10.3322/caac.21654. [DOI] [PubMed] [Google Scholar]
- 3. Breast Cancer-Statistics—cancer.net Statistics , https://www.cancer.net/cancer-types/breast-cancer/ [Accessed 17-11-2023].
- 4. Indicators casncc. relative survival by stage at diagnosis (female breast cancer) 2019. https://ncci.canceraustralia.gov.au/relative-survival-stage-diagnosis-female-breast-cancer [Accessed 18-11-2023].
- 5. Clarke R, Tyson JJ, Dixon JM. Endocrine resistance in breast cancer–an overview and update. Mol Cell Endocrinol 2015;418:220–34. 10.1016/j.mce.2015.09.035. [DOI] [PMC free article] [PubMed] [Google Scholar]
- 6. Perou CM, Sørlie T, Eisen MB. et al. Molecular portraits of human breast tumours, nature. 2000;406:747–52. [DOI] [PubMed] [Google Scholar]
- 7. Koren S, Bentires-Alj M. Breast tumor heterogeneity: source of fitness, hurdle for therapy. Mol Cell 2015;60:537–46. 10.1016/j.molcel.2015.10.031. [DOI] [PubMed] [Google Scholar]
- 8.Horwich A, Ross G. Circulating tumor markers. In: Kufe DW, Pollock RE, Weichselbaum RR, Bast RC Jr, Gansler TS, Holland JF, Frei E (editors). Cancer Medicine. 6th ed. BC Decker Inc.; Hamilton, Ontario; 2004. p. 233–46. 10.1007/978-1-59259-664-5_7. [DOI]
- 9. Stage T, Stage N, Stage M. Carcinoma in situ corresponds to the tnm classification. Laryngeal cancer: stages m-distant metastases. J Med Res 2019. [Google Scholar]
- 10. Cancer.Net, Stages of cancer . 2021. Accessed on 4 January 2024URL https://www.cancer.net/navigating-cancer-care/diagnosing-cancer/stages-cancer
- 11. Cancer survival rates Accessed on 4 January 2024. URL https://cancersurvivalrates.com/?type=colon&role=patient
- 12. Nasser M, Yusof UK. Deep learning based methods for breast cancer diagnosis: a systematic review and future direction. Diagnostics 2023;1313:161. 10.3390/diagnostics13010161. [DOI] [PMC free article] [PubMed] [Google Scholar]
- 13. Alharbi F, Vakanski A. Machine learning methods for cancer classification using gene expression data: a review. Bioengineering 2023;10:173. 10.3390/bioengineering10020173. [DOI] [PMC free article] [PubMed] [Google Scholar]
- 14. Breiman L. Random forests. Mach Learn 2001;45:5–32. 10.1023/A:1010933404324. [DOI] [Google Scholar]
- 15. Vapnik V. The Nature of Statistical Learning Theory. Springer science & business media, New York, NY, 1999. 10.1007/978-1-4757-3264-1. [DOI] [Google Scholar]
- 16. Cristianini N, Shawe-Taylor J. An Introduction to Support Vector Machines and Other Kernel-Based Learning Methods. Cambridge University Press, 2000, 10.1017/CBO9780511801389. [DOI] [Google Scholar]
- 17. Platt J. Sequential Minimal Optimization: A Fast Algorithm for Training Support Vector Machines. In: Schölkopf B, Burges C, Smola A (editors). Advances in Kernel Methods: Support Vector Learning. MIT Press; Cambridge, MA; 1999. p. 185–208.
- 18. Trabelsi A, Elouedi Z, Lefevre E. Decision tree classifiers for evidential attribute values and class labels. Fuzzy Sets Syst 2019;366:46–62. Selected Papers from LFA 2016 Conference. 10.1016/j.fss.2018.11.006. https://www.sciencedirect.com/science/article/pii/S0165011418308868. [DOI] [Google Scholar]
- 19. Fratello M, Tagliaferri R. Decision trees and random forests. In: Ranganathan S, Gribskov M, Nakai K, Schönbach C (eds.), Encyclopedia of Bioinformatics and Computational Biology. Oxford: Academic Press, 2019, 374–83. 10.1016/B978-0-12-809633-8.20337-3. URL https://www.sciencedirect.com/science/article/pii/B9780128096338203373 [DOI] [Google Scholar]
- 20. Xie X, Chen C, Sun T. et al. Rapid, non-invasive screening of keratitis based on raman spectroscopy combined with multivariate statistical analysis. Photodiagn Photodyn Ther 2020;31:101932. 10.1016/j.pdpdt.2020.101932. [DOI] [PubMed] [Google Scholar]
- 21. Chen F, Meng C, Qu H. et al. Human serum mid-infrared spectroscopy combined with machine learning algorithms for rapid detection of gliomas. Photodiagn Photodyn Ther 2021;35:102308. 10.1016/j.pdpdt.2021.102308. [DOI] [PubMed] [Google Scholar]
- 22. Jubair S, Alkhateeb A, Tabl A. et al. A novel approach to identify subtype-specific network biomarkers of breast cancer survivability. Netw Model Anal Health Inform Bioinform 2020;9:43. 10.1007/s13721-020-00249-4. [DOI] [Google Scholar]
- 23. Li S, Han F, Qi N. et al. Determination of a six-gene prognostic model for cervical cancer based on wgcna combined with lasso and cox-ph analysis. World J Surg Oncol 2021;19:277. 10.1186/s12957-021-02384-2. [DOI] [PMC free article] [PubMed] [Google Scholar]
- 24. Jiang H, Luo S, Dong Y. Simultaneous feature selection and clustering based on square root optimization. Eur J Oper Res 2021;289:214–31. 10.1016/j.ejor.2020.06.045. [DOI] [Google Scholar]
- 25. Queen O, Emrich SJ. Lasso-based feature selection for improved microbial and microbiome classification, in. IEEE International Conference on Bioinformatics and Biomedicine (BIBM) 2021;2021:2301–8. 10.1109/BIBM52615.2021.9669485. [DOI] [Google Scholar]
- 26. Maurya N, Kushwaha S, Chawade A. et al. Transcriptome profiling by combined machine learning and statistical r analysis identifies tmem236 as a potential novel diagnostic biomarker for colorectal cancer. Sci Rep 2021;11:14304. 10.1038/s41598-021-92692-0. [DOI] [PMC free article] [PubMed] [Google Scholar]
- 27. WebMD, Stages of cancer — webmd . 2021. accessed on 5 January 2024. URL https://www.webmd.com/cancer/cancer-stages
- 28. Abbas E-MY. A novel approach to identify subtype-specific network biomarkers of breast cancer survivability. Machine learning based refined differential gene expression analysis of pediatric sepsis 2020;13. 10.1186/s12920-020-00771-4. [DOI] [PMC free article] [PubMed] [Google Scholar]
- 29. Smyth G. Linear models and empirical bayes methods for assessing differential expression in microarray experimentsStat. Appl Genet Mol Biol 2004;3–27. 10.2202/1544-6115.1027. [DOI] [PubMed] [Google Scholar]
- 30. Gsea-p: A desktop application for gene set enrichment analysis. Bioinformatics 2007;23:3312–3319. 10.1093/bioinformatics/btm515. [DOI] [PubMed] [Google Scholar]
- 31. G. O. Consortium . The gene ontology resource: 20 years and still going strong. Nucleic Acids Res 2019;47(D1):D330–D338. 10.1093/nar/gkz800. [DOI] [PMC free article] [PubMed] [Google Scholar]
- 32. Gopubmed: Exploring pubmed with the gene ontology. Nucleic Acids Res 2005;33:W345–W350. 10.1093/nar/gki1001. [DOI] [PMC free article] [PubMed] [Google Scholar]
- 33. Xie Z, Bailey A, Kuleshov MV. et al. Gene set knowledge discovery with enrichr. Curr Protoc 2021;1:e90. 10.1002/cpz1.90. [DOI] [PMC free article] [PubMed] [Google Scholar]
- 34. Šikić M, Tomić S, Vlahoviček K. Prediction of protein–protein interaction sites in sequences and 3D structures by random forests. PLoS Comput Biol 2009;5. 10.1371/journal.pcbi.1000278. [DOI] [PMC free article] [PubMed] [Google Scholar]
- 35. Zhou G, Soufan O, Ewald J. et al. Networkanalyst 3.0: A visual analytics platform for comprehensive gene expression profiling and meta-analysis. Nucleic Acids Res 2019;47:W234–41. 10.1093/nar/gkz240. [DOI] [PMC free article] [PubMed] [Google Scholar]
- 36. Reimand J, Isserlin R, Voisin V. et al. Pathway enrichment analysis and visualization of omics data using g: Profiler, gsea,cytoscape and enrichmentmap. Nat Protoc 2019;14:482–517. 10.1038/s41596-018-0103-9. [DOI] [PMC free article] [PubMed] [Google Scholar]
- 37. Chin CH, Chen SH, Wu H. et al. Cytohubba: Identifying hub objects and sub-networks from complex interactome. BMC Syst Biol 2014. 10.1371/journal.pcbi.1000278. [DOI] [PMC free article] [PubMed] [Google Scholar]
- 38. Hsing M, Byler KG, Cherkasov A. The use of gene ontology terms for predicting highly-connected 'hub' nodes in protein-protein interaction networks. BMC Syst Biol 2008;2–80. 10.1186/1752-0509-2-80. [DOI] [PMC free article] [PubMed] [Google Scholar]
- 39. Vergoulis T, Vlachos IS, Alexiou P. et al. Tarbase 6.0: Capturing the exponential growth of mirna targets with experimental support. Nucleic Acids Res 2012;40:D222–9. 10.1093/nar/gkr1161. [DOI] [PMC free article] [PubMed] [Google Scholar]
- 40. Huang H-Y, Lin Y-C-D, Li J. et al. Mirtarbase 2020: Updates to the experimentally validated microrna–target interaction database. Nucleic Acids Res 2020;48:D148–54. 10.1093/nar/gkz896. [DOI] [PMC free article] [PubMed] [Google Scholar]
- 41. Fornes O, Castro-Mondragon JA, Khan A. et al. Jaspar 2020: Update of the open-access database of transcription factor binding profiles. Nucleic Acids Res 2020;48:D87–92. 10.1093/nar/gkz1001. [DOI] [PMC free article] [PubMed] [Google Scholar]
- 42. Parvez, Mosharaf FFAMSKMAMMNHMM, Mehedi Hassan M. Computational prediction of protein ubiquitination sites mapping on arabidopsis thaliana. Comput Biol Chem 2020;85:107238. 10.1016/j.compbiolchem.2020.107238. [DOI] [PubMed] [Google Scholar]
- 43. Hossain ME, Khan A, Moni MA. et al. Use of electronic health data for disease prediction: A comprehensive literature review. IEEE/ACM Trans Comput Biol Bioinform 2019;18:745–58. 10.1093/nar/gkr1161. [DOI] [PubMed] [Google Scholar]
- 44. Tang Z, Kang B, Li C. et al. GEPIA2: An enhanced web server for large-scale expression profiling and interactive analysis. Nucleic Acids Res 2019;47:W556–60. 10.1093/nar/gkz430. [DOI] [PMC free article] [PubMed] [Google Scholar]
- 45. Koo MM, Swann R, McPhail S. et al. Presenting symptoms of cancer and stage at diagnosis: Evidence from a cross-sectional, population-based study. Lancet Oncol 2020;21:P73–9. 10.1016/S1470-2045(19)30595-9. [DOI] [PMC free article] [PubMed] [Google Scholar]
- 46. Mandair D, Reis-Filho J, Ashworth A. Biological insights and novel biomarker discovery through deep learning approaches in breast cancer histopathology. NPJ Breast Cancer 2023;9:1–11. 10.1038/s41523-023-00518-1. [DOI] [PMC free article] [PubMed] [Google Scholar]
- 47. Barua JD, Omit SBS, Rana HK. et al. Bioinformatics and system biological approaches for the identification of genetic risk factors in the progression of cardiovascular disease. Cardiovasc Ther 2022;2022:1–14. 10.1155/2022/9034996. [DOI] [PMC free article] [PubMed] [Google Scholar]
- 48. Akhtar MR, Mondal MNI, Rana HK. Bioinformatics approach to identify the impacts of microgravity on the development of bone and joint diseases. Inform Med Unlocked 2023;38:101211. 10.1016/j.imu.2023.101211. [DOI] [Google Scholar]
- 49. Omit SBS, Akhter S, Rana HK. et al. Identification of comorbidities, genomic associations, and molecular mechanisms for covid-19 using bioinformatics approaches. Biomed Res Int 2023;2023:6996307. 10.1155/2023/6996307. [DOI] [PMC free article] [PubMed] [Google Scholar]
- 50. González-Castro TB, Tovilla-Zárate CA, Genis-Mendoza AD. et al. Mart´ ınez-Maga˜ na, identification of gene ontology and pathways implicated in suicide behavior: Systematic review and enrichment analysis of gwas studies. Am J Med Genet B Neuropsychiatr Genet 2019;180:320–9. 10.1155/2023/6996307. [DOI] [PubMed] [Google Scholar]
- 51. Mukund K, Subramaniam S. Skeletal muscle: A review of molecular structure and function, in health and disease. Wiley Interdiscip Rev Syst Biol Med 2020;12:e1462. 10.1002/wsbm.1462. [DOI] [PMC free article] [PubMed] [Google Scholar]
- 52. Marks P, Rifkind R, Richon V. et al. Histone deacetylases and cancer: Causes and therapies. Nat Rev Cancer 2001;1:194–202. 10.1038/35106079. [DOI] [PubMed] [Google Scholar]
- 53. Schiller HB, Friedel CC, Boulegue C. et al. Quantitative proteomics of the integrin adhesome show a myosin ii-dependent recruitment of lim domain proteins. EMBO Rep 2020;21:e49860, 259–266. 10.15252/embr.201949860. [DOI] [PMC free article] [PubMed] [Google Scholar]
- 54. Friedl P, Wolf K. Tumour-cell invasion and migration: Diversity and escape mechanisms. Nat Rev Cancer 2003;3:362–74. 10.1038/nrc1075. [DOI] [PubMed] [Google Scholar]
- 55. Podder NK, Shill PC, Rana HK. et al. Genetic effects of covid 19 on the development of neurodegenerative diseasesIn: 2021 5th International Conference on Electrical Information and Communication Technology (EICT). IEEE, 2021, 1–6. [Google Scholar]
- 56. Rana HK, Akhtar MR, Ahmed MB. et al. Genetic effects of welding fumes on the progression of neurodegenerative diseases. Neurotoxicology 2019;71:93–101. 10.1016/j.neuro.2018.12.002. [DOI] [PubMed] [Google Scholar]
- 57. Chang T-T, Wu T-J, Huang M-Z. et al. Signaling pathways in cancer associated fibroblasts and targeted therapy for cancer. Front Cell Dev Biol 2021;9:695297. 10.3389/fcell.2021.797026. [DOI] [Google Scholar]
- 58. Cui M, Zhang L, Wang X. et al. Adrenergic signaling promotes breast cancer metastasis via camp/pka pathway activation. Cancer Lett 2023. 10.1016/j.canlet.2023.216404. [DOI] [Google Scholar]
- 59. Ballard-Barbash R, Friedenreich CM, Courneya KS. et al. Physical activity, biomarkers, and disease outcomes in cancer survivors: A systematic review. J Natl Cancer Inst 2012;104:815–40. 10.1093/jnci/djs207. [DOI] [PMC free article] [PubMed] [Google Scholar]
- 60. Neilson HK, Conroy SM, Friedenreich CM. et al. The influence of energetic factors on biomarkers of postmenopausal breast cancer risk. Curr Nutr Rep 2019;8:1–12. 10.1007/s13668-019-0264-y. [DOI] [PMC free article] [PubMed] [Google Scholar]
- 61. Kim JW, Dang CV. Cancer’s molecular sweet tooth and the Warburg effect. Cancer Res 2006;66:8927–30. 10.1158/0008-5472.CAN-06-150. [DOI] [PubMed] [Google Scholar]
- 62. Hirschey MD, DeBerardinis RJ, Diehl AM. et al. Dysregulated metabolism contributes to oncogenesis. Semin Cancer Biol 2015;35:S129–50. 10.1016/j.semcancer.2015.10.002. [DOI] [PMC free article] [PubMed] [Google Scholar]
- 63. Chircop M. Rho gtpases as regulators of mitosis and cytokinesis in mammalian cells. Small GTPases 2014;5:e29770. 10.4161/sgtp.29770. [DOI] [PMC free article] [PubMed] [Google Scholar]
- 64. Martin TJ, Sims NA. Osteoclast-derived activity in the coupling of bone formation to resorption. Trends Mol Med 2015;21:89–96. 10.1016/j.molmed.2014.11.007. [DOI] [PubMed] [Google Scholar]
- 65. Moni MA, Rana HK, Islam MB. et al. A computational approach to identify blood cell-expressed parkinson’s disease biomarkers that are coordinately expressed in brain tissue. Comput Biol Med 2019;113:103385. 10.1016/j.compbiomed.2019.103385. [DOI] [PubMed] [Google Scholar]
- 66. Datta R, Podder NK, Rana HK. et al. Bioinformatics approach to analyze gene expression profile and comorbidities of gastric cancerIn: 2020 23rd International Conference on Computer and Information Technology (ICCIT). IEEE, 2020, 1–6. [Google Scholar]
- 67. Yamaguchi H, Condeelis J. Regulation of the actin cytoskeleton in cancer cell migration and invasion, Biochimica et Biophysica acta (BBA)- reviews on. Cancer 2007;1773:642–52. 10.1016/j.bbamcr.2006.07.001. [DOI] [PMC free article] [PubMed] [Google Scholar]
- 68. Paul NR, Jacquemet G, Caswell PT. Endocytic trafficking of integrins in cell migration. Curr Biol 2015;25:R1092–105. 10.1016/j.cub.2015.09.042. [DOI] [PubMed] [Google Scholar]
- 69. Zhang L, Zhou F, Ten Dijke PS. Signoret, LIti, mirnas in the diagnosis and therapy of breast cancer In: McMurray G. (ed). Advances in Experimental Medicine and Biology, Vol. 1152. Springer, Cham, Switzerland, 2019, 235–53. [Google Scholar]
- 70. Iorio MV, Croce CM. Microrna dysregulation in cancer: Diagnostics, monitoring and therapeutics. A comprehensive review. EMBO Mol Med 2012;4:143–59. 10.1002/emmm.201100209. [DOI] [PMC free article] [PubMed] [Google Scholar]
- 71. Liang Y, Wu H, Lei R. et al. Transcriptional network analysis identifies bach1 as a master regulator of breast cancer bone metastasis. J Biol Chem 2020;295:12375–89. [DOI] [PMC free article] [PubMed] [Google Scholar]
- 72. Li XM, Li H. Transcription factors in breast cancer- from bone development to bone metastasisIn: Advances in Experimental Medicine and Biology, Vol. 1016. Springer, Cham, Switzerland, 2017, 255–74. [Google Scholar]
- 73. Chen L, Zhang X, Wang L. et al. Serum mir-499 as a novel diagnostic and prognostic biomarker in breast cancer. Cancer Biomark 2019;2019:1–7. [Google Scholar]
- 74. Li J, Xu Y, Xu Y. et al. Serum mir-371b-5p as a novel diagnostic and prognostic biomarker for breast cancer, cancer epidemiology. Biomarkers Prev 2020;2020. [Google Scholar]
- 75. Zhang J. et al. Yy1 promotes breast cancer progression by modulating the expression of genes involved in metastasis. J Cancer Res 2019;45:789–98. [Google Scholar]
- 76. Yu C. et al. Foxc1 promotes breast cancer metastasis through regulation of emt and angiogenesis related genes. Cancer Lett 2021;78:1123–34. [Google Scholar]
- 77. Wang D. et al. Foxl1 inhibits breast cancer progression by suppressing proliferation and invasion. Mol Cancer Res 2021;65:567–78. [Google Scholar]
- 78. Wang L. et al. Mef2a promotes breast cancer growth and metastasis through regulation of key target genes. Breast Cancer Res Treat 2020;39:921–32. [Google Scholar]
- 79. Wei L, Lin J, Wu G. Methotrexate induces dna damage and inhibits dna repair through down regulating the expression of msh2, msh6, and exo1 in non-small cell lung cancer cells. Oncol Lett 2020;20:374.33154772 [Google Scholar]
- 80. DeMarini DM. Genotoxicity of tobacco smoke and tobacco smoke condensate: A review. Mutat Res 2012;746:92–107. [DOI] [PubMed] [Google Scholar]
- 81. Kolb P, Pezzuto JM, Kondratyuk TP. Cancer chemoprevention through dietary polyphenols: Promise, pitfalls, and a call for precision nutrition. Chem Res Toxicol 2021;34:1–14. [Google Scholar]
Associated Data
This section collects any data citations, data availability statements, or supplementary materials included in this article.
Supplementary Materials
Data Availability Statement
The datasets for this study were collected from the Genomic Data Commons (GDC) Data Portal (https://portal.gdc.cancer.gov/repository), a publicly available repository for cancer analysis.