Abstract
Unilateral nephrectomy, a procedure reducing kidney mass, triggers a compensatory response in the remaining kidney, increasing its size and function to maintain a normal glomerular filtration rate (GFR). Recent research has highlighted the role of extracellular vesicles (EVs) in renal physiology and disease, although their involvement in unilateral nephrectomy has been underexplored. In this study, unilateral nephrectomy was performed on young mice, and urinary extracellular vesicles (uEVs) characterization and cargo were analyzed. Kidney volume increased significantly post-nephrectomy, demonstrating compensatory hypertrophy. Serum creatinine, cystatin C, and urinary electrolytes concentrations were similar in both nephrectomized and control groups. Western blot analysis revealed upregulation of sodium-glucose cotransporter 2 (SGLT2) and sodium chloride cotransporter (NCC), and downregulation of sodium-potassium-chloride co-transporter (NKCC2) and epithelial sodium channel (ENaC) in the nephrectomized group. Metabolomic analysis of uEVs showed an enrichment of certain metabolites, including citrate and stachydrine. Interestingly, uEVs from the nephrectomized group demonstrated a protective effect, downregulating signal transducer and activator of transcription 3 (STAT3) and reducing reactive oxygen species (ROS) in renal proximal cells, compared to uEVs from the control group. This study suggests that uEVs contain bioactive components capable of inducing protective, anti-inflammatory, anti-fibrinolytic, and antioxidative effects in renal cells. These findings contribute to our understanding of uEVs’ role in renal compensatory mechanisms after unilateral nephrectomy and may hold promise for future therapeutic interventions in renal diseases.
Keywords: Unilateral nephrectomy, Compensatory hypertrophy, Signal transducer and activator of transcription 3, Urinary extracellular vesicles
1. Introduction
Following unilateral nephrectomy, the remaining kidney undergoes compensatory growth, a process in which both kidney size and functional capacity increase to maintain the normal glomerular filtration rate (GFR) [1]. Interestingly, according to the KDIGO guideline of 2012, a patient with a solitary kidney, whether congenital or acquired, is categorized as chronic kidney disease (CKD) stage 1, despite maintaining a normal GFR [2].
Congenital solitary kidney typically falls under the category of congenital abnormalities of the kidney and urinary tract (CAKUT), encompassing a substantial 60 % of pediatric CKD cases [3,4]. On the other hand, an acquired solitary kidney, often resulting from post-birth nephrectomy due to conditions like tumors, polycystic kidney disease, or nonfunctioning unilateral kidneys, is included in the glomerular causes of CKD, representing about 20 % of pediatric CKD cases in the United States [3,4]. Thus, there is an evident need for further research to unravel the underlying mechanisms and identify potential interventions to enhance the prognosis in these conditions.
The process of intrauterine nephrogenesis commences at approximately 9–10 weeks of gestation, with nephron development reaching completion between 32 and 36 weeks [5]. In cases of congenital solitary kidneys, compensatory renal hypertrophy can manifest in utero due to unilateral renal agenesis, aplasia, or dysplasia, as seen in multicyclic dysplastic kidneys (MCDK), which result in a single functioning intrauterine kidney [6–8]. Studies have consistently shown that nephrogenesis persists until birth and does not conclude before the 36th week of gestation. This extended nephrogenesis in congenital solitary kidneys potentially leads to intrauterine compensatory hypertrophy through the formation of new nephrons. Consequently, the kidney size at birth is expected to surpass that of a normal newborn with both kidneys [9]. The extent of congenital compensatory hypertrophy primarily hinges on gestational age and the placental blood flow, serving as the chief regulator of fetal homeostasis [7,10].
In stark contrast, acquired solitary kidneys employ a different compensatory mechanism to maintain normal GFR. This mechanism centers on increasing the functional capacity of existing nephrons, primarily through hyperfiltration. Over time, this hyperfiltration leads to glomerular injury, proteinuria, hypertension, and culminates in the development of CKD and end-stage renal disease (ESRD) [7]. A crucial distinction arises when comparing the underlying pathogenesis of congenital and acquired compensatory hypertrophy. In congenital solitary kidneys, each nephron typically possesses normal or near-normal dimensions, implying a lower risk of glomerular injury over time, unlike patients who undergo unilateral nephrectomy after birth. These individuals lack the ability to form new nephrons and instead proceed with compensatory hypertrophy by enlarging the existing nephrons [9].
Prior research efforts have investigated the primary adaptive mechanisms initiated after unilateral nephrectomy. These investigations have identified hypertrophy of the glomeruli and hyperplasia of the proximal tubules and collecting ducts as key elements in this intricate process [11–15]. Although several animal studies employing knock-out models have sought to elucidate the underlying pathways promoting compensatory mechanisms following unilateral nephrectomy, the precise pathophysiology remains an enigma. Recent research has brought extracellular vesicles (EVs) into the spotlight, emphasizing their pivotal role in cell differentiation [16,17], intercellular communication [18–20], and signaling [21–23].
Extracellular vesicles are nanosized particles released by all cell types within the nephron and can be found in bodily fluids, including plasma and urine [24]. EVs serve as carriers for a diverse array of bioactive molecules, encompassing lipids, proteins, metabolites, and nucleic acids [25,26]. These vesicles are categorized based on their biogenesis, size, and the presence of specific proteins. Among them, exosomes, the smallest EVs, range in size from 30 to 200 nm and are released following the formation of multivesicular bodies [27]. Microvesicles, the larger counterparts, fall within the 200–1000 nm range and are produced by budding from the plasma membrane [28]. Lastly, apoptotic bodies, the largest of the EVs, are generated during cell apoptosis [29,30].
The primary objective of our study was to identify the cargo enriched within EVs released from juvenile mice following unilateral nephrectomy. Moreover, we seeked to investigate whether these EVs elicit alterations in signaling pathways within mouse proximal tubule cells. In doing so, we aimed to shed light on the intricate interplay between EVs and the renal compensatory mechanisms in the context of unilateral nephrectomy.
2. Materials and methods
2.1. Animal study
Two groups of male C57B6 mice (Jackson laboratories; Bar Harbor, ME) were subject to unilateral nephrectomy or sham surgery. Left nephrectomies were performed in 4 week-old mice and sham surgeries were performed in mice of the same age. The mice were individually placed in metabolic cages at five weeks of age. Both groups of mice were maintained on a normal chow diet. To minimize possible evaporation of urine and to achieve more accurate urine collections, daily water intake and urine output were recorded twice a day between 7 am–9 am to represent urine produced during the active cycle and between 7 pm −9 pm to represent urine produced during the inactive cycle. Blood collection was obtained weekly during the active and inactive cycles. The observation period was five weeks, and the mice were euthanized at the age of 9 weeks. All animal procedures were performed under an approved Institutional Animal Care and Use Committee (IACUC) at the University of Florida, Gainesville, FL.
2.2. uEVs isolation
Isolation of uEVs was performed using the SmartSEC-Mini EV Isolation System (SSEC100A-1 (System Biosciences; Palo Alto CA) according to the manufactures instructions with the following modifications. The tubes were centrifuged at 500 ×g for 30 s to remove the storage buffer before adding 200 μL of isolation buffer to the column. The tubes were centrifuged at 500 ×g for 30 s to wash the beads. Then 100 μL of isolation buffer was added to the column, followed by 100 μL of the urine samples isolated at week one and week three post-nephrectomy/sham surgery during the active/inactive cycles. The tubes were subject to mixing for 30 mins at room temperature. The tubes were centrifuged at 500 ×g for 30 s to collect the first fraction of uEVs. Next, 100 μL of isolation buffer was added to the columns, and the tubes were centrifuged at 500 ×g for 30 s to collect the second fraction of EVs. Similarly, a third fraction was collected.
2.3. Measurement of urinary creatine
Urinary creatinine levels were measured using a Creatinine Assay Kit (ab204537) (Abcam; Waltham MA) following the manufactures instructions.
2.4. Nanoparticle tracking analysis
The size and concentration of the urinary EVs were measured using an NS300 machine coupled to NTA 3.4 Build 3.4.4 Software (Malvern; UK) at 25 degrees Celsius. A 1:1000 dilution of the uEVs prepared in filtered 1XPBS was injected into the system, and an automatic infusion pump fed the samples through the machine at an infusion rate of 65.
2.5. Transmission electron microscope analysis of uEVs
Ten microliters of uEVs isolated from sham or unilateral nephrectomized mice were incubated with formvar-carbon coated grids (Ladd Research Industries; Williston, VT) for 30 min. After being transferred to a drop of 1XPBS for 3 min each grid was transferred to a drop of 1 % glutaraldehyde (Ladd Research Industries) prepared in 1xPBS for 5 min. Next, each grid was washed by a series of 8 exchanges of 1XPBS each for 2 min. Afterwards, each grid was incubated in a drop of uranyl-oxalate solution, pH 7 prepared from uranyl acetate (Ladd Research Industries) and oxalic acid (Sigma-Aldrich; St. Louis, MO) for 5 min. Next, on a cold plate, each grid was incubated in a drop of methyl cellulose-uranylacetate for 10 min. Finally, each grid was allowed to air dry for up to 15 min before being viewed on a transmission electron microscope.
2.6. Kidney membrane preparations
For each mouse, a 50 mg piece of the kidney cortex tissue was homogenized in 500 mL tissue protein extraction reagent (ThermoFisher Scientific). The tissue lysates were first subject to centrifugation at 13,000 rpm for 10 min at room temperature. Then, 450 μL of the supernatant was subject to ultracentrifugation at 34,000 rpm for 30 min at 4 °C. The supernatant (soluble fraction) was collected into separate tubes and the pellets were resuspended in 200 μL TPER and briefly sonicated on ice twice for 3 s intervals before being collected into separate tubes (membrane fraction).
2.7. BCA protein assay
An aliquot of the uEVs was lysed in an equal volume of RIPA buffer (Thermo Fisher Scientific; Waltham, MA). A 1:10 dilution of the soluble or membrane kidney cortex protein lysate was prepared in 1X PBS. Protein concentrations of the lysed uEVs or the stock kidney cortex lysates from soluble or membrane fractions were determined by a bicinchoninic acid protein assay (Thermo Fisher Scientific; Waltham, MA) according to the manufacturer’s instructions.
2.8. Western blotting
Five micrograms of lysed uEV or fifty micrograms of total protein from the soluble or membrane fractions of kidney cortex lysates were loaded into 4–20 % Tris HCl polyacrylamide gels using the Criterion electrophoresis system (Bio-Rad; Hercules, CA). The resolved proteins were transferred onto nitrocellulose membranes (GE Healthcare, Piscataway, NJ) using the Criterion transfer system (Bio-Rad). The nitrocellulose membranes were then blocked in 5 % nonfat dry milk in 1x tris buffered saline (1X TBS; Bio-Rad) for 1 h at room temperature before being washed twice with 1x TBS and incubated with a 1:1000 dilution of primary antibody ENaC alpha or beta [31], anti-phospho-NCC (P1311–53, PhosphoSolutions; Aurora, CO), anti-NKCC2 (18970-1-AP, Proteintech), SGLT-2 (24654-1-AP, Proteintech, anti-STAT3 (ab76315, abcam), anti-caveolin-1 (3267; Cell Signaling Tech, Danvers, MA, USA), anti-uromodulin (AF5175, Novus Biologicals, Centennial, CO, USA), anti-CD9 (ab223052, abcam), anti-CD63 (sc-5275, Santa Cruz Biotech, Dallas Tx, USA), anti-GAPDH-HRP (649,203, BioLegend), and anti-HSP70-HRP (648,005, BioLegend) for at least 8 h at 4 degrees Celsius on a rocker. The membranes were washed three times with 1x TBS and incubated with a 1:3000 dilution of horseradish peroxidase (HRP)-conjugated goat anti-rabbit secondary antibody (BioRad) prepared in blocking solution at room temperature for 1 h. Next, the membranes were washed four times in 1× TBS, incubated with ECL reagent (BioRad) for 7 min, and then imaged with a Bio-Rad imager.
2.9. Cell culture
Mouse proximal tubular cells (PTCs) were cultured in DMEM/F12 supplemented with exosome depleted FBS (catalog#A25904DG) (Gibco Life technology; Waltham, MA). Cells were grown to 90 % confluence and maintained at 37 °C in 5 % CO2. Next, 10 × 103 cells were treated for 24 h with 1 × 10^7 EV particles/mL isolated at week one post-nephrectomy/sham surgery. The cells were then scraped in RIPA Buffer containing Halt protease and phosphatase inhibitors (Thermo Fisher Sci; Waltham, MA), and the cell lysate was sonicated twice for 5-s intervals while on ice.
2.10. Cellular Reactive Oxygen Species (ROS) detection
A cellular reactive oxygen species (ROS) detection assay kit (Red florescence) (catalog#ab186027), (Abcam; Cambridge, UK) was used to detect intracellular ROS. Mouse proximal tubular cells (TKPTS) were cultured in DMEM/F12 supplemented with exosome depleted FBS (catalog#A25904DG) (Gibco Life technology; Waltham, MA). Next, 10,000 cells/well were plated in a sterile 96 well black plate with a clear flat bottom. Next, ROS working solution was added to the cultured cells and incubated for 60 min at 37 °C. The PTCs were challenged with uEVs isolated from the nephrectomized and Sham groups for 4 h. The fluorescence was measured using a fluorometric microplate reader at Ex/Em = 520/605 nm. ROS was calculated as a percentage of control after background subtraction.
2.11. Immunohistochemistry
For deparaffinization, kidney sections mounted on slides were immersed twice in Xylene (ThermoFisher Scientific) for 3 min each and then incubated in a series of 3-minute exchanges of 100 %, 95 %, 75 %, and 50 % ethanol (ThermoFisher Scientific). After a 3-minute wash in type 1 water (autoclaved distilled water), the slides were incubated in boiling citrate buffer for 20 min. Following a 5-minute wash in 1X PBS (Phosphate Buffer Saline), the tissue sections were blocked with 2.5 % normal horse serum (Vector Laboratories) for 20 min at room temperature in a humidifying chamber. The slides were then incubated in primary antibody solution (anti-ENaC alpha (SMC–242S, StressMarq, Victoria, BC, CA), anti-NCC (SPC-402D, StressMarq), and anti-NKCC2 (18970-1-AP, ProteinTech, Rosemont, IL, USA) prepared at a 1:1000 dilution in 1X PBS, for 30 min at room temperature in the humidifying chamber. After a 3-minute wash in 1X PBS, the slides were incubated in a secondary antibody solution (VectorFlour Duet Reagent; Vector Laboratories Inc) for 30 min in the dark. Following three 3-minute washes in 1X PBS, the slides were cover slipped (Genesse Scientific) with Vectashield anti-fade mounting media containing DAPI (Vector Laboratories Inc) and then imaged for fluorescence using a Leica Olympus microscope with a 40× objective.
2.12. Statistical analyses
Data analysis was performed using Prism 9 software (San Diego, CA). An unpaired two-tailed t-test was used to compare an independent variable between 2 groups. A one-way ANOVA was used to compare one variable between multiple groups. A two-way ANOVA was used to compare two variables between multiple groups. Descriptive statistics were reported as a percentage (%), mean ± standard deviation. A p-value <0.05 was defined as being statistically significant.
3. Results
3.1. Nephrectomized mice have increased kidney volume and weight compared to sham control mice
After harvesting the kidneys from both groups, the dimensions of the kidneys were obtained, and the total kidney volume was calculated by using the Ellipsoid formula (Table 1), as performed by other groups [60]. The nephrectomized group had a greater kidney volume (178.3+/− 24.34 mL) compared to the Sham group (119.2+/− 6.831 mL) as shown in Fig. 1A. The kidney volume of the nephrectomized group was normalized to the same right kidney volume of the Sham group, which showed a 50 % increase in kidney volume in the nephrectomized group as a compensatory hypertrophy mechanism (Fig. 1, B). There was a modest increase in kidney weight from the nephrectomized group compared to the sham group (Fig. 1C), and this change was found to be statistically significantly after normalizing the kidney weight to the body weight (Fig. 1D). Accordingly, there was a 53.8 % increase in kidney weight over body weight in the nephrectomized group compared to the control sham when measured as percent of control (Fig. 1E).
Table 1.
Measurement of Total Kidney Volume (TKV): Renal volume was calculated by using the ellipsoid formula. Volume = length × width × thickness × π/6. (N Demoulin 2021) Right kidney weight of Sham mice (SH RKW), Kidney weight of Nephrectomized mice (NX KW), Right kidney (RK).
| SH Right Kidney Weight (RKW) (gram) | NX Kidney Weight (KW) (gram) | SH Right kidney length (L) (mm) | NX Kidney length (L) (mm) | SH Right kidney width (W) (mm) | NX Kidney width (W) (mm) | SH Right Kidney thickness (T) (mm) | NX Kidney thickness (T) (mm) | SH Right Kidney volume (mL) | NX Kidney volume (mL) |
|---|---|---|---|---|---|---|---|---|---|
| 0.1 | 0.3 | 9.2 | 10 | 5 | 5.9 | 4.5 | 4.8 | 108.4 | 148.3 |
| 0.2 | 0.3 | 8.9 | 10.2 | 5.2 | 6.3 | 4.6 | 4.9 | 111.5 | 167.9 |
| 0.2 | 0.2 | 9.8 | 10.1 | 5.5 | 6.2 | 4.6 | 5 | 129.8 | 163.9 |
| 0.2 | 0.3 | 9.3 | 14 | 5.3 | 6.1 | 4.7 | 4.8 | 121.3 | 214.6 |
| 0.1 | 0.3 | 9.2 | 10.1 | 5.4 | 6.8 | 4.6 | 4.9 | 119.7 | 183.4 |
| 0.2 | 0.2 | 8.9 | 10.4 | 5.7 | 6.8 | 4.7 | 5.1 | 124.8 | 188.8 |
| 0.2 | 0.3 | 9.2 | 10.9 | 5.3 | 7 | 4.7 | 5.2 | 120 | 207.7 |
| 0.2 | 0.2 | 8.9 | 10.5 | 5.5 | 6 | 4.6 | 4.7 | 117.9 | 155 |
Fig. 1.
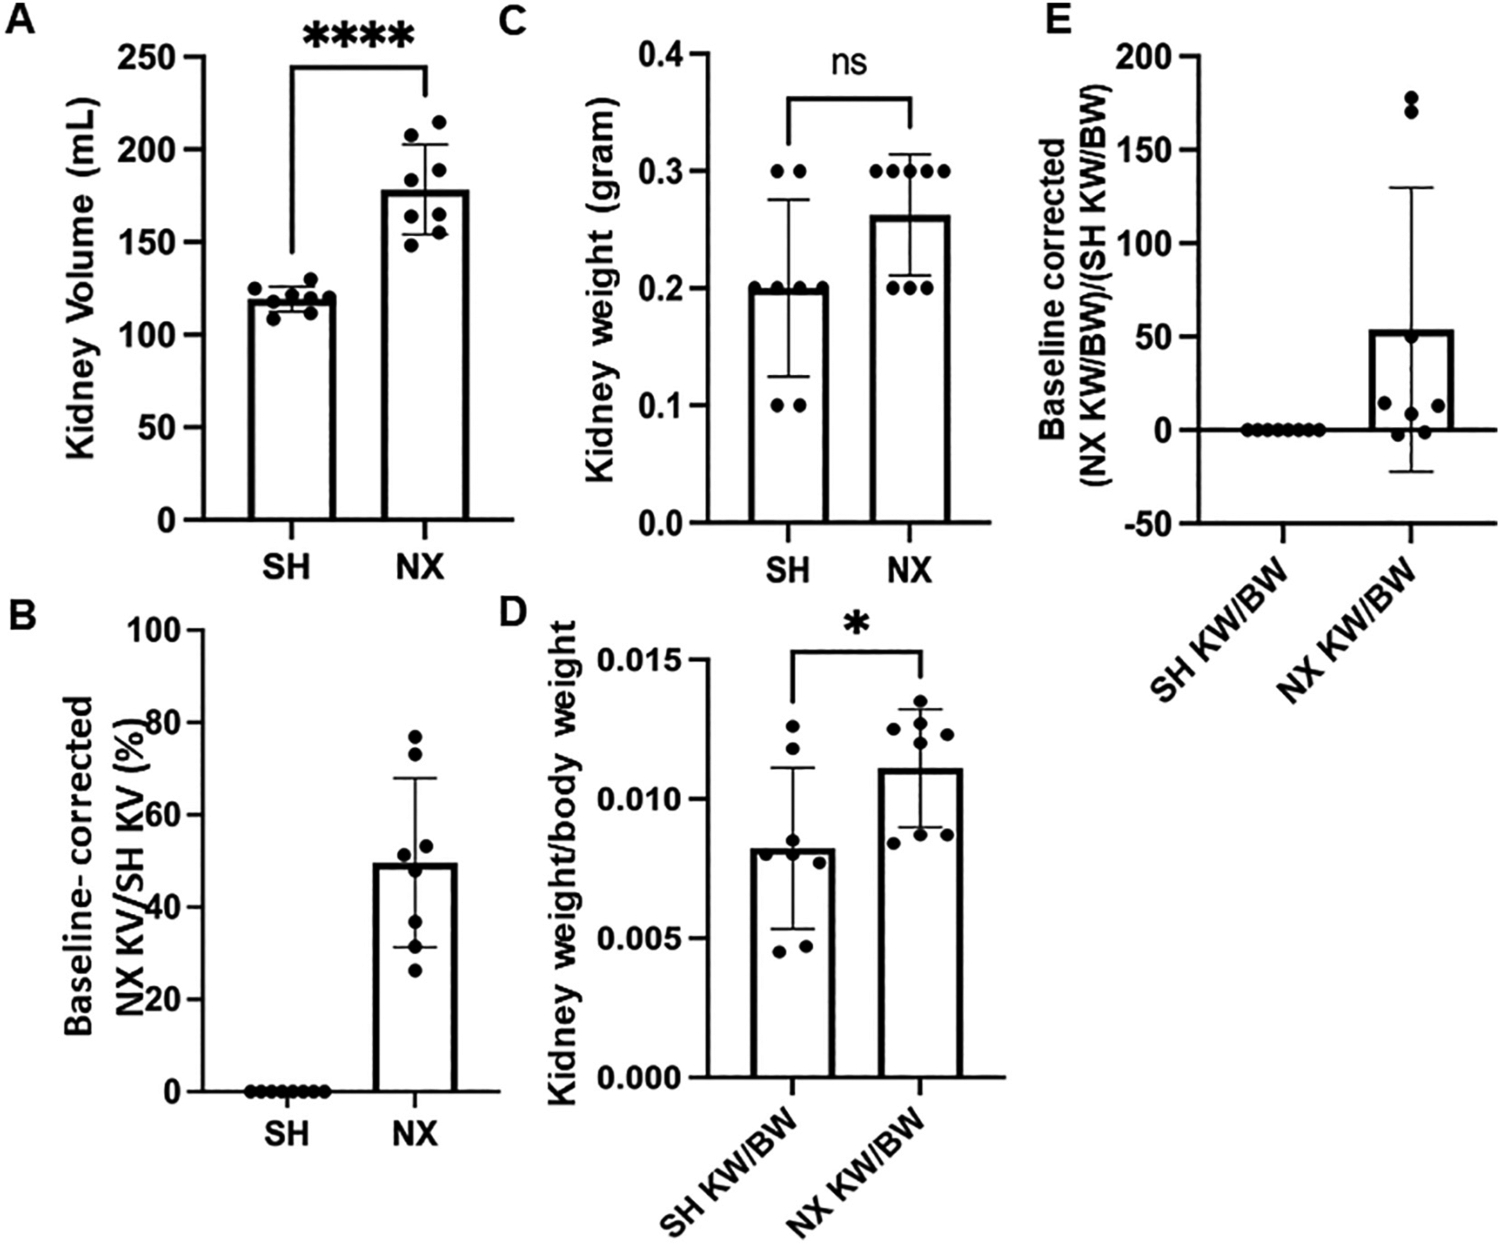
Kidney volume and weight of sham control mice and nephrectomized mice. A. Kidney Volume in mL, B. Corrected kidney volume, C. Kidney weight in grams, D. Corrected kidney weight/body weight, E. Baseline corrected kidney weight between the two groups. SH represents Sham control mice. NX refers to unilateral nephrectomized mice. **** represents a P-value ≤ 0.0001.
3.2. Water intake, urine output and body weight in nephrectomized mice compared to sham control mice
Next, we investigated changes in water intake and urine output in nephrectomized mice compared to control sham mice over a 24-h cycle after maintaining the mice on a normal salt diet. During the 5 week observation period after left unilateral nephrectomy or Sham surgery, daily water intake during the active cycle (7 pm-7 am) and inactive cycle (7 am-7 pm) were recorded. There were no significant differences between water intake (Fig. 2A) or urine output (Fig. 2B) between the nephrectomized mice and the sham control mice in either the active or inactive cycles. Similarly, there was no change in body weight between the two groups either 4 weeks or 9 weeks after nephrectomy or sham surgery (Fig. 2C).
Fig. 2.
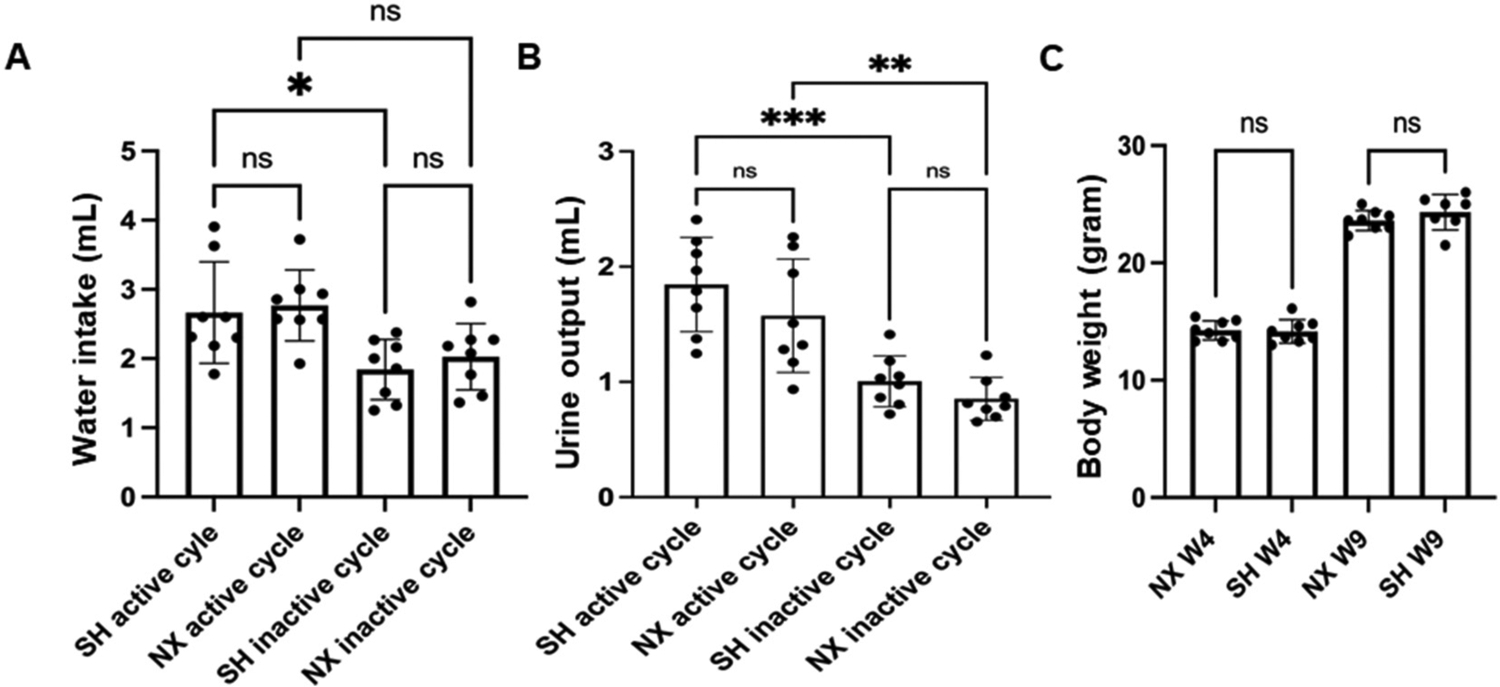
Water intake, urine output, and body weight in sham control mice and nephrectomized mice. A. Water intake in (mL) from the active or inactive cycle of sham control mice (SH active) or SH inactive) and from the active or inactive cycle of nephrectomized mice (NX active) or (NX inactive). B. Urine output in (mL) from the active or inactive cycle of sham control mice (SH active) or (SH inactive) and from the active or inactive cycle of nephrectomized mice (NX active) or (NX inactive). C. Body weight in (grams) from the active or inactive cycle of sham control mice (SH active) or (SH inactive) and from the active or inactive cycle of nephrectomized mice (NX active) or (NX inactive). * represents a p-value of ≤0.05, ** represents a p-value ≤ 0.01, *** represents a p-value ≤0.0001. ns represents no significant difference between the groups.
3.3. Serum creatinine and cystatin C levels in nephrectomized mice compared to sham control mice
We measured serum creatinine at week 2 and week 4 post-procedure in both groups during the active and inactive cycles. The mean serum creatinine 2 weeks after nephrectomy or sham surgery did not change during the active or inactive cycles (Fig. 3A). Similarly, there was not an appreciable difference for serum cystatin C between the nephrectomized mice compared to the sham control mice during the active or inactive cycles (Fig. 3B).
Fig. 3.
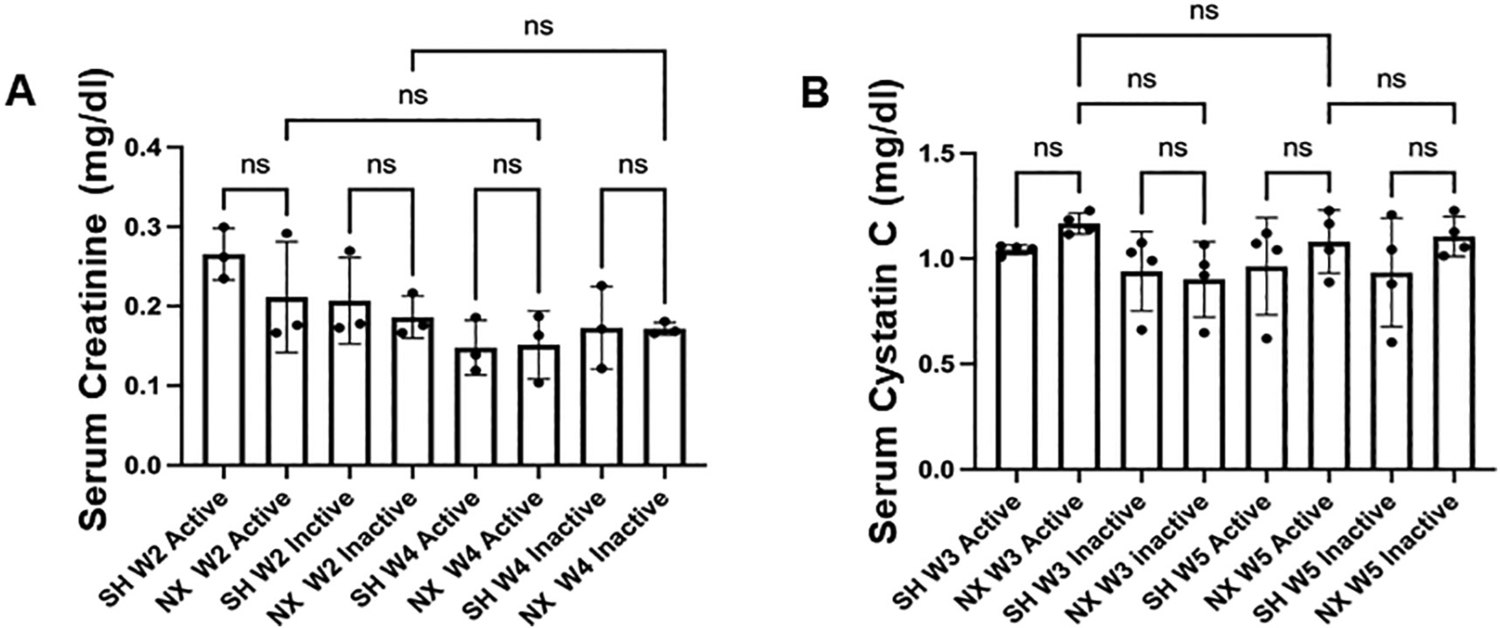
Serum creatinine and cystatin C in nephrectomized and sham control mice. A. Serum Creatinine levels (mg/dl) from the active cycle or inactive cycle of 2 week post-procedure sham control mice (SH W2 active) or (SH W2 inactive) and from the active cycle or inactive cycle of 2 week post-nephrectomized mice (NX W2 active) or (NX W2 inactive). ns represents no significant difference between the groups.
3.4. Urinary protein and creatinine excretion levels in nephrectomized mice compared sham control mice
Next, we normalized urine protein levels to creatinine five weeks after nephrectomy or sham surgery, but there were no difference between groups during the active or inactive cycles (Fig. 4A). Similarly, there was not a significant difference in 24-h urinary protein excretion (Fig. 4B) or amount of protein excreted in the urine during the active and inactive cycles (Fig. 4C) between the nephrectomized and sham control groups.
Fig. 4.
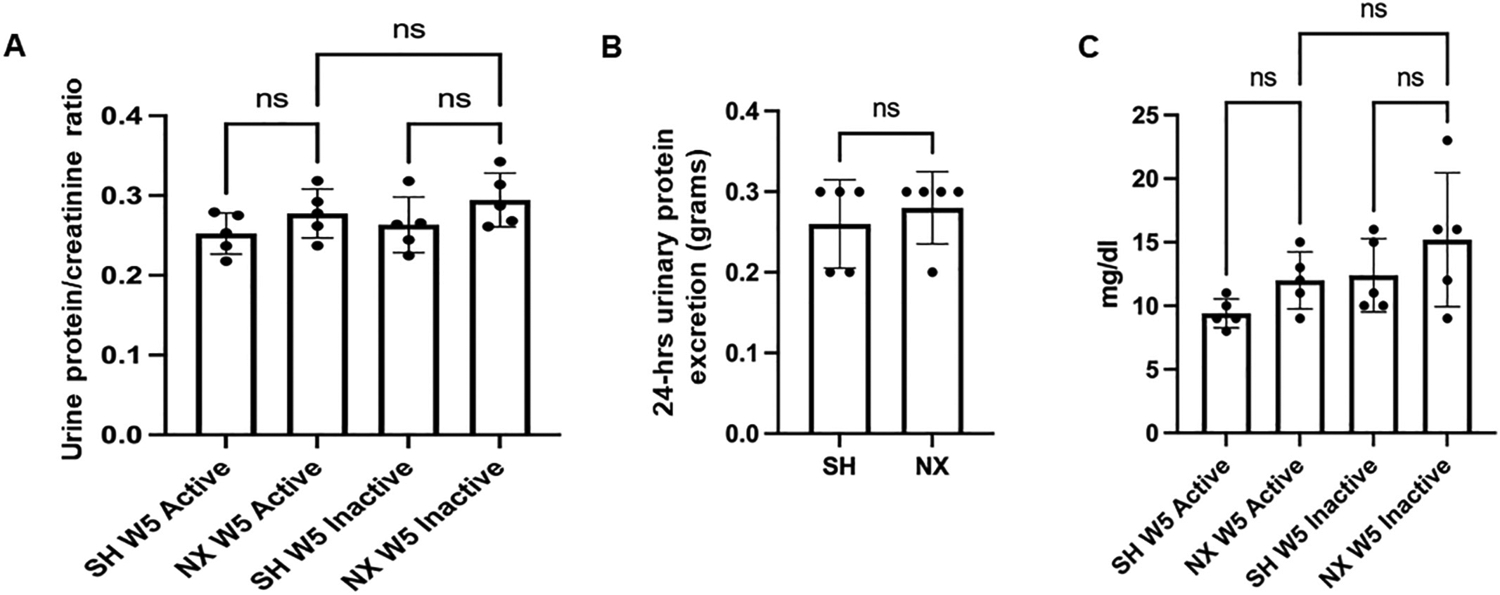
Urine protein/creatinine ratio and 24-h urine protein. A. Ratio of urinary protein to creatinine from urine samples collected during the active cycle of 5 week post-procedure sham mice (SH W5 Active) and inactive cycle of 5 week post-procedure sham mice (SH W5 inactive) and during the active cycle of 5 week post-nephrectomized mice (NX W5 Active) and inactive cycle of 5 week post-nephrectomized mice (NX W5 inactive); B. plot of 24 h urinary protein excretion (in grams) for the sham and nephrectomized mice; C. Amount of protein in mg/dl excreted in the urine during the active and inactive cycles of sham and nephrectomized mice 5 weeks after each surgical procedure. ns represents no significant difference between the groups.
3.5. Urinary electrolyte concentrations in nephrectomized mice compared Sham control mice
The level of electrolytes excreted into the urine during the active and inactive cycles were then measured in mice five weeks after nephrectomy or sham surgery. There were no appreciable differences in urinary sodium excretion (Fig. 5A) or urinary potassium excretion (Fig. 5B) between the nephrectomized mice and sham control mice during the active or inactive cycles.
Fig. 5.
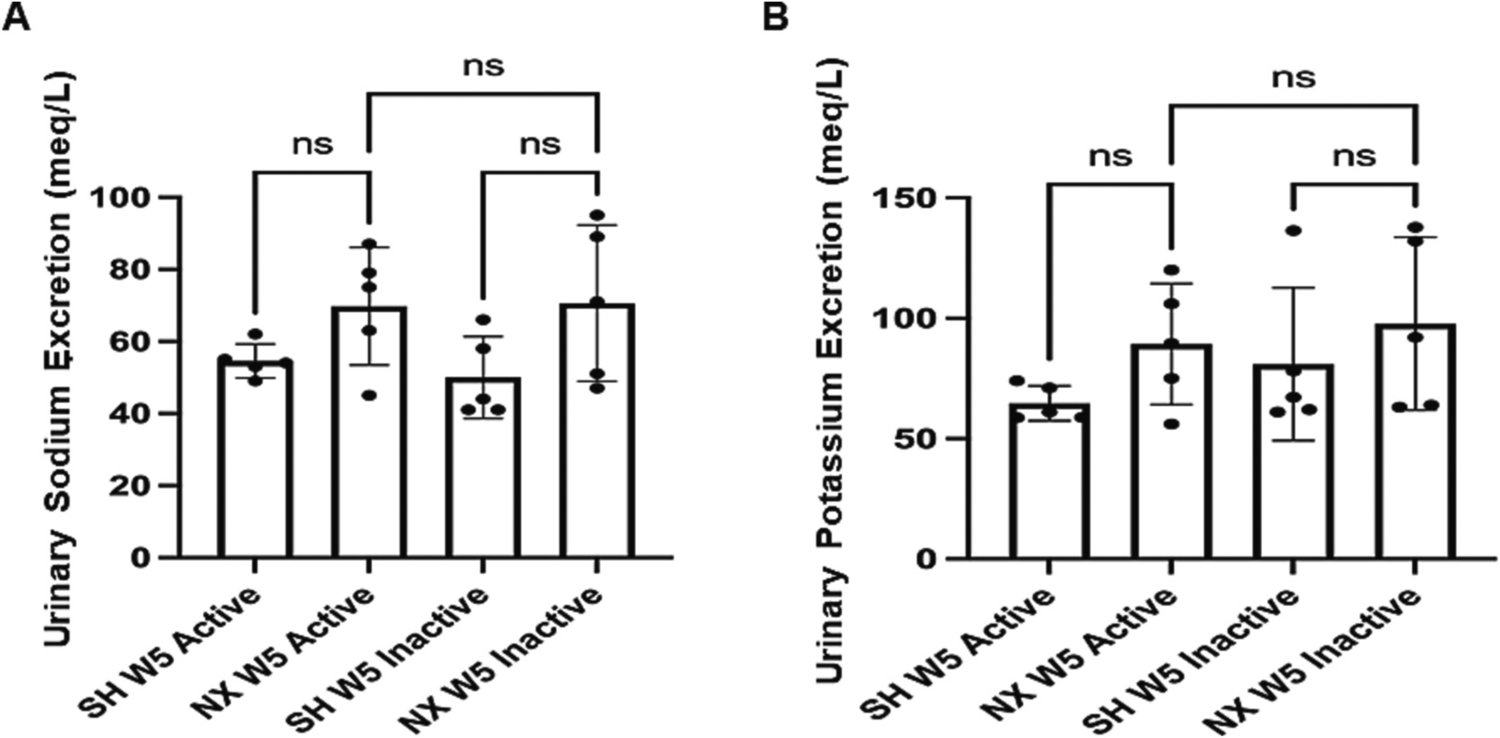
Urinary sodium and potassium levels from nephrectomized and sham control mice. A. Urinary sodium (mEq/L) levels in 5 week post-procedure sham control mice (SH W5) and 5 week post-nephrectomized mice (NX W5) from urine produced during the active and inactive cycles. B. Urinary potassium (mEq/L) levels in 5 week post-procedure sham control mice (SH W5) and 5 week post-nephrectomized mice (NX W5) from urine produced during the active and inactive cycles. ns represents no significant difference between the groups.
3.6. Changes in protein expression of renal transporters and ion channels 5 weeks after nephrectomy compared to sham control surgery
We investigated changes in membrane protein expression of multiple epithelial transport mechanisms in the kidney of juvenile mice 5 weeks after nephrectomy or sham surgery. SGLT2 protein expression (Fig. 6A) and phospho-NCC protein expression (Fig. 6B) were increased in the nephrectomized group compared to the control sham group. Conversely, NKCC2 protein expression (Fig. 6C), ENaC alpha subunit protein expression (Fig. 6D), and ENaC beta subunit protein expression (Fig. 6E) were decreased in the nephrectomized group compared to the sham group.
Fig. 6.
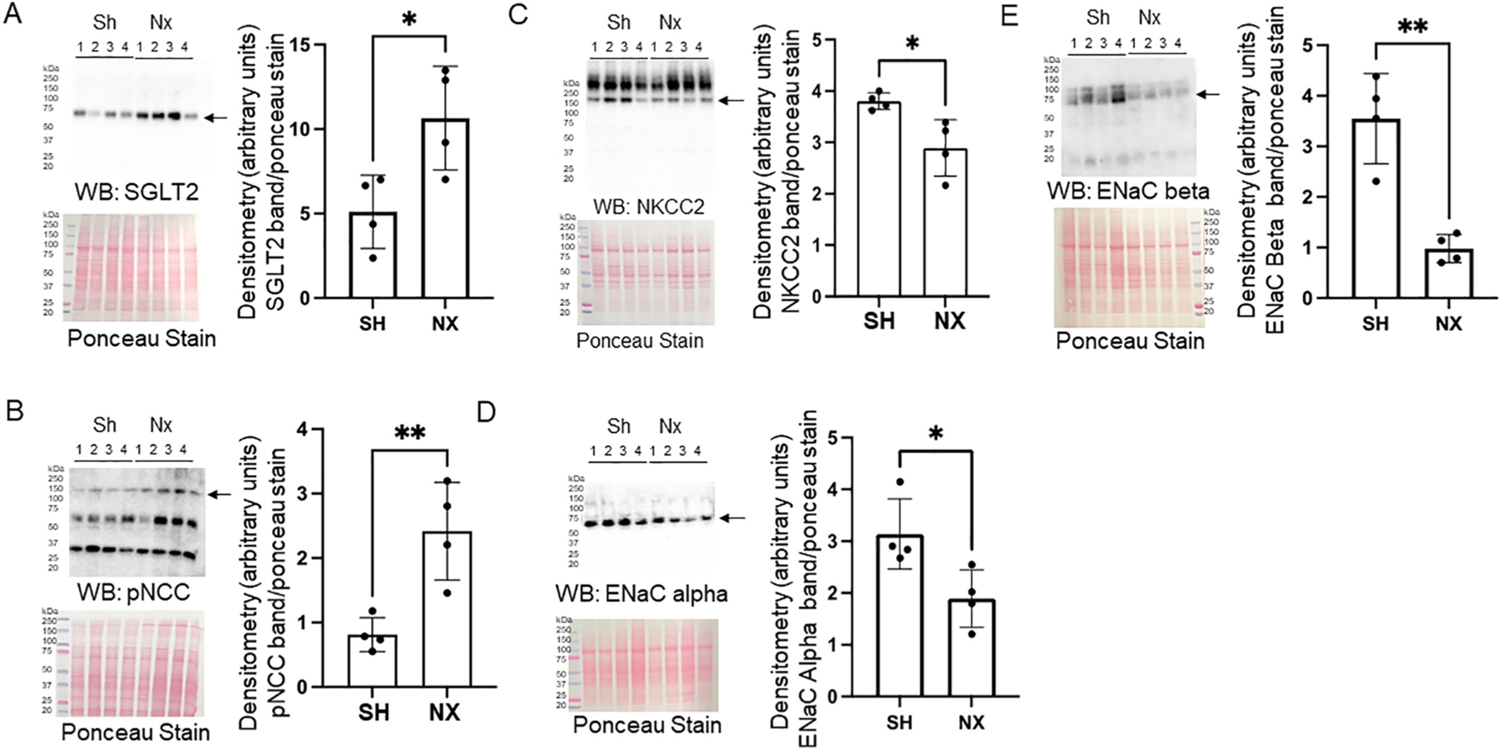
Western blot and densitometric analysis of renal transporters and ion channels in the native kidney of nephrectomized and sham control mice. A. Western blot of SGLT2 (top) and densitometric analysis of the immunoreactive band normalized to the Ponceau stain (bottom). B. Western blot of phospho-NCC (pNCC) (top) and densitometric analysis of the immunoreactive band normalized to the Ponceau stain (bottom). C. Western blot of NKCC2 (top) and densitometric analysis of the immunoreactive band normalized to the Ponceau stain (bottom). D. Western blot of ENaC alpha subunit (top) and densitometric analysis of the immunoreactive band normalized to the Ponceau stain (bottom). E. Western blot of ENaC beta subunit (top) and densitometric analysis of the immunoreactive band normalized to the Ponceau stain (bottom).
3.7. Immunohistochemistry analysis of epithelial transport proteins in the kidney of sham and nephrectomized mice
Next, to corroborate the Western blot data, protein expression of ENaC alpha, NCC, and NKCC2 in the native kidney was assessed by immunohistochemistry. There was less ENaC alpha subunit protein expression, greater NCC protein expression, and less NKCC2 protein expression in the nephrectomized kidney compared to the sham control kidney (Fig. 7).
Fig. 7.
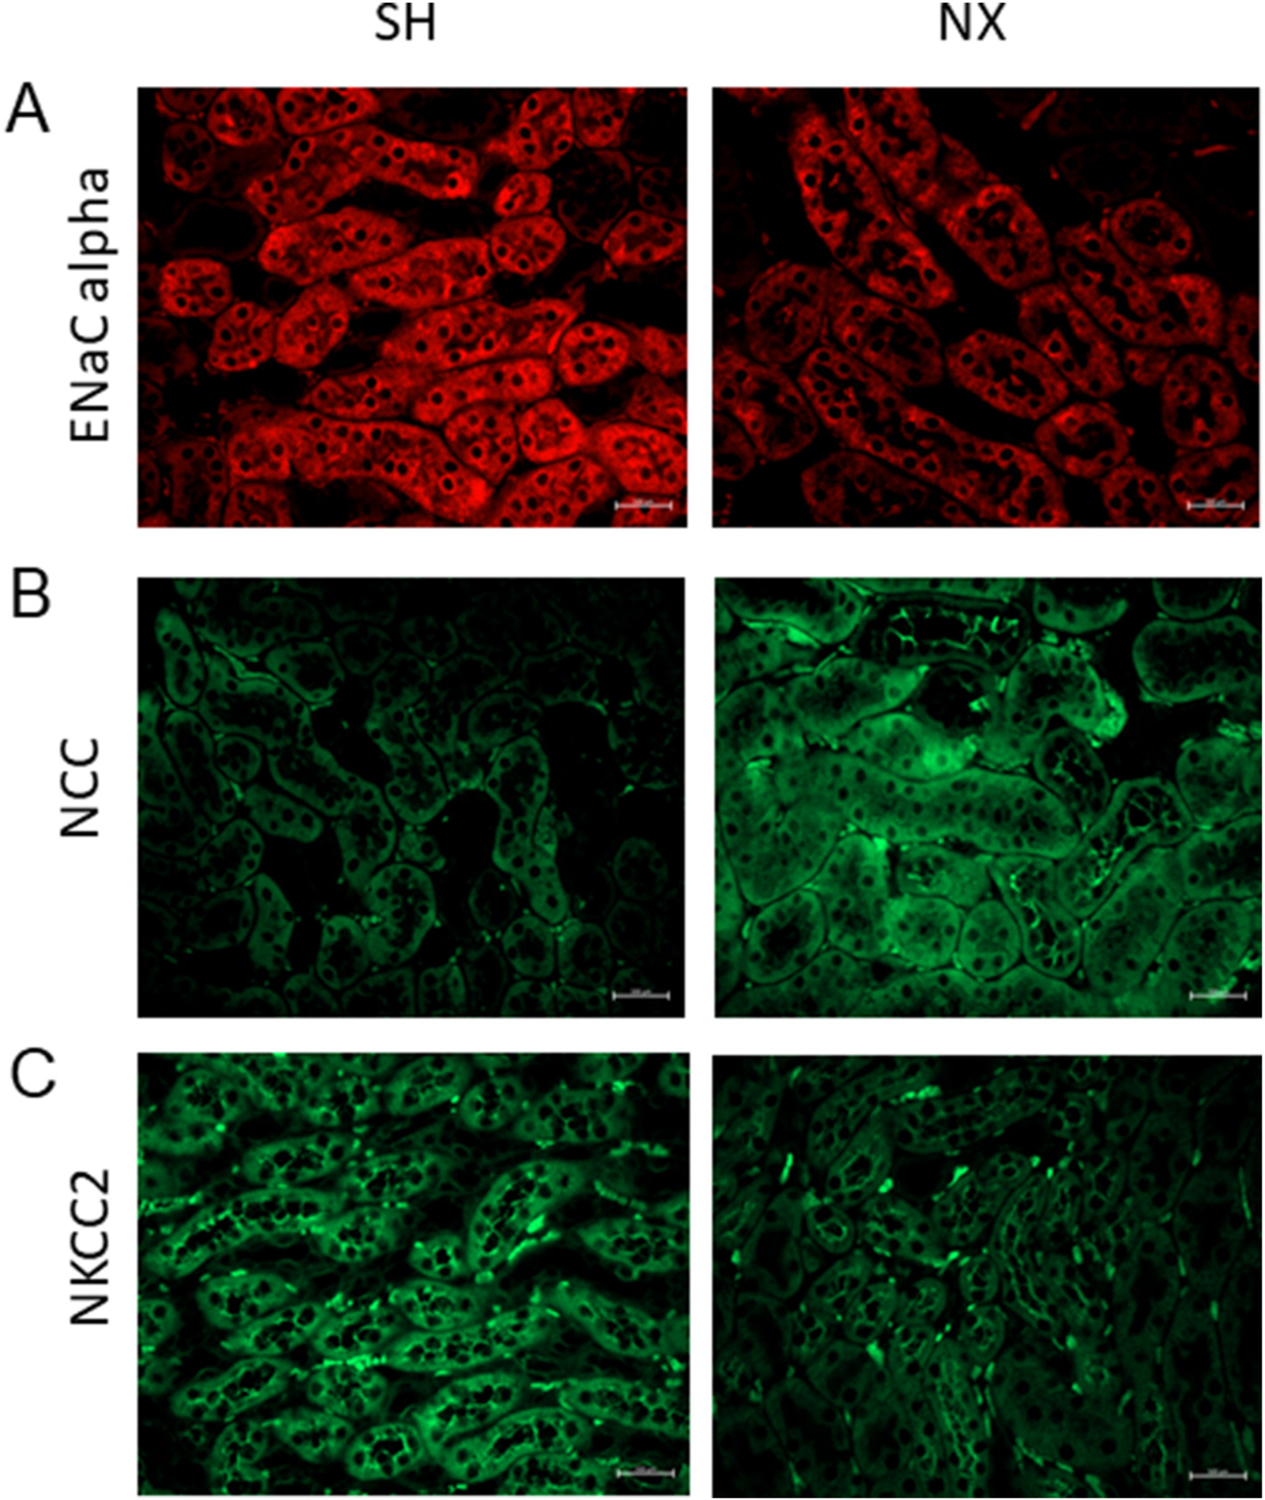
Immunohistochemistry analysis of epithelial transport proteins in the kidney of sham and unilateral nephrectomized mice. A. Immunostaining for the alpha subunit of the epithelial sodium channel (ENaC alpha) in the kidney of sham control mice and unilateral nephrectomized mice. B. Immunostaining for the sodium chloride cotransporter (NCC) in the kidney of sham control mice and unilateral nephrectomized mice. C. Immunostaining for the sodium potassium chloride cotransporter (NKCC2) in the kidney of sham control mice and unilateral nephrectomized mice. SH refers to the sham control group and NX refers to the nephrectomized group. N = 3 mice per group.
3.8. Determination of size and concentration of uEVs from nephrectomized mice and sham control mice by nanoparticle tracking analysis
uEVs are a pool of EVs released from all cells in the urinary system. Therefore, we measured the amount of uEVs from nephrectomized mice and sham control mice. Both uEV concentration and size were measured by nanoparticle tracking analysis. There was no appreciable change in the concentration of the EVs isolated from urine collections from mice 1 week or 3 weeks after nephrectomy or sham surgery during either the active or inactive cycles (Fig. 8A). Similarly, there was no change in uEV size from mice 1 week or 3 weeks after nephrectomy or sham surgery during either the active or inactive cycles (Fig. 8B). Also, 24-h uEV concentration normalized to creatinine (Fig. 8C) and 24-h uEV concentration normalized to kidney volume (Fig. 8D) were comparable between the groups. The EVtrack accession number corresponding to the EV experiments is EV240015.
Fig. 8.

Nanoparticle tracking analysis of urinary EV (uEV) concentration and size. A. Concentration of uEVs isolated from urine samples collected during the active or inactive cycle of one week post-procedure sham control mice (SH W1 Active) or (SH W1 Inactive) and nephrectomized mice (NX W1 Active) or (NX W1 Inactive) and three week post-procedure sham control mice (SH W3 Active) or (SH W3 Inactive) and nephrectomized mice (NX W3 Active) or (NX W3 Inactive). B. Size of uEVs isolated from urine samples collected during the active or inactive cycle of one week post-procedure sham control mice (SH W1 Active) or (SH W1 Inactive) and nephrectomized mice (NX W1 Active) or (NX W1 Inactive) and three week post-procedure sham control mice (SH W3 Active) or (SH W3 Inactive) and nephrectomized mice (NX W3 Active) or (NX W3 Inactive). C. 24-h uEV concentration normalized to urinary creatinine D. 24-h uEV concentration normalized to kidney volume. ns represents no significant difference between the groups.
3.9. Western blot analysis of EV markers enriched in uEVs isolated from nephrectomized mice and sham control mice
uEVs from the nephrectomized mice and sham control mice were lysed and then resolved by SDS-PAGE before probing for various established EV markers. Western blot analysis showed uEVs from the nephrectomized mice and sham control mice were enriched in HSP70, GAPDH, caveolin-1, CD9, CD63 proteins (Fig. 9). Conversely, uromodulin was not enriched in the uEVs (Fig. 9).
Fig. 9.
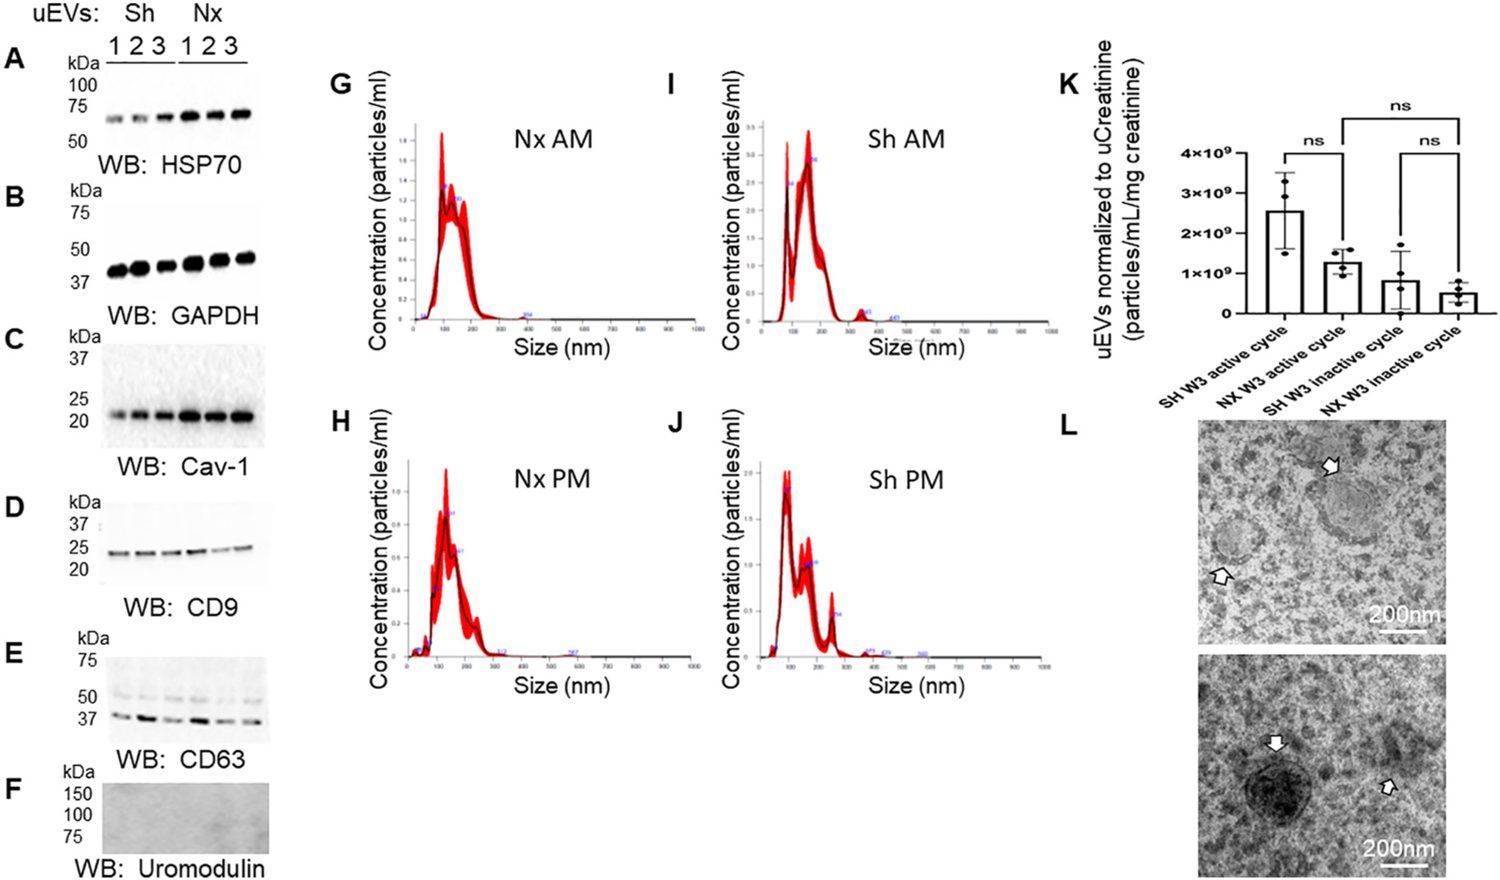
Western blot analysis of urinary extracellular vesicle (uEV) markers. A. HSP70 protein enrichment in uEVs from sham (Sh) and nephrectomized (Nx) mice; B. GAPDH protein enrichment in uEVs from sham (Sh) and nephrectomized (Nx) mice; C. Caveolin-1 (Cav-1) protein enrichment in uEVs from sham (Sh) and nehrectomized (Nx) mice; D. CD9 protein enrichment in uEVs from sham (Sh) and nehrectomized (Nx) mice; E. CD63 protein enrichment in uEVs from sham (Sh) and nehrectomized (Nx) mice; F. absence of uromodulin protein enrichment in uEVs from sham (Sh) and nehrectomized (Nx) mice; G. Representative nanoparticle tracking analysis graph showing concentration and size of uEVs isolated from urine collected from nephrectomized mice during the inactive cycle; H. Representative nanoparticle tracking analysis graph showing concentration and size of uEVs isolated from urine collected from nephrectomized mice during the active cycle; I. Representative nanoparticle tracking analysis graph showing concentration and size of uEVs isolated from urine collected from sham mice during the inactive cycle; J. Representative nanoparticle tracking analysis graph showing concentration and size of uEVs isolated from urine collected from sham mice during the active cycle; K. Plot of uEV concentration from sham and unilateral nephrectomized mice 3 weeks (W3) after the surgical procedure and after normalization to urinary creatinine; L. Representative transmission electron micrographs showing uEVs (white arrows) from sham (Sh) and nephrectomized (Nx) mice (N = 3 per group).
3.10. Metabolomic analysis of uEVs from mice one week after nephrectomy or sham surgery
Next, we performed a metabolomics analysis to investigate potential changes in the packaged molecules enriched in uEVs from mice 1 week after nephrectomy or sham surgery. We detected 998 different metabolomics, with 217 metabolomics up-regulated and 112 down-regulated in the nephrectomized group compared with Sham control group. A heatmap with the top 25 metabolites showing clustering of the metabolites based on relative concentration of the metabolites is shown in Fig. 10A. The up-regulated metabolomics in the nephrectomized group included stachydrine (Fig. 10C,E) and citrate (Fig. 10D,F).
Fig. 10.
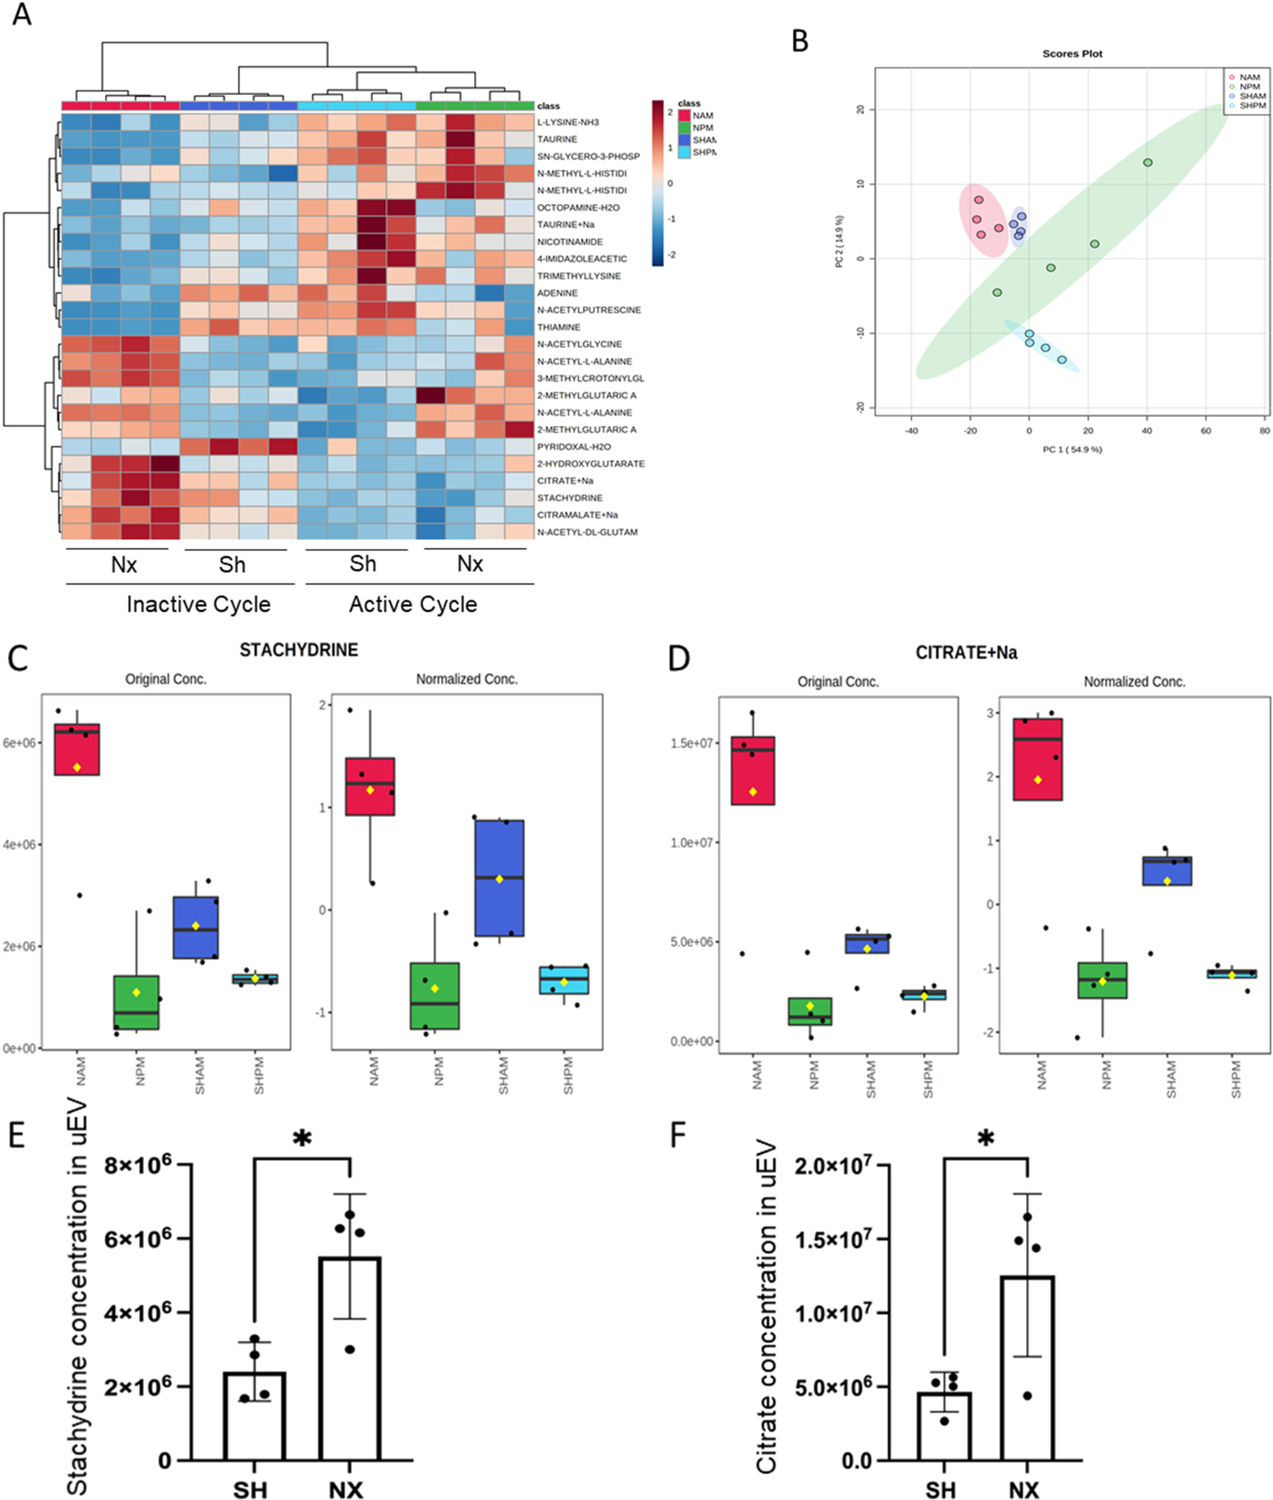
Metabolomic Analysis of uEV cargo. A. Heatmap with top 25 metabolites showing clustering of the metabolites based on relative concentration of the metabolites. Data was normalized to the median with Pareto scaling. B. Principal component analysis (PCA). C. Summary Plot of stachydrine enrichment in EVs isolated from urine samples of nephrectomized mice collected during the inactive cycle (NAM) or active cycle (NPM) and sham mice collected during the inactive cycle (SHAM) or active cycle (SHPM). D. Summary of sodium citrate enrichment in EVs isolated from urine samples of nephrectomized mice collected during the inactive cycle (NAM) or active cycle (NPM) and sham mice collected during the inactive cycle (SHAM) or active cycle (SHPM); E. plot of stachydrine concentration in uEVs from sham and nephrectomized mice; F. plot of citrate concentration in uEVs from sham and nephrectomized mice.
3.11. Down-regulation of phospho-STAT3 in mouse proximal tubule cells challenged with uEVs from nephrectomized mice compared to sham control mice
In an attempt to identify a potential protective effect of the cargo enriched in uEVs isolated from the nephrectomized mice compared to the Sham control mice we challenged mouse proximal tubule cells with 1–2 × 10⁷ particles/mL of uEVs isolated from mice 1-week post-nephrectomy or Sham surgery. After challenging the cells with uEVs from each of the two groups for 8 h, the cells were harvested for protein, and then probed by Western blotting for various protein targets. As shown in Fig. 11A, there was a significant decrease in phospho-STAT3 protein in mouse proximal tubule cells challenged with uEVs from the nephrectomized group compared to the sham control group.
Fig. 11.
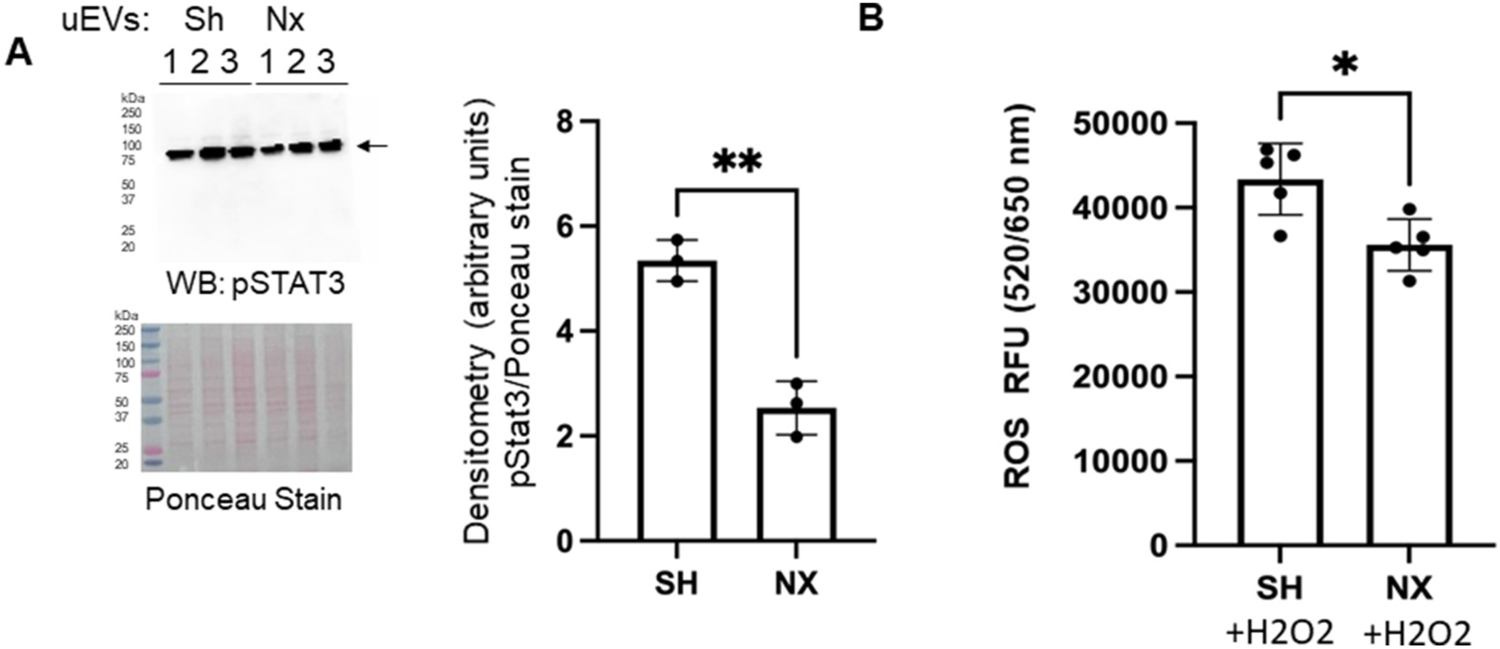
pSTAT3 protein expression and intracellular ROS levels in mouse proximal tubule cells challenged with uEVs from unilateral nephrectomized mice compared to sham control mice. A. Western blot of phospho-STAT3 (pSTAT3) and densitometric analysis of the immunoreactive band normalized to Ponceau staining. B. Intracellular ROS levels in mouse proximal tubule cells after challenging healthy mouse proximal tubular cell with uEVs for 4 h. * represents a p-value of <0.05. ** represents a p-value of ≤0.01.
3.12. ROS levels decrease in mouse proximal tubular cells challenged with uEVs from nephrectomized mice compared to sham control mice
We measured the levels of reactive oxygen species (ROS) generated in mouse proximal tubule cells after challenging the cells for 4 h with H2O2 and uEVs isolated after 1-week post-nephrectomy or uEVs from Sham control surgery. There was a significant decrease in the ROS generated in the proximal tubule cells treated with the uEVs isolated from the nephrectomized group compared to Sham control group (Fig. 11B).
4. Discussion
In this study, we conducted an analysis of functional and metabolomic changes in uEVs to elucidate renal compensatory mechanisms following unilateral nephrectomy in juvenile mice. It is essential to highlight the potential implications of these findings on human physiology, as mice share a remarkable 99 % genomic identity with humans, reflecting similar physiological processes [32,33].
Our research builds upon the earlier work of Blijdorp et al., who observed a notable sex-related difference in uEV excretion, reporting a 49 % reduction in uEVs in female mice compared to males. This difference was attributed to the higher nephron endowment in male mice [34]. Therefore, we performed unilateral nephrectomies and sham surgeries in male juvenile mice. The mice were subjected to metabolic cage studies to collect 24-hour urine on a weekly basis over a five-week period. Accordingly, mice 7.6–10 weeks of age corresponds to 15–20 years of age for humans [33].
Our results demonstrated a substantial 50 % increase in kidney volume in the nephrectomized group when normalized to the right kidney of the sham group. Additionally, there was a 53.8 % increase in kidney weight in the nephrectomized group compared to the right kidney of the sham group. The heightened renal mass density observed in the nephrectomy group, relative to the Sham control group, denotes an increased cellular proliferation and enhanced functional capacity via increasing the metabolic activity within the remaining kidney cells. This phenomenon reflects an adaptive response aimed at compensating for a 50 % reduction in functional kidney mass to sustain a normal glomerular filtration rate and meet the increased functional demands. These outcomes align with the findings of Rojas-Canales et al. and Nowinski et al., who reported a 1.5-fold increase in the mass of the remaining kidney following unilateral nephrectomy [35,61]. The nature and extent of compensatory renal growth are influenced by age, with the high mitotic capacity of the young kidney contributing to these differences [36]. This age-dependent compensatory hypertrophy has also been observed in similar studies involving rats and humans [36–39].
Analysis of water intake and urine output during the five-week observation period post-nephrectomy or sham procedure revealed no significant differences between the two groups during both active and inactive cycles. Although a 50 % loss of functional kidney mass in the nephrectomized group would theoretically lead to a proportional decrease in urine output, an increase in single-nephron glomerular filtration rate (SNGFR) and renal tubular capacity appears to compensate and maintain water and salt homeostasis, as supported by previous research [40,41]. In line with the circadian rhythm, there were significant differences within each group during the active and inactive cycles, leading to a decrease in urine output during the inactive cycle (Fig. 2).
Urinary sodium and potassium levels were measured at week 5 post-unilateral nephrectomy during both active and inactive cycles. While a modest increase in these electrolytes was observed in the nephrectomized group compared to the sham group, the differences were not statistically significant. This modest increase suggests enhanced natriuresis, although more research is needed to establish the significance of these findings.
In a study by Blijdorp et al., uEV excretion was found to be dependent on nephron loss due to compensatory hypertrophy [34]. In our study, uEV size and concentration showed no significant differences during the active and inactive cycles at week 1 and week 3 post-nephrectomy compared to sham control. After week 1 of unilateral nephrectomy there appeared to be a trend for a modest reduction in the amount of EVs excreted into the urine during the active cycle of nephrectomized mice compared to the active cycle of the sham control group. However, upon normalizing to urinary creatinine there was not a statistically significant difference between the two groups. This suggest there is renal compensation in the remaining kidney to prevent changes in the number of EVs that are released. Another possibility is that the there are differences in the amount of EVs being taken up by recipient cells in different segments of the nephron.
Serum creatinine levels were assessed at multiple time points during the study, specifically at week 2 and week 4 during both active and inactive cycles. No significant differences were detected between the two groups. Although invasive procedures like inulin or sinistrin clearance were not performed due to the small size of the mice (body weight 13–25 g), we also measured serum cystatin C levels as a reliable biomarker of glomerular clearance in mice, as cystatin C is becoming more commonly used in the field [42–46]. Cystatin C was measured at different time points during the study, at week 3 and week 5 during active and inactive cycles. While a modest increase in serum cystatin C was observed in the nephrectomized group compared to the sham group toward the end of the study, these differences did not reach statistical significance. That could be attributed to the juvenile mouse model compared to adult mouse model along with the short observation periods of 5 weeks post-procedure compared to longer observation periods.
Subsequently, we investigated alterations in protein expression of various transporters and ion channels in the kidney following a 5-week post-nephrectomy period, anticipating differential expression to facilitate electrolyte homeostasis. We observed increased protein expression of the sodium-glucose co-transporter 2 (SGLT2) and Na–Cl cotransporter (NCC), and reduced expression of sodium-potassium-2 chloride co-transporter 2 (NKCC2) and epithelial sodium channel (ENaC) alpha and beta in the kidney cortex membrane fractions from the nephrectomized group by immunoassays. In some cases, the results of our study are in contrast with other published studies [47,49]. For example, a study by Ernandez et al. did not show a difference in NKCC2, NCC, or ENaC alpha protein expression in 6–8 week old C57B6 mice. [47]. In a study by Singh et al., ENaC alpha protein expression was found to be reduced in uninephrectomized male sheep [48]. In a study by Kim et al., ENaC alpha protein expression was found to be elevated in Sprague-Dawley rats after a 5/6 nephrectomy [49]. Potential reasons for the discrepancy in the results may be due to differences in the commercial sources of the animals, differences in the primary antibodies used to perform the immunoassays, difference in species, or differences in the animal model.
In addition to protein expression, we conducted metabolomics to explore the unique cargo of uEVs following unilateral nephrectomy. Our analysis identified 998 different metabolites, with 217 upregulated and 112 downregulated metabolites in the nephrectomized group compared to the sham control group. Notably, among these metabolites, citrate and stachydrine showed striking differences between the two groups, motivating further investigation.
Sodium citrate is often employed as alkali therapy for managing chronic kidney disease (CKD) [50]. It plays a pivotal role in ameliorating the progression of CKD by decreasing inflammation, endothelin production, and cytokines [51–53]. Our findings indicate that sodium citrate, enriched in uEVs post-unilateral nephrectomy, could potentially offer beneficial effects. Moreover, citrate’s reabsorption in the renal proximal tubule through the sodium-dicarboxylate cotransporter (NaDC) and its bicarbonate-producing properties can contribute to mitigating metabolic acidosis [54]. Additionally, citrate may enter the mitochondria and engage in the citric cycle, potentially ameliorating mitochondrial dysfunction associated with CKD [55].
Stachydrine is found in citrus and is a major component of Traditional Chinese Medicine herb Leonurus japonicus Houtt, (Motherwort or Yi Mu Cao) that has been used for over 2 thousand years in Traditional Chinese Medicine, demonstrated substantial anti-fibrotic, anti-inflammatory, and anti-oxidative stress effects [56]. Zhang et al. demonstrated that stachydrine improved renal interstitial fibrosis (RIF) and suppressed apoptosis of renal tubular epithelial cells via the ERS-mediated apoptosis pathway by reducing the expression of caspase-12 and inhibiting activation of caspase-9 in unilateral ureteral obstruction (UUO) in stachydrine treated rats [57,58]. The enrichment of stachydrine in uEVs from nephrectomized juvenile mice, compared to sham mice, suggests the potential for anti-fibrotic and anti-inflammatory properties in recipient cells. Another study by Sajid et al. reported stachydrine levels in the kidney and suggested it is a hypoxic biomarker [59].
To assess the bioactivity of uEVs isolated from the unilateral nephrectomized group in comparison to the control sham group, we exposed healthy mouse tubular cells to the isolated uEVs collected one-week post-nephrectomy or sham procedure from both groups. We treated cells with a physiological concentration of 1–2 × 10⁷ particles/mL based on similar studies that have been performed [21]. The results revealed a significant downregulation of pSTAT3 in proximal tubule cells treated with uEVs from the nephrectomized group, indicating potential anti-inflammatory effects. Additionally, we observed a significant reduction in reactive oxygen species (ROS) generation in proximal tubule cells treated with uEVs from the nephrectomized group, suggesting potential anti-inflammatory and antifibrinolytic, and antioxidative stress effects. EVs released from a given cell type in one segment of the nephron may be taken up by the same cell type or other cell types in downstream segments across the luminal plasma membrane to allow for changes in intracellular signaling and cellular communication. Alternatively, EVs can be released across the basolateral plasma membrane of any cell type along the nephron before being reabsorbed.
A study by Kikuchi et al. suggested the peroxisome proliferator-activated receptor alpha (PPARα) is a likely mediator of compensatory proximal tubule hypertrophy [15]. We did not observe an appreciable difference in PPARα in our nephrectomized mice compared to the sham control group. One reason for this discrepancy may be due to difference in the ages of the mice as we performed our surgeries in juvenile mice.
Despite the results of this study being novel at multiple levels there were some limitations. First, this study was limited by the small sample size. This may have prevented detection of statistically significant differences in several intergroup comparisons. Another limitation was the inability to sort the uEVs to determine their origin of release from various renal tubular cell types. Moreover, the detection of tubule segment markers including NKCC2, NCC, and ENaC in uEVs is not feasible by Western blotting since these proteins are not abundantly enriched in the uEVs. The detection of these epithelial transport proteins in uEVs may be accomplished by mass spectrometry. Another limitation of our study is that we did not investigate differences between the renal cortex and renal medulla of juvenile mice after nephrectomy. Although we corroborated our Western blot data of renal NKCC2, NCC, and ENaC protein expression by immunohistochemistry, a follow-up study may focus on investigating whether there are regional differences in these epithelial transport proteins and others in the kidneys of nephrectomized mice compared to sham control mice. Finally, difficulty in accessing adequate blood volume during the active and inactive cycles in the juvenile mice limited our ability to measure additional serum factors.
In summary, these studies suggest that EVs in the renal tubular lumen are endowed with metabolites with cyto-protective activity. We identified two mechanisms for this activity: Downregulation of STAT3 pathway proteins and reducing intracellular ROS generation in proximal tubule cells. These findings open new avenues for research on the therapeutic potential of uEVs in kidney diseases, underscoring the importance of considering developmental stages, age-related factors, and the complex regulatory mechanisms involved in renal compensation.
Acknowledgements
This work was supported by a National Institutes of Diabetes and Digestive and Kidney Diseases Grant R01 DK123078-01A1 (to AAA) and Children Miracle Network Grant (to R.A.).
Footnotes
CRediT authorship contribution statement
Rasha Aly: Writing – review & editing, Writing – original draft, Investigation, Funding acquisition, Formal analysis, Data curation, Conceptualization. Sara Darwish: Writing – review & editing, Investigation, Formal analysis. Niharika Bala: Writing – review & editing, Investigation, Formal analysis. Areej Ebrahim: Writing – review & editing, Investigation, Formal analysis. Lawrence R. Shoemaker: Writing – review & editing, Resources, Project administration, Conceptualization. Joel McCray: Writing – review & editing, Investigation, Formal analysis. Timothy J. Garrett: Writing – review & editing, Project administration, Formal analysis. Abdel A. Alli: Writing – review & editing, Writing – original draft, Project administration, Investigation, Funding acquisition, Formal analysis, Conceptualization.
Declaration of competing interest
There are no interests to declare from any of the co-authors of this manuscript.
Data availability
Data will be made available on request.
References
- [1].McArdle Z, Schreuder MF, Moritz KM, Denton KM, Singh RR, Physiology and pathophysiology of compensatory adaptations of a solitary functioning kidney, Front. Physiol 11 (2020) 725, 10.3389/fphys.2020.00725. [DOI] [PMC free article] [PubMed] [Google Scholar]
- [2].Eknoyan G, Lameire N, Eckardt K, Kasiske B, Wheeler D, Levin A, Stevens PE, Bilous RW, Lamb EJ, Coresh J, et al. , KDIGO 2012 clinical practise guidelines for the evaluation and management of chronic kidney disease, Kidney Int. 3 (2013) 5–14. [Google Scholar]
- [3].North American Pediatric Renal Trials and Collaborative Studies (NAPRTCS), 2008 Annual Report, Rockville, MD, EMMES, 2008. [Google Scholar]
- [4].Ardissino G, Daccò V, Testa S, Bonaudo R, Claris-Appiani A, Taioli E, Marra G, Edefonti A, Sereni F, ItalKid Project, Epidemiology of chronic renal failure in children: data from the ItalKid project, Pediatrics 111 (4 Pt 1) (2003. Apr) e382–e387. [DOI] [PubMed] [Google Scholar]
- [5].Potter EL, Thierstein ST, Glomerular development in the kidney as an index of fetal maturity, J. Pediatr 22 (1943) 695–706, 10.1016/S0022-3476(43)80226-2. [DOI] [Google Scholar]
- [6].Hegde S, Coulthard MG, Renal agenesis and unilateral nephrectomy: what are the risks of living with a single kidney? Pediatr. Nephrol 24 (2009) 439–446, 10.1007/s00467-008-0924-9. [DOI] [PubMed] [Google Scholar]
- [7].Hartshorne N, Shepard T, Barr M Jr., Compensatory renal growth in human fetuses with unilateral renal agenesis, Teratology 44 (1) (1991) 7–10, 10.1002/tera.1420440103. [DOI] [PubMed] [Google Scholar]
- [8].John U, Rudnik-Schöneborn S, Zerres K, et al. , Kidney growth and renal function in unilateral multicystic dysplastic kidney disease, Pediatr. Nephrol. 12 (1998) 567–571, 10.1007/s004670050506. [DOI] [PubMed] [Google Scholar]
- [9].van Vuuren SH, van der Doef R, Cohen-Overbeek TE, Goldschmeding R, Pistorius LR, de Jong TP, Compensatory enlargement of a solitary functioning kidney during fetal development, Ultrasound Obstet. Gynecol 40 (6) (2012) 665–668, 10.1002/uog.11168. [DOI] [PubMed] [Google Scholar]
- [10].Mandell J, Peters CA, Estroff JA, Allred EN, Benacerraf BR, Human fetal compensatory renal growth, J. Urol 150 (2 Pt 2) (1993) 790–792, 10.1016/s0022-5347(17)35614-8. [DOI] [PubMed] [Google Scholar]
- [11].Fine LG, Yanagawa N, Schultze RG, Tuck M, Trizna W, Functional profile of the isolated uremic nephron: potassium adaptation in the rabbit cortical collecting tubule, J. Clin. Invest 64 (4) (1979) 1033–1043, 10.1172/JCI109540. [DOI] [PMC free article] [PubMed] [Google Scholar]
- [12].Fine LG, Bradley T, Adaptation of proximal tubular structure and function: insights into compensatory renal hypertrophy, Fed. Proc 44 (11) (1985) 2723–2727. [PubMed] [Google Scholar]
- [13].Pfaller W, Seppi T, Ohno A, Giebisch G, Beck FX, Quantitative morphology of renal cortical structures during compensatory hypertrophy, Exp. Nephrol 6 (4) (1998) 308–319, 10.1159/000020538. [DOI] [PubMed] [Google Scholar]
- [14].Liu B, Preisig PA, Compensatory renal hypertrophy is mediated by cycle-dependent mechanism, Kidney Int. 62 (5) (2002. Nov) 1650–1658, 10.1046/j.1523-1755.2002.00620.x. [DOI] [PubMed] [Google Scholar]
- [15].Kikuchi H, Chou C, Yang C, Chen L, Jung HJ, Park E, Limbutara K, Carter B, Yang Z, Kun JF, Remaley AT, Knepper MA, Signaling mechanisms in renal compensatory hypertrophy revealed by multi-omics, Nat. Commun 14 (1) (2023) 3481. [DOI] [PMC free article] [PubMed] [Google Scholar]
- [16].Bruno S, Chiabotto G, Favaro E, Deregibus MC, Camussi G, Role of extracellular vesicles in stem cell biology, Am. J. Phys. Cell Phys 317 (2) (2019) C303–C313, 10.1152/ajpcell.00129.2019 (Epub 2019 May 15.). [DOI] [PMC free article] [PubMed] [Google Scholar]
- [17].Thakur Abhimanyu, Ke Xiaoshan, Chen Ya-Wen, Motallebnejad Pedram, Zhang Kui, Lian Qizhou, Chen Huanhuan Joyce, The mini player with diverse functions: extracellular vesicles in cell biology, disease, and therapeutics, Protein Cell 13 (9) (2022) 631–654, 10.1007/s13238-021-00863-6. [DOI] [PMC free article] [PubMed] [Google Scholar]
- [18].Sun IO, Lerman LO, Urinary extracellular vesicles as biomarkers of kidney disease: from diagnostics to therapeutics, Diagnostics (Basel) 10 (5) (2020) 311, 10.3390/diagnostics10050311. [DOI] [PMC free article] [PubMed] [Google Scholar]
- [19].Zarà M, Guidetti GF, Camera M, Canobbio I, Amadio P, Torti M, Tremoli E, Barbieri SS, Biology and role of Extracellular Vesicles (EVs) in the pathogenesis of thrombosis, Int. J. Mol. Sci 20 (11) (2019) 2840, 10.3390/ijms20112840. [DOI] [PMC free article] [PubMed] [Google Scholar]
- [20].Mittelbrunn M, Gutíerrez-Vázquez C, Villarroya-Beltri C, et al. , Unidirectional transfer of microRNA-loaded exosomes from T cells to antigen-presenting cells, Nat. Commun 2 (2011) 282, 10.1038/ncomms1285. [DOI] [PMC free article] [PubMed] [Google Scholar]
- [21].Pekkucuksen NT, Liu LP, Aly R, Shoemaker LR, Alli AA, Extracellular vesicles from focal segmental glomerulosclerosis pediatric patients induce STAT3 activation and mesangial cell proliferation, PLoS One 17 (11) (2022) e0274598, 10.1371/journal.pone.0274598. [DOI] [PMC free article] [PubMed] [Google Scholar]
- [22].Pomatto MAC, Gai C, Bussolati B, Camussi G, Extracellular vesicles in renal pathophysiology, Front. Mol. Biosci 4 (2017) 37, 10.3389/fmolb.2017.00037. [DOI] [PMC free article] [PubMed] [Google Scholar]
- [23].Kwon SH, Extracellular vesicles in renal physiology and clinical applications for renal disease, Korean J. Intern. Med 34 (3) (2019) 470–479, 10.3904/kjim.2019.108 (Epub 2019 Apr 30.). [DOI] [PMC free article] [PubMed] [Google Scholar]
- [24].Raposo G, Stoorvogel W, Extracellular vesicles: exosomes, microvesicles, and friends, J. Cell Biol 200 (4) (2013) 373–383, 10.1083/jcb.201211138. [DOI] [PMC free article] [PubMed] [Google Scholar]
- [25].Valadi H, Ekström K, Bossios A, Sjöstrand M, Lee JJ, Lötvall JO, Exosome-mediated transfer of mRNAs and microRNAs is a novel mechanism of genetic exchange between cells, Nat. Cell Biol 9 (6) (2007) 654–659, 10.1038/ncb1596 (Epub 2007 May 7.). [DOI] [PubMed] [Google Scholar]
- [26].Katsuda T, Kosaka N, Takeshita F, Ochiya T, The therapeutic potential of mesenchymal stem cell-derived extracellular vesicles, Proteomics 13 (10 11) (2013) 1637–1653, 10.1002/pmic.201200373 (Epub 2013 Feb 26.). [DOI] [PubMed] [Google Scholar]
- [27].Gurung S, Perocheau D, Touramanidou L, Baruteau J, The exosome journey: from biogenesis to uptake and intracellular signalling, Cell Commun. Signal 19 (1) (2021) 47, 10.1186/s12964-021-00730-1. [DOI] [PMC free article] [PubMed] [Google Scholar]
- [28].Nikoloff JM, Saucedo-Espinosa MA, Kling A, Dittrich PS, Identifying extracellular vesicle populations from single cells, Proc. Natl. Acad. Sci. U. S. A 118 (38) (2021) e2106630118, 10.1073/pnas.2106630118. [DOI] [PMC free article] [PubMed] [Google Scholar]
- [29].D’Souza-Schorey C, Clancy JW, Tumor-derived microvesicles: shedding light on novel microenvironment modulators and prospective cancer biomarkers, Genes Dev. 26 (12) (2012) 1287–1299, 10.1101/gad.192351.112. [DOI] [PMC free article] [PubMed] [Google Scholar]
- [30].Andaloussi SEL, Mäger I, Breakefield X, et al. , Extracellular vesicles: biology and emerging therapeutic opportunities, Nat. Rev. Drug Discov 12 (2013) 347–357, 10.1038/nrd3978. [DOI] [PubMed] [Google Scholar]
- [31].Alli AA, Bao HF, Alli AA, Aldrugh Y, Song JZ, Ma HP, Yu L, Al-Khalili O, Eaton DC, Phosphatidylinositol phosphate-dependent regulation of Xenopus ENaC by MARCKS protein, Am. J. Physiol. Ren. Physiol 303 (2012) F800–811. [DOI] [PMC free article] [PubMed] [Google Scholar]
- [32].Gúenet JL, The mouse genome, Genome Res. 15 (12) (2005) 1729–1740, 10.1101/gr.3728305. [DOI] [PubMed] [Google Scholar]
- [33].Wang Shuo, Lai Xiaoxue, Deng Yihui, Song Yanzhi, Correlation between mouse age and human age in anti-tumor research: significance and method establishment, Life Sci. 242 (2020) 117242, 10.1016/j.lfs.2019.117242 (ISSN 0024–3205). [DOI] [PubMed] [Google Scholar]
- [34].Blijdorp CJ, Hartjes TA, Wei KY, van Heugten MH, Bovée DM, Budde RPJ, van de Wetering J, Hoenderop JGJ, van Royen ME, Zietse R, Severs D, Hoorn EJ, Nephron mass determines the excretion rate of urinary extracellular vesicles, J. Extracell Vesic 11 (1) (2022) e12181, 10.1002/jev2.12181. [DOI] [PMC free article] [PubMed] [Google Scholar]
- [35].Rojas-Canales DM, Li JY, Makuei L, Gleadle JM, Compensatory renal hypertrophy following nephrectomy: when and how? Nephrology (Carlton) 24 (12) (2019) 1225–1232, 10.1111/nep.13578 (Epub 2019 May 5.). [DOI] [PubMed] [Google Scholar]
- [36].Celsi G, Jakobsson B, Aperia A, Influence of age on compensatory renal growth in rats, Pediatr. Res 20 (4) (1986) 347–350, 10.1203/00006450-198604000-00018. [DOI] [PubMed] [Google Scholar]
- [37].Dossetor RS, Renal compensatory hypertrophy in the adult, Br. J. Radiol 48 (576) (1975) 993–995, 10.1259/0007-1285-48-576-993. [DOI] [PubMed] [Google Scholar]
- [38].TAPSON JS, OWEN JP, ROBSON RA, WARD MK, WILKINSON R, Renal Hypertrophy After Donor Nephrectomy Clinical Radiology, 1985 (36, 307 310 0009–9260/85/435307502.00 © 1985 Royal College of Radiologists Compensatory). [DOI] [PubMed]
- [39].Sugaya K, Ogawa Y, Hatano T, Koyama Y, Miyazato T, Naito A, Yonou H, Kagawa H, Compensatory renal hypertrophy and changes of renal function following nephrectomy, Hinyokika Kiyo 46 (4) (2000) 235–240. [PubMed] [Google Scholar]
- [40].McArdle Z, Schreuder MF, Moritz KM, Denton KM, Singh RR, Physiology and pathophysiology of compensatory adaptations of a solitary functioning kidney, Front. Physiol 11 (2020) 725, 10.3389/fphys.2020.00725. [DOI] [PMC free article] [PubMed] [Google Scholar]
- [41].Fattah H, Layton A, Vallon V, How do kidneys adapt to a deficit or loss in nephron number? Physiology (Bethesda) 34 (3) (2019) 189–197, 10.1152/physiol.00052.2018. [DOI] [PMC free article] [PubMed] [Google Scholar]
- [42].Song S, Meyer M, Turk TR, Wilde B, Feldkamp T, Assert R, et al. , Serum cystatin C in mouse models: a reliable and precise marker for renal function and superior to serum creatinine, Nephrol. Dial. Transplant 24 (4) (2009) 1157–1161 (Epub 2008/11/14. doi: 10.1093/ndt/gfn626. [DOI] [PubMed] [Google Scholar]
- [43].Leelahavanichkul A, Souza AC, Street JM, Hsu V, Tsuji T, Doi K, Li L, Hu X, Zhou H, Kumar P, Schnermann J, Star RA, Yuen PS, Comparison of serum creatinine and serum cystatin C as biomarkers to detect sepsis-induced acute kidney injury and to predict mortality in CD-1 mice, Am. J. Physiol. Ren. Physiol 307 (8) (2014) F939–48, 10.1152/ajprenal.00025.2013 (Epub 2014 Aug 20.). [DOI] [PMC free article] [PubMed] [Google Scholar]
- [44].Bökenkamp Arend, Ciarimboli Giuliano, Dieterich Christian, Cystatin c in a rat model of end-stage renal failure, Ren. Fail 23 (3–4) (2001) 431–438, 10.1081/JDI-100104726. [DOI] [PubMed] [Google Scholar]
- [45].Villa P, Jiménez M, Soriano MC, et al. , Serum cystatin C concentration as a marker of acute renal dysfunction in critically ill patients, Crit. Care 9 (2005) R139, 10.1186/cc3044. [DOI] [PMC free article] [PubMed] [Google Scholar]
- [46].Benoit SW, Ciccia EA, Devarajan P, Cystatin C as a biomarker of chronic kidney disease: latest developments, Expert. Rev. Mol. Diagn 20 (10) (2020) 1019–1026, 10.1080/14737159.2020.1768849 (Epub 2020 May 25.). [DOI] [PMC free article] [PubMed] [Google Scholar]
- [47].Ernandez T, Udwan K, Chassot A, Martin PY, Feraille E, Uninephrectomy and apical fluid shear stress decrease ENaC abundance in collecting duct principal cells, Am. J. Physiol. Ren. Physiol 314 (5) (2018) F763–F772, 10.1152/ajprenal.00200.2017 (Epub 2017 Sep 6.). [DOI] [PubMed] [Google Scholar]
- [48].Singh Reetu R., Denton Kate M., Bertram John F., Jefferies Andrew J., Moritz Karen M., Reduced nephron endowment due to fetal uninephrectomy impairs renal sodium handling in male sheep, Clin. Sci. (Lond.) 118 (11) (2010) 669–680. [DOI] [PubMed] [Google Scholar]
- [49].Kim S, Heo NJ, Jung JY, Son M-J, Jang HR, Lee JW, Oh YK, Na KY, Joo KW, Han JS, Changes in the sodium and potassium transporters in the course of chronic renal failure, Nephron. Physiol 115 (2010) 31–41, 10.1159/000314542. [DOI] [PubMed] [Google Scholar]
- [50].Kim S, Yang JY, Jung ES, Lee J, Heo NJ, Lee JW, Na KY, Han JS, Effects of sodium citrate on salt sensitivity and kidney injury in chronic renal failure, J. Korean Med. Sci 29 (12) (2014. Dec) 1658–1664, 10.3346/jkms.2014.29.12.1658 (Epub 2014 Nov 21.). [DOI] [PMC free article] [PubMed] [Google Scholar]
- [51].Wesson DE, Simoni J, Acid retention during kidney failure induces endothelin and aldosterone production which lead to progressive GFR decline, a situation ameliorated by alkali diet, Kidney Int. 78 (11) (2010) 1128–1135, 10.1038/ki.2010.348 (Epub 2010 Sep 22.). [DOI] [PubMed] [Google Scholar]
- [52].Gadola L, Noboa O, Márquez MN, Rodriguez MJ, Nin N, Boggia J, Ferreiro A, García S, Ortega V, Musto ML, Ponte P, Sesser P, Pizarrosa C, Ravaglio S, Vallega A, Calcium citrate ameliorates the progression of chronic renal injury, Kidney Int. 65 (4) (2004) 1224–1230, 10.1111/j.1523-1755.2004.00496.x. [DOI] [PubMed] [Google Scholar]
- [53].Phisitkul S, Khanna A, Simoni J, Broglio K, Sheather S, Rajab MH, Wesson DE, Amelioration of metabolic acidosis in patients with low GFR reduced kidney endothelin production and kidney injury, and better preserved GFR, Kidney Int. 77 (7) (2010) 617–623, 10.1038/ki.2009.519 (Epub 2010 Jan 13.). [DOI] [PubMed] [Google Scholar]
- [54].Aruga S, Wehrli S, Kaissling B, Moe OW, Preisig PA, Pajor AM, Alpern RJ, Chronic metabolic acidosis increases NaDC-1 mRNA and protein abundance in rat kidney, Kidney Int. 58 (1) (2000) 206–215, 10.1046/j.1523-1755.2000.00155.x. [DOI] [PubMed] [Google Scholar]
- [55].Simpson DP, Mitochondrial bicarbonate carrier: a site of regulation of renal substrate metabolism by acid-base changes, Trans. Assoc. Am. Phys 96 (1983) 218–224. [PubMed] [Google Scholar]
- [56].Cheng Fang, Zhou Yanxi, Wang Miao, Guo Chuanjie, Cao Zhixing, Zhang Ruoqi, Peng Cheng, A review of pharmacological and pharmacokinetic properties of stachydrine, Pharmacol. Res 155 (2020) 104755. ISSN 1043–6618, 10.1016/j.phrs.2020.104755. [DOI] [PubMed] [Google Scholar]
- [57].Zhang C, Lu Y, Tong QQ, Zhang L, Guan YF, Wang SJ, Xing ZH, Effect of stachydrine on endoplasmic reticulum stress-induced apoptosis in rat kidney after unilateral ureteral obstruction, J. Asian Nat. Prod. Res 15 (4) (2013) 373–381, 10.1080/10286020.2013.769964 (Epub 2013 Mar 6.). [DOI] [PubMed] [Google Scholar]
- [58].Zhang C, Lu Y, Zhou YJ, Tong QQ, Qu C, Kang TJ, The effect of stachydrine on the expression of caspase-12 in rats with unilateral ureteral obstruction, J. Urol 192 (5) (2014) 1549–1554, 10.1016/j.juro.2014.05.046 (Epub 2014 May 17.). [DOI] [PubMed] [Google Scholar]
- [59].Sajid MI, Nunez FJ, Amirrad F, et al. , Untargeted metabolomics analysis on kidney tissues from mice reveals potential hypoxia biomarkers, Sci. Rep 13 (2023) 17516. [DOI] [PMC free article] [PubMed] [Google Scholar]
- [60].Demoulin N, Nicola V, Michoux N, Gillion V, Ho TA, Clerckx C, Pirson Y, Annet L, Limited Performance of Estimated Total Kidney Volume for Follow-up of ADPKD, Kidney Int. Rep 6 (11) (2021) 2821–2829, 10.1016/j.ekir.2021.08.013. [DOI] [PMC free article] [PubMed] [Google Scholar]
- [61].Nowinski WW, Early history of renal hypertrophy, in: Nowinski WW (Ed.), Compensatory Renal Hypertrophy, Academic Press, New York and London, 1969. [Google Scholar]
Associated Data
This section collects any data citations, data availability statements, or supplementary materials included in this article.
Data Availability Statement
Data will be made available on request.


