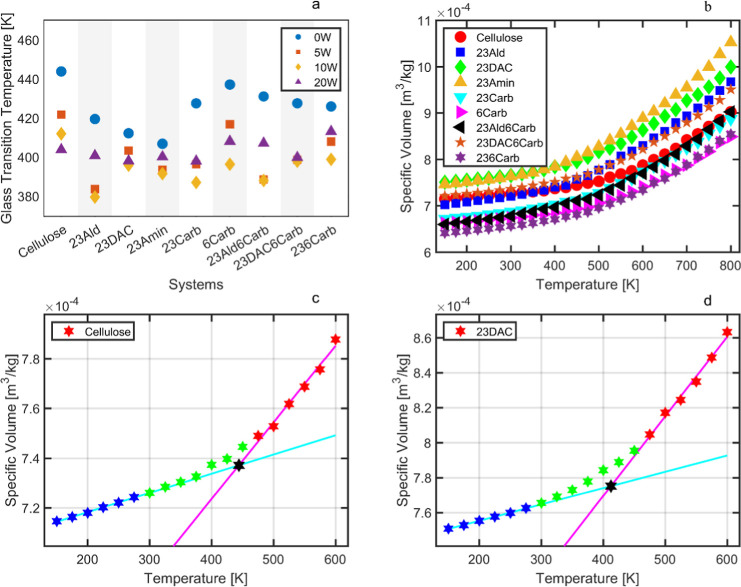
Figure 3.
(a) Tg of the systems; (b) PVT curves for all dry systems; (c) PVT curve for the dry Cellulose system, including linear fits and intersection marked; and (d) PVT curve for the dry 23DAC system, including linear fits and intersection marked with a black star, commonly used to estimate Tg. In (c,d), the colors represent different intervals, where blue is the data points used for the lower temperature regression, green is the points unused, and red is the points used for the high temperature regression.

