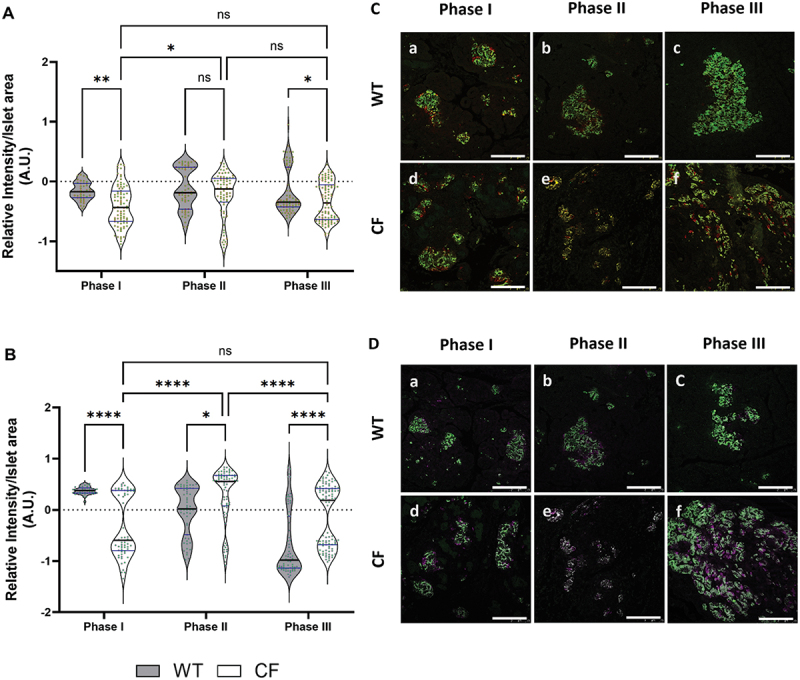
Figure 3.

Panel (A) presents violin plot graphs comparing the proinsulin-to-insulin ratio (PI:I). Panel (B) displays violin plot graphs of glucagon-to-insulin ratio (Glu:I) comparisons across phases I-III between CF and WT, along with an assessment of CFRD progression within CF ferrets. In panels (C) and (D) feature representative images of immunofluorescence staining for PI:I and Glu:I in pancreatic tissue of WT and CF ferrets during three different phases. Panel (C) shows an overlay of PI:I channels, with insulin (green) and proinsulin (red). In panel (D) is the overlay channels of Glu:I where with insulin (green) and glucagon (Magenta). Scale bar = 75 µm. The analysis for PI:I included 133–259 islets, while Glu:I contained 68–94 islets from 2–4 biological replicates for each genotype in each phase. The data was transformed using log10 analyzed using a two-way ANOVA followed by Tukey’s multiple comparisons post hoc test, with results presented as mean values ± SEM. Significance levels were indicated as follows: (****p < 0.0001, **p < 0.01, and *p < 0.5).
