

Summary paragraph
Hyperpolarization-activated cyclic nucleotide-gated (HCN) channels1 are essential for pacemaking activity and neural signaling2,3. Drugs inhibiting HCN1 are promising candidates for management of neuropathic pain4 and epileptic seizures5. The general anesthetic propofol (2,6-di-iso-propylphenol), is a known HCN1 allosteric inhibitor6 with unknown structural basis. Here, using single-particle cryo-EM and electrophysiology, we show that propofol inhibits HCN1 by binding to a mechanistic hotspot in a groove between the S5 and S6 transmembrane helices. We found that propofol restored voltage-dependent closing in two HCN1 epilepsy-associated polymorphisms that act by destabilizing channel closed state: M305L, located in the propofol-binding site in S5, and D401H in S67,8. To understand the mechanism of propofol inhibition and restoration of voltage-gating, we tracked voltage-sensor movement in spHCN channels and found that propofol inhibition is independent of voltage-sensor conformational changes. Mutations at the homologous methionine in spHCN and an adjacent conserved phenylalanine in S6 similarly destabilize closing without disrupting voltage-sensor movements indicating that voltage-dependent closure requires this interface intact. We propose a model for voltage-dependent gating in which propofol stabilizes coupling between the voltage sensor and pore at this conserved methionine-phenylalanine interface in HCN channels. These findings unlock potential exploitation of this site to design novel, specific drugs targeting HCN-channelopathies.
Introduction
Hyperpolarization-activated cyclic nucleotide-gated (HCN) channels belong to the superfamily of voltage-gated K+ (Kv) channels. Like most Kv channels, HCN channels contain 4 subunits9,10. Each subunit consists of 6 transmembrane segments (S1-S6) with S1-S4 forming the voltage-sensing domain (VSD) and S5-S6 forming the pore domain (PD). However, most Kv channels are activated by depolarization while HCN channels are activated by hyperpolarization, the mechanism behind which is still not fully clear. Previous studies11–13 have suggested a similar voltage sensor movement between most Kv channels and HCN channels: the voltage sensor moves upward upon depolarization and opens Kv channels14–16 while closing HCN channels10,13,17,18. Therefore, the differences in the electromechanical coupling between voltage sensor movement and pore opening (VSD-PD coupling) are thought to contribute to the different gating mechanisms of HCN and Kv channels. For example, the canonical electromechanical coupling between the VSD and the gate in Kv channels was proposed to occur via the S4-S5 linker (VSD and PD are domain swapped in Kv channels, with a long S4-S5 linker)19,20. A different, non-canonical coupling mechanism was also proposed to be at work in Kv channels, where the coupling between VSD and PD occurs via non-covalent interactions between S4, S5, and S6 TM helices21–24. Gating of HCN channels, where the VSD and PD are not swapped and the S4-S5 linker is short and unnecessary, was proposed to occur via the noncanonical path9,25.
HCN channels are essential in the rhythmic firing of pacemaker cells in the brain and heart2,3. The opening of HCN channels generates or , which contributes to initiating and regulating cardiac and neuronal pacemaker activity. Dysfunction of HCN channels is associated with neurological diseases and cardiac arrhythmias. Genetic mutations of HCN channels have been associated with different types of epilepsy in patients3,26. Early infantile epileptic encephalopathy (EIEE) impacts the pediatric population and can arise from HCN1 polymorphisms resulting in gain of function, including M305L and D401H which are both located in the S5 and S6 helices of the pore domain7,8. Although only a small number of EIEE cases have been identified so far, the limited genotyping combined with the recent technological advances and studies that allowed their discovery, suggest that the true incidence of such polymorphisms in the population may be much higher8,27,28. Thus, drugs that inhibit HCN1 could be promising candidates for treating EIEE5 as well as neuropathic pain4.
HCN channel modulation through small molecule compounds for therapeutic means has been predominantly focused on pore blockers. Ivabradine and its derivatives are one such class of FDA-approved pore blockers used for treatment of heart failure by inhibition of HCN currents in the sinoatrial node to reduce heart rate29. However, pore blockers tend to be relatively nonselective across multiple types of ion channels and act through simple occlusion of the ion conduction pathway. In addition, most HCN pore blockers, including ivabradine, do not discriminate between HCN isoforms. Allosteric inhibitors act outside of the pore and have the potential to offer greater specificity as well as modulate channels through both inhibition and activation.
While currently known HCN allosteric drugs lack specificity, the potential to physiochemically modify these compounds for therapeutic use is great. Drug discrimination at allosteric sites is well documented in kinases30, kinesins31, and receptors32, among others, and localize to hotspots for protein modulation. Recently, it was shown that a single allosteric pocket can be occupied by both positive and negative GABAA receptor modulators and impart their action through distinct sets of residues within the same binding site32. There are only a few known allosteric inhibitors for HCN1, such as propofol6, and the location of their binding sites is not known. Other anesthetics, including isoflurane, pentobarbital, and clonidine also inhibit HCN1 channels; however, they are not well characterized33. Identifying the binding site for an allosteric HCN inhibitor would be instrumental in establishing ground rules toward achieving selectivity and facilitate rational drug design.
Propofol is a widely-used intravenous anesthetic that allosterically and preferentially inhibits HCN1 channels over other HCN isoforms6,34. However, the mechanism behind this inhibition is not understood. Here, we obtained the structural resolution of propofol-HCN1 interactions to gain a greater understanding of its mechanism of action. We found that propofol binds to a groove between S5 and S6 that is present in closed, but not open, HCN channels thereby inhibiting the transition to the open state. We also demonstrate that interactions between S5 and S6 at the propofol-binding site are important for voltage-dependent closing of HCN1 channels thereby contributing to the non-canonical coupling between the voltage sensor and gate in HCN1 channels. Lastly, we found that propofol-binding repairs gating abnormalities resulting from EIEE-associated HCN1 M305L and D401H gain of function polymorphisms via restoration of S5 and S6 coupling to the voltage sensor.
Results
Structural resolution of the propofol-HCN1 complex
Our efforts to identify propofol binding sites to human HCN1 in detergent micelles were unsuccessful (see Methods for sequence details). Under the assumption that the lipid bilayer is important for propofol partitioning, association, and binding, we set out to reconstitute HCN1 in lipid nanodiscs for structural determination. To resolve propofol association with HCN1, we collected and processed two cryoEM lipid nanodisc structures: apo HCN1 (0 mM propofol) and HCN1 + 1 mM propofol (Fig. 1a–b). The HCN1 apo nanodisc structure indicated a closed HCN1 channel, as observed previously9. The overall Cα RMSD between the previously published HCN1 detergent structure and our HCN1 lipid nanodisc structure is ~1 Å. The propofol-HCN1 structure also yielded a closed channel (Extended Data Fig. 1) and contained visible lipid densities, as well as two non-proteinaceous densities, not present in the apo sample, which could in principle be assigned to propofol bound to site 1 and site 2 (Fig. 1c–d). Focused views of these densities obtained from the 3D refinement, PostProcess, DeepEMhancer, and half maps are shown in Extended Data Fig. 2. The chemical structure of propofol is shown in Fig. 1e.
Fig. 1 |. Structural resolution of the propofol-HCN1 complex.
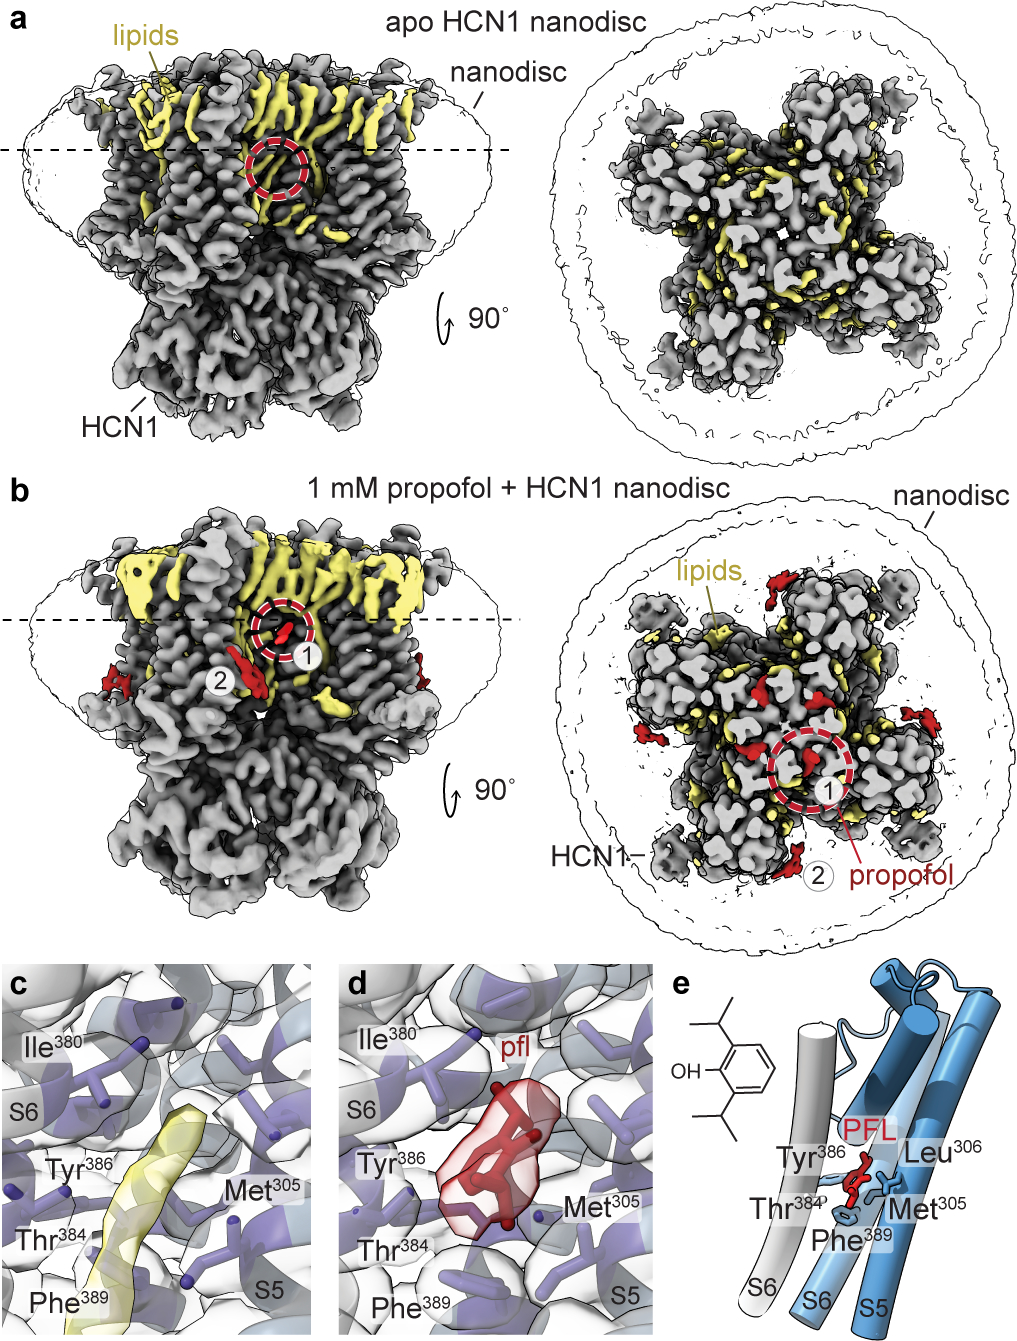
a-b, CryoEM maps of HCN1 WT reconstituted into lipid nanodiscs without and with propofol. In gray is the HCN1 protein density and in yellow are tubular lipid densities. The extracellular top view (right) is cross sectioned at the dashed line on the side view, perpendicular to the bilayer (left). Circled in the red dashed line is the focused region for panels c, apo HCN1 WT nanodisc and d, 1 mM propofol (pfl) + HCN1 WT nanodisc. Residues lining the binding site are colored in purple and propofol in red. Adjacent subunits are in gray and slate, respectively. The propofol density can accommodate multiple poses for propofol and our final model contains the same pose that was identified independently by a blind docking algorithm (Extended Data Fig. 4). e, The chemical structure of propofol and its location in the transmembrane domain, with adjacent subunits in grey and slate.
The first candidate site (site 1) is located within an interprotomer pocket towards the core of the tetramer mainly formed by the S5 and S6 helices from adjacent subunits, embedded in the middle of the membrane or ~20 Å from the intracellular lipids. Hydrophobic contacts occur between propofol and Met305, Thr384, and Phe389, among others (Fig. 1d). Due to its location within the oligomer, propofol binding at site 1 can be envisioned as a steric block to prevent movements of the S6 helices relative to S5, required for the channel to open at the intracellular gate9,10,35. This propofol binding site is also supported by previous molecular dynamics (MD) simulations of the closed HCN1 structure with other pore blocking HCN1 compounds36. Because a closed conformation of the HCN1 channel was used, compounds localized or docked within interprotomer pockets along the S6 helix36 as in Fig 1d. Moreover, additional MD and electrophysiological studies on chemically tethered propofol-derivatives (2,6-di-tert-butylphenol) suggest that these molecules interact with the channel 18–19 Å from the extracellular leaflet of the lipid membrane4.
The second putative propofol binding site (site 2, Extended Data Fig. 2b and 3a–b) resides within one subunit, on the intracellular side of the S2 transmembrane helix. Propofol binding here interacts with lipids in the inner bilayer leaflet as well as with a hydrophobic patch consisting of Leu218, Lys219, Trp221, and Phe222. Due to its peripheral location, and previous MD simulations that found that propofol prefers to reside near the lipid headgroups within a lipid bilayer37 in addition to the membrane midline4, we hypothesized that if propofol bound at site 2, it would not lead to channel inhibition. We performed fully atomistic MD simulations of a DOPC:POPE:POPS lipid-solvated HCN1 channel with propofol bound at sites 1 and 2 as observed in our structure (Extended Data Fig. 4a–b). After 100 ns of equilibration time, we removed the constraints on the propofol molecule and propofol at site 2 was observed to unbind on average at 40 ns in all protomers. At site 1, 11 out of 12 propofols remained bound for the duration of the simulation (400 ns) and only one propofol unbound at t ~390 ns (Extended Data Fig. 4b). Propofol pocket dwell time appears relatively independent on lipid composition; simulations in a pure POPC bilayer yielded similar results where binding site 1 retained 10 out of 12 propofol molecules while all molecules unbound at binding site 2 (Extended Data Fig. 4c). In addition to the longer residence time at site 1, we found that propofol can adopt multiple poses within this site (Extended Data Fig. 4d–e), correlating with its low micromolar IC5038. Other docking algorithms designed to detect cavities for pharmacology design also identified site 1, but not site 2, as a potential propofol binding site (Extended Data Fig. 4f).
Propofol inhibits HCN1 by binding to site 1, a state-dependent pocket
Review of site 1 in HCN1 detergent closed structures (PDB 5U6O and 5U6P9) and HCN4 detergent closed structures (PDB 7NP4, 6GYO, and 6GYN35,39) reveals a solvent accessible hydrophobic pocket that hydrocarbon lipid tails and propofol can occupy (Fig. 1c and Fig. 2a–b). In contrast, in the HCN1 activated cross-linked structure (PDB 6UQF10) and the HCN4 open structure (PDB 7NMN35), this hydrophobic pocket is surface occluded (Fig. 2c–d). Propofol binding to this state-dependent hydrophobic pocket would thus be expected to inhibit structural movements associated with S5 and S6 rotation outwards for gate opening. In support of the potential role of this pocket in channel gating, a signaling lipid binding along S6, near site 1, can positively modulate channel opening in SthK, a bacterial homolog of HCN channels40. In contrast, site 2 is state-independent and does not exhibit substantial conformational changes between closed, activated, or open HCN structures (Extended Data Fig. 3c).
Fig. 2 |. Site 1 appears to be a state dependent pocket and mutation of residues reduced druggability.
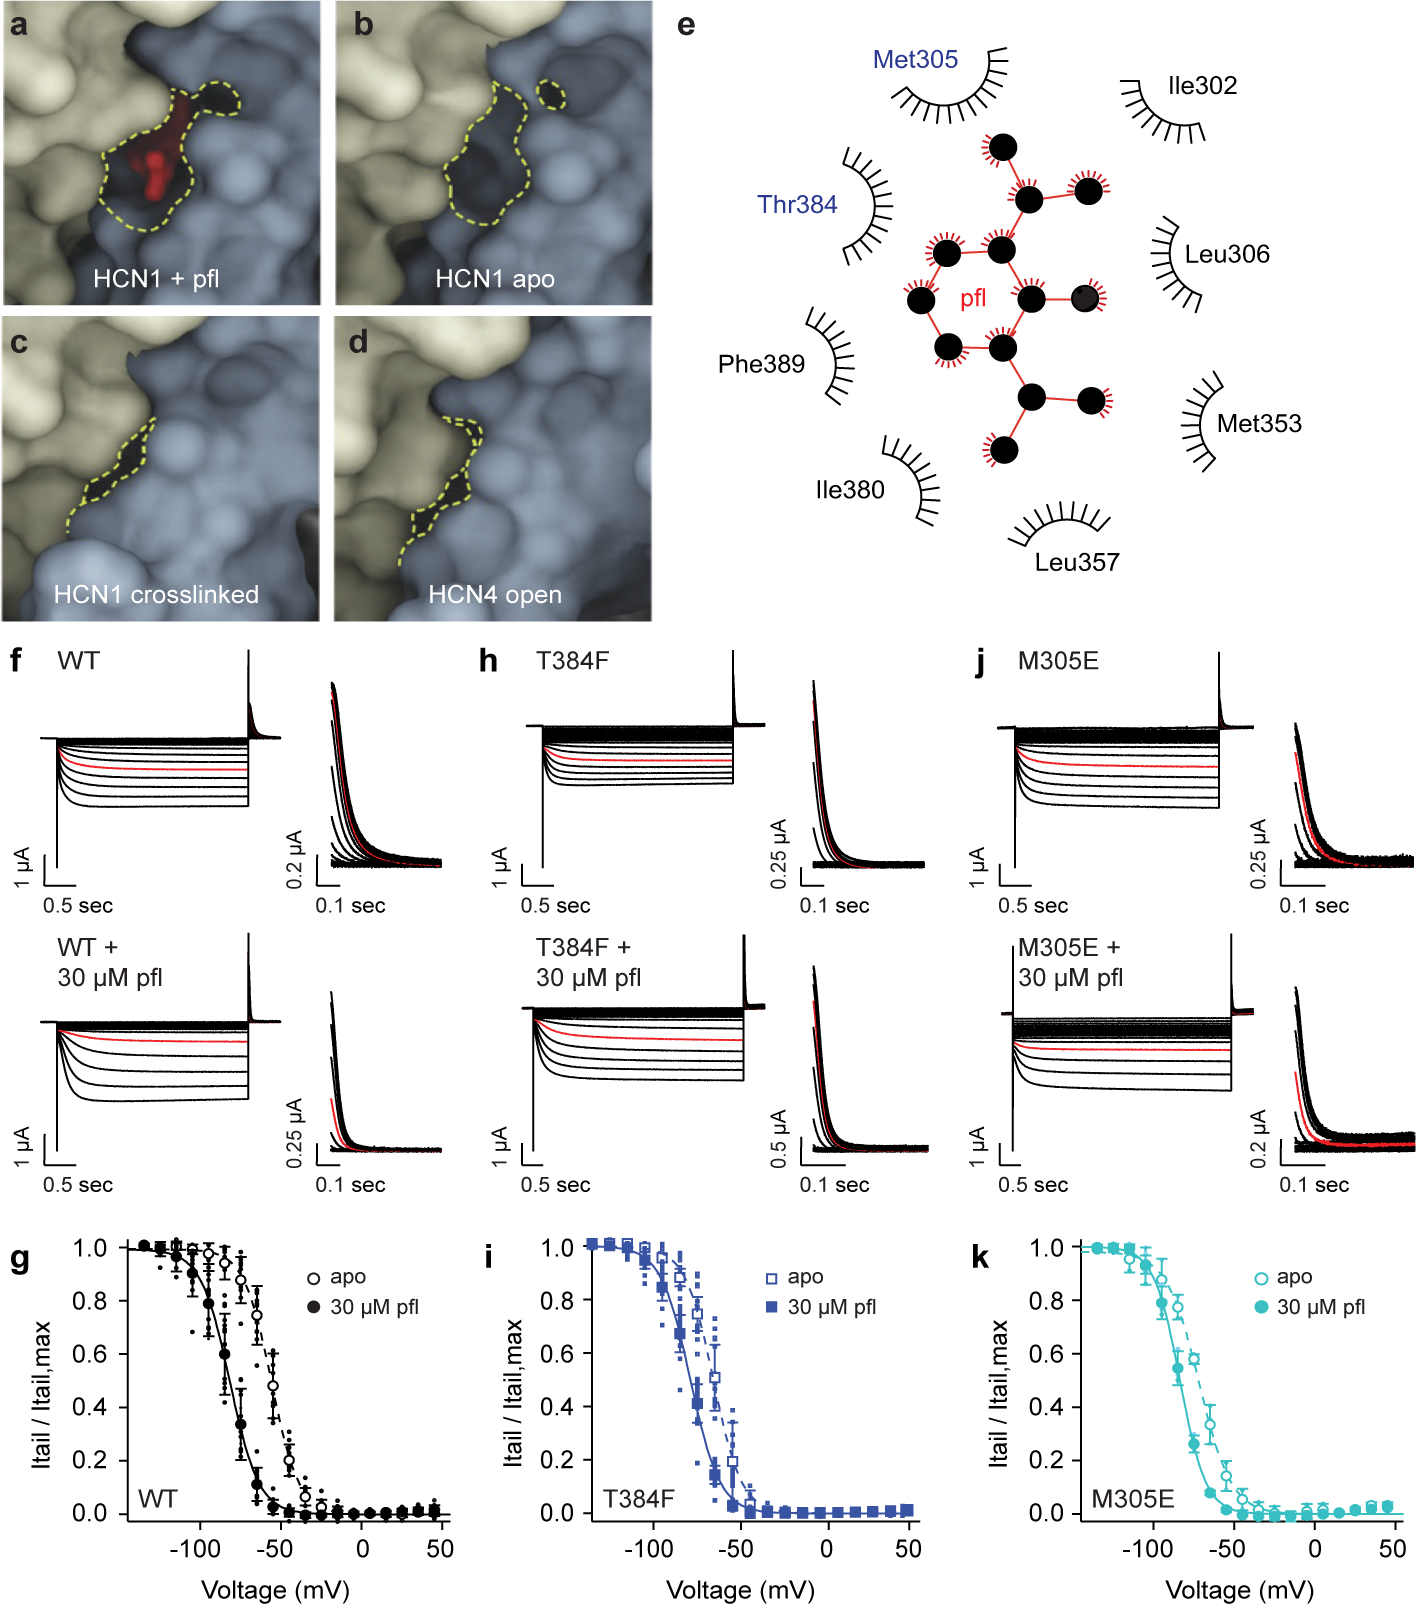
a-d, Space-filled models of HCN1 + propofol (pfl), HCN1 closed (PDB 5U6O), HCN1 with the VSD crosslinked in a hyperpolarized conformation (PDB 6UQF), and HCN4 in the open state (PDB 7NMN). Adjacent subunits are in blue and yellow and propofol is in red. The propofol pocket (dashed yellow lines) in the closed states is no longer present in the HCN1 crosslinked or HCN4 open state. e, LigPlot diagram showing site 1 hydrophobic contacts. Met305 and Thr384, probed by TEVC, are in blue and propofol in red. Currents and Boltzmann fits of HCN1 f-g, WT, h-i, T384F, and j-k, M305E to hyperpolarizing voltages in the absence and presence of propofol. Voltage clamp ranged from +45 mV to −125 mV with tail currents measured at +50 mV. The current response at −85 mV is highlighted in red. Boltzmann parameters for WT (apo: , k = 9.3 ± 1.7 mV, n = 22; pfl: , k = 9.5 ± 1.0 mV, n = 24, p < 0.0001), T384F (apo: , k = 7.4 ± 1.3 mV, n = 15; pfl: , k = 8.2 ± 0.7 mV, n = 11, p < 0.0001), and M305E (apo: , k = 10.1 ± 3.4 mV, n = 3; pfl: , k = 8.1 ± 0.7 mV, n = 3, p = 0.7909). P-values were determined by two-way ANOVA using a Tukey post hoc test between apo and propofol , with significance defined as p < 0.05. Error bars represent mean ± standard deviation and n denotes biological replicates.
To further investigate if site 1 is responsible for propofol-induced channel inhibition (Fig. 2e), we performed mutagenesis followed by current recording upon application of hyperpolarizing voltage steps using two electrode voltage clamp (TEVC) of HCN1-expressing Xenopus laevis oocytes in the absence or presence of 30 μM propofol. As previously observed6, incubation of HCN1 wildtype (WT) channels with 30 μM propofol led to a 30 mV hyperpolarizing shift in the half maximal activation voltage () as measured from normalized conductance-voltage plots (Fig. 2f–g, and Extended Data Table 2). Next, we mutated two residues, Met305 and Thr384 that line the binding site 1 pocket and mutations were chosen to prevent propofol interaction through occlusion of the binding site.
We hypothesized that introducing larger sidechains (such as phenylalanine and glutamate) would lead to partial occupancy of the binding pocket. Indeed, we found that HCN1 mutations T384F (Fig. 2h–i) and M305E (Fig. 2j–k) resulted not only in a left shift in from WT but also reduced sensitivity of these mutant channels to propofol application, as observed by the decrease in the magnitude of between the apo and propofol conditions (Extended Data Table 2). Using a cavity detection algorithm and in silico mutagenesis, the size of the site 1 pocket is estimated to be approximately 500 Å3, and the size is reduced in volume by 20–50 Å3 with these mutations. The size of propofol is roughly 200 Å3 (see Methods for algorithms and software used). Retention of voltage-dependent gating and mitigation, but not elimination, of propofol efficacy by these volume changes suggests the size of these substituted sidechains was not sufficient for a complete steric block of the rotation of the S5 and S6 helices during channel opening. Mutation of binding site 2 residues, L218A and K219A, did not result in shifts in (Extended Data Fig. 3d–g and Extended Data Table 2) or (Extended Data Fig. 3d–g and Extended Data Table 2) and is, therefore, not where propofol imparts its inhibitory effect. Overall, these results suggest that site 2 is a non-inhibitory propofol binding site and site 1 is the inhibitory site in HCN1.
Propofol restores voltage-dependent gating in HCN1 epilepsy-associated mutants
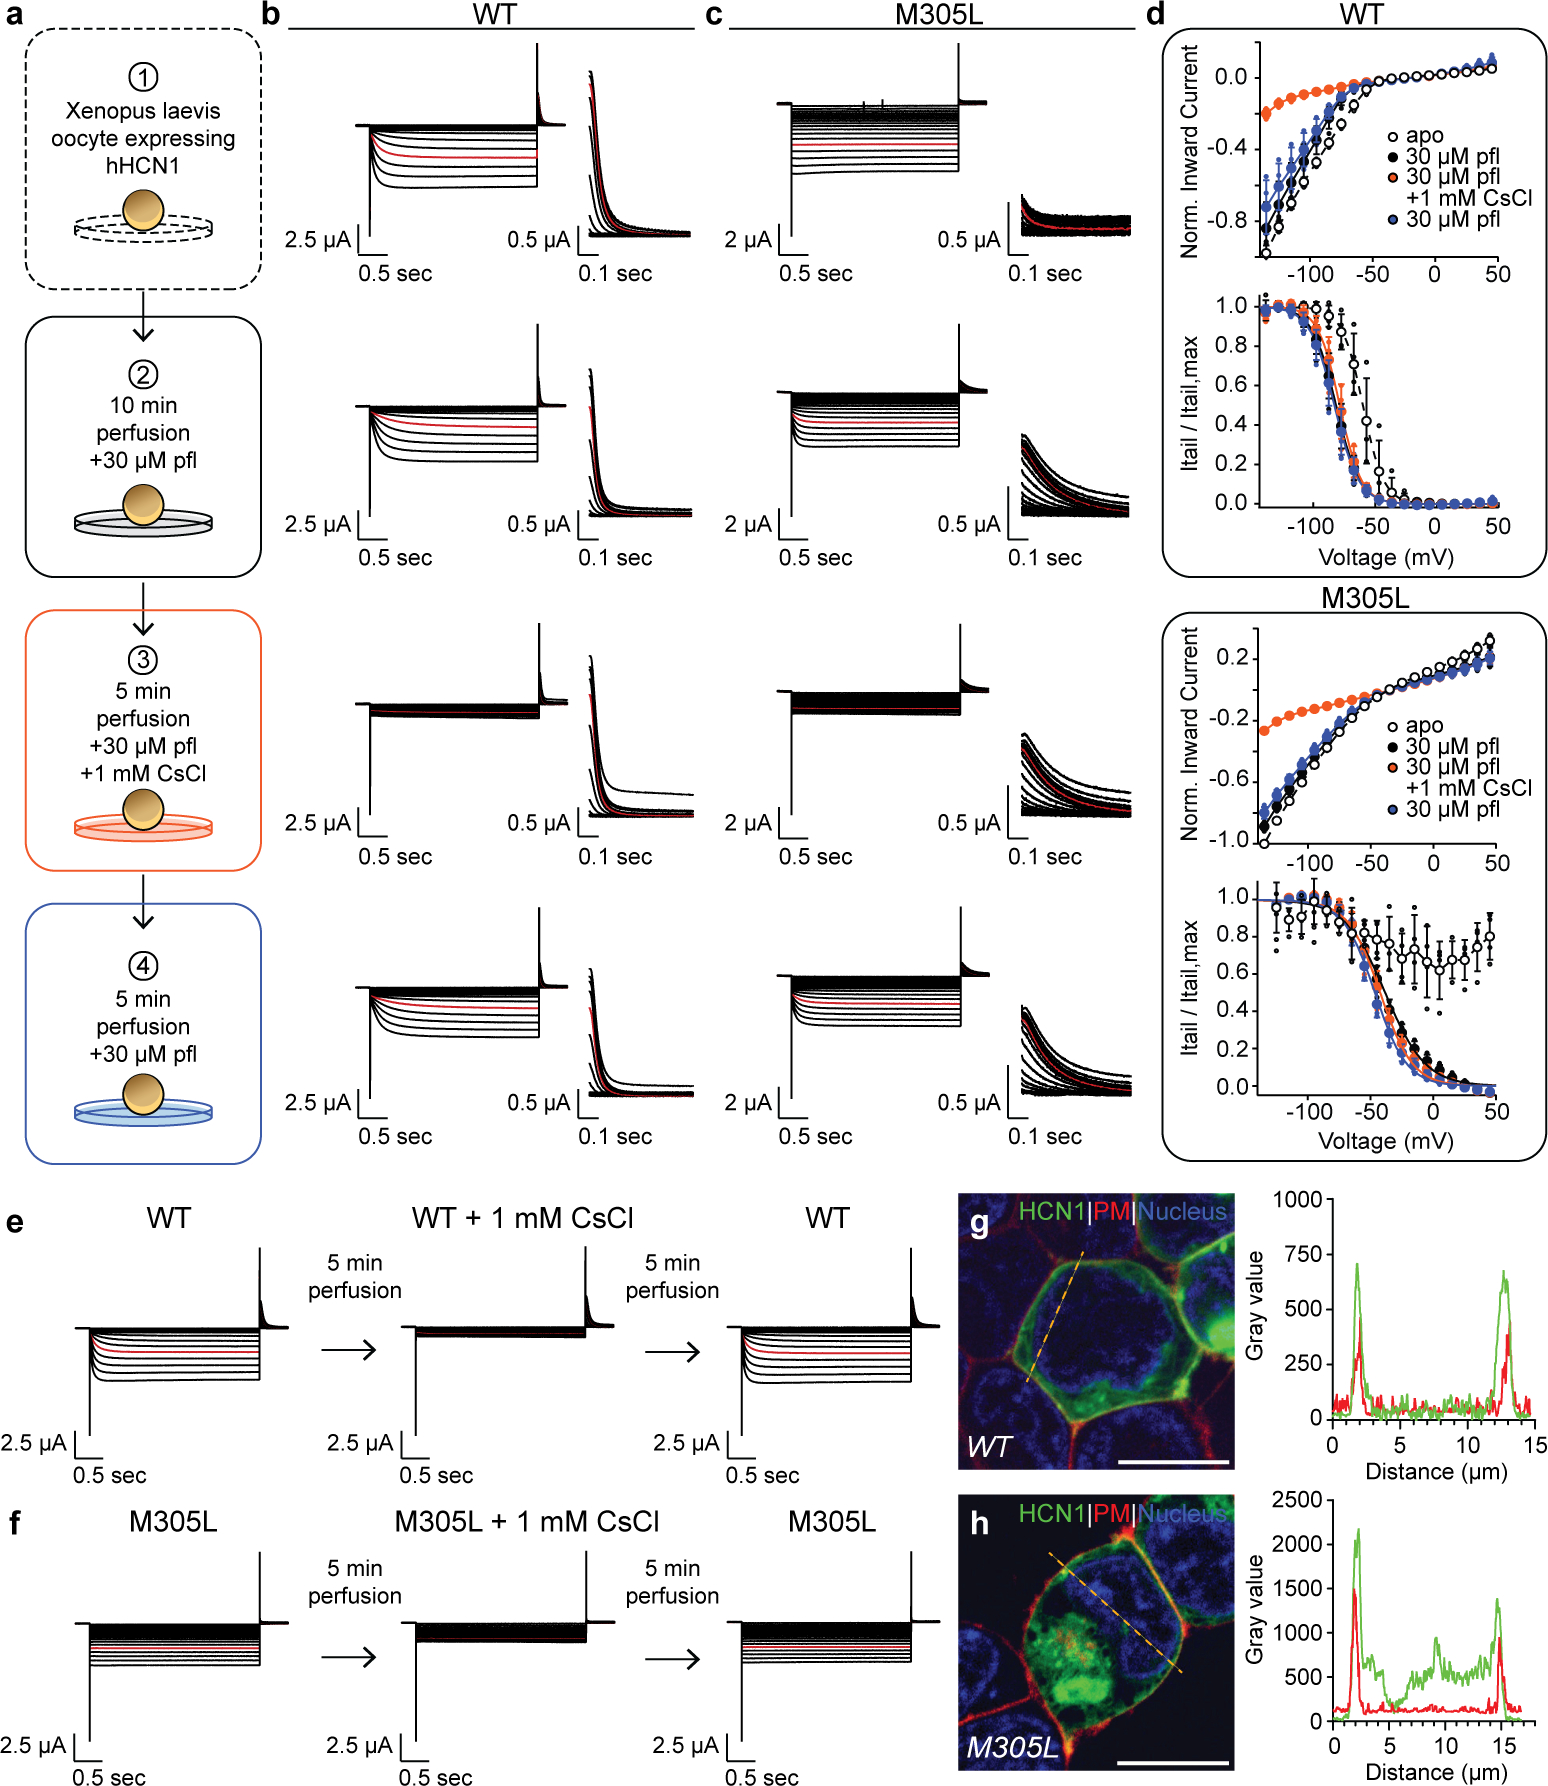
HCN1 M305L is a mutation associated with epileptic pathology8 and is located in binding site 1 (Fig. 3a). Figure 3b shows that, in agreement with previous electrophysiology, modeling, and computational approaches5,41, mutation of the Met305 in the propofol-binding pocket of site 1 to a leucine results in a “leaky”, voltage-insensitive channel. However, the mechanism leading to the leaky phenotype is not known. Strikingly, incubation with 30 μM propofol led to a restoration of the voltage dependent gating, and the emergence of depolarization-induced closing of the channel in the physiological range (Fig. 3b and 3d). Comparable plasma membrane trafficking of HCN1 WT and M305L, together with blockade by extracellular Cs+, a HCN blocker42, confirms the currents are mediated by HCN1 M305L (Extended Data Fig. 5 and Extended Data Table 2). The remarkable effect of propofol on the leaky HCN1 M305L mutant not only supports the hypothesis that site 1 is where propofol binds to exert its effects but also suggests that propofol inhibition at this site is not just via steric hindrance of the opening transition but that it also affects the voltage-dependent closing.
Fig. 3 |. Propofol restores function of disease-causing HCN1 mutants.
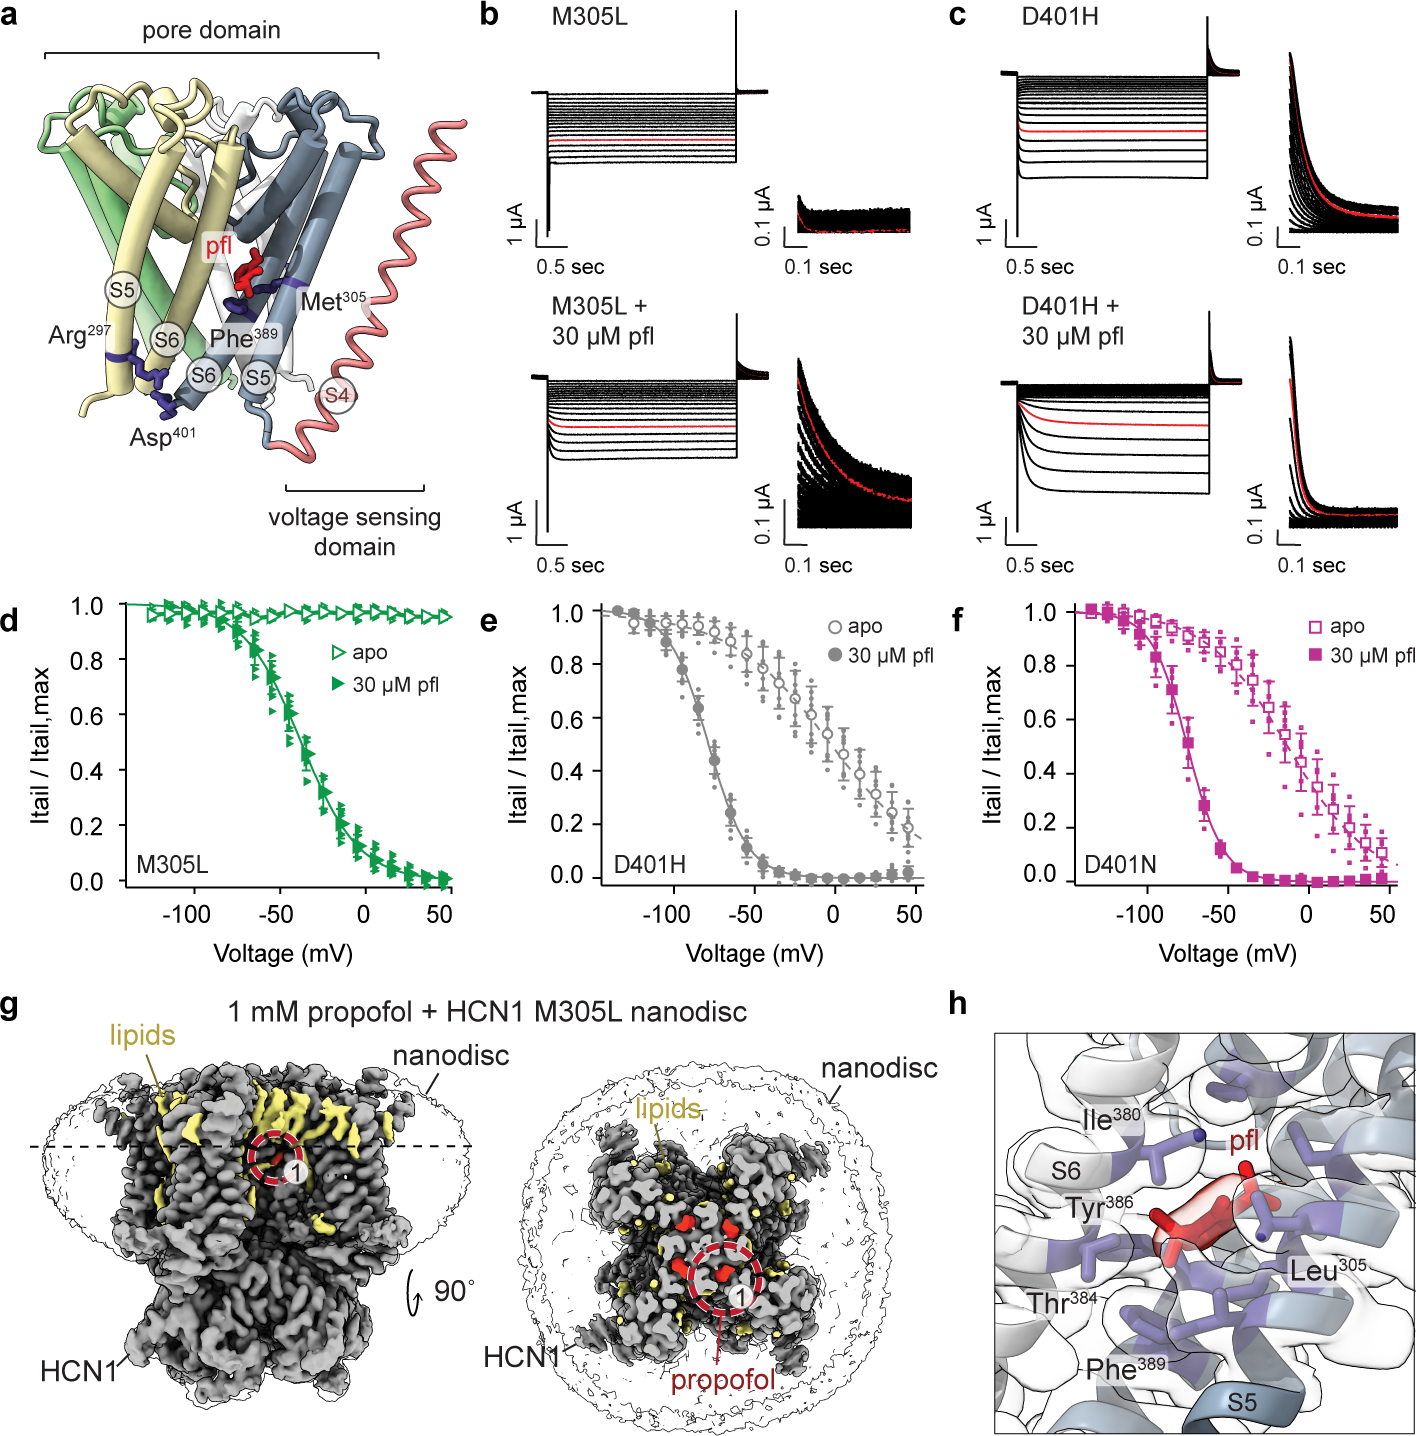
a, Schematic of the intraprotomer S5-S6 helix Met-Phe and interprotomer S5-S6 helix Arg-Asp salt-bridge interactions with respect to propofol (red). Individual pore domain subunits are highlighted in yellow, green, white, and blue. The S4 helix is in red-brown. b-c, TEVC currents of M305L and D401H in the absence and presence of propofol. Similar currents were observed for D401N. Voltage clamp ranged from +45 mV to −125 mV with tail currents measured at +50 mV. The response at −85 mV is in red. d-f, Tail currents fitted with a Boltzmann for M305L (pfl: , k = 16.9 ± 2.4 mV, n = 6), D401H (apo: , k = 32.1 ± 5.7 mV, n = 11; pfl: , k = 12.0 ± 1.5 mV, n = 12, p < 0.0001), and D401N (apo: , k = 27.8 ± 4.4 mV, n = 13; pfl: , k = 10.2 ± 1.3 mV, n = 11, p < 0.0001). P-values were determined by two-way ANOVA using a Tukey post hoc test between apo and propofol , with significance defined as p < 0.05. Error bars represent mean ± standard deviation and n denotes biological replicates. g, CryoEM map of HCN1 M305L with propofol (red). In gray is HCN1 and in yellow, lipid densities. The top view is cross sectioned at the side view dashed line. The red circle is the focused region for h, the propofol binding site. Subunits are in gray and slate. The propofol density can accommodate multiple poses and our model contains a similar pose to that uncovered by blind docking (Extended Data Fig. 4).
We next investigated two other mutations, HCN1 D401N and D401H (D401H is a documented pathogenic mutation in HCN channels). Both mutations result in HCN1 channels that are easier to open as compared to wildtype7,8,28, although with a phenotype less extreme than that of M305L. In HCN1 WT, Asp401 and Arg297 form a conserved state-dependent salt bridge at the intracellular side of the channel, which has been shown to contribute to closed state stabilization in HCN channels40,43,44 (Fig. 3a). When this salt bridge is eliminated, as in the D401H/N mutants, the HCN channel closed state is destabilized at the bundle crossing gate (where the salt bridge is) leading to a more open phenotype. As previously reported, HCN1 D401N and D401H28 led to large shifts in the for channel activation (Fig. 3c and 3e–f). As with HCN1 M305L, propofol restored hyperpolarized voltage dependent gating of both HCN1 D401N and D401H (Fig. 3e–f), with very large values for propofol inhibition (Extended Data Table 2).
Given the striking phenotype of the M305L mutant, we investigated it structurally. We obtained lipid nanodisc structures of HCN1 M305L in the presence and absence of propofol (Fig. 3g and Extended Data Fig. 2c–d and 6). Both structures reveal that HCN1 M305L is in a closed conformation, with little difference from the WT channel (Cα RMSD ~1 Å). Importantly, the voltage sensor domain is identical to that of the WT channel (S1-S4 Cα RMSD of ~0.5 Å), strongly suggesting intact capability for voltage sensing. The M305L mutant displays a somewhat more dilated pore, although not sufficiently wide to support ion conduction (Extended Data Fig. 6d). We cannot at this time correlate the leaky phenotype with any structural features of the HCN1 M305L. The propofol-bound M305L structure contained a propofol density in binding site 1 (Fig. 3g–h and Extended Data Fig. 2d) although in a different orientation to that observed with the propofol-bound WT structure. However, a propofol-like density was not observed at site 2, further supporting our hypothesis that site 2 is a non-inhibitory site (Extended Data Fig. 2d). Similar to WT, independent blind docking of propofol to the M305L structure identified site 1 but not site 2 (Extended Data Fig. 4g).
Although its functional inhibition of WT channels and our structure of the propofol-HCN1 WT complex may have indicated at first that propofol simply sterically inhibited the closed-to-open transition, its restoration of voltage-dependence to disease mutants uncovered its effects on the voltage gating mechanism as well. To gain insight into how propofol repairs the channel, we sought to discover the mechanism for the leaky phenotype in the mutant HCN channels. A loss of voltage-dependence can be assigned to a defective voltage sensor and/or a loss of coupling between the sensor and the channel gate. The structure of HCN1 M305L in a lipid environment features an intact voltage sensor domain, identical to that of WT, suggesting that the leaky phenotype is due to loss of coupling. We sought to cross validate this finding via an alternative approach, by directly measuring voltage sensor conformational changes as a function of voltage by voltage-clamp fluorometry.
M305L homology mutant channels have intact voltage sensor movement but no closing
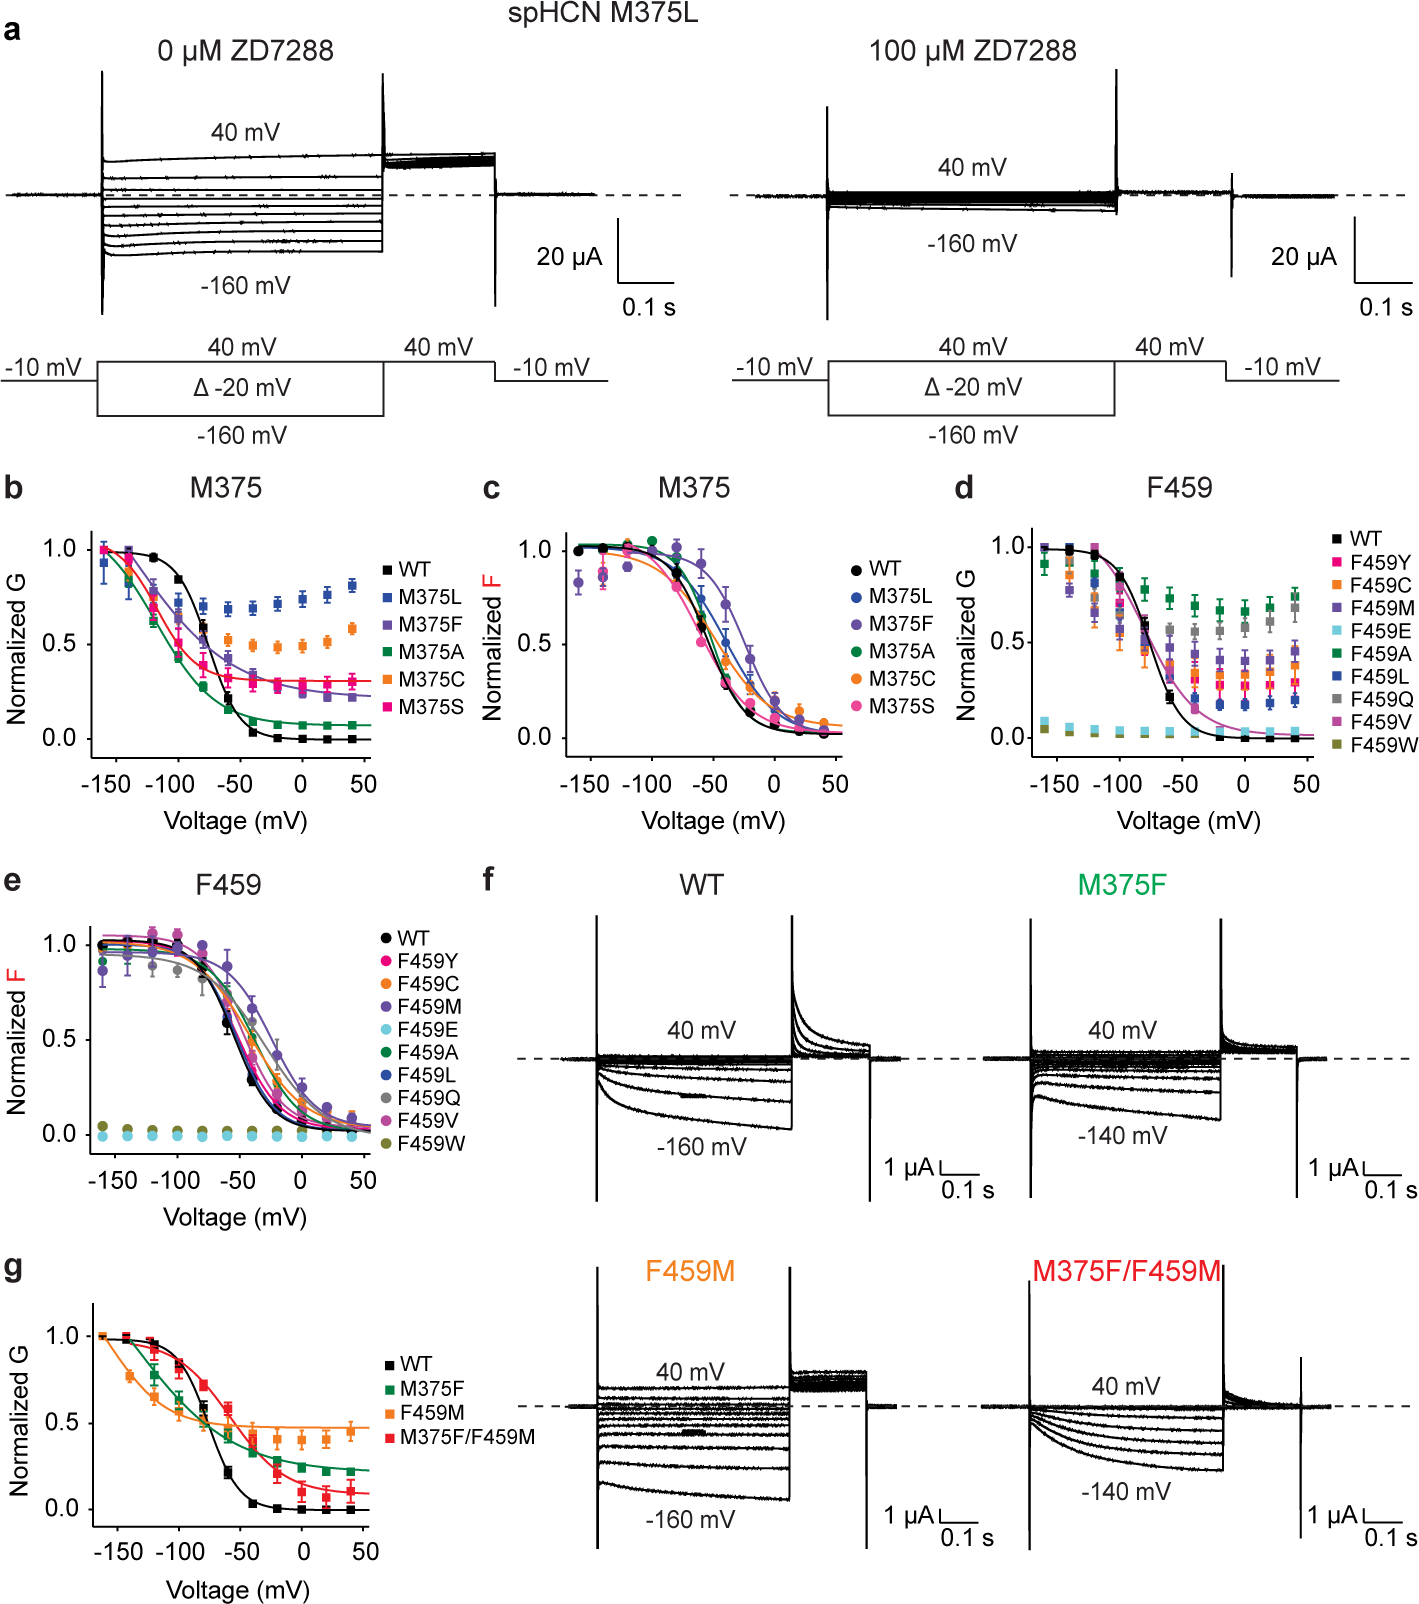
We took advantage of the well-established system of using spHCN with voltage clamp fluorometry to monitor S4 voltage sensor movements in response to voltage across the membrane18,45,46. We simultaneously studied the voltage sensor movement and gate opening of M375L (homologous to M305L in HCN1) in spHCN channels expressed in Xenopus oocytes using voltage clamp fluorometry (Fig. 4a). All spHCN channels used herein have a background R323C mutation, where Alexa488 was attached (denoted by an * in Fig. 4a) and will be referred to as WT or the respective mutant.
Fig. 4 |. Homologous epilepsy-associated M305L mutant channels are voltage-independent but with intact voltage sensor movement.
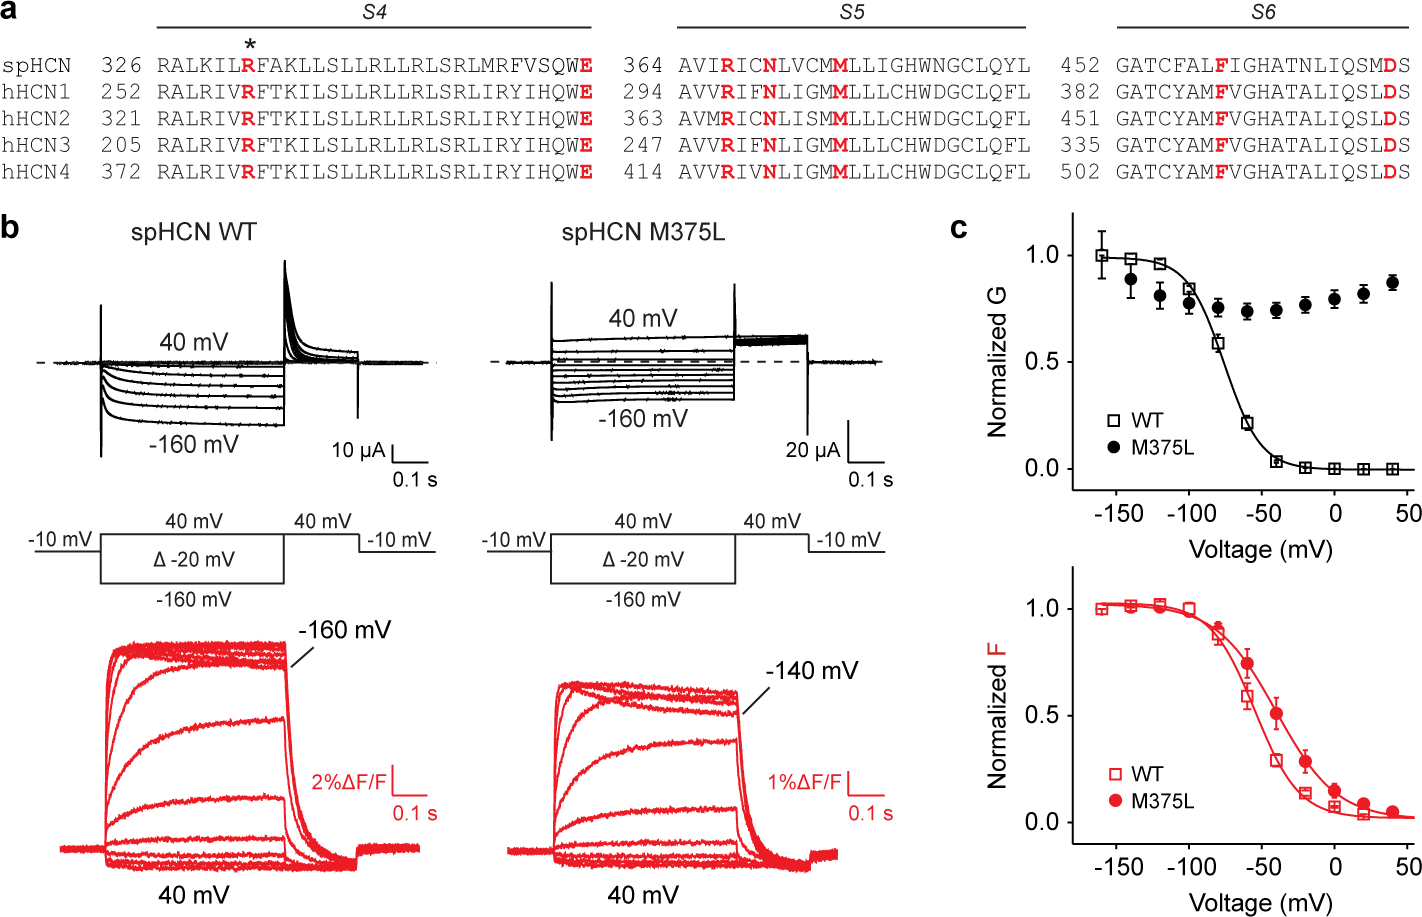
a, Sequence alignment of S4, S5 and S6 of spHCN, hHCN1, hHCN2, hHCN3 and hHCN4 channels. Residue R332 (asterisk) was mutated to a cysteine for voltage clamp fluorometry. Residues investigated or mentioned in this study are labelled in red. b, Current (black) and fluorescence (red) traces from oocytes expressing spHCN WT and spHCN M375L channels in response to the voltage protocol indicated. Cells are held at −10 mV and stepped to voltages between +40 mV and −160 mV in −20 mV increments followed by a step to +40 mV. Dashed lines indicate no currents. c, Voltage dependence of currents (black) and fluorescence (red) from spHCN WT (empty squares, n=3) and spHCN-M375L (solid circles, n=4) channels. Data are represented as mean ± SEM and all n represent biologically independent replicates.
Similar to the M305L mutant in HCN15,41, spHCN M375L mutant channels showed large constitutive currents at both negative and positive voltages (compare Fig. 4b with Fig. 3b). The currents from spHCN M375L channels are blocked by the HCN-channel blocker ZD7288 (Extended Data Fig. 7a), confirming these non-rectifying currents arise from spHCN M375L and not an unspecific leak. The conductance-voltage (GV) relation shows that spHCN WT channels increase the conductance upon hyperpolarization whereas spHCN M375L channels display a similar conductance at all voltages (from 40 mV to −160 mV) (Fig. 4c). This indicates that M375L renders the spHCN channels voltage-independent, which aligns with our results on the mammalian homologous mutation M305L and recent studies on M305L in HCN15,41. Importantly, the voltage sensor movement indicated by fluorescence changes (red traces in Fig. 4b) is similar in both spHCN WT and M375L channels, although M375L slightly shifts the of the fluorescence-voltage (FV) relation by −15 mV. Therefore, M375L keeps the spHCN channels open with little alteration in the voltage sensor movement, suggesting this methionine is important for voltage-dependent closing of HCN channels. This agrees with the M305L structural experiments. Decoupling the voltage sensor from the pore yields a S4 helix and S4-S5 linker equivalent to the WT conformation at 0 mV, the cryoEM experimental condition (Fig. 3g, Extended Data Fig. 6).
Met375 and Phe459 are important for closing spHCN channels
To further test the role of Met375 in spHCN channel gating, we made additional mutations at residue 375 (M375F, M375A, M375C and M375S). All mutants showed constitutively open channels at depolarized voltages at which spHCN channels are normally closed, although M375F, M375A and M375S showed some remaining voltage-dependent currents at hyperpolarized voltages (Extended Data Fig. 7b). Regardless, all Met375 mutants show similar fluorescence signals (with FV relations shifted relative to each other along the voltage axis, Extended Data Fig. 7c), suggesting that these mutants do not abolish the voltage sensor movement in spHCN channels but only alter the voltage range at which the voltage sensors move. Our results suggest Met375 is crucial for voltage-dependent closing of spHCN channels.
As Met375 is important for closing the spHCN channel, we hypothesized that residues in contact with Met375 in the closed state of the channel might also contribute to voltage-dependent closing. In the cryo-EM structure of human HCN1 channels with the gate closed and the voltage sensor in the resting up position (PDB 5U6O9), Met305 on S5 (the equivalent of Met375 in spHCN) is physically close to Phe389 on S6 (the equivalent of Phe459 in spHCN) (Fig. 3a and Fig. 4a). We therefore tested the role of Phe459 in spHCN channel gating. Seven mutations (F459Y, F459C, F459M, F459A, F459L, F459Q and F459V) at Phe459 and WT channels showed similar FV relations, suggesting that the mutations do not alter the voltage sensor movement (Extended Data Fig. 7e). Except for F459V, these mutations also render spHCN channels constitutively open at positive voltages (Extended Data Fig. 7d), suggesting that Phe459 also plays an important role in the voltage-dependent closing of spHCN channels. F459V mutant showed a similar GV relation to WT channels and slightly shifted the of GV relation by ~7 mV (Extended Data Fig. 7d and Extended Data Table 2). Moreover, F459W and F459E both showed neither detectable currents (as indicated by GV relation) nor voltage sensor movements (indicated by FV relation), suggesting that a bulkier or charged residue substituted at Phe459 might disrupt the trafficking of the channels or prevent both the channel opening and S4 movement. All these data indicate that hydrophobic and medium-sized residues at position 459 allow spHCN channels to close at positive voltages.
Met375-Phe459 interaction holds spHCN channels closed
So far, we have shown that both Met375 (Met305 in HCN1) and Phe459 (Phe389 in HCN1) are critical for voltage-dependent closing of spHCN channels. Because these two residues are physically in contact with each other in the closed-state structure of HCN channels, we tested whether the interaction between Met375 and Phe459 is important for voltage-dependent gating. We made the double mutant M375F-F459M which would still maintain a sulfur-aromatic interaction between these two residues as in WT channels41,47. The two single mutants, M375F and F459M, both show large constitutive currents at positive voltages where spHCN channels normally close (Extended Data Fig. 7f–g). However, the swap mutation M375F-F459M has a voltage dependence more similar to the WT channels ( shift of only ~18 mV and a slope factor change of ~10 mV) with smaller constitutive currents than either of the single mutants, suggesting that the sulfur-aromatic interaction is restored and is important for the channels to close at positive voltages (Extended Data Fig. 7f–g). Since both residues are highly conserved in the HCN family (Fig. 4a), this suggests that the Met-Phe interaction is important for the closed state of HCN channels.
Propofol inhibits HCN channels without changing voltage sensor movement
So far, we have shown that the leaky, constitutively open mutants in the propofol binding site have intact voltage sensors and voltage-sensor functionality, eliminating the voltage sensor from the list of candidates responsible for this phenotype. That leaves the possibility of a faulty coupling between voltage sensor and gate, or a malfunctioning gate. However, we also showed that propofol application restores voltage-dependence to these otherwise constitutively open channels, strongly suggesting that faulty coupling is the main reason for the leaky phenotype of the mutant channels. To rule out the effects of propofol on the voltage sensor itself, we performed voltage-clamp fluorometry and found that although 10 μM propofol reduces the currents of spHCN WT channels (Fig. 5a–b), it did not lead to changes in the fluorescence signals (Fig. 5c–d). The propofol-mediated reduction in current amplitude seen here is consistent with prior observations34 and, as propofol is not a pore blocker, may result from a left shift in voltage-dependent opening6. The FV was not changed by propofol, suggesting that propofol inhibits the HCN currents without altering the S4 voltage sensor movement of the WT channel (Fig. 5c–d). Together with our structural data (Fig. 1 and 2), these results suggest that propofol binds to a groove between S5 and S6 and inhibits the HCN currents without altering the S4 voltage sensor movement of the channel.
Fig. 5 |. Propofol inhibits spHCN current without changing voltage sensor movement.
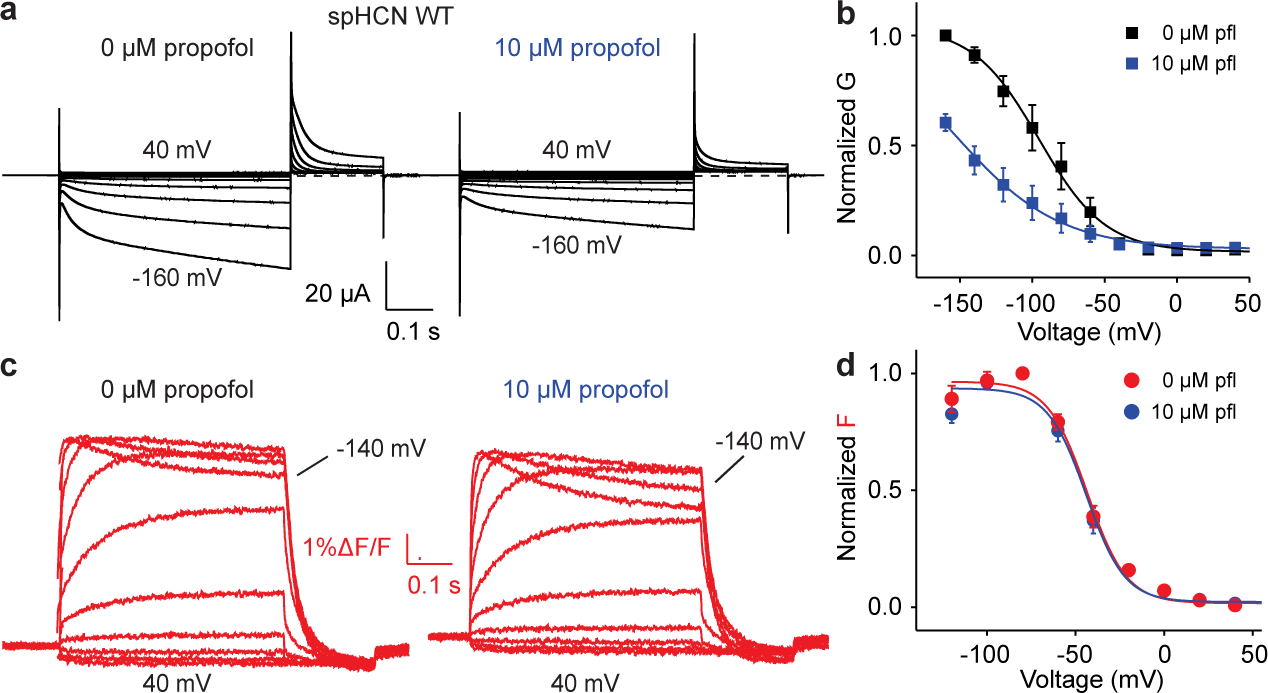
a, Representative current traces from spHCN WT channels from the same oocyte before (left) and after (right) the application of 10 μM propofol. Dashed lines indicate no currents. b, GV relations from spHCN channels before (black) and after (blue) the application of 10 μM propofol. The conductance at −160 mV was reduced by 46 ± 2% (n=3). c, Representative fluorescence traces from spHCN WT channels from the same oocyte before (left) and after (right) the application of 10 μM propofol. The amplitude of the fluorescence signal was slightly reduced after the application of propofol due to the photobleaching and/or internalization of labeled channels. d, FV relations (n=3) from spHCN channels before (red) and after (blue) the application of 10 μM propofol (pfl). Data are represented as mean ± SEM and all n represent biologically independent replicates.
Discussion
Here, we report that propofol binds to a groove between S5 and S6 transmembrane helices present in closed, but not open, HCN channels. The propofol molecule imparts steric hinderance to stabilize the closed state by preventing the rotation of the S5 and S6 helices required to open the channel gate. In addition, we found that propofol also restores voltage-dependent closure to an HCN1 channel mutant rendered voltage-independent by the mutation of a crucial methionine to leucine, associated with EIEE, which also forms part of the propofol binding pocket. This in turn led to the finding that the interaction between this methionine (on S5) and nearby phenylalanine (on S6), both part of the propofol binding site, is required for voltage-dependent closing in HCN channels and is hence a major contributor to the non-canonical coupling between the voltage sensor and gate. We propose that disruption of this interaction leads to a “leaky” channel caused by loss of coupling and that propofol binds to and glues this critical area together, therefore restoring voltage-dependent coupling. In support of this, the distance between Met305 and Phe389 is roughly 1.3 Å larger in the activated, hyperpolarized structure10,41 compared to the closed structure and leads to a weaker interaction that favors channel opening (Extended Data Fig. 8). In the M305L mutant, the distance between the leucine at position 305 and Phe389 is also larger in the resting closed state (~1 Å by previous MD simulations41) leading to decreased interaction, loss of coupling, and thus to the observed leaky phenotype. Through its aromatic interactions, propofol binding in between Leu305 and Phe389 can bridge this larger distance between the two residues to restore coupling in the mutant. Propofol thus binds to a “mechanistic hotspot,” a region of the protein central to coupling the voltage sensor conformational changes to the channel gate.
We propose that Met-aromatic motifs (non-covalent interactions between methionine and aromatic residues)47 are characteristic of HCN voltage-dependent channels and that propofol inhibits by stabilizing this motif (Extended Data Fig. 8). Stabilization energies of 2-bridge Met-aromatic interactions correlate well and are within range of previously measured coupling energies between the HCN voltage sensor and pore, estimated to be 3–4.5 kcal/mol48. This is supported with the full inhibitory efficacy of propofol being dependent on the aromatic ring38. We demonstrate that the interaction between Met375 in the S5 helix of spHCN channels and Phe459 in S6 (Phe389 in HCN1) is required for voltage-dependent closing in response to outward voltage sensor movements. Providing additional energy or an increase of roughly 30 mV of hyperpolarizing voltages overcomes the 2-bridge intraprotomer stabilization, forcing propofol to leave the binding pocket, thereby restoring channel opening.
We show here that allosteric compounds, such as propofol, can be a versatile tool to probe the mechanism of HCN channel gating. Application of propofol to HCN1 D401H and D401N restored WT-like response and voltage sensitivity was regained by perfusion of propofol to HCN1 M305L channels, also associated with pathogenic conditions. Our data also suggests that non-anesthetic propofol-derivatives with high affinity and selectivity for HCN1 channels could represent a new therapeutic approach to restore normal HCN channel function and to treat disease (e.g., EIEE) arising from aberrant . Routine genetic testing and cataloging of early onset epilepsy HCN-associated polymorphisms began recently, explaining the limited number of cases identified with these mutations27,49. Despite this, M305L and D401H represent roughly 5% of currently known HCN-related epilepsy cases and are among those that display resistance towards currently used anti-seizure medications8,28. Future studies similar to that presented here could facilitate a shift in clinical epilepsy management towards personalized medicine; pathogenic HCN-related EIEE polymorphisms exhibit a spectrum of phenotypes by electrophysiology, including both loss of function as well as gain of function8,28 and molecules can be identified to correct specific phenotypes. Changes in treatment of epileptic cases based on genetic diagnosis has been shown to be impactful in as much as 40% of patient outcomes50.
In most domain-swapped voltage-gated cation channels, it is assumed that the long S4-S5 linker plays an important role in voltage sensor-to-gate coupling by transmitting conformational changes of the S4 voltage sensor to the S6 gate to open and close the pore gate. However, non-domain swapped channels with a short S4-S5 linker, such as HCN channels and the related EAG channels, are voltage gated even without a long S4-S5 linker, suggesting a non-canonical gating mechanism in these channels. We and others have found that conserved interactions at the interface between the intracellular ends of S4 and S5 are important for this non-canonical voltage sensor-gate coupling in HCN channels (Fig. 4a)9,43,46. For example, Glu356-Asn370 interactions in spHCN channels (homologous to Glu282 and Asn300 in HCN1 on S4 and S5, Fig. 4a) are formed to hold the channel closed46. In addition, Arg339 and Asp443 (homologous to Arg297 and Asp401 in HCN1, Fig. 4a) at the intracellular ends of S5 and S6 helices in HCN2 channels have been suggested to form a salt bridge that stabilizes the closed state of the channel (Fig. 6)9,40,43. Mutations in these interactions favor the open state of the HCN channels by destabilizing the closed state. Here we show that the interface between the middle portion of S5 and S6 (Met305-Phe389) is also important for a non-canonical voltage-sensor-to gate coupling in HCN channels. We propose that the conformational changes in the S4 voltage sensor are first transmitted via S4-to-S5 interactions, such as HCN1 Glu282-Asn300, and then further to S6 via S5-to-S6 interactions, such as the here identified HCN1 Met305-Phe389 interactions, causing voltage-dependent closing (Fig. 6a). In our model (Fig. 6b), propofol inhibits HCN channels by stabilizing the closed state of the gate and strengthening the coupling between the voltage sensor and the gate by binding in a groove between S5 and S6 and preventing S6 helices from moving outwards to open the pore. Propofol is able to rescue HCN1 M305L channels by compensating and reforming the bridge for coupling between the voltage sensor and gate (Fig. 6b). In agreement with our findings, using a simplified kinetic multistate model, propofol inhibition and voltage dependent closing were well-captured by modifying the coupling factor between the VSD and PD (Supplementary Appendix).
Fig. 6 |. The effect of propofol on wildtype and M305L channels.
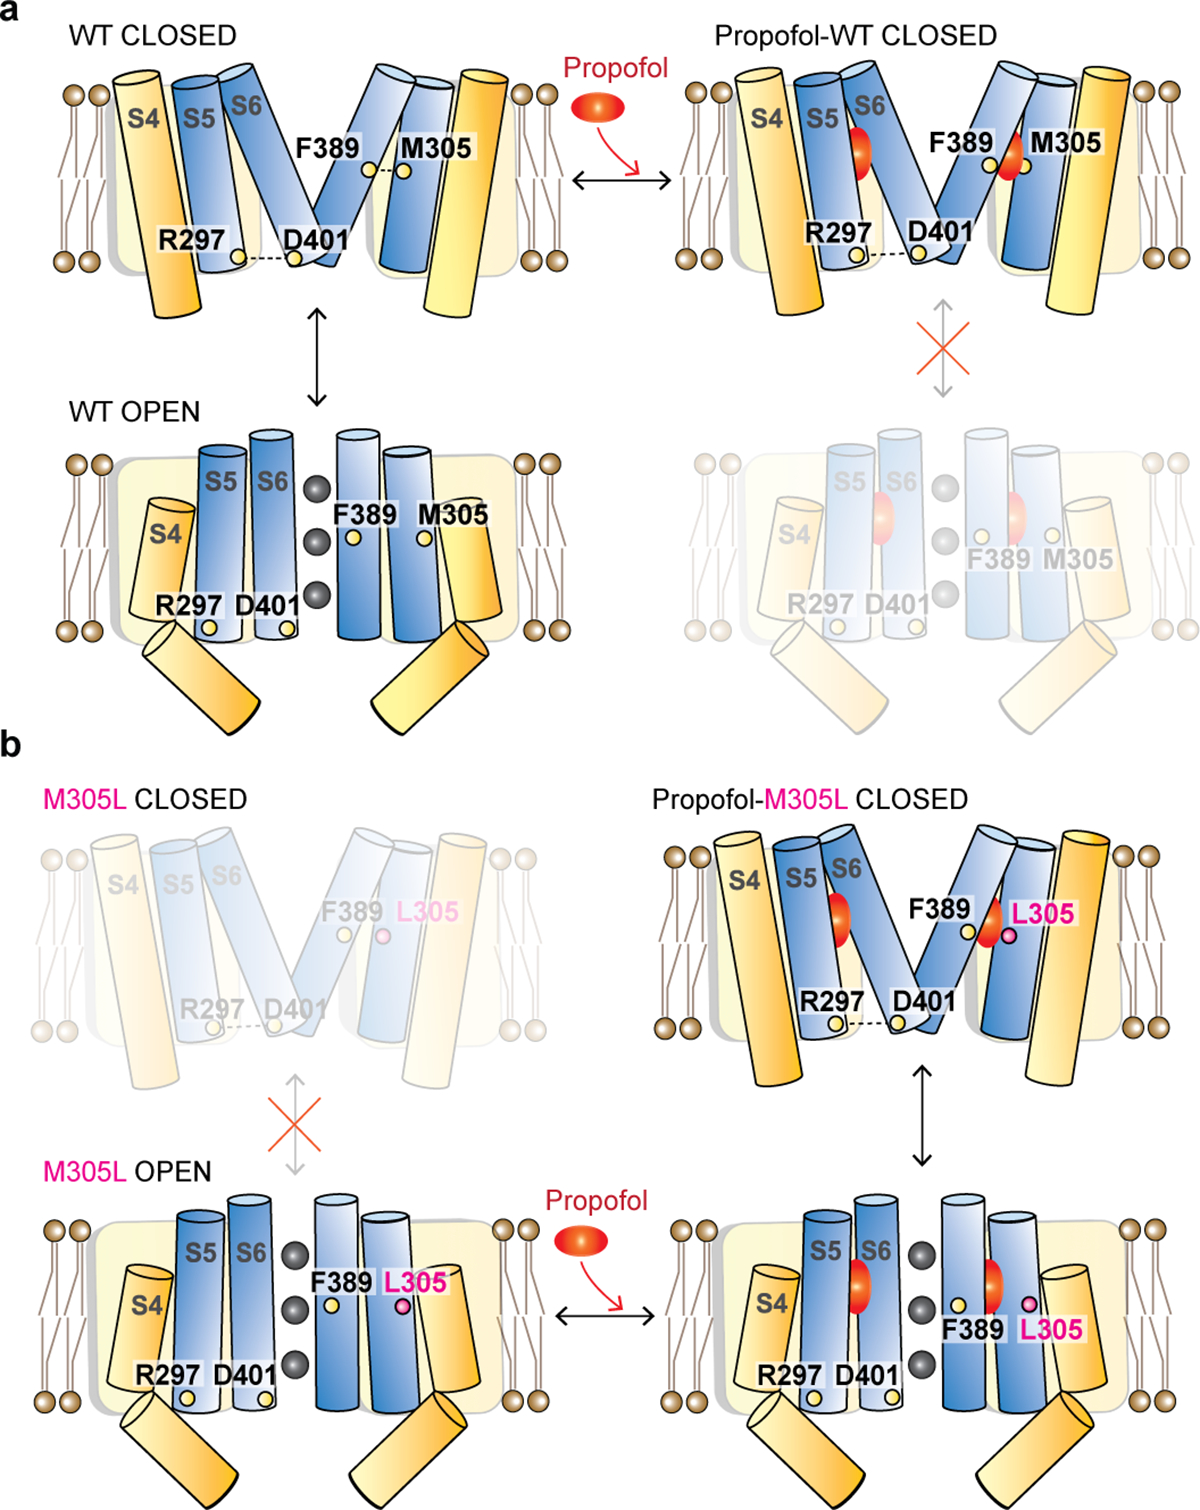
a, Cartoon of HCN1 channels with and without propofol (only two subunits shown for simplicity). The closed state with S4 up is stabilized by interactions such as R297-D401 and M305-F389. Downward movement of individual S4s in response to hyperpolarization breaks interactions between S4 and S5. A break in S417,18 opens a crevice between S4 and S5, allowing S5 to swing outwards, and S6 to rotate and open the pore. Propofol binding stabilizes the closed state and strengthens the voltage sensor-to-gate coupling. b, Cartoon of HCN1 M305L channels with and without propofol. The closed states are destabilized due to the missing M305-F389 interaction. Propofol binding stabilizes the closed state and strengthens the voltage sensor-to-gate. The closed state with S4 up is stabilized by interactions such as R297-D401 and the propofol-M305L-F389 interaction.
Conclusions
We report here that propofol inhibits HCN channels by binding to a state-dependent pocket located at a mechanistic hotspot for voltage-dependent gating. Our finding that disease-associated HCN1 channels with weak or no voltage sensitivity can be repaired by propofol shows that propofol allosterically strengthens voltage-dependent coupling to favor channel closing. A transmembrane Met-Phe interaction was shown to be required for the non-canonical coupling between the voltage sensor and pore in HCN channels and is strengthened by propofol. The unusual mechanism of propofol action on HCN channels can be uniquely exploited towards novel precision drugs against neuropathic pain and epilepsy.
Materials and methods
Two Electrode Voltage Clamp
RNA of human HCN1 wildtype or mutants (full length HCN1 in the pGHE expression plasmid, HCN1EM + C-terminal residues 636–865) was generated by Quikchange PCR using either Phusion or Q5 polymerase (NEB), transcribed using mMessage mMachine T7 kit (Invitrogen), and purified using the RNeasy cleanup kit (Qiagen). Purified full length wildtype or mutant human HCN1 RNA was injected into defolliculated Xenopus laevis oocytes (Xenopus1 Corp), stored at 16°C in 1:2 diluted Leibovitz’s L-15 medium (Gibco) supplemented with 2.5% Penicillin-Streptomycin (Gibco) and 5 mM HEPES pH 7.5. Borosilicate glass microelectrodes (0.1 – 0.5 MΩ for current and 1 – 5 MΩ for voltage) were pulled in two stages using a vertical puller (Narishige), filled with 3 M KCl, and used to clamp and measure currents from oocytes perfused with bath recording solution (107 mM NaCl, 5 mM KCl, 1 mM CaCl2, 1 mM MgCl2, 10 mM HEPES, pH 7.4). Addition of 100 μM LaCl3 was used to silence endogenous currents18. Data was acquired using an OC-725C clamp amplifier (Warner), filtered at 2.5 kHz with an 8-pole Bessel function, and digitized at 5 kHz using an ITC-18 converter (Instrutech Corp). Recordings and analysis were performed in Pulse or Patchmaster (HEKA Elektronik) and Igor Pro 8 (Wavemetrics). For reproducibility, at least 2 independent oocyte batches and at least 3 biological replicates (individual oocytes) were used for each HCN1 wildtype or mutant (precise numbers are indicated in the figure legends and in Extended Data Table 2).
To determine the effect of propofol on HCN1 wildtype and mutants, oocyte cells were placed in 20 ml glass scintillation vials containing 15 ml of recording solution plus carrier DMSO ± 30 μM propofol. After 20 minutes, cells were transferred to the recording chamber and continuously perfused with the same solution. Channels were activated by hyperpolarizing voltage steps ranging from +55 mV to −135 mV at 10 mV intervals, with the holding and tail potential at +50 mV. The amplitudes of the tail currents were measured at each test voltage, plotted, and the data points fitted to a Boltzmann equation: ) where is the maximum amplitude, is the applied voltage, is the activation midpoint, and k is the slope factor.
For perfusion experiments, currents were monitored from oocytes exposed to hyperpolarizing voltage steps ranging from +55 mV to −135 mV at 10 mV intervals with a tail potential at +50 mV. Cesium chloride at a final concentration of 1 mM was supplemented to the recording solution in the presence or absence of propofol to silence inward HCN1 currents. Perfusion of cesium chloride on and off the cell to demonstrate inward current reversibility was performed with a duration of 5 min each, while perfusion of 30 μM propofol lasted 10 min prior to TEVC recording. Attempts to perfuse or wash propofol out of the oocyte membranes were unsuccessful.
Graphpad Prism v10.2 was used for statistical analysis. A two-way ANOVA was used to compare apo and mutant with propofol conditions for and . P-values were calculated using Tukey multiple comparison tests, with significance defined by p < 0.05, and the resulting interactions were significant. One-way ANOVA was used to determine significance for the difference between means of of mutants compared with of wildtype, as defined by p < 0.05. P-values were calculated using Dunnett post hoc tests.
Protein expression, purification, and nanodisc reconstitution
Protein expression and purification were performed as described by Lee and Mackinnon9, using the pEG BacMam human HCN1EM construct (gift from R. Mackinnon). Briefly, HCN1 WT or M305L was transformed in DH10 Bac competent cells to purify bacmid for transfection into Sf9 cells (Expression Systems) using Cellfectin II. Three generations of baculovirus were amplified and used to transfect 2–4 L of HEK293S GnTi− cells (ATCC) at a density of 3.0 × 10⁶ cells/ml, cultured at 37°C, at a concentration of 10% (v/v) baculovirus. At approximately 12–16 hrs post-transduction, the cell cultures were supplemented with 10 mM sodium butyrate and the temperature was reduced to 30°C. The cell cultures were allowed to express for an additional 48 hrs and subsequently harvested by centrifugation.
The harvested cell pellet was resuspended in 30% glycerol and then mixed with hypotonic lysis buffer (20 mM KCl, 0.5 mM MgCl2, 2 mM DTT, 0.2 mg/ml DNase, and 10 mM Tris, pH 8) for 45 min. The cell membranes were then harvested by centrifugation at 40000g for 45 min. The membrane proteins were solubilized with 10 mM lauryl maltose neopentyl glycol (LMNG), 2 mM cholesteryl hemisuccinate (CHS), 300 mM KCl, 2 mM DTT, and 20 mM Tris, pH 8 for 2 hrs and solubilized HCN1 was recovered by centrifugation at 40000g for 45 min. The supernatant was applied to GFP nanobody coupled Sepharose resin, which was subsequently washed with 10 column volumes of wash buffer (0.05% GDN, 300 mM KCl, 2 mM DTT, and 20 mM Tris, pH 8). The washed resin was incubated overnight with 80:1 (w/w) protein to 3C protease to cleave off the GFP and release the protein from the resin. The eluted protein was concentrated, filtered through a Spin-X column and injected into a Superose 6 Increase column (Cytiva) equilibrated with SEC buffer (0.05% GDN, 150 mM KCl, 2 mM DTT, and 20 mM Tris, pH 8). Peak fractions were concentrated to 12 mg/ml for reconstitution into nanodiscs. A 27 mM lipid stock of 5:3:2 DOPC:POPE:POPS was prepared and solubilized in 20 mM Tris and 150 mM KCl, pH 8 supplemented with 2% w/v CHAPS (Anatrace). Two to three nanodisc reconstitutions were carried out in a volume of 200 μl each at a ratio of 1:0.75:75 HCN1, MSP1E3 or MSP2N2, and lipids. Nanodisc reconstitution for M305L with 1 mM propofol used MSP2N2; all other preparations used MSP1E3. Detergent removal was initiated by adding 40 mg of BioBeads (Biorad), agitating at 4°C for 2 hrs, transferring to fresh tubes with fresh 40 mg of Biobeads, and further incubated overnight with gentle agitation. The supernatant was pooled and filtered through a Spin-X column and loaded onto a Superose 6 Increase 10/300 gel filtration column (Cytiva). Peak fractions were collected and concentrated to 6–8 mg/ml. For propofol structures, 300 μM propofol (Sigma) was supplemented to all buffers, as described previously51.
CryoEM sample preparation and data collection
Purified HCN1 samples had a final concentration of 5–7 mg/ml nanodiscs, 3 mM fluorinated Fos-choline 8 (Anatrace), and where applicable, spiked with 1 mM propofol (Sigma). For holo M305L (in the absence of propofol), the final sample was also spiked with 1 mM cAMP. A volume of 3.5 μl of the final sample was applied to glow discharged UltrAuFoil R 1.2/1.3 grids (300 mesh, Quantifoil), incubated for 60 s at 15°C and 100% humidity, blotted for 2 s with 0 blot force, and plunge frozen in liquid ethane using a Vitrobot Mark IV (FEI, ThermoFisher). Data were collected at a Talos Arctica microscope or Titan Krios microscope (FEI, ThermoFisher) operated at 200 kV or 300 kV, respectively, with a GatanK3 camera. Acquisition parameters are listed in Table S1.
CryoEM data processing and model building
Relion 3.1 beta, 3.1.2, 4 beta, or 4.0.052–54 were used for cryoEM data processing of HCN1 WT and M305L. In general, motion correction was performed using Motioncorr 255, binned by 2, and CTF estimated. Particles were picked using 2D templates using the Relion LoG picker or crYOLO56 and extracted with a 256- or 310-pixel box. Two to four rounds of 2D classification were performed to sort out bad particles, followed by ab initio model generation and two rounds of 3D classification. 3D refinement, CTF-refinement, and Bayesian polishing was iterated in C1 symmetry until the resolution converged or no further improvement in resolution was observed. One to two rounds of focused 3D classification (without alignment) were performed, C4 symmetry applied, and subsequently, 3D refinement, CTF-refinement, and Bayesian polishing was again performed until the resolution converged. All reported resolutions were estimated by postprocessing at the FSC gold standard cutoff of 0.143. Local resolution was calculated and for the representation of protein densities, unfiltered half maps and the final mask was used as input for sharpening by DeepEMhancer57. Model building was iteratively performed in Phenix 1.2058, Coot59,60, and the Isolde plugin in ChimeraX61,62. Pore diagrams were made using HOLE63 and Cα RMSD calculations were performed using ChimeraX. Non-proteinaceous tubular densities that could be assigned to lipids were modeled with 1,2-dioleoyl-sn-glycero-3-phosphocholine (DOPC), as the largest species in our nanodisc reconstitution. Because lipid identity was not unambiguous, all headgroups were truncated. Specific processing schemes for each dataset are shown in Extended Data Fig. 1 and 6. Refinement and model statistics are listed in Extended Data Table 1.
Confocal microscopy of HCN1 expressing HEK293S GnTI− cells
HEK293S GnTI− cells cultured in a humidified 37°C and 5% CO2 incubator were transfected with 300 ng of HCN1EM WT or M305L with 1.8 μl Lipofectamine 2000 (Invitrogen). The cell medium was changed to fresh Dulbecco’s Modified Eagle Medium (DMEM, Gibco) 6 hrs post-transfection to remove the Lipofectamine-DNA complexes and replated 24 hrs post-transfection on a poly-D-lysine-coated glass bottom dish. Nuclei were stained with NucBlue Live ReadyProbes Reagent (R37605, Invitrogen) for 15 min at 37°C. The plasma membrane was stained with CellMask Deep Red plasma membrane stain (C10045, Invitrogen) for 5 to 10 min at 37°C.
Confocal imaging was performed with a Zeiss LSM 880 microscope equipped with 32-element AiryScan detector for super-resolution imaging and 32-channel GaAsP array for spectral imaging. Data were obtained using Zeiss Plan-Apochromat 63x/1.4 Oil DIC M27 objective with NA 1.4 at zoom 3.0x and an excitation at 488 nm and an emission filter of 500–570 nm for EGFP; excitation at 633 nm and an emission filter of 640–750 nm for CellMask DeepRed. ImageJ analysis software64 was used to generate a multichannel plot profile.
In silico docking of propofol to the HCN1 tetramer and size estimation of cavities
The detergent structures (PDB 5U6O and 5U6P) and the propofol-HCN1 nanodisc was used as input to CB-Dock265. For the propofol-HCN1 WT and M305L structures, the propofol molecules were removed from the input coordinates, leaving only the HCN1 protein channel structure. The docking results were filtered to only those located within the transmembrane region of HCN1, as suggested by our structural experiments and by previous experimental work6. Binding site 1 from the cryoEM experiments was independently identified in the propofol-HCN1 WT and M305L structures but not in the respective detergent or apo structures.
CavityPlus66 was used for the estimated size of the site 1 propofol binding pocket and in silico mutagenesis was performed in ChimeraX62, using the rotamer with no or the least number of clashes. The size of propofol (roughly 200 Å3) was determined by MoloVol67. Binding pocket residues were identified using LigPlot68 and Arpeggio69. Multiple sequence alignment for Extended Data Fig. 8 was generated in Jalview70.
Molecular dynamics simulation
The cryoEM coordinates of HCN1 with 1 mM propofol was used as initial condition. Nine missing residues in the loop between S1 and S2 helices (M243-A251) and truncated sidechains of other residues were rebuilt using modeller version 10.471 and psfgen tool in VMD software version 1.9.372. The simulation system was constructed using membrane builder tool of the CHARMM-GUI website (http://www.charmm-gui.org/)73, where HCN1 with eight propofol molecules bound at each of sites 1 and 2 of four protomers was embedded in a lipid membrane consisting of ~500 DOPC, POPE, and POPS molecules at a ratio of 5:3:2 (as used in our cryoEM sample preparation) or a pure POPC bilayer (as used previously for HCN1 MD simulations74,75), solvated with ~75,000 water molecules, and ~140 K+ and ~140 Cl− ions were added in the solvent space to mirror the physiological ionic strength (100 mM). The system contains ~330,000 atoms in total. The simulation box was set to be orthorhombic with periodic boundaries applied at x-y-z axes and dimensions of 150 Å × 150 Å × 158 Å. CHARMM36 force field76 was employed for the protein, lipids, and ions, and TIP3P model77 for waters. The force field for propofol was taken from a previous work78. Default protonation states were used for all acidic and basic residues because the pKa values calculated by PropKa version 3.179 of all acidic and basic residues were either smaller or greater than the system pH, which was set to be 7. All equilibration and production simulations were performed with Gromacs package version 2022.380, interfaced with PLUMED version 2.781. Long-range electrostatic interactions were treated with the Particle Mesh Ewald (PME) method82. The cut-off distances for the Lennard-Jones and the real space Coulomb interaction were 12 Å. All covalent bonds involving hydrogen atoms were constrained by the LINCS algorithm83. Initial energy minimization and equilibration steps were performed following the CHARMM-GUI setup. Three replicas were generated by assigning initial velocities at 300 K using different random seeds at the beginning of the equilibration step. The position restraints on protein and lipid were gradually released during 100 ns equilibration run. A wall potential (half-sided harmonic potential), , was added to individual propofol using PLUMED to enhance sampling of propofol within its binding site during equilibration run, as defined in Eqs. 1 and 2,
| (1) |
| (2) |
where is 4 (and 2) for propofols bound at site 1 (and 2), are the distance between the center of mass of propofol and alpha carbon of each of four residues selected at the binding pocket (M305, M356, F389 from one protomer, and I380 from its neighboring protomer interfaced at site 1 ) for propofols at site 1 (), and alpha carbons of L218 and K219 for propofols at site 2 (. was set to be 6.5, 10, 10, and 7.5 Å for propofols at site 1, 8.5 and 6.0 Å for propofols at site 2. Each was chosen to be ~2 Å greater than its initial value in the cryo-EM coordinates. was set to be 30 kcal · mol−1 · Å−2 for all . The wall potentials were removed after equilibration, followed by production run for 400 ns. All simulations were performed in the semi-isotropic NPT ensemble at and atm. Propofol was considered unbound when the RMSD of propofol from its initial binding pose at was larger than 5 Å for longer than 1 ns.
Voltage clamp fluorometry (VCF)
The gene codifying for the sea urchin (Strongylocentrotus purpuratus) HCN (spHCN) channel was in the pGEM-HE expression plasmid. All mutations were introduced using QuikChange site-directed mutagenesis kit (Qiagen). In vitro spHCN cRNA were transcribed using mMessage mMachine T7 RNA Transcription Kit (Ambion). cRNA at 1–5 μg/μL was injected into defolliculated Xenopus laevis oocytes (Ecocyte, Austin, TX). The oocytes were incubated in ND96 solution (96 mM NaCl, 2 mM KCl, 1 mM MgCl2, 1.8 mM CaCl2, 5 mM HEPES; pH 7.5).
To conduct voltage clamp fluorometry (VCF), we introduced the mutation R332C in the S4 of spHCN channels. We then labeled these mutant channels with the fluorophore Alexa-488 C5-maleimide. We have previously shown that the fluorescence from Alexa-488-labeled spHCN-R332C channels (referred to as WT in the text) is a good reporter for S4 movement in spHCN channels18,46.
After 2–3 days of incubation, oocytes were labeled with 100 μM Alexa-488 C5-maleimide (Molecular Probes) for 30 min at 4°C. Following labeling, the oocytes were kept on ice to prevent the internalization of labeled channels. Oocytes were recorded in ND96 solution with 100 μM LaCl3 to block endogenous currents induced by hyperpolarized voltages46. Whole-cell ionic currents were measured with the two-electrode voltage clamp technique using an Axon Geneclamp 500B amplifier (Axon Instruments, Inc.). Data were filtered at 1 kHz, digitized at 5 kHz (Axon Digidata 1322 A), and monitored and collected using pClamp software (Axon Instruments, Inc.). Fluorescence signals were low-pass Bessel filtered (Frequency Devices) at 200 Hz and digitized at 1 kHz. From a holding potential of −10 mV, steps from +40 mV to −160 mV (in −20 mV steps) were applied to activate the S4 movement and current of the channel followed by a tail voltage of +40 mV to obtain the tail current. The conductance-voltage (GV) relation of channels was determined by measuring the tail currents at +40 mV. The fluorescence-voltage (FV) relation of channels was determined by measuring the steady-state fluorescence signal upon activation at different voltages. ZD7288 (Tocris Bioscience, MN, USA) and Propofol (Sigma, MO, USA) were added to the bath solution to block spHCN channels.
Conductance-voltage (GV) curves were obtained by plotting the normalized tail currents versus different test pulses to determine the steady-state voltage dependence of current activation. Tail currents were measured at +10 mV following test pulses. The GV curves were fit with a single Boltzmann equation: , where and are the maximum and minimum, respectively, is the voltage where 50% of the maximal conductance level is reached and is the slope factor. Data were normalized between the and values of the fit. Fluorescence signals were bleach-subtracted, and data points were averaged over tens of milliseconds at the end of the test pulse to reduce errors from signal noise. Fluorescence-voltage (FV) curves were obtained by plotting the normalized steady-state fluorescence signal versus different test pulses. The FV curves were fitted with a single Boltzmann equation. All experiments were repeated more than three times from at least two batches of oocytes. Data are presented as mean ± SEM, and n represents the number of experiments.
Extended Data
Extended Data Fig. 1 |. CryoEM data processing of HCN1 WT nanodisc in the absence and presence of 1 mM propofol.
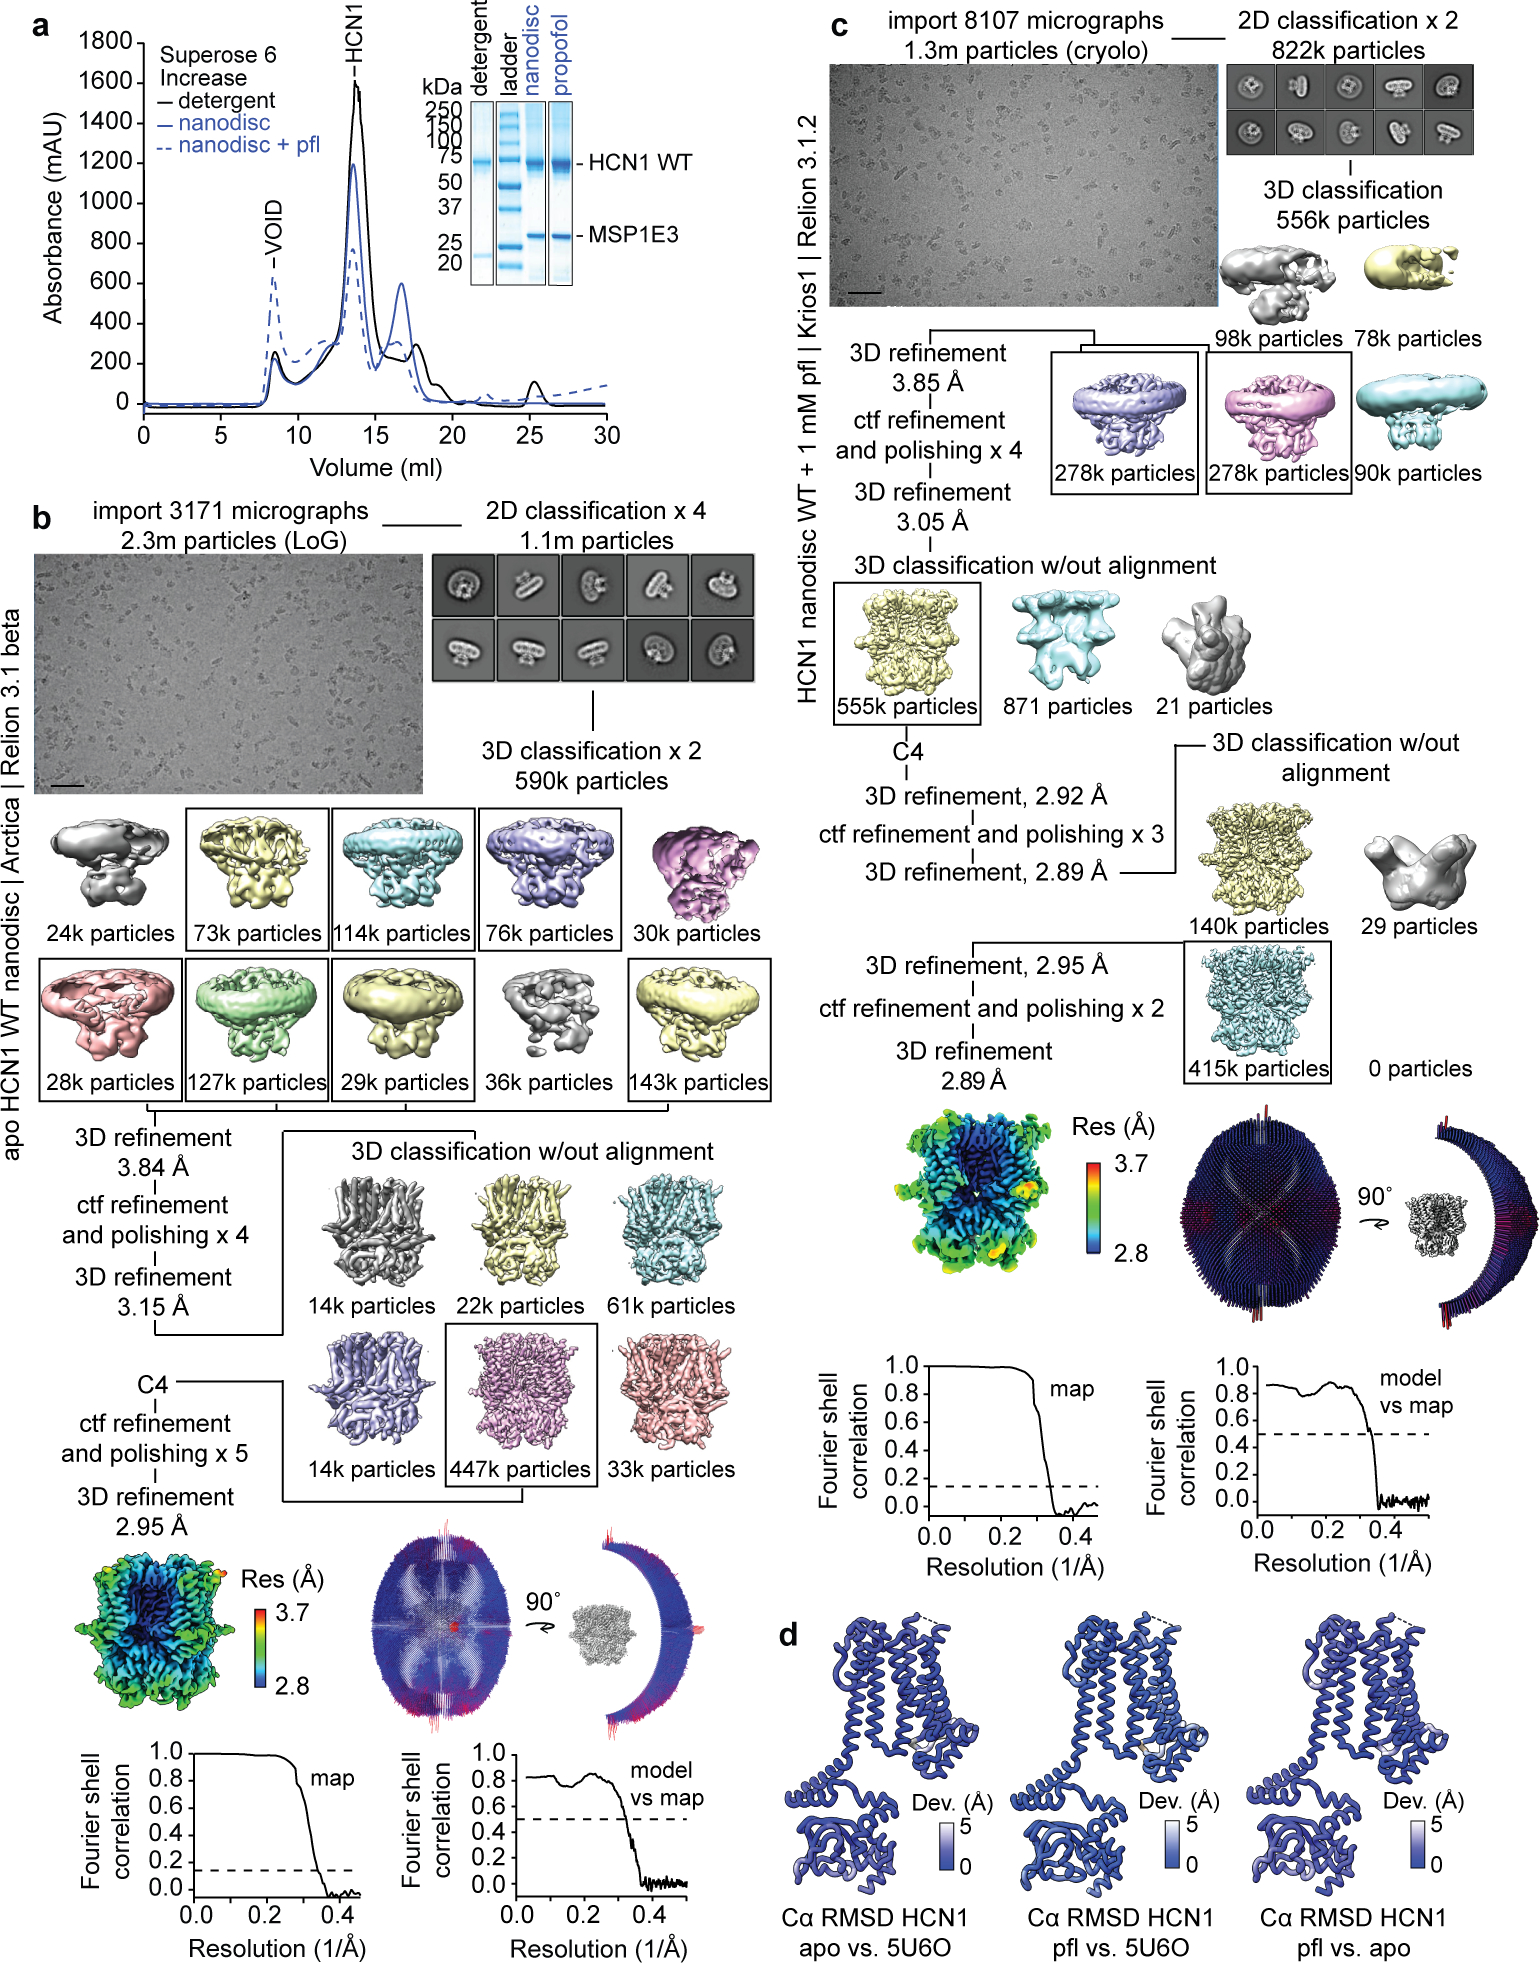
a, SEC chromatograms and SDS-PAGE of HCN1 WT nanodisc purifications in the presence and absence of propofol. For gel source data, see Supplementary Fig. 1. The cryoEM processing schematics are shown for b, apo HCN1 WT nanodisc and c, HCN1 WT nanodisc + pfl. Micrograph scale bar represents 50 nm. d, Backbone RMSD deviations between apo, propofol (pfl), and detergent (PDB 5U6O9) structures.
Extended Data Fig. 2 |. Local cryoEM densities of propofol binding sites 1 and 2.
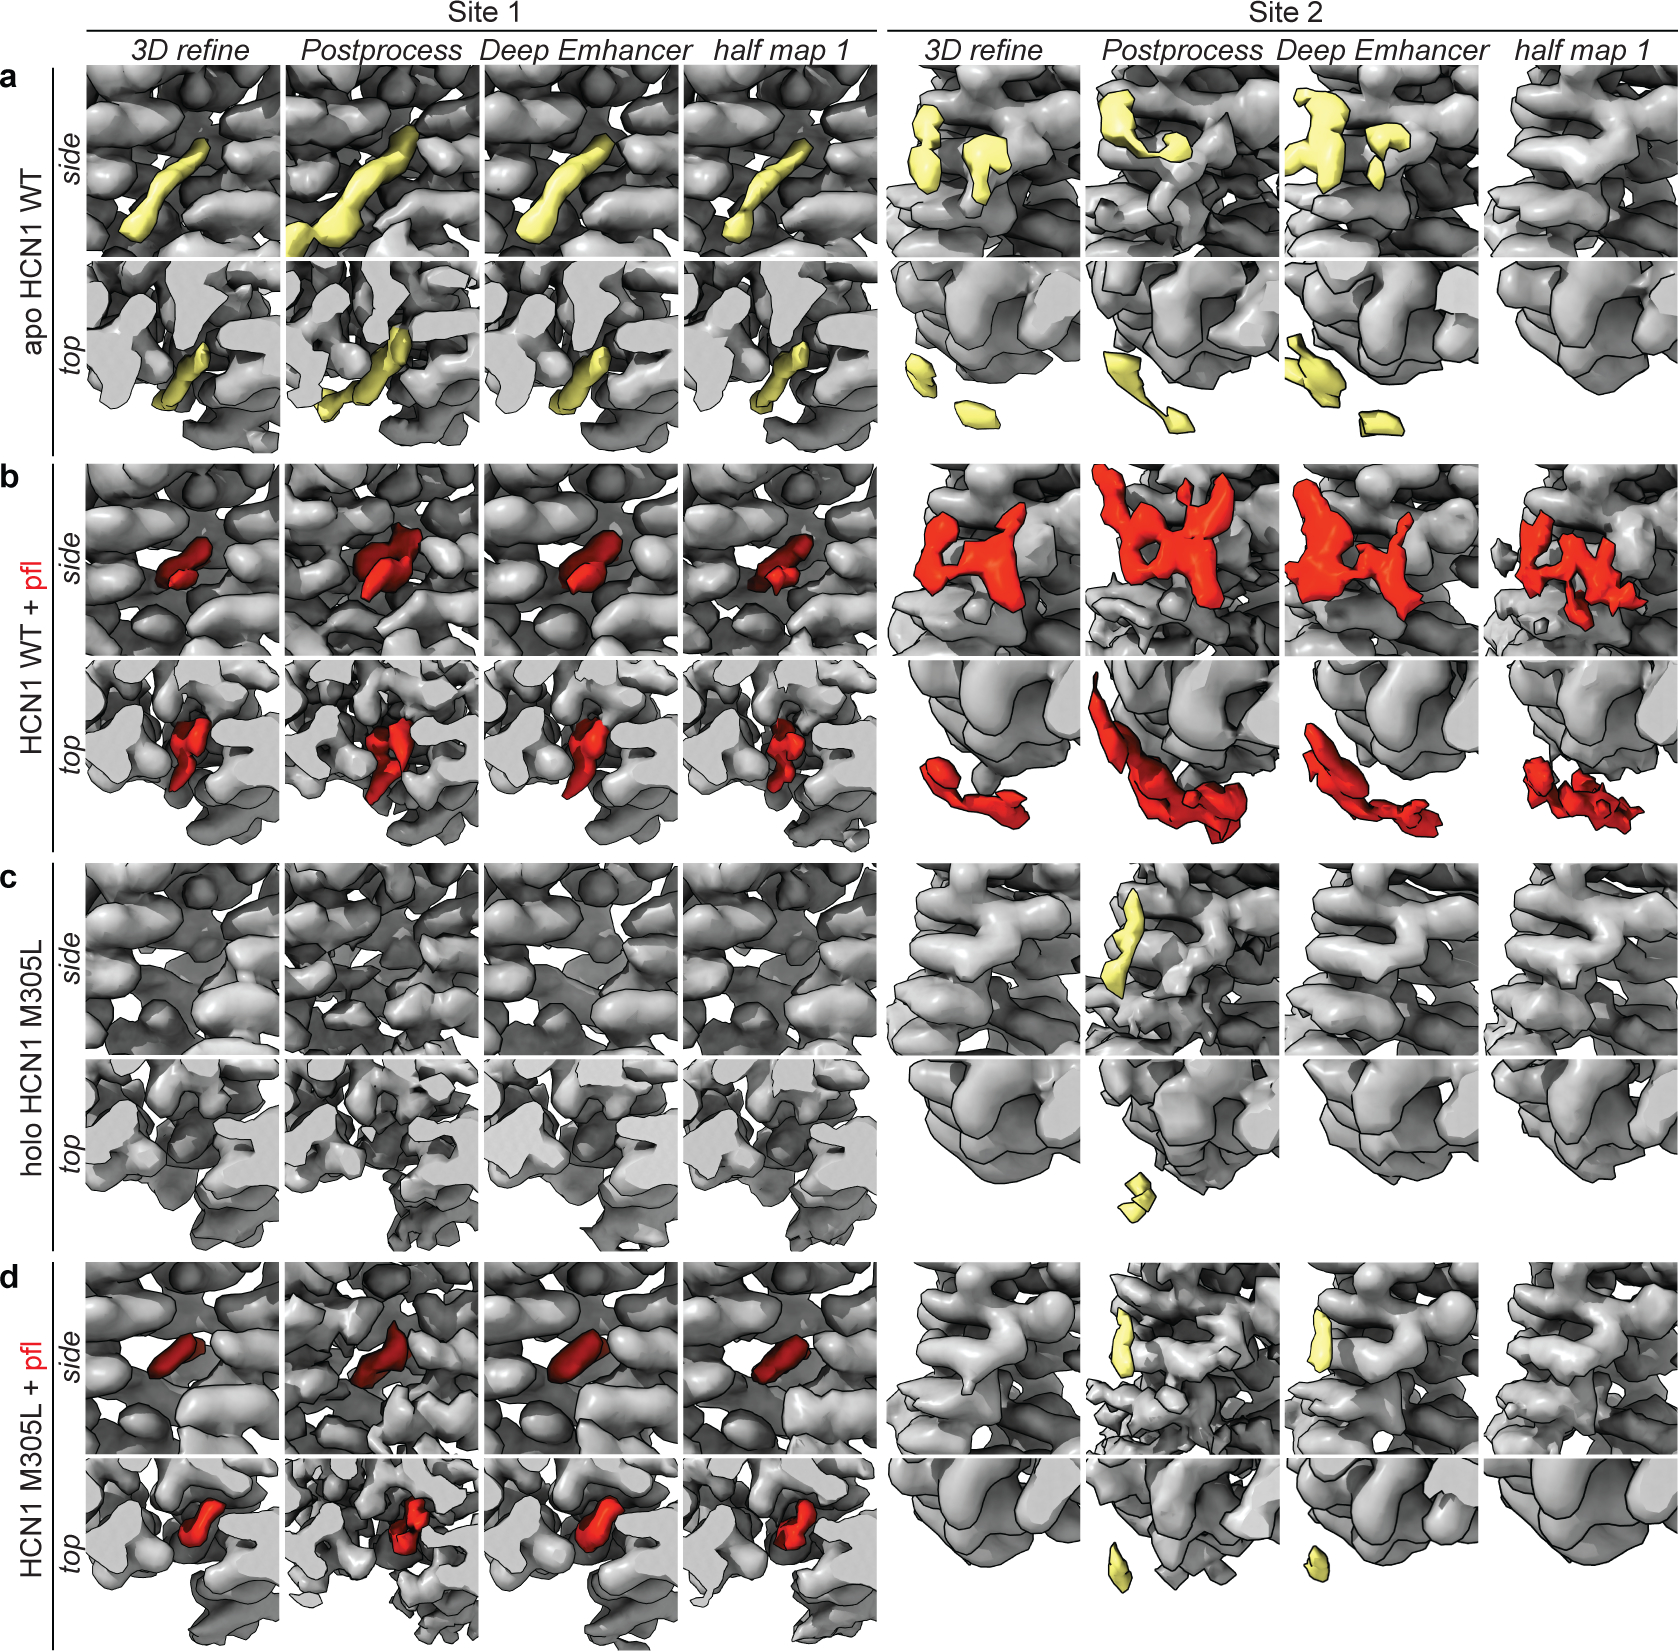
Shown are side and top views of the site 1 and site 2 densities from the 3D Refinement map, PostProcess map, DeepEMhancer map, and half map 1 for a, apo WT, b, WT + 1 mM propofol, c, holo M305L, and d, M305L + 1 mM propofol datasets. The HCN1 protein is in gray, tubular lipid densities in yellow, and the identified propofol densities in red. DeepEMhancer representations are used in the manuscript.
Extended Data Fig. 3 |. Site 2 is state-independent and does not confer propofol inhibition of HCN1 channels.
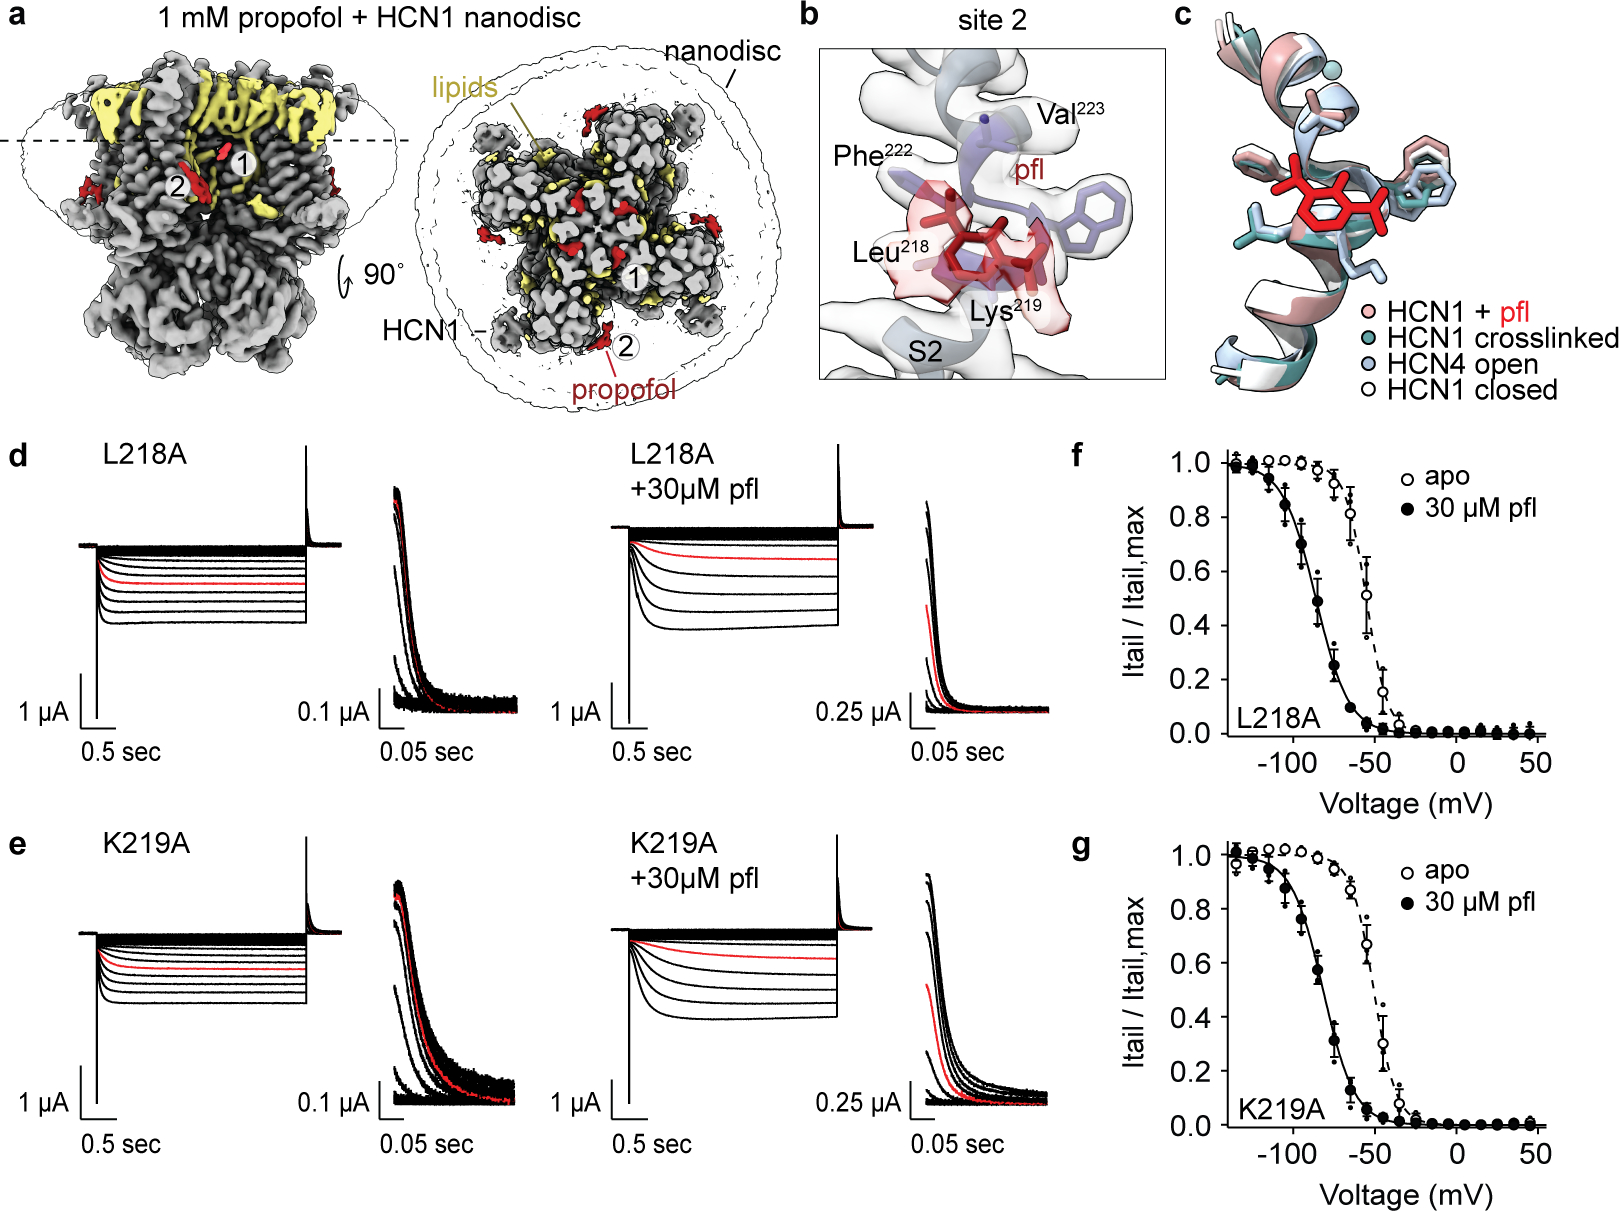
a, Overview of the propofol-HCN1 cryoEM map, from Fig 1B, highlighting binding site 1 and site 2. b, Zoomed in view of the residues surrounding the density at site 2. c, Overlay of HCN1 + 1 mM propofol (this study, red-brown), HCN1 crosslinked (PDB6 6UQF10, cyan), HCN4 open (7NMN35, light blue), and HCN1 closed (5U6O9, white). Shown are the response of HCN1 d, L218A and e, K219A in the absence (left) and presence (right) of propofol by two electrode voltage clamp. Voltage clamp ranged from +45 mV to −135 mV with tail currents measured at +50 mV. The current response at −85 mV is highlighted in red. Corresponding Boltzmann fits are shown in f, f, L218A (apo: k = 6.3 ± 0.8 mV, n = 3; pfl: , k = 10.1 ± 1.2 mV, n = 4, p < 0.0001) and g, K219A (apo: , k = 6.8 ± 0.4 mV, n = 4; pfl: , k = 10.2 ± 1.6, n = 4, p < 0.0001). L218A and K219A , compared to that of WT . P-values were determined by two-way ANOVA using a Tukey post hoc test between apo and propofol , with significance defined as p < 0.05, and n denotes biological replicates. Empty and filled symbols with error bars represent mean ± standard deviation for normalized apo and propofol data, respectively.
Extended Data Fig. 4 |. Propofol makes hydrophobic contacts with and exhibits longer residence in site 1.
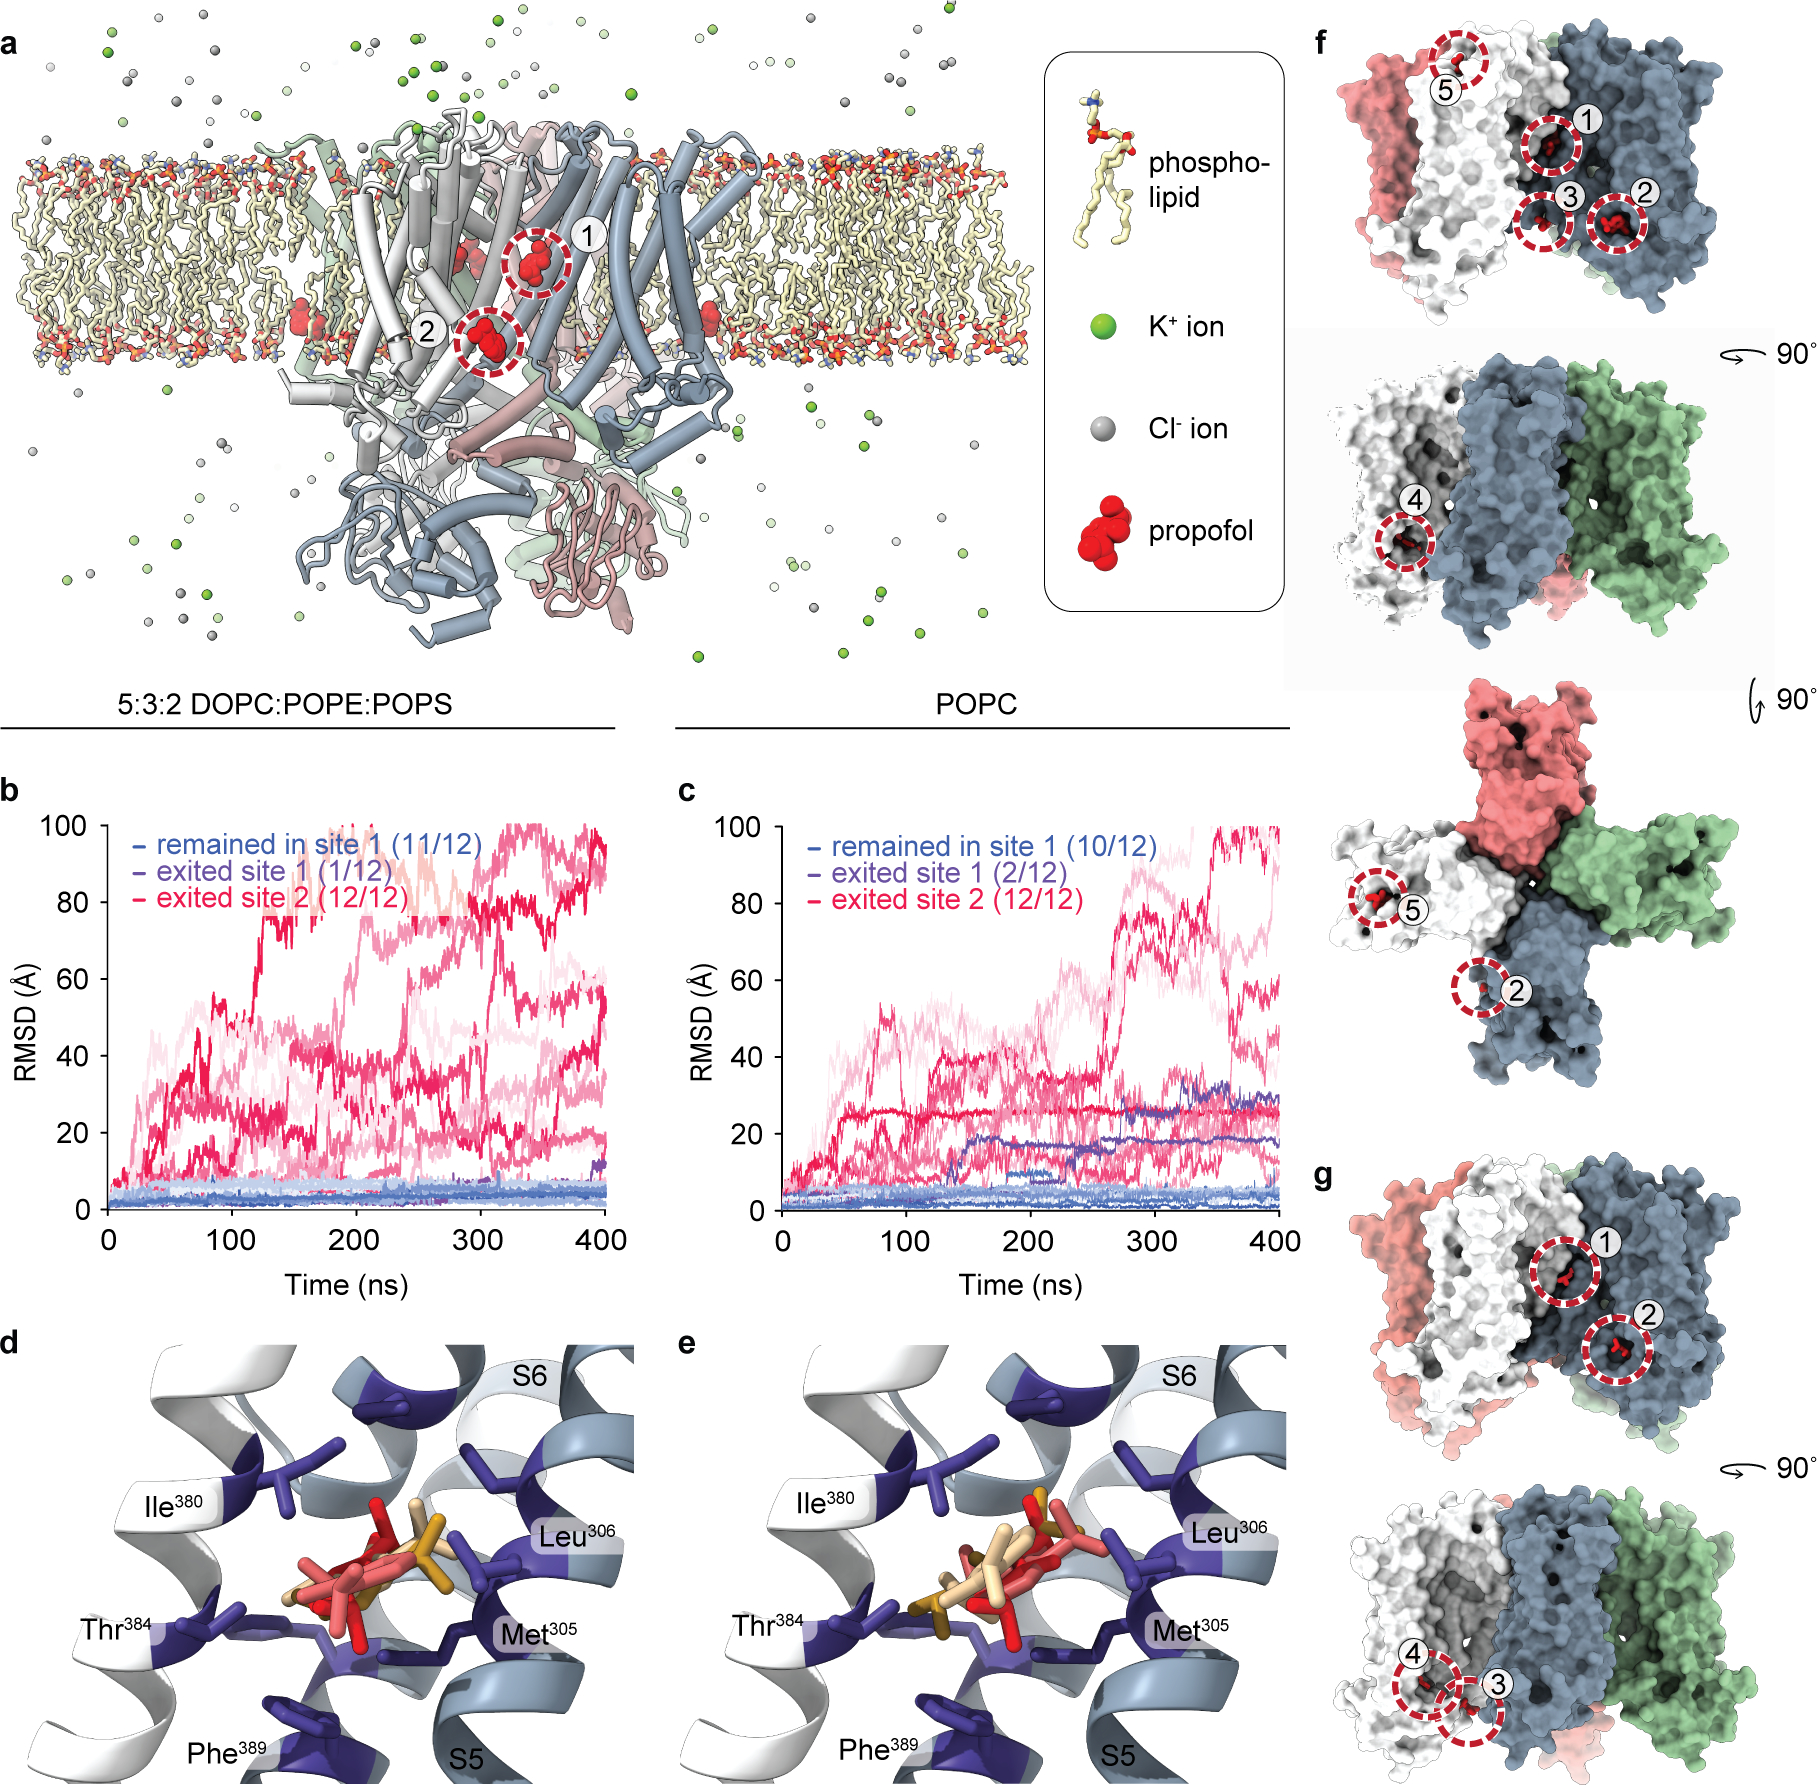
a, HCN1 was solvated in lipids (yellow-red-blue sticks) and propofol bound at site 1 and site 2 are shown in red spheres. K+ and Cl− ions are shown in green and gray spheres, respectively. Waters are not shown for simplicity. RMSD of propofol from their originating position in a MD simulation of the HCN1 WT tetramer in a b, DOPC:POPE:POPS and c, pure POPC lipid bilayer. All 12 propofols unbound from site 2 in both lipid compositions, while 11 of 12 propofols remained bound to site 1 in the DOPC:POPE:POPS bilayer. In the POPC bilayer, 10 of 12 propofols remained at site 1. Propofol (red) at site 1 adopts multiple binding poses in both the d, DOPC:POPE:POPS and e, POPC lipid bilayers. Propofols at the center of each of the three highest populated clusters which contribute to 97% of the total frames are shown in stick model and colored by orange, red-brown, and yellow respectively. Distinct HCN1 subunits are shown in light gray and slate. Amino acid residues lining the binding pocket are in purple. f, Docking65 of propofol to HCN1 identified 5 transmembrane locations, labeled 1 through 5. Site 1 identified by cryoEM is equivalent to docking position 1. However, site 2 from the cryoEM experiment was not identified. g, Docking of propofol to HCN1 M305L found 4 transmembrane locations. The site 1 was identified, but not site 2. Positions 2 and 4 were also the same as those found in the WT docking experiment in f. For clarity, only the TMs of the channel is shown with individual subunits colored in slate, light grey, green, and red-brown. Docked propofol molecules are in red.
Extended Data Fig. 5 |. Perfusion of propofol to HCN1 M305L recovers voltage dependent gating.
a, Schematic of perfusion experiment design. Two electrode voltage clamp recordings were performed pre- and post-perfusion with 30 μM propofol for 10 min. To verify inward HCN1 currents, recording solution supplemented with 1 mM cesium chloride was perfused on and off the cell for 5 min. Shown are representative traces of n = 3 and 4 similar recordings with b, WT and c, M305L, respectively. d, For WT and M305L, the inward current is blocked by cesium while the outward depolarized tails remain intact. Corresponding Boltzmann fits are also shown for WT and M305L. Controls demonstrating inward current cesium block in the absence of 30 μM propofol are shown for e, WT and f, M305L and are representative traces of n = 3 similar recordings. Voltage clamp ranged from +45 mV to −125 mV with tail currents measured at +50 mV. The current response at −85 mV is highlighted in red. Empty and filled symbols with error bars represent mean ± standard deviation for normalized apo and propofol data, respectively. n represents the number of biological replicates. HEK293S GnTI− cells transfected with HCN1 g, WT and h, M305L using Lipofectamine 2000 (Invitrogen). Nuclei are in blue, the plasma membrane in red, and HCN1 in green. Expression at the plasma membrane is demonstrated by colocalization (yellow). Shown is a representative cell of WT n = 20 and M305L n = 10 similar cells, over 3 independent transfections. Plotted to the right are intensity values across the dashed orange line. The scale bar represents 10 μm. For microscopy source data, see Supplementary Fig. 2.
Extended Data Fig. 6 |. CryoEM data processing of HCN1 M305L nanodisc in the absence and presence of 1 mM propofol.
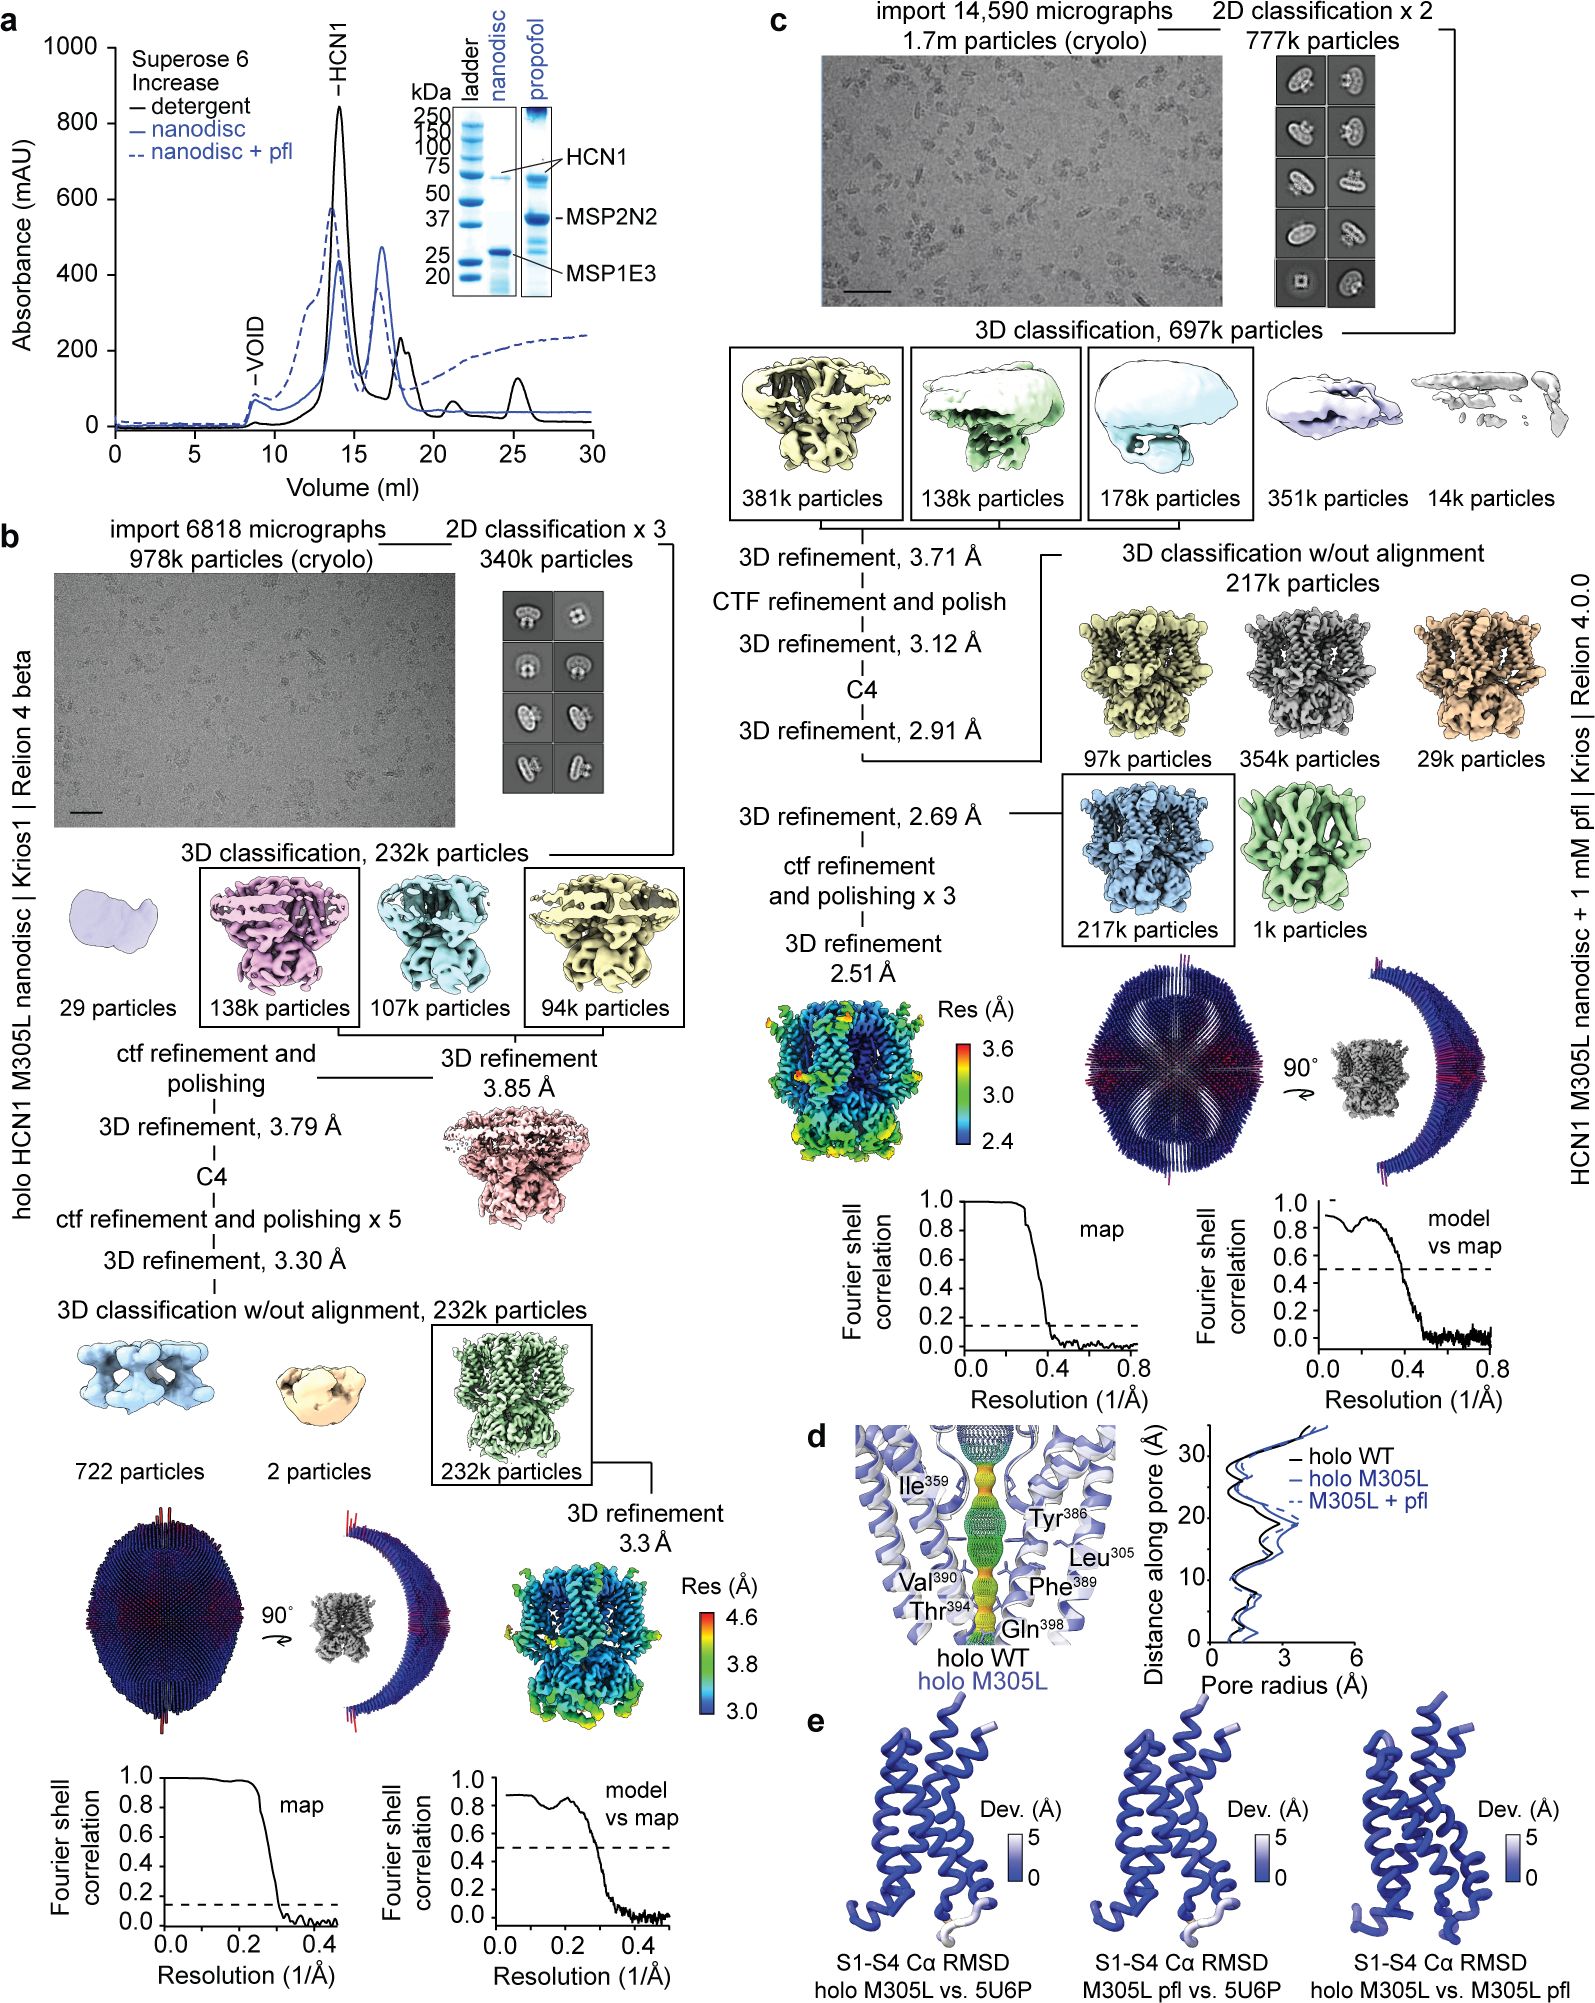
a, SEC chromatograms and SDS-PAGE of HCN1 M305L nanodisc purifications in the presence and absence of propofol. The nanodiscs for M305L HCN1 holo without propofol were made using MSP1E3 while the ones for M305L HCN1 with propofol were made using MSP2N2. For gel source data, see Supplementary Fig. 1. The cryoEM processing schematics are shown for b, apo HCN1 M305L nanodisc and c, HCN1 M305L nanodisc + pfl. Micrograph scalebar represents 50 nm. d, Pore diagram comparison between holo M305L nanodisc, M305L + pfl, and holo WT detergent (PDB 5U6P9) structures using HOLE63. Red indicates regions that are smaller than a single water molecule to pass, green for a single water molecule, and blue is double the radius of a single water molecule. Both holo structures contain cAMP. e, Backbone RMSD deviations of the voltage sensing domain (S1-S4) between holo M305L, holo WT (PDB 5U6P9), and M305L propofol structures.
Extended Data Fig. 7 |. Voltage-independent spHCN-M375L channels are blocked by the specific HCN channel blocker ZD7288 and the Met375-Phe459 interaction is important to close spHCN channels at positive voltages.
a, Representative current traces from spHCN M375L channels before (left) and after (right) the application of 100 μM ZD7288. Dashed lines indicate no currents. Met375 and Phe459 mutants show currents at positive voltages and similar voltage sensor movement. b, GV and c, FV relations from WT (black), M375L (blue), M375F (purple), M375A (green), M375C (orange) and M375S (pink) mutant spHCN channels. d, GV and e, FV relations from WT (black), F459Y (pink), F459C (orange), F459M (purple), F459E (cyan), F459A (green), F459L (blue), F459Q (gray), F459V (magenta) and F459W (dark yellow) mutant spHCN channels. f, Representative current traces from oocytes expressing WT, M375F, F459M and M375F/F459M spHCN channels. Dashed lines indicate no currents. g, GV relations from WT (black), M375F (green), F459M (orange) and M375F/F459M (red) spHCN channels. All and n numbers are shown in Extended Data Table 2. Data are represented as mean ± SEM. n indicates the number of biological replicates.
Extended Data Fig. 8 |. Met-aromatic interactions occur in voltage-gated HCN1 channels.
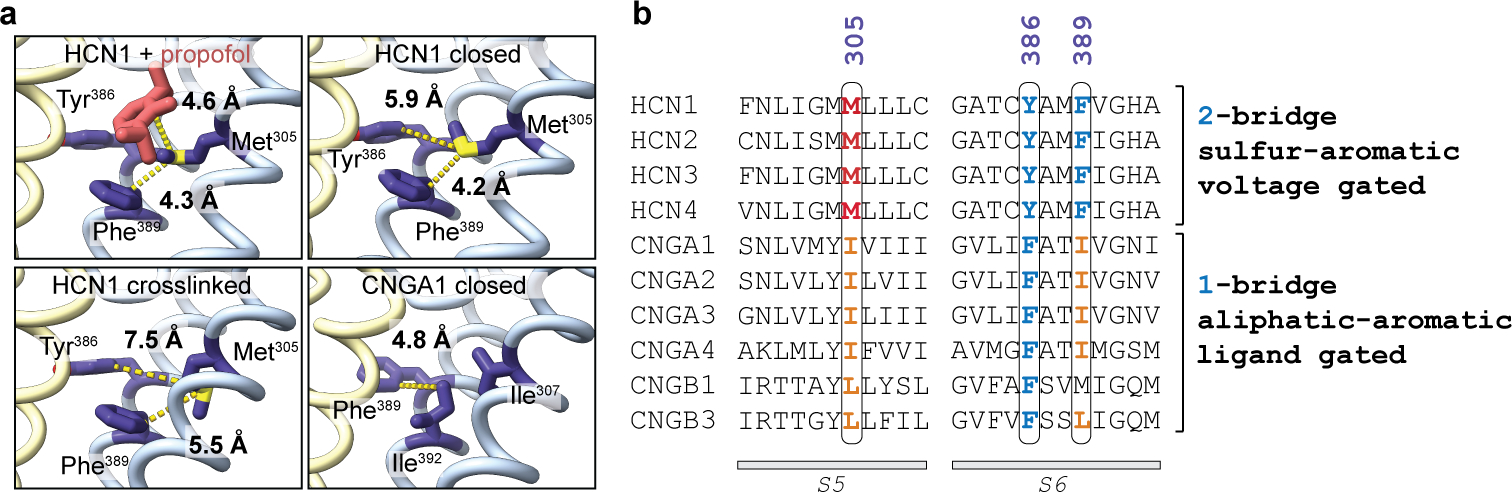
a, Local structure of HCN1 + propofol, HCN1 closed (PDB 5U6O), and HCN1 crosslinked (PDB 6UQF) around the Met305-Phe389 interaction. The homologous positions Ile307-Ile392 for the CNGA1 structure (PDB 7LFT) are also shown. Approximate distances between atoms (dashed yellow lines) are labeled between methionine, isoleucine, and the adjacent aromatic rings (purple). Propofol is colored in pink and adjacent protomers are in blue and yellow. b, Multiple sequence alignment between human HCN and CNG isoforms. Residue numbering follows the HCN1 amino acid sequence. The methionine, isoleucine, and aromatic positions labeled in panel a are highlighted in red, orange, and blue. A single aliphatic-aromatic interaction (1-bridge) exists in CNG channels which are ligand gated. In contrast, an interaction between methionine with two aromatic residues (2-bridge) occurs in HCN channels which are voltage gated.
Extended Data Table 1 |. CryoEM data collection, refinement, and validation statistics.
Listed are the microscope parameters for each data collection, as well as the final refinement, modeling, and validation information and metrics.
| #1 HCN1 complex with propofol | #2 HCN1 apo | #3 HCN1 M305L with propofol | #4 HCN1 M305L holo | |
|---|---|---|---|---|
| (EMDB-42116) (PDB 8UC7) |
(EMDB-42117) (PDB 8UC8) |
(EMDB-44425) (PDB 9BC6) |
(EMDB-44426) (PDB 9BC7) |
|
|
| ||||
| Data collection and processing | ||||
| Magnification | 81,000 | 36,000 | 105,000 | 81,000 |
| Voltage (kV) | 300 | 200 | 300 | 300 |
| Electron exposure (e-/Å2) | 52.53 | 53.41 | 48.48 | 49.11 |
| Defocus range (μm) | 1.0 – 2.5 | 1.2 – 2.9 | 0.6 – 3.2 | 0.1 – 2.0 |
| Pixel size (Å) | 0.815 | 1.096 | 0.600 | 1.083 |
| Symmetry imposed | C4 | C4 | C4 | C4 |
| Initial particle images (no.) | 1,300,000 | 2,300,000 | 1,716,000 | 978,000 |
| Final particle images (no.) | 415,000 | 447,000 | 217,000 | 232,000 |
| Map resolution (Å) | 2.9 | 3.0 | 2.5 | 3.3 |
| FSC threshold | 0.143 | 0.143 | 0.143 | 0.143 |
| Map resolution range (Å) | 2.8 – 3.7 | 2.8 – 37 | 2.4 – 4.0 | 3.0 – 4.6 |
| Refinement | ||||
| Initial model used (PDB code) | 5U60 | 5U60 | 5U60 | 5U6P |
| Model resolution (Å) | 3.0 | 3.1 | 2.6 | 3.5 |
| FSC threshold | 0.5 | 0.5 | 0.5 | 0.5 |
| Map sharpening | −108.648 | −101.789 | −73.215 | −121.246 |
| B factor (Å2) | ||||
| Model composition | ||||
| Non-hydrogren atoms | 14840 | 14808 | 14976 | 15632 |
| Protein residues | 1936 | 1936 | 1936 | 2024 |
| Ligands | 16 | 16 | 12 | 16 |
| B factors (Å2) | ||||
| Protein | 21.82/127.77/66.06 | 30.00/118.39/67.57 | 30.00/132.99/66.44 | 30.00/161.13/94.54 |
| Ligand | 30.00/30.00/30.00 | 30.00/30.00/30.00 | 30.00/81.94/41.92 | 30.00/91.68/45.60 |
| R.m.s. deviations | ||||
| Bond legnths (Å) | 0.013 | 0.011 | 0.012 | 0.015 |
| Bond angles (°) | 1.844 | 1.898 | 1.768 | 1.970 |
| Validation | ||||
| MolProbity score | 0.86 | 1.35 | 1.21 | 1.19 |
| Clashscore | 1.31 | 3.06 | 2.87 | 3.53 |
| Poor rotamers (%) | 0.00 | 0.30 | 0.56 | 0.55 |
| Ramachandran plot | ||||
| Favored (%) | 98.33 | 96.25 | 97.29 | 97.81 |
| Allowed (%) | 1.67 | 3.75 | 2.71 | 2.19 |
| Disallowed (%) | 0.00 | 0.00 | 0.00 | 0.00 |
Extended Data Table 2 |. Fit parameters for TEVC of human HCN1 propofol binding site mutations and VCF of spHCN mutant channels expressed in Xenopus laevis oocytes.
a, The Boltzmann equation was used to determine V1/2, slope factor (k), and Imax in the absence or presence of 30 μM propofol and are represented as averages ± standard deviation. One-way ANOVA was used to determine the difference of means significance for ΔV1/2 compared to wildtype, with significance defined as p < 0.05. P-values were calculated using Dunnett post hoc tests and n represents the number of biological replicates. Lines indicate that either no observable currents or no depolarized tail currents were measured. b, Cesium and propofol perfusion of human HCN1 M305L expressed in Xenopus laevis oocytes. The Boltzmann equation was used to determine V1/2, slope factor (k), and Imax in the absence or presence of 30 μM propofol and/or 1 mM cesium chloride and are represented as averages ± standard deviation. Lines indicate that no depolarized tail currents were measured and n represents the number of biological replicates. Values for ΔV1/2 represent that compared to the respective apo condition or step 1 of each perfusion experiment (Extended Data Fig. 6). c, Summary of parameters of the fits for spHCN mutant channels. GV1/2 and FV1/2 were obtained by fitting the GV and FV curves with a single Boltzmann equation. Data are shown as mean ± SEM. n indicates the number of biological replicates of all experiments.
| a | ||||||||||
|---|---|---|---|---|---|---|---|---|---|---|
| HCN1 mutant | n | V1/2 (mV) | slope (mV) | Imax (μA) | + 30 μM
propofol |
ΔV1/2 (mV) | p value | |||
| n | V1/2 (mV) | slope (mV) | Imax (μA) | |||||||
|
| ||||||||||
| WT | 22 | −58.2 ± 3.4 | 9.3 ± 1.7 | 2.2 ± 1.7 | 24 | −89.1 ± 5.5 | 9.5 ± 1.0 | 2.4 ± 1.7 | −30.9 ± 6.4 | |
| D401N | 13 | −9.7 ± 13.8 | 27.8 ± 4.4 | 0.7 ± 0.3 | 11 | −76.1 ± 8.1 | 10.2 ± 1.3 | 0.9 ± 0.4 | −66.4 ± 16.1 | < 0.0001 |
| D401H | 11 | −2.9 ± 12.8 | 32.1 ± 5.7 | 1.8 ± 1.0 | 12 | −78.5 ± 2.3 | 12.0 ± 1.5 | 0.7 ± 0.2 | −75.7 ± 13.0 | < 0.0001 |
| R297A | 4 | - | - | - | 3 | - | - | - | n/a | |
| M305W | 6 | - | - | - | 3 | - | - | - | n/a | |
| M305R | 3 | - | - | - | 3 | - | - | - | n/a | |
| M305L | 5 | - | - | - | 6 | −37.9 ± 4.3 | 16.9 ± 2.4 | 0.6 ± 0.3 | n/a | |
| M305I | 12 | −32.6 ± 3.8 | 10.9 ± 1.4 | 1.2 ± 0.4 | 7 | −55.4 ± 2.9 | 6.7 ± 1.0 | 1.5 ± 0.6 | −22.8 ± 4.8 | 0.2734 |
| M305E | 3 | −72.5 ± 0.5 | 10.1 ± 3.4 | 0.9 ± 0.6 | 3 | −83.8 ± 1.9 | 8.1 ± 0.7 | 1.3 ± 0.7 | −11.3 ± 1.9 | 0.0063 |
| T384L | 13 | −81.6 ± 5.0 | 8.7 ± 0.9 | 2.4 ± 1.1 | 10 | −104.8 ± 3.4 | 13.1 ± 2.2 | 1.9 ± 1.3 | −23.2 ± 6.1 | 0.1959 |
| T384F | 15 | −65.6 ± 5.5 | 7.4 ± 1.3 | 5.2 ± 2.6 | 11 | −79.0 ± 3.5 | 8.2 ± 0.7 | 5.2 ± 1.1 | −13.4 ± 6.5 | < 0.0001 |
| L218A | 3 | −55.3 ± 4.0 | 6.3 ± 0.8 | 0.7 ± 0.2 | 4 | −86.2 ± 3.5 | 10.1 ± 1.2 | 0.8 ± 0.7 | −31.0 ± 5.2 | > 0.9999 |
| K219A | 4 | −50.7 ± 2.8 | 6.8 ± 0.4 | 0.7 ± 0.5 | 4 | −83.0 ± 2.5 | 10.2 ± 1.6 | 1.1 ± 0.3 | −32.3 ± 3.7 | > 0.9999 |
| W221A | 3 | - | - | - | 3 | - | - | - | n/a | |
| F222A | 3 | - | - | - | 3 | - | - | - | n/a | |
|
| ||||||||||
|---|---|---|---|---|---|---|---|---|---|---|
| b | ||||||||||
| HCN1 mutant | perfusion | n | tail currents |
holding (mV) | inward I (μA) | I / Iapo (%) | ||||
| V1/2 (mV) | slope (mV) | Imax (μA) | ΔV1/2 (mV) | |||||||
|
| ||||||||||
| WT | 1. apo | 4 | −57.8 ± 7.2 | 7.7 ± 1.1 | 2.1 ± 1.0 | n/a | −135 | −5.7 ± 2.6 | 100.0 | |
| 2. pfl | −79.2 ± 4.6 | 9.2 ± 0.3 | 1.8 ± 0.7 | −21.4 ± 8.6 | −135 | −4.6 ± 1.3 | 86.3 ± 18.4 | |||
| 3. pfl + cs | −76.3 ± 4.8 | 8.3 ± 0.5 | 1.7 ± 0.7 | −18.5 ± 8.6 | −135 | −1.1 ± 0.5 | 20.4 ± 3.4 | |||
| 4. pfl | −80.5 ± 4.8 | 9.5 ± 0.5 | 1.5 ± 0.5 | −22.7 ± 8.6 | −135 | −3.9 ± 1.0 | 74.1 ± 18.0 | |||
| M305L | 1. apo | 4 | - | - | - | n/a | −135 | −3.6 ± 0.8 | 100.0 | |
| 2. pfl | −38.9 ± 4.3 | 15.3 ± 2.0 | 0.6 ± 0.1 | n/a | −135 | −3.2 ± 0.6 | 88.7 ± 2.5 | |||
| 3. pfl + cs | −41.8 ± 4.6 | 13.0 ± 0.7 | 0.6 ± 0.5 | n/a | −135 | −1.0 ± 0.2 | 26.5 ± 1.3 | |||
| 4. pfl | −45.5 ± 4.1 | 12.6 ± 1.1 | 0.7 ± 0.1 | n/a | −135 | −3.0 ± 0.6 | 79.9 ± 3.8 | |||
| WT | 1. apo | 3 | −45.8 ± 2.5 | 7.8 ± 0.5 | 1.9 ± 0.7 | n/a | −135 | −4.5 ± 1.2 | 100.0 | |
| 2. cs | −46.2 ± 3.4 | 6.7 ± 0.6 | 2.0 ± 0.7 | 0.3 ± 4.3 | −135 | −0.9 ± 0.2 | 21.5 ± 5.6 | |||
| 3. apo | −47.6 ± 2.1 | 6.7 ± 0.4 | 2.1 ± 0.7 | 1.8 ± 3.3 | −135 | −4.5 ± 1.1 | 101.8 ± 4.4 | |||
| M305L | 1. apo | 3 | - | - | - | n/a | −135 | −3.1 ± 0.3 | 100.0 | |
| 2. cs | - | - | - | n/a | −135 | −0.9 ± 0.1 | 29.7 ± 1.9 | |||
| 3. apo | - | - | - | n/a | −135 | −2.8 ± 0.3 | 90.8 ± 1.9 | |||
| c | |||||
|---|---|---|---|---|---|
| spHCN mutant | GV1/2 (mV) | n | FV1/2 (mV) | n | |
|
| |||||
| WT | −75.83 ± 0.48 | 3 | −54.70 ± 1.07 | 3 | |
| M375L | - | 10 | −39.94 ± 1.08 | 4 | |
| M375F | −137.56 ± 22.30 | 5 | −24.29 ± 2.17 | 4 | |
| M375A | −117.62 ± 2.43 | 8 | −51.87 ± 1.45 | 4 | |
| M375C | - | 7 | −48.79 ± 5.06 | 5 | |
| M375S | −116.91 ± 3.11 | 5 | −61.13 ± 2.91 | 5 | |
| F459Y | - | 4 | −52.12 ± 1.30 | 4 | |
| F459C | - | 3 | −42.20 ± 1.94 | 4 | |
| F459M | - | 8 | −24.06 ± 3.10 | 3 | |
| F459E | - | 7 | - | 5 | |
| F459A | - | 9 | −37.85 ± 2.10 | 3 | |
| F459L | - | 4 | −52.24 ± 1.10 | 5 | |
| F459Q | - | 3 | −10.59 ± 6.12 | 3 | |
| F459V | −80.02 ± 4.76 | 3 | −47.83 ± 1.94 | 5 | |
| F459W | - | 4 | - | 3 | |
| M375F/F459M | −58.0 ± 3.65 | 4 | −38.87 ± 3.40 | 4 | |
Supplementary Material
Acknowledgements
We thank Maria Falzone and Philipp Schmidpeter for assistance with cryoEM freezing and processing, Matthew Ferrer for help with two electrode voltage clamp recordings, Janusz Wojcik for mutagenesis of human HCN1, Leila Khajoueinejad for Xenopus oocyte preparation, Minfei Su for baculovirus guidance, and the members of Crina Nimigean’s, Peter Larsson’s, and Paul Riegelhaupt’s labs for their scientific input. Screening and data collection were performed by Huihui Kuang, Bing Wang, and William Rice at New York University Langone Health’s Cryo-Electron Microscopy Laboratory (RRID:SCR_019202), by Joshua Mendez, Carolina Hernandez, Kashyap Maruthi, and Edward Eng at the Simons Electron Microscopy Center at the New York Structural Biology Center, and by Devrim Acehan and E. Carl Fluck at the Weill Cornell Medicine Cryo-EM Core Facility. Negative stain screening and confocal imaging was conducted at the Weill Cornell Medicine CLC Imaging Core Facility. The computational resources were provided by the Scientific Computing Unit at Weill Cornell Medicine. We gratefully acknowledge Roderick Mackinnon for the pEG BacMam-HCN1EM and PET32a-eGFP nanobody constructs.
The work presented here was sponsored in part by NIH GM124451 and NIH NS137561 to CN, NIH GM139164 to PL, NIH GM128420 to AA, NIH R42NS129370 to PG, NIH F32GM145091 to EK, and a Hartwell Foundation Postdoctoral Fellowship to EK. The New York University Langone Health Cryo-Electron Microscopy laboratory is partially supported by the Laura and Isaac Perlmutter Cancer Center Support Grant NIH NCI P30CA016087 and work at the Simons Electron Microscopy Center at the New York Structural Biology Center is supported by the Simons Foundation (SF349247). The content is solely the responsibility of the authors and does not necessarily represent the official views of the National Institutes of Health.
Footnotes
Competing interest declaration
GT and PG are co-inventors on patents related to the development of novel alkylphenols for the treatment of neuropathic pain. GT and PG serve on the Scientific Advisory Board for Akelos Inc. (New York, NY), a research-based biotechnology company that has a licensing agreement for the use of those patents.
Supplementary Information is available for this paper.
Reprints and permissions information is available at www.nature.com/reprints.
Data availability
A reporting summary for this article is available as a Supplementary Information file. The maps for HCN1 WT and M305L in nanodiscs in complex with propofol (accession codes: 42116, 44425) and without propofol (accession codes: 42117, 44426) have been deposited in the Electron Microscopy Data Bank (EMDB). Atomic coordinates for the HCN1 WT and M305L structures in nanodiscs with propofol (accession codes: 8UC7, 9BC6) and without propofol (accession codes: 8UC8, 9BC7) have been deposited in the Protein Data Bank (PDB). Figures 2–5, Extended Data Fig. 3–5, and Extended Data Fig. 7 have raw data associated with them. Raw electrophysiology and fluorescence traces are available from the corresponding authors upon request. The atomic coordinates of one replica of the free MD simulation of DOPC:POPE:POPS lipid-solvated HCN1 channel with propofol bound at sites 1 and 2 at t = 0 and 400 ns, and the topology and force field files of all system components including propofol are available at https://zenodo.org/doi/10.5281/zenodo.11528212.
References
- 1.Kaupp UB & Seifert R Molecular diversity of pacemaker ion channels. Annu Rev Physiol 63, 235–257 (2001). 10.1146/annurev.physiol.63.1.235 [DOI] [PubMed] [Google Scholar]
- 2.DiFrancesco D Pacemaker mechanisms in cardiac tissue. Annu Rev Physiol 55, 455–472 (1993). 10.1146/annurev.ph.55.030193.002323 [DOI] [PubMed] [Google Scholar]
- 3.Biel M, Wahl-Schott C, Michalakis S & Zong X Hyperpolarization-activated cation channels: from genes to function. Physiol Rev 89, 847–885 (2009). 10.1152/physrev.00029.2008 [DOI] [PubMed] [Google Scholar]
- 4.Tibbs GR et al. An anchor-tether ‘hindered’ HCN1 inhibitor is antihyperalgesic in a rat spared nerve injury neuropathic pain model. Br J Anaesth (2023). 10.1016/j.bja.2023.06.067 [DOI] [PMC free article] [PubMed] [Google Scholar]
- 5.Bleakley LE et al. Cation leak underlies neuronal excitability in an HCN1 developmental and epileptic encephalopathy. Brain 144, 2060–2073 (2021). 10.1093/brain/awab145 [DOI] [PMC free article] [PubMed] [Google Scholar]
- 6.Lyashchenko AK, Redd KJ, Yang J & Tibbs GR Propofol inhibits HCN1 pacemaker channels by selective association with the closed states of the membrane embedded channel core. J Physiol 583, 37–56 (2007). 10.1113/jphysiol.2007.136465 [DOI] [PMC free article] [PubMed] [Google Scholar]
- 7.Poduri A HCN1 Gain-Of-Function Mutations - A New Cause of Epileptic Encephalopathy. Epilepsy Curr 14, 348–349 (2014). 10.5698/1535-7597-14.6.348 [DOI] [PMC free article] [PubMed] [Google Scholar]
- 8.Marini C et al. HCN1 mutation spectrum: from neonatal epileptic encephalopathy to benign generalized epilepsy and beyond. Brain 141, 3160–3178 (2018). 10.1093/brain/awy263 [DOI] [PubMed] [Google Scholar]
- 9.Lee CH & MacKinnon R Structures of the Human HCN1 Hyperpolarization-Activated Channel. Cell 168, 111–120 e111 (2017). 10.1016/j.cell.2016.12.023 [DOI] [PMC free article] [PubMed] [Google Scholar]
- 10.Lee CH & MacKinnon R Voltage Sensor Movements during Hyperpolarization in the HCN Channel. Cell 179, 1582–1589 e1587 (2019). 10.1016/j.cell.2019.11.006 [DOI] [PMC free article] [PubMed] [Google Scholar]
- 11.Mannikko R, Elinder F & Larsson HP Voltage-sensing mechanism is conserved among ion channels gated by opposite voltages. Nature 419, 837–841 (2002). 10.1038/nature01038 [DOI] [PubMed] [Google Scholar]
- 12.Vemana S, Pandey S & Larsson HP S4 movement in a mammalian HCN channel. Journal of General Physiology 123, 21–32 (2004). 10.1085/jgp.200308916 [DOI] [PMC free article] [PubMed] [Google Scholar]
- 13.Wu X, Cunningham KP, Ramentol R, Perez ME & Larsson HP Similar voltage-sensor movement in spHCN channels can cause closing, opening, or inactivation. J Gen Physiol 155 (2023). 10.1085/jgp.202213170 [DOI] [PMC free article] [PubMed] [Google Scholar]
- 14.Mandala VS & MacKinnon R Voltage-sensor movements in the Eag Kv channel under an applied electric field. Proc Natl Acad Sci U S A 119, e2214151119 (2022). 10.1073/pnas.2214151119 [DOI] [PMC free article] [PubMed] [Google Scholar]
- 15.Whicher JR & MacKinnon R Structure of the voltage-gated K(+) channel Eag1 reveals an alternative voltage sensing mechanism. Science 353, 664–669 (2016). 10.1126/science.aaf8070 [DOI] [PMC free article] [PubMed] [Google Scholar]
- 16.Kim DM & Nimigean CM Voltage-Gated Potassium Channels: A Structural Examination of Selectivity and Gating. Cold Spring Harb Perspect Biol 8 (2016). 10.1101/cshperspect.a029231 [DOI] [PMC free article] [PubMed] [Google Scholar]
- 17.Dai G, Aman TK, DiMaio F & Zagotta WN The HCN channel voltage sensor undergoes a large downward motion during hyperpolarization. Nat Struct Mol Biol 26, 686–694 (2019). 10.1038/s41594-019-0259-1 [DOI] [PMC free article] [PubMed] [Google Scholar]
- 18.Wu X, Ramentol R, Perez ME, Noskov SY & Larsson HP A second S4 movement opens hyperpolarization-activated HCN channels. Proc Natl Acad Sci U S A 118 (2021). 10.1073/pnas.2102036118 [DOI] [PMC free article] [PubMed] [Google Scholar]
- 19.Lu Z, Klem AM & Ramu Y Coupling between voltage sensors and activation gate in voltage-gated K+ channels. J Gen Physiol 120, 663–676 (2002). 10.1085/jgp.20028696 [DOI] [PMC free article] [PubMed] [Google Scholar]
- 20.Long SB, Campbell EB & Mackinnon R Voltage sensor of Kv1.2: structural basis of electromechanical coupling. Science 309, 903–908 (2005). 10.1126/science.1116270 [DOI] [PubMed] [Google Scholar]
- 21.Lorinczi E et al. Voltage-dependent gating of KCNH potassium channels lacking a covalent link between voltage-sensing and pore domains. Nat Commun 6, 6672 (2015). 10.1038/ncomms7672 [DOI] [PMC free article] [PubMed] [Google Scholar]
- 22.Fernandez-Marino AI, Harpole TJ, Oelstrom K, Delemotte L & Chanda B Gating interaction maps reveal a noncanonical electromechanical coupling mode in the Shaker K(+) channel. Nat Struct Mol Biol 25, 320–326 (2018). 10.1038/s41594-018-0047-3 [DOI] [PMC free article] [PubMed] [Google Scholar]
- 23.de la Pena P, Dominguez P & Barros F Gating mechanism of Kv11.1 (hERG) K(+) channels without covalent connection between voltage sensor and pore domains. Pflugers Arch 470, 517–536 (2018). 10.1007/s00424-017-2093-9 [DOI] [PMC free article] [PubMed] [Google Scholar]
- 24.Flynn GE & Zagotta WN Insights into the molecular mechanism for hyperpolarization-dependent activation of HCN channels. Proc Natl Acad Sci U S A 115, E8086–E8095 (2018). 10.1073/pnas.1805596115 [DOI] [PMC free article] [PubMed] [Google Scholar]
- 25.Cowgill J & Chanda B Mapping Electromechanical Coupling Pathways in Voltage-Gated Ion Channels: Challenges and the Way Forward. J Mol Biol 433, 167104 (2021). 10.1016/j.jmb.2021.167104 [DOI] [PMC free article] [PubMed] [Google Scholar]
- 26.Rivolta I, Binda A, Masi A & DiFrancesco JC Cardiac and neuronal HCN channelopathies. Pflugers Arch 472, 931–951 (2020). 10.1007/s00424-020-02384-3 [DOI] [PubMed] [Google Scholar]
- 27.Butler KM, da Silva C, Alexander JJ, Hegde M & Escayg A Diagnostic Yield From 339 Epilepsy Patients Screened on a Clinical Gene Panel. Pediatr Neurol 77, 61–66 (2017). 10.1016/j.pediatrneurol.2017.09.003 [DOI] [PMC free article] [PubMed] [Google Scholar]
- 28.Bleakley LE & Reid CA HCN1 epilepsy: From genetics and mechanisms to precision therapies. J Neurochem (2023). 10.1111/jnc.15928 [DOI] [PubMed] [Google Scholar]
- 29.Thollon C et al. Use-dependent inhibition of hHCN4 by ivabradine and relationship with reduction in pacemaker activity. Br J Pharmacol 150, 37–46 (2007). 10.1038/sj.bjp.0706940 [DOI] [PMC free article] [PubMed] [Google Scholar]
- 30.Lu X, Smaill JB & Ding K New Promise and Opportunities for Allosteric Kinase Inhibitors. Angew Chem Int Ed Engl 59, 13764–13776 (2020). 10.1002/anie.201914525 [DOI] [PubMed] [Google Scholar]
- 31.Kim ED et al. Allosteric drug discrimination is coupled to mechanochemical changes in the kinesin-5 motor core. J Biol Chem 285, 18650–18661 (2010). 10.1074/jbc.M109.092072 [DOI] [PMC free article] [PubMed] [Google Scholar]
- 32.Zhu S et al. Structural and dynamic mechanisms of GABA(A) receptor modulators with opposing activities. Nat Commun 13, 4582 (2022). 10.1038/s41467-022-32212-4 [DOI] [PMC free article] [PubMed] [Google Scholar]
- 33.Ramirez D, Zuniga R, Concha G & Zuniga L HCN Channels: New Therapeutic Targets for Pain Treatment. Molecules 23 (2018). 10.3390/molecules23092094 [DOI] [PMC free article] [PubMed] [Google Scholar]
- 34.Cacheaux LP et al. Impairment of hyperpolarization-activated, cyclic nucleotide-gated channel function by the intravenous general anesthetic propofol. J Pharmacol Exp Ther 315, 517–525 (2005). 10.1124/jpet.105.091801 [DOI] [PubMed] [Google Scholar]
- 35.Saponaro A et al. Gating movements and ion permeation in HCN4 pacemaker channels. Mol Cell 81, 2929–2943 e2926 (2021). 10.1016/j.molcel.2021.05.033 [DOI] [PMC free article] [PubMed] [Google Scholar]
- 36.Tanguay J, Callahan KM & D’Avanzo N Characterization of drug binding within the HCN1 channel pore. Sci Rep 9, 465 (2019). 10.1038/s41598-018-37116-2 [DOI] [PMC free article] [PubMed] [Google Scholar]
- 37.Faulkner C, Santos-Carballal D, Plant DF & de Leeuw NH Atomistic Molecular Dynamics Simulations of Propofol and Fentanyl in Phosphatidylcholine Lipid Bilayers. ACS Omega 5, 14340–14353 (2020). 10.1021/acsomega.0c00813 [DOI] [PMC free article] [PubMed] [Google Scholar]
- 38.Joyce RL et al. Alkylphenol inverse agonists of HCN1 gating: H-bond propensity, ring saturation and adduct geometry differentially determine efficacy and potency. Biochem Pharmacol 163, 493–508 (2019). 10.1016/j.bcp.2019.02.013 [DOI] [PMC free article] [PubMed] [Google Scholar]
- 39.Shintre CP,ACW; Tessitore A; Shrestha L; Mukhopadhyay S; Huiskonen J; Carpenter EP Human hyperpolarization activated cyclic nucleotide gated ion channel 4 ( 10.5281/zenodo.1434068, 2018). [DOI] [Google Scholar]
- 40.Schmidpeter PAM et al. Anionic lipids unlock the gates of select ion channels in the pacemaker family. Nat Struct Mol Biol 29, 1092–1100 (2022). 10.1038/s41594-022-00851-2 [DOI] [PMC free article] [PubMed] [Google Scholar]
- 41.Hung A et al. Biophysical analysis of an HCN1 epilepsy variant suggests a critical role for S5 helix Met-305 in voltage sensor to pore domain coupling. Prog Biophys Mol Biol 166, 156–172 (2021). 10.1016/j.pbiomolbio.2021.07.005 [DOI] [PubMed] [Google Scholar]
- 42.Ludwig A, Zong X, Jeglitsch M, Hofmann F & Biel M A family of hyperpolarization-activated mammalian cation channels. Nature 393, 587–591 (1998). 10.1038/31255 [DOI] [PubMed] [Google Scholar]
- 43.Decher N, Chen J & Sanguinetti MC Voltage-dependent gating of hyperpolarization-activated, cyclic nucleotide-gated pacemaker channels: molecular coupling between the S4-S5 and C-linkers. J Biol Chem 279, 13859–13865 (2004). 10.1074/jbc.M313704200 [DOI] [PubMed] [Google Scholar]
- 44.Flynn GE & Zagotta WN Molecular mechanism underlying phosphatidylinositol 4,5-bisphosphate-induced inhibition of SpIH channels. J Biol Chem 286, 15535–15542 (2011). 10.1074/jbc.M110.214650 [DOI] [PMC free article] [PubMed] [Google Scholar]
- 45.Bruening-Wright A, Elinder F & Larsson HP Kinetic relationship between the voltage sensor and the activation gate in spHCN channels. J Gen Physiol 130, 71–81 (2007). 10.1085/jgp.200709769 [DOI] [PMC free article] [PubMed] [Google Scholar]
- 46.Ramentol R, Perez ME & Larsson HP Gating mechanism of hyperpolarization-activated HCN pacemaker channels. Nat Commun 11, 1419 (2020). 10.1038/s41467-020-15233-9 [DOI] [PMC free article] [PubMed] [Google Scholar]
- 47.Valley CC et al. The methionine-aromatic motif plays a unique role in stabilizing protein structure. J Biol Chem 287, 34979–34991 (2012). 10.1074/jbc.M112.374504 [DOI] [PMC free article] [PubMed] [Google Scholar]
- 48.Ryu S & Yellen G Charge movement in gating-locked HCN channels reveals weak coupling of voltage sensors and gate. J Gen Physiol 140, 469–479 (2012). 10.1085/jgp.201210850 [DOI] [PMC free article] [PubMed] [Google Scholar]
- 49.Porro A et al. Do the functional properties of HCN1 mutants correlate with the clinical features in epileptic patients? Prog Biophys Mol Biol 166, 147–155 (2021). 10.1016/j.pbiomolbio.2021.07.008 [DOI] [PubMed] [Google Scholar]
- 50.Boonsimma P et al. Exome sequencing as first-tier genetic testing in infantile-onset pharmacoresistant epilepsy: diagnostic yield and treatment impact. Eur J Hum Genet 31, 179–187 (2023). 10.1038/s41431-022-01202-x [DOI] [PMC free article] [PubMed] [Google Scholar]
- 51.Kim JJ et al. Shared structural mechanisms of general anaesthetics and benzodiazepines. Nature 585, 303–308 (2020). 10.1038/s41586-020-2654-5 [DOI] [PMC free article] [PubMed] [Google Scholar]
- 52.Zivanov J, Nakane T & Scheres SHW Estimation of high-order aberrations and anisotropic magnification from cryo-EM data sets in RELION-3.1. IUCrJ 7, 253–267 (2020). 10.1107/S2052252520000081 [DOI] [PMC free article] [PubMed] [Google Scholar]
- 53.Zivanov J et al. New tools for automated high-resolution cryo-EM structure determination in RELION-3. Elife 7 (2018). 10.7554/eLife.42166 [DOI] [PMC free article] [PubMed] [Google Scholar]
- 54.Kimanius D, Dong L, Sharov G, Nakane T & Scheres SHW New tools for automated cryo-EM single-particle analysis in RELION-4.0. Biochem J 478, 4169–4185 (2021). 10.1042/BCJ20210708 [DOI] [PMC free article] [PubMed] [Google Scholar]
- 55.Zheng SQ et al. MotionCor2: anisotropic correction of beam-induced motion for improved cryo-electron microscopy. Nat Methods 14, 331–332 (2017). 10.1038/nmeth.4193 [DOI] [PMC free article] [PubMed] [Google Scholar]
- 56.Wagner T et al. SPHIRE-crYOLO is a fast and accurate fully automated particle picker for cryo-EM. Commun Biol 2, 218 (2019). 10.1038/s42003-019-0437-z [DOI] [PMC free article] [PubMed] [Google Scholar]
- 57.Sanchez-Garcia R et al. DeepEMhancer: a deep learning solution for cryo-EM volume post-processing. Commun Biol 4, 874 (2021). 10.1038/s42003-021-02399-1 [DOI] [PMC free article] [PubMed] [Google Scholar]
- 58.Liebschner D et al. Macromolecular structure determination using X-rays, neutrons and electrons: recent developments in Phenix. Acta Crystallogr D Struct Biol 75, 861–877 (2019). 10.1107/S2059798319011471 [DOI] [PMC free article] [PubMed] [Google Scholar]
- 59.Emsley P, Lohkamp B, Scott WG & Cowtan K Features and development of Coot. Acta Crystallogr D Biol Crystallogr 66, 486–501 (2010). 10.1107/S0907444910007493 [DOI] [PMC free article] [PubMed] [Google Scholar]
- 60.Casanal A, Lohkamp B & Emsley P Current developments in Coot for macromolecular model building of Electron Cryo-microscopy and Crystallographic Data. Protein Sci 29, 1069–1078 (2020). 10.1002/pro.3791 [DOI] [PMC free article] [PubMed] [Google Scholar]
- 61.Croll TI ISOLDE: a physically realistic environment for model building into low-resolution electron-density maps. Acta Crystallogr D Struct Biol 74, 519–530 (2018). 10.1107/S2059798318002425 [DOI] [PMC free article] [PubMed] [Google Scholar]
- 62.Pettersen EF et al. UCSF ChimeraX: Structure visualization for researchers, educators, and developers. Protein Sci 30, 70–82 (2021). 10.1002/pro.3943 [DOI] [PMC free article] [PubMed] [Google Scholar]
- 63.Smart OS, Neduvelil JG, Wang X, Wallace BA & Sansom MS HOLE: a program for the analysis of the pore dimensions of ion channel structural models. J Mol Graph 14, 354–360, 376 (1996). 10.1016/s0263-7855(97)00009-x [DOI] [PubMed] [Google Scholar]
- 64.Schindelin J et al. Fiji: an open-source platform for biological-image analysis. Nat Methods 9, 676–682 (2012). 10.1038/nmeth.2019 [DOI] [PMC free article] [PubMed] [Google Scholar]
- 65.Liu Y et al. CB-Dock2: improved protein–ligand blind docking by integrating cavity detection, docking and homologous template fitting. Nucleic Acids Research 50, W159–W164 (2022). 10.1093/nar/gkac394 [DOI] [PMC free article] [PubMed] [Google Scholar]
- 66.Wang S, Xie J, Pei J & Lai L CavityPlus 2022 Update: An Integrated Platform for Comprehensive Protein Cavity Detection and Property Analyses with User-friendly Tools and Cavity Databases. J Mol Biol 435, 168141 (2023). 10.1016/j.jmb.2023.168141 [DOI] [PubMed] [Google Scholar]
- 67.Maglic JB & Lavendomme R MoloVol: an easy-to-use program for analyzing cavities, volumes and surface areas of chemical structures. J Appl Crystallogr 55, 1033–1044 (2022). 10.1107/S1600576722004988 [DOI] [PMC free article] [PubMed] [Google Scholar]
- 68.Laskowski RA & Swindells MB LigPlot+: multiple ligand-protein interaction diagrams for drug discovery. J Chem Inf Model 51, 2778–2786 (2011). 10.1021/ci200227u [DOI] [PubMed] [Google Scholar]
- 69.Jubb HC et al. Arpeggio: A Web Server for Calculating and Visualising Interatomic Interactions in Protein Structures. J Mol Biol 429, 365–371 (2017). 10.1016/j.jmb.2016.12.004 [DOI] [PMC free article] [PubMed] [Google Scholar]
- 70.Procter JB et al. Alignment of Biological Sequences with Jalview. Methods Mol Biol 2231, 203–224 (2021). 10.1007/978-1-0716-1036-7_13 [DOI] [PMC free article] [PubMed] [Google Scholar]
- 71.Webb B & Sali A Comparative Protein Structure Modeling Using MODELLER. Curr Protoc Bioinformatics 54, 5 6 1–5 6 37 (2016). 10.1002/cpbi.3 [DOI] [PMC free article] [PubMed] [Google Scholar]
- 72.Humphrey W, Dalke A & Schulten K VMD: visual molecular dynamics. J Mol Graph 14, 33–38, 27–38 (1996). 10.1016/0263-7855(96)00018-5 [DOI] [PubMed] [Google Scholar]
- 73.Wu EL et al. CHARMM-GUI Membrane Builder toward realistic biological membrane simulations. J Comput Chem 35, 1997–2004 (2014). 10.1002/jcc.23702 [DOI] [PMC free article] [PubMed] [Google Scholar]
- 74.Kasimova MA et al. Helix breaking transition in the S4 of HCN channel is critical for hyperpolarization-dependent gating. Elife 8 (2019). 10.7554/eLife.53400 [DOI] [PMC free article] [PubMed] [Google Scholar]
- 75.Elbahnsi A et al. Interplay between VSD, pore, and membrane lipids in electromechanical coupling in HCN channels. Elife 12 (2023). 10.7554/eLife.80303 [DOI] [PMC free article] [PubMed] [Google Scholar]
- 76.Best RB et al. Optimization of the additive CHARMM all-atom protein force field targeting improved sampling of the backbone phi, psi and side-chain chi(1) and chi(2) dihedral angles. J Chem Theory Comput 8, 3257–3273 (2012). 10.1021/ct300400x [DOI] [PMC free article] [PubMed] [Google Scholar]
- 77.Jorgensen WL, Chandrasekhar J, Madura JD, Impey RW & Klein ML Comparison of simple potential functions for simulating liquid water. The Journal of Chemical Physics 79, 926–935 (1983). 10.1063/1.445869 [DOI] [Google Scholar]
- 78.Arcario MJ, Mayne CG & Tajkhorshid E Atomistic models of general anesthetics for use in in silico biological studies. J Phys Chem B 118, 12075–12086 (2014). 10.1021/jp502716m [DOI] [PMC free article] [PubMed] [Google Scholar]
- 79.Olsson MH, Sondergaard CR, Rostkowski M & Jensen JH PROPKA3: Consistent Treatment of Internal and Surface Residues in Empirical pKa Predictions. J Chem Theory Comput 7, 525–537 (2011). 10.1021/ct100578z [DOI] [PubMed] [Google Scholar]
- 80.Abraham MJ et al. GROMACS: High performance molecular simulations through multi-level parallelism from laptops to supercomputers. SoftwareX 1–2, 19–25 (2015). 10.1016/j.softx.2015.06.001 [DOI] [Google Scholar]
- 81.Tribello GA, Bonomi M, Branduardi D, Camilloni C & Bussi G PLUMED 2: New feathers for an old bird. Computer Physics Communications 185, 604–613 (2014). 10.1016/j.cpc.2013.09.018 [DOI] [Google Scholar]
- 82.Darden TA, York DM & Pedersen LG Particle mesh Ewald: An N log(N) method for Ewald sums in large systems. Journal of Chemical Physics 98, 10089–10092 (1993). [Google Scholar]
- 83.Hess B, Bekker H, Berendsen HJC & Fraaije JGEM LINCS: A linear constraint solver for molecular simulations. Journal of Computational Chemistry 18 (1997). [Google Scholar]
Associated Data
This section collects any data citations, data availability statements, or supplementary materials included in this article.
Supplementary Materials
Data Availability Statement
A reporting summary for this article is available as a Supplementary Information file. The maps for HCN1 WT and M305L in nanodiscs in complex with propofol (accession codes: 42116, 44425) and without propofol (accession codes: 42117, 44426) have been deposited in the Electron Microscopy Data Bank (EMDB). Atomic coordinates for the HCN1 WT and M305L structures in nanodiscs with propofol (accession codes: 8UC7, 9BC6) and without propofol (accession codes: 8UC8, 9BC7) have been deposited in the Protein Data Bank (PDB). Figures 2–5, Extended Data Fig. 3–5, and Extended Data Fig. 7 have raw data associated with them. Raw electrophysiology and fluorescence traces are available from the corresponding authors upon request. The atomic coordinates of one replica of the free MD simulation of DOPC:POPE:POPS lipid-solvated HCN1 channel with propofol bound at sites 1 and 2 at t = 0 and 400 ns, and the topology and force field files of all system components including propofol are available at https://zenodo.org/doi/10.5281/zenodo.11528212.