

ABSTRACT
Background
The Asian Working Group for Cachexia (AWGC) proposed a new definition of cachexia; however, its impact on cachexia prevalence and overlaps with other conditions, such as sarcopenia and malnutrition, are unclear. We investigated these aspects and the prognostic value of cachexia based on the AWGC on mortality in older patients with heart failure (HF).
Methods
This study was a secondary analysis of a prospective multicentre cohort, namely, the FRAGILE‐HF cohort study. Older (≥ 65 years) patients who had been hospitalized due to decompensated HF were enrolled. We assessed the presence/absence of cachexia based on the AWGC and Evans' criteria. Sarcopenia and malnutrition based on the Asian Working Group for Sarcopenia 2014 and the Global Leadership Initiative on Malnutrition criteria were also assessed to compare their prevalence and the overlaps between them. Patients were stratified in relation to the presence/absence of cachexia based on the AWGC criteria, and their mortality rates were compared.
Results
Of the 861 enrolled patients (median [interquartile range] age, 80 years [73–85 years]; male, 58.9%), cachexia, as evaluated based on the AWGC and Evans' criteria, sarcopenia and malnutrition, was present in 74.1%, 36.2%, 20.6% and 55.2% of patients, respectively. AWGC‐defined cachexia was most common in the four conditions. All‐cause death events occurred in 153 (18.1%) patients in 2 years. AWGC‐defined cachexia (adjusted hazard ratio [aHRs], 1.442; 95% confidence interval [95% CI], 0.931–2.233; p = 0.101) was not associated with all‐cause mortality in older patients with HF after adjusting for other HF prognosis factors, such as the B‐type natriuretic peptide and the Meta‐Analysis Global Group in Chronic risk score, whereas cachexia evaluated based on Evans's criteria (aHRs, 1.547; 95% CI, 1.118–2.141; p = 0.009), sarcopenia (aHRs, 1.737; 95% CI, 1.214–2.485; p = 0.003), and malnutrition (aHRs, 1.581; 95% CI, 1.094–2.284; p = 0.015) was associated with all‐cause mortality.
Conclusions
Three‐quarters of older patients with HF had cachexia as evaluated by the AWGC criteria, and this was not associated with a worse prognosis. As the new AWGC cachexia criteria will result in a significantly larger proportion of patients being diagnosed with cachexia, the implementation of the criteria in clinical practice requires further consideration.
Trial Registration: UMIN‐CTR unique identifier: UMIN000023929
Keywords: Asia Working Group for Cachexia, cachexia, heart failure, malnutrition, prognosis, sarcopenia
Abbreviations
- ASMI
appendicular skeletal muscle mass
- AWGC
Asia Working Group for Cachexia
- BNP
B‐type natriuretic peptide
- MAGGIC risk score
Meta‐analysis Global Group in Chronic risk score
- MUST
Malnutrition Universal Screening Tool
1. Introduction
Older patients with heart failure (HF) are inclined to suffer from cachexia, as they are affected by inflammation, anorexia, fatigue, malnutrition and muscle wasting (sarcopenia) [1]. A group of scientists and clinicians met in Washington, DC, for the cachexia consensus conference in 2006, and Evans et al. suggested that ‘cachexia, is a complex metabolic syndrome associated with underlying illness and characterized by loss of muscle with or without loss of fat mass’ [2]. Further, the European Society of Clinical Nutrition and Metabolism (ESPEN) has proposed that cachexia is not merely severe malnutrition but chronic disease‐related malnutrition with inflammation [3]. These definitions, which have been scrutinized for their validity and reliability to assess cachexia, have since been investigated in patients with HF [4, 5, 6].
The Asia Working Group for Cachexia (AWGC) recently disclosed a new definition of cachexia for Asian patients with chronic disease [7]. However, the prevalence and prognostic value of cachexia defined by the AWGC criteria in older patients with HF remains to be investigated. In this study, we aimed to compare the prevalence of cachexia defined by the AWGC criteria and its overlaps with cachexia evaluated by conventional criteria (Evans' criteria) [2], sarcopenia and malnutrition. We also investigated the association of AWGC‐defined cachexia with mortality based on data detailing the prevalence, overlaps and prognostic implications of physical and social frailties and cognitive dysfunction in hospitalized elderly patients with HF (FRAGILE‐HF) cohort study.
2. Materials and Methods
2.1. Study Design and Patient Population
This study was a secondary analysis of the data from the FRAGILE‐HF cohort study, a prospective multicentre observational study conducted at 15 hospitals in Japan [8]. We included older patients (≥ 65 years) with HF who were first admitted due to HF decompensation between September 2016 and March 2018. The exclusion criteria were as follows: (1) a history of heart transplantation or left ventricular assist device implantation; (2) chronic peritoneal dialysis or haemodialysis; (3) acute myocarditis; (4) B‐type natriuretic peptide (BNP) levels < 100 pg/mL or N‐terminal proBNP levels < 300 pg/mL on admission; and (5) data were not available. This study was conducted in accordance with the tenets of the Declaration of Helsinki and was approved by the ethics committees of each participating hospital. Written informed consent was waived by each patient under the Ethical Guidelines for Medical and Health Research Involving Human Subjects per the Japanese Ministry of Health, Labour and Welfare, as this study was observational and did not require invasive procedures or interventions. The information (e.g., inclusion and exclusion criteria and participating institutions) about this study were disclosed on the University Hospital Information Network (UMIN‐CTR, unique identifier: UMIN000023929) before patient enrolment commenced.
2.2. Assessments of Cachexia, Sarcopenia and Malnutrition
Cachexia was evaluated using the AWGC criteria [7] and Evans' criteria. According to the AWGC criteria [7], cachexia is defined by (1) a low body mass index (BMI) (< 21 kg/m2) or weight loss exceeding 2% for 3 to 6 months and (2) one or more of the following conditions: low handgrip strength (< 28 kg for men and < 18 kg for women), a high C‐reactive protein level (CRP; > 0.5 mg/dL) and anorexia. As data collection for this registry was conducted before the AWGC cachexia criteria were published, weight loss was investigated based on the 1‐year change used in Evans' cachexia criteria [2, 6]. To ensure consistency with the AWGC criteria regarding the period and degree of weight loss, we also conducted sensitivity analyses using definitions of weight loss exceeding 4% and 5% over 1 year. Weight loss was assessed using the current weight evaluated by medical staff and medical history interviews. Patients were asked to report their weight 1 year prior when their HF condition was stable (i.e., not undergoing decompensated HF or during acute treatment). The presence of anorexia was evaluated using the questionnaire as follows: limited food intake (< 70% of usual food intake) or poor appetite.
The assessments of cachexia using Evans' criteria [6], sarcopenia [9] and malnutrition [10] were based on previous reports from the FRAGILE‐HF cohort study. Briefly, cachexia was evaluated using Evans' criteria [6] as (1) a low BMI (< 18.5 kg/m2) or weight loss over 5% for 1 year and (2) three or more of the following conditions: low handgrip strength (< 28 kg for men and < 18 kg for women), a low mid‐upper arm muscle circumference (< 10th tile stratified by age and sex, which is based on the Japanese Anthropometric Reference Data 2001 [11]), anorexia, fatigue and an abnormal biochemical profile (increased CRP > 5.0 mg/L, decreased haemoglobin [Hb] < 12 g/dL and/or low serum albumin < 3.2 g/dL).
Sarcopenia was assessed using a low appendicular skeletal muscle mass (ASMI) and low handgrip strength (< 26 kg for men and < 18 kg for women) or walking speed (4 m walking speed ≤ 0.8 m/s for both sexes) based on the criteria of the Asia Working Group for Sarcopenia 2014 [9, 12]. ASMI was measured using bioelectrical impedance analysis (bc‐622, Tanita, Tokyo, Japan), and low ASMI was defined as ≤ 7.0 kg/m2 for men and ≤ 5.7 kg/m2 for women. Malnutrition was determined based on the Global Leadership Initiative on Malnutrition criteria [13]. We used the Malnutrition Universal Screening Tool (MUST) [14] to screen the risk of malnutrition at the outset. Malnutrition was diagnosed in patients who met a MUST score ≥ 1 and had a low BMI (< 18.5 kg/m2 for age < 70 years and < 20 kg/m2 for age ≥ 70 years), low ASMI (≤ 7.0 kg/m2 for men and ≤ 5.7 kg/m2 for women) or decreased body mass (> 10%) for a year. All patients met the etiologic criteria because we included patients who had been hospitalized for HF decompensation.
2.3. Covariates
Prior to discharge from the hospital, all the haemodynamically stable patients were evaluated via a baseline physical examination, blood sampling and echocardiography, and medication was prescribed. To consider basic patient information, the severity of the HF and HF prognostic factors, we made the three models for adjusting covariates. Model 1 consisted of age and sex; and Model 2 was Model 1 + the log‐transformed BNP and estimated glomerular filtration rate (eGFR); lastly, Model 3 included Model 2 + the Meta‐Analysis Global Group in Chronic (MAGGIC) HF risk score because it is an established HF prognostic factor.
2.4. Outcomes
We prospectively collected data on the patients' prognoses within 2 years of discharge. The primary outcome was all‐cause death. We also investigated the mode of death (i.e., cardiovascular and non‐cardiovascular death). We followed the patients at the respective hospitals at least every 3 months after discharge. In cases where we could not follow patients because they did not visit the hospital or clinic, we obtained the prognostic data from other medical facilities via telephone interviews to determine the clinical course of the patients.
2.5. Statistical Analysis
To investigate the overlaps between cachexia, sarcopenia, and malnutrition, an upset plot was drawn to evaluate their intersection size. We used the ‘UpSetR’ package, Version 1.4.0 (https://CRAN.R‐project.org/package=UpSetR), in R. The patients were divided into two groups based on the presence/absence of each condition, such as cachexia, sarcopenia and malnutrition, and their clinical characteristics were compared using the Mann–Whitney U test for continuous variables and the chi‐squared test for categorical variables. The continuous and categorical data were expressed as medians (interquartile range [IQR]) and frequency (%), respectively.
Cox regression analysis adjusted for covariates (Model 1: age and sex, Model 2: Model 1 + log‐transformed BNP and eGFR, and Model 3: Model 2 + the MAGGIC risk score) was used to calculate the hazard ratios (HRs) and 95% confidence intervals (CIs) to compare the mortality risk among the patients with cachexia determined using the AWGC and Evans' criteria, sarcopenia and malnutrition. We investigated the association between the overlap of each condition and mortality in the same analysis. Kaplan‐Meier survival curves and the log‐rank test were also used to investigate the significance of all‐cause mortality, comparing the prognosis of the number of overlaps of each condition. We used multiple imputations using the ‘mice’ package, Version 3.14.0, in R to complement the missing values and generated 20 datasets. All the analyses were conducted using R Studio statistical software (R Foundation for Statistical Computing, Vienna, Austria) Version 4.2.0. p < 0.05 were considered statistically significant.
3. Results
The FRAGILE‐HF study prospectively enrolled 1332 hospitalized patients aged ≥ 65 years during the study period. In our study, we excluded 471 patients who were not evaluated for at least one condition due to missing diagnostic data. Finally, 861 patients were included in the analysis (Figure S1). The prevalence of cachexia evaluated by the AWGC and Evans' criteria, sarcopenia and malnutrition was 638 (74.1%), 312 (36.2%), 177 (20.6%) and 475 (55.2%), respectively (Figure 1). The prevalence of cachexia as defined by the AWGC criteria was higher than that of malnutrition; it was also twice the conventional incidence of cachexia determined by Evans' criteria. Figure 2 shows the overlaps between the four conditions. Eighty‐nine patients (10.3%) met the criteria for all four conditions, and 175 patients (20.3%) had no status. When comparing cachexia and the other conditions (i.e., sarcopenia and malnutrition), despite malnutrition being one of the most general conditions in cachexia, 32.4% of the cachexia patients assessed using the AWGC were not malnourished. Further, 28.2% of the AWGC cachexia cases existed independently without the coexistence of sarcopenia and malnutrition. In contrast, almost all patients diagnosed with cachexia according to Evan's criteria were also diagnosed with cachexia according to the AWGC criteria, and, in 223 patients who had no AWGC‐defined cachexia, the prevalence of patients with Evans's cachexia (4 patients [1.8%]), sarcopenia (5 patients [2.2%]) and malnutrition (44 patients [19.7%]) was low.
FIGURE 1.
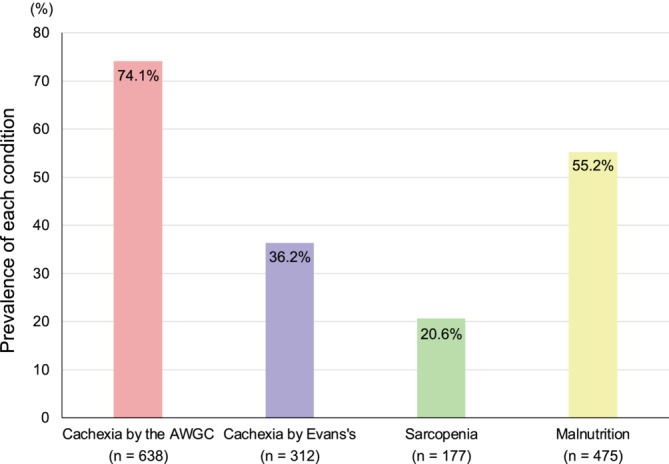
Prevalence of cachexia evaluated by the AWGC and Evans's criteria, sarcopenia and malnutrition in older patients with HF. AWGC, Asia Working Group for Cachexia.
FIGURE 2.
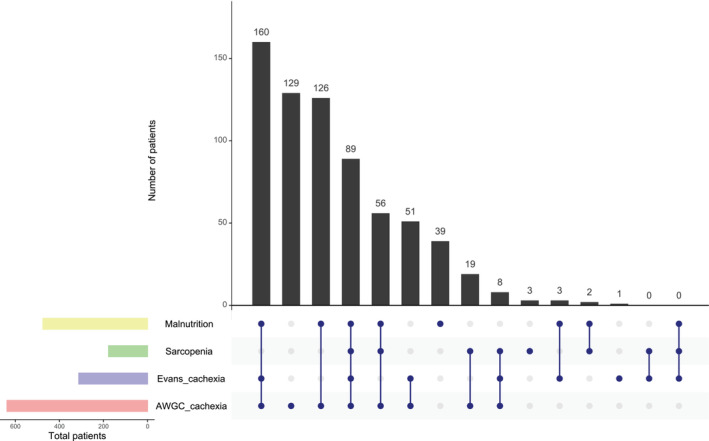
Upset plot detailing the overlap among cachexia based on AWGC and Evans's criteria, sarcopenia and malnutrition in 861 older patients with HF. AWGC, Asia Working Group for Cachexia.
Table 1 and Table S1 show the characteristics of the patients for the four conditions. The patients in the AWGC cachexia group were older and had lower weight, BMI and mid‐upper arm and calf circumferences than those without cachexia as defined by the AWGC. Further, in the AWGC cachexia group, 127 all‐cause events occurred, and a higher event rate was present than in the AWGC non‐cachexia group; however, AWGC‐defined cachexia had no statistically significant association with cardiovascular death (p = 0.369). Cachexia by Evans' criteria, sarcopenia and malnutrition were associated with high all‐cause, cardiovascular and non‐cardiovascular deaths.
TABLE 1.
Patient's characteristic.
| Missing data, n (%) | Overall | Cachexia by the AWGC | Cachexia by the Evans's | Sarcopenia | Malnutrition | |||||||||
|---|---|---|---|---|---|---|---|---|---|---|---|---|---|---|
| No | Yes | No | Yes | No | Yes | No | Yes | |||||||
| n = 861 | n = 223 | n = 638 | p | n = 549 | n = 312 | p | n = 684 | n = 177 | p | n = 386 | n = 475 | p | ||
| Age [years] | 0 | 80 [73–85] | 76 [71–82] | 81 [74–86] | < 0.001 | 79 [72–85] | 81 [75–86] | 0.014 | 79 [73–85] | 82 [77–87] | < 0.001 | 78 [72–84] | 81 [74–86] | < 0.001 |
| Male, n (%) | 0 | 507 (58.9) | 132 (59.2) | 375 (58.8) | 0.914 | 333 (60.7) | 174 (55.8) | 0.161 | 382 (55.8) | 125 (70.6) | < 0.001 | 235 (60.9) | 272 (57.3) | 0.283 |
| BMI [kg/m2] | 0 | 20.8 [18.7–23.5] | 23.2 [21.5–25.3] | 20.0 [18.1–22.3] | < 0.001 | 21.7 [19.7–24.4] | 19.2 [17.4–21.4] | < 0.001 | 21.5 [19.4–24.1] | 18.4 [16.8–20.0] | < 0.001 | 23.1 [21.4–25.5] | 19.0 [17.5–20.4] | < 0.001 |
| Weight at baseline [kg] | 0 | 52.6 [44.8–59.7] | 58.2 [52.6–64.7] | 50.2 [42.2–57.0] | < 0.001 | 55.0 [47.9–61.8] | 47.4 [39.7–54.7] | < 0.001 | 54.5 [46.3–61.5] | 46.5 [41.2–52.4] | < 0.001 | 58.1 [52.6–64.1] | 46.6 [40.3–53.6] | < 0.001 |
| Weight at 1 year prior [kg] | 67 (7.8) | 58.0 [50.0–65.0] | 60.0 [53.8–67.0] | 56.0 [48.0–65.0] | < 0.001 | 59.5 [52.0–65.0] | 55.0 [46.9–64.0] | < 0.001 | 60.0 [51.0–66.8] | 52.0 [46.0–58.0] | < 0.001 | 60.0 [55.0–66.9] | 54.0 [45.0–64.0] | < 0.001 |
| Weight loss rate over 1 year [%] | 67 (7.8) | −6.6 [−11.6− −2.6] | −1.5 [−6.0–0.6] | −8.1 [−13.0− −4.3] | < 0.001 | −4.2 [−8.2− −1.2] | −10.8 [−15.1− −6.9] | < 0.001 | −6.1 [−10.8− −2.0] | −8.3 [−14.6− −4.3] | < 0.001 | −4.1 [−6.7− −1.0] | −11.4 [−15.1− −5.9] | < 0.001 |
| LVEF [%] | 7 (0.8) | 44.8 [32.0–59.6] | 43.0 [30.3–58.0] | 45.0 [32.0–60.0] | 0.204 | 44.5 [32.0–59.0] | 44.9 [31.0–60.0] | 0.940 | 45.0 [32.1–59.0] | 42.5 [30.0–62.0] | 0.340 | 45.8 [34.0–60.0] | 43.0 [30.0–58.9] | 0.058 |
| Heart failure phenotypes, n (%) | 7 (0.8) | 0.200 | 0.802 | 0.325 | 0.304 | |||||||||
| HFrEF (LVEF < 50%) | 506 (59.3) | 139 (62.9) | 367 (58.0) | 320 (58.9) | 186 (59.8) | 396 (58.4) | 110 (62.5) | 219 (57.3) | 287 (60.8) | |||||
| HFpEF (LVEF ≥ 50%) | 348 (40.7) | 82 (37.1) | 266 (42.0) | 223 (41.1) | 125 (40.2) | 282 (41.6) | 66 (37.5) | 163 (42.7) | 185 (39.2) | |||||
| Laboratory data at discharge | ||||||||||||||
| CRP [mg/dL] | 11 (1.3) | 0.24 [0.10–0.72] | 0.17 [0.07–0.33] | 0.30 [0.11–0.85] | < 0.001 | 0.23 [0.09–0.69] | 0.28 [0.11–0.81] | 0.053 | 0.22 [0.99–0.69] | 0.32 [0.14–0.89] | 0.013 | 0.24 [0.10–0.77] | 0.24 [0.10–0.69] | 0.798 |
| eGFR [mL/min/1.73m2] | 1 (0.1) | 54.7 [37.2–71.5] | 54.3 [37.4–69.9] | 54.7 [37.0–71.8] | 0.590 | 56.0 [38.3–70.6] | 51.9 [35.7–73.0] | 0.465 | 54.1 [36.6–71.1] | 55.6 [40.9–71.6] | 0.435 | 53.9 [35.9–70.3] | 55.2 [39.4–71.7] | 0.479 |
| BNP [pg/mL] | 107 (12.4) | 261.9 [128.4–479.9] | 216.1 [101.6–399.1] | 285.5 [145.1–502.6] | 0.003 | 237.0 [115.6–435.8] | 308.9 [166.4–560.4] | < 0.001 | 254.8 [121.2–464.4] | 287.6 [161.8–505.1] | 0.033 | 231.0 [109.1–431.8] | 286.5 [152.1–503.9] | 0.008 |
| Albumin [g/dL] | 20 (2.3) | 3.5 [3.2–3.8] | 3.7 [3.4–4.0] | 3.4 [3.2–3.7] | < 0.001 | 3.6 [3.3–3.9] | 3.3 [3.1–3.6] | < 0.001 | 3.5 [3.2–3.8] | 3.4 [3.1–3.7] | 0.005 | 3.6 [3.3–3.9] | 3.4 [3.1–3.7] | < 0.001 |
| Haemoglobin [g/dL] | 1 (0.1) | 11.8 [10.4–13.3] | 12.0 [10.5–13.9] | 11.7 [10.4–13.0] | 0.015 | 12.1 [10.6–13.8] | 11.4 [10.2–12.6] | < 0.001 | 11.8 [10.4–13.3] | 11.9 [10.4–13.1] | 0.806 | 12.0 [10.5–13.7] | 11.7 [10.4–12.9] | 0.016 |
| Anorexia, n (%) | 10 (1.2) | 373 (43.8) | 38 (17.0) | 335 (53.3) | < 0.001 | 157 (29.0) | 216 (69.9) | < 0.001 | 287 (42.4) | 86 (49.4) | 0.095 | 142 (36.8) | 231 (49.7) | < 0.001 |
| Calf circumference [cm] | 11 (1.3) | 30.7 [28.3–33.0] | 32.6 [30.9–34.7] | 30.0 [27.5–32.5] | < 0.001 | 31.4 [29.2–33.8] | 29.2 [26.5–31.6] | < 0.001 | 31.4 [29.1–33.8] | 28.2 [26.0–29.9] | < 0.001 | 32.5 [30.3–34.8] | 29.2 [26.6–31.4] | < 0.001 |
| Low mid upper arm muscle circumference, n (%) | 23 (2.7) | 126 (15.0) | 18 (8.4) | 108 (17.3) | 0.002 | 40 (7.5) | 86 (28.2) | < 0.001 | 93 (14.0) | 33 (19.0) | 0.103 | 29 (7.8) | 97 (20.9) | < 0.001 |
| Low appendicular skeletal muscle index, n (%) | 54 (6.3) | 222 (27.5) | 18 (9.5) | 204 (33.0) | < 0.001 | 116 (22.9) | 106 (35.2) | < 0.001 | 45 (7.1) | 177 (100) | < 0.001 | 42 (11.8) | 180 (39.8) | <0.001 |
| Frailty, n (%) | 28 (3.3) | 448 (53.8) | 49 (22.5) | 399 (64.9) | < 0.001 | 210 (39.8) | 238 (78.0) | < 0.001 | 325 (49.0) | 123 (72.4) | < 0.001 | 157 (41.6) | 291 (63.8) | < 0.001 |
| MAGGIC risk score [point] | 11 (1.3) | 26.0 [22.0–29.0] | 24.0 [20.0–28.0] | 26.0 [22.0–30.0] | < 0.001 | 25.0 [21.0–29.0] | 27.0 [23.0–30.0] | < 0.001 | 25.0 [21.0–29.0] | 27.0 [24.0–31.0] | < 0.001 | 24.0 [20.0–28.0] | 27.0 [23.0–30.0] | < 0.001 |
| All‐cause mortality, n (%) | 14 (1.6) | 153 (18.1) | 26 (11.8) | 127 (20.3) | 0.005 | 79 (14.5) | 74 (24.4) | < 0.001 | 101 (15.1) | 52 (29.5) | < 0.001 | 46 (12.0) | 107 (23.1) | < 0.001 |
| Cardiovascular mortality, n (%) | 14 (1.6) | 82 (9.7) | 18 (8.1) | 64 (10.2) | 0.369 | 41 (7.5) | 41 (13.5) | 0.005 | 55 (8.2) | 27 (15.3) | 0.004 | 23 (6.0) | 59 (12.7) | < 0.001 |
| Non‐cardiovascular mortality, n (%) | 14 (1.6) | 71 (8.4) | 8 (3.6) | 63 (10.1) | 0.003 | 38 (7.0) | 33 (10.9) | 0.049 | 46 (6.9) | 25 (14.2) | 0.002 | 23 (6.0) | 48 (10.4) | 0.022 |
Note: Median [interquartile range]; n (%). Low mid upper arm muscle circumference, < 10th tile stratified by age and sex, which is based on the Japanese Anthropometric Reference Data 2001. Low appendicular skeletal muscle index, ≤ 7.0 kg/m2 for men and ≤ 5.7 kg/m2 for women.
Abbreviations: BMI, body mass index; BNP, B‐type natriuretic peptide; CRP, C‐reactive protein; eGFR, estimated glomerular filtration rate; HFpEF, heart failure with preserved ejection fraction; HFrEF, heart failure with reduced ejection fraction; LVEF, left ventricular ejection fraction; MAGGIC, Meta‐analysis Global Group in Chronic Heart Failure.
The Cox regression analyses adjusted for Model 1 and 2 for all‐cause death showed that cachexia based on the AWGC criteria (adjusted for Model 1, HR, 1.657; 95% CI, 1.076–2.551; p = 0.022, and Model 2, HR, 1.610; 95% CI, 1.043–2.485; p = 0.032) was associated with all‐cause mortality, but after adjusting for other HF prognostic factors (Model 3), it was not related to all‐cause deaths (HR, 1.442; 95% CI, 0.931–2.233; p = 0.101). On the other hand, cachexia evaluated by Evans' criteria (HR, 1.547; 95% CI, 1.118–2.141; p = 0.009), sarcopenia (HR, 1.737; 95% CI, 1.214–2.485; p = 0.003) and malnutrition (HR, 1.581; 95% CI, 1.094–2.284; p = 0.015) were associated with high all‐cause mortality rates (Table 2).
TABLE 2.
Adjusted hazard ratios of cachexia, sarcopenia and malnutrition for all‐cause mortality.
| Incident rates (per 100 person‐years) | 95% CI | Model 1 | Model 2 | Model 3 | ||||||||
|---|---|---|---|---|---|---|---|---|---|---|---|---|
| Adjusted HR | 95% CI | p | Adjusted HR | 95% CI | p | Adjusted HR | 95% CI | p | ||||
| Cachexia by AWGC criteria | No | 6.5 | 4.3–9.6 | 1.000 | [Reference] | [Reference] | [Reference] | |||||
| Yes | 12.3 | 10.3–14.7 | 1.657 | 1.076–2.551 | 0.022 | 1.610 | 1.043–2.485 | 0.032 | 1.442 | 0.931–2.233 | 0.101 | |
| Cachexia by Evans's criteria | No | 8.4 | 6.6–10.4 | 1.000 | [Reference] | [Reference] | [Reference] | |||||
| Yes | 15.3 | 12.0–19.2 | 1.794 | 1.302–2.471 | < 0.001 | 1.699 | 1.230–2.347 | 0.001 | 1.547 | 1.118–2.141 | 0.009 | |
| Sarcopenia | No | 8.7 | 7.1–10.6 | 1.000 | [Reference] | [Reference] | [Reference] | |||||
| Yes | 19.6 | 14.6–25.7 | 1.951 | 1.378–2.761 | < 0.001 | 1.913 | 1.341–2.730 | < 0.001 | 1.737 | 1.214–2.485 | 0.003 | |
| Malnutrition | No | 6.7 | 4.9–9.0 | 1.000 | [Reference] | [Reference] | [Reference] | |||||
| Yes | 14.4 | 11.8–17.4 | 2.024 | 1.426–2.874 | < 0.001 | 2.000 | 1.407–2.851 | < 0.001 | 1.581 | 1.094–2.284 | 0.015 | |
Note: Model 1: age and sex. Model 2: Model 1 + log‐transformed B‐type natriuretic peptide and estimate glomerular filtration rate. Model 3: Model 2 + the Meta‐Analysis Global Group in Chronic Heart Failure score.
Abbreviations: AWGC, Asian Working Group for Cachexia; CI, confidence interval; HR, hazard ratio.
For the sensitivity analysis, we modified the AWGC criteria to a low BMI of < 21 kg/m2, or 4% or 5% weight loss over a year. The prevalence of cachexia evaluated by the modified AWGC for the 4% [604 patients (70.2%)] and 5% versions [576 patients (66.9%)] was lower than that of the original AWGC cachexia; however, both the 4% (HR, 1.480; 95% CI, 0.977–2.242; p = 0.064) and 5% versions (HR, 1.459; 95% CI, 0.980–2.173; p = 0.063) were still not associated with all‐cause death after adjusting for covariates (Model 3).
Figure S2 and Table S2 illustrate the association of the overlaps of cachexia, sarcopenia and malnutrition with all‐cause death. The coexistence of several conditions, such as AWGC‐defined cachexia combined with sarcopenia and malnutrition, was associated with higher mortality in older patients with HF (p for trend < 0.001).
4. Discussion
This is the first study on the prevalence and overlaps of cachexia assessed by the AWGC criteria and other conditions, such as sarcopenia and malnutrition, in older patients with HF. The main findings were (1) 74.1% of patients had cachexia as defined by the AWGC criteria, which had the highest prevalence compared to the other conditions (i.e., cachexia by Evans criteria, sarcopenia and malnutrition), and (2) cachexia defined by the AWGC was not associated with mortality after adjusting for HF severity, whereas Evans' cachexia, sarcopenia and malnutrition had high mortality rates.
The prevalence of cachexia evaluated by the AWGC in this study was 74.1%; however, it is very high compared to the conventional prevalence of cachexia in patients with chronic diseases including HF (7%–46%) [15]. Previous studies in patients with chronic wasting disease (e.g., advanced cancer and end‐stage chronic kidney disease) have shown that 35%–83% of patients had AWGC‐defined cachexia [16, 17, 18, 19]. Although a previous cross‐sectional study on patients with HF who participated in outpatient cardiac rehabilitation has demonstrated that 30% of patients were AWGC‐defined cachexia, differences in the prevalence of AWGC‐defined cachexia between ours and the previous study may represent a difference in the population and AWGC‐defined cachexia at an earlier study may be underestimated because they did not have the CRP data [20]. The main conditions considered to coexist with cachexia are severe malnutrition and decreased muscle mass; however, in this study, the prevalence of cachexia as defined by the AWGC (74.1%) was higher than that of malnutrition (55.2%), and malnutrition and sarcopenia did not overlap with 32.4% and 73.0% of the patients in the AWGC cachexia group, respectively. In addition, the nutritional status (e.g., BMI, arm and calf circumference and the prevalence of low ASMI) of the patients with AWGC‐defined cachexia was better than that of the patients with cachexia based on Evans' criteria, malnutrition or sarcopenia, and AWGC‐defined cachexia was not associated with all‐cause mortality. These facts suggest that the new AWGC diagnostic criteria may lead to a diagnosis of cachexia in patients who do not conform to the previously consensus concept of cachexia [2, 3].
One possible reason that cachexia defined by the AWGC had a high prevalence and was not associated with mortality is that the weight criterion is too high for older patients with HF. The new definition of cachexia of the AWGC was made with consideration of the differences in body mass between Asian and Western populations because Asians have a lower BMI and a differential contribution of BMI to chronic diseases compared to Caucasians [7]. Yet, the criterion of a BMI < 21 kg/m2 in the AWGC definition is higher than those of Evans [2] and Fearon's criteria [21], which are often used for Western populations. The mean and median BMI of patients with cachexia in the review of the AWGC have been concluded to be around 21–22 kg/m2 (it is unclear whether the mean and median BMI were only for the cachexia group) and the low BMI (< 21 kg/m2) in the AWGC definition was decided based on those results [7]; however, it has simultaneously been demonstrated that the mean BMI of most intervention studies in older patients with cachexia is < 20 kg/m2 [7]. Konishi et al. reported that one‐third of Japanese patients with HF had a BMI < 20.3 kg/m2 [15]. Based on the results of a multicentre study designed to evaluate the recent trends in the clinical characteristics of Japanese patients with HF, the median BMI was reported to be 20.9 kg/m2 (IQR: 18.5–23.6 kg/m2) [22]. In a study of the East Asian populations, a BMI ≤ 20 kg/m2 was associated with a higher occurrence of cancer and cardiovascular events compared to those in the 22.6–25.0 kg/m2 [23]. Based on these considerations, it is possible that a BMI < 21 kg/m2 to diagnose cachexia in the AWGC criteria is excessively high for older adults with HF.
Our research team has previously reported that cachexia evaluated based on Evans' criteria was prevalent in 35.5% of older patients with HF [6]; however, we used a BMI of < 18.5 kg/m2 and weight loss of > 5% per year as the weight criteria given the differences between Asian and Western populations. Furthermore, we demonstrated that cachexia, as evaluated using Evan's criteria, was associated with increased mortality in older patients with HF [6]. However, mild weight loss of 2.0%–5.0% in patients with HF has been reported not to be related to adverse events [24, 25]. It may be more important to assess the nature of weight loss, such as skeletal muscle mass, and lean body mass, rather than evaluating the weight loss rate. The prevalence of cachexia in Japanese patients with HF varies widely due to differences in cachexia assessment; however, cachexia has been found to range from 9% to 33% [15], and it is possible that the AWGC criteria have highlighted other conditions, such as frailty or the very early stage of cachexia (pre‐cachexia), as being highly prevalent. Given that AWGC‐defined cachexia combined with sarcopenia and malnutrition were associated with increased mortality in this study, a more detailed assessment of muscle weakness and body compositions, such as skeletal muscle mass and lean body mass index, may be more important for cachexia assessment of patients with HF.
5. Limitations
We acknowledged several limitations of this study. First, this study included only older Japanese adults with HF. Cachexia evaluated based on the AWGC criteria may therefore be helpful for other populations, such as those with cancer, and further investigations are needed to determine whether AWGC‐defined cachexia can be applied to them. Second, although we have used the bioelectrical impedance analysis for assessing ASMI in sarcopenia assessments, we could not rule out the effects of the bodily fluids, such as oedema. Finally, many patients who could not be evaluated for cachexia, sarcopenia or malnutrition were excluded, such as patients with missing values for assessments or with cardiovascular implantable electronic devices, because they could not use the bioelectrical impedance device.
6. Conclusion
In our study, three‐quarters of the older patients with HF were found to have AWGC‐defined cachexia, which had a higher prevalence than Evans' cachexia, sarcopenia and malnutrition. In addition, cachexia defined by the AWGC was not associated with all‐cause death in older adults with HF. As the new AWGC cachexia criteria will result in a significantly larger proportion of patients being diagnosed with cachexia, the implementation of the criteria in clinical practice requires further consideration.
Author Contributions
Takumi Noda, Emi Maekawa and Kentaro Kamiya contributed to conceptualization, data curation, formal analysis, investigation, methodology, project administration, resources, software and writing the original draft. Emi Maekawa and Kentaro Kamiya contributed to funding acquisition and supervision. All authors revised the manuscript, gave final approval and agreed to be accountable for all aspects of the work, ensuring integrity and accuracy.
Ethics Statement
The study protocol was conducted in accordance with the tenets of the Declaration of Helsinki and was approved by the ethics committee of each participating hospital. Because this was an observational study that did not entail invasive procedures or interventions, written informed consent was not required under the Ethical Guidelines for Medical and Health Research Involving Human Subjects, per the Japanese Ministry of Health, Labour and Welfare. All participants were free to withdraw from the study at any time, and study information, including study objectives, inclusion and exclusion criteria and names of participating institutions, was posted on the University Hospital Information Network (UMIN‐CTR, unique identifier: UMIN000023929) prior to patient enrolment.
Conflicts of Interest
Dr Kentaro Kamiya received funding from Eiken Chemical Co. Ltd. Dr Yuya Matsue is affiliated with a department endowed by Philips Respironics, ResMed, Teijin Home Healthcare and Fukuda Denshi, and received an honorarium from Novartis Japan, Bayer Japan and Otsuka Pharmaceutical Co. Dr Nobuyuki Kagiyama is affiliated with a department funded by Philips Healthcare, Asahi KASEI Corporation, Inter Reha Co. Ltd and Toho Holdings Co. Ltd. based on collaborative research agreements. Dr Takatoshi Kasai is affiliated with a department endowed by Philips Respironics, ResMed, Teijin Home Healthcare and Fukuda Denshi. The other authors declare no conflicts of interest.
Supporting information
Figure S1. Patient flow chart.
Figure S2. Kaplan–Meier survival curves of overall survival rate in patients divided into five groups based on the number of overlaps of cachexia evaluated by AWGC and Evans’ criteria, sarcopenia, and malnutrition.AWGC, Asia Working Group for Cachexia.
Table S1. Patient characteristics.
Table S2. Cox regression analyses of the association of the coexistence of multiple diagnoses for the all‐cause death.
Funding: This study was partially supported by Novartis Pharma Research Grants, a Japan Heart Foundation Research Grant, EN Otsuka Pharmaceutical Co. Ltd. and the Japan Society for the Promotion of Science (JSPS) KAKENHI (grant numbers 21H03309 and 19K11424). The sponsors had no role in the study design, methods, patient recruitment, data collection, analysis or article preparation.
Contributor Information
Yuya Matsue, Email: yuya8950@gmail.com.
Kentaro Kamiya, Email: k-kamiya@kitasato-u.ac.jp.
Data Availability Statement
Data described in the manuscript, code book and analytic code will be made available upon request pending application and approval.
References
- 1. Bielecka‐Dabrowa A., Ebner N., Dos Santos M. R., Ishida J., Hasenfuss G., and von Haehling S., “Cachexia, Muscle Wasting, and Frailty in Cardiovascular Disease,” European Journal of Heart Failure 22 (2020): 2314–2326. [DOI] [PubMed] [Google Scholar]
- 2. Evans W. J., Morley J. E., Argilés J., et al., “Cachexia: A New Definition,” Clinical Nutrition 27 (2008): 793–799. [DOI] [PubMed] [Google Scholar]
- 3. Cederholm T., Barazzoni R., Austin P., et al., “ESPEN Guidelines on Definitions and Terminology of Clinical Nutrition,” Clinical Nutrition 36 (2017): 49–64. [DOI] [PubMed] [Google Scholar]
- 4. Morishita T., Uzui H., Sato Y., Mitsuke Y., and Tada H., “Associations Between Cachexia and Metalloproteinases, Haemodynamics and Mortality in Heart Failure,” European Journal of Clinical Investigation 51 (2021): e13426. [DOI] [PubMed] [Google Scholar]
- 5. Hweidi I. M., Al‐Omari A. K., Rababa M. J., Al‐Obeisat S. M., and Hayajneh A. A., “Cardiac Cachexia Among Patients With Chronic Heart Failure: A Systematic Review,” Nursing Forum 56 (2021): 916–924. [DOI] [PubMed] [Google Scholar]
- 6. Maekawa E., Noda T., Maeda D., et al., “Prognostic Impact of Cachexia by Multi‐assessment in Older Adults With Heart Failure: FRAGILE‐HF Cohort Study,” Journal of Cachexia, Sarcopenia and Muscle 14 (2023): 2143–2151. [DOI] [PMC free article] [PubMed] [Google Scholar]
- 7. Arai H., Maeda K., Wakabayashi H., et al., “Diagnosis and Outcomes of Cachexia in Asia: Working Consensus Report From the Asian Working Group for Cachexia,” Journal of Cachexia, Sarcopenia and Muscle 14 (2023): 1949–1958. [DOI] [PMC free article] [PubMed] [Google Scholar]
- 8. Matsue Y., Kamiya K., Saito H., et al., “Prevalence and Prognostic Impact of the Coexistence of Multiple Frailty Domains in Elderly Patients With Heart Failure: The FRAGILE‐HF Cohort Study,” European Journal of Heart Failure 22 (2020): 2112–2119. [DOI] [PubMed] [Google Scholar]
- 9. Konishi M., Kagiyama N., Kamiya K., et al., “Impact of Sarcopenia on Prognosis in Patients With Heart Failure With Reduced and Preserved Ejection Fraction,” European Journal of Preventive Cardiology 28 (2020): 1022–1029. [DOI] [PubMed] [Google Scholar]
- 10. Hirose S., Matsue Y., Kamiya K., et al., “Prevalence and Prognostic Implications of Malnutrition as Defined by GLIM Criteria in Elderly Patients With Heart Failure,” Clinical Nutrition 40 (2021): 4334–4340. [DOI] [PubMed] [Google Scholar]
- 11. Hosoya N., Okada T., Muto Y., et al., “Japanese Anthropometric Reference Data 2001 (JARD 2001),” Japanese Journal of Nutritional Assessment 19 (2002): 1–81. [Google Scholar]
- 12. Chen L. K., Liu L. K., Woo J., et al., “Sarcopenia in Asia: Consensus Report of the Asian Working Group for Sarcopenia,” Journal of the American Medical Directors Association 15 (2014): 95–101. [DOI] [PubMed] [Google Scholar]
- 13. Cederholm T., Jensen G. L., Correia M., et al., “GLIM Criteria for the Diagnosis of Malnutrition ‐ A Consensus Report From the Global Clinical Nutrition Community,” Clinical Nutrition 38 (2019): 1–9. [DOI] [PubMed] [Google Scholar]
- 14. Stratton R. J., Hackston A., Longmore D., et al., “Malnutrition in Hospital Outpatients and Inpatients: Prevalence, Concurrent Validity and Ease of Use of the ‘Malnutrition Universal Screening Tool’ (‘MUST’) for Adults,” British Journal of Nutrition 92 (2004): 799–808. [DOI] [PubMed] [Google Scholar]
- 15. Konishi M., Ishida J., Springer J., Anker S. D., and von Haehling S., “Cachexia Research in Japan: Facts and Numbers on Prevalence, Incidence and Clinical Impact,” Journal of Cachexia, Sarcopenia and Muscle 7 (2016): 515–519. [DOI] [PMC free article] [PubMed] [Google Scholar]
- 16. Yoshikoshi S., Imamura K., Yamamoto S., et al., “Prevalence and Relevance of Cachexia as Diagnosed by two Different Definitions in Patients Undergoing Hemodialysis: A Retrospective and Exploratory Study,” Archives of Gerontology and Geriatrics 124 (2024): 105447. [DOI] [PubMed] [Google Scholar]
- 17. Sakaguchi T., Maeda K., Takeuchi T., et al., “Validity of the Diagnostic Criteria From the Asian Working Group for Cachexia in Advanced Cancer,” Journal of Cachexia, Sarcopenia and Muscle 15 (2024): 370–379. [DOI] [PMC free article] [PubMed] [Google Scholar]
- 18. Amano K., Okamura S., Baracos V. E., et al., “Impacts of Fluid Retention on Prognostic Abilities of Cachexia Diagnostic Criteria in Cancer Patients With Refractory Cachexia,” Clinical Nutrition ESPEN 60 (2024): 373–381. [DOI] [PubMed] [Google Scholar]
- 19. Zhang F. M., Zhuang C. L., Dong Q. T., et al., “Characteristics and Prognostic Impact of Cancer Cachexia Defined by the Asian Working Group for Cachexia Consensus in Patients With Curable Gastric Cancer,” Clinical Nutrition 43 (2024): 1524–1531. [DOI] [PubMed] [Google Scholar]
- 20. Kato M., Ono S., Seko H., et al., “Relationship Between Cachexia and Short Physical Performance Battery Scores in Patients With Heart Failure Attending Comprehensive Outpatient Cardiac Rehabilitation,” Heart and Vessels 39 (2024): 778–784, 10.1007/s00380-024-02400-x. [DOI] [PubMed] [Google Scholar]
- 21. Fearon K., Strasser F., Anker S. D., et al., “Definition and Classification of Cancer Cachexia: An International Consensus,” Lancet Oncology 12 (2011): 489–495. [DOI] [PubMed] [Google Scholar]
- 22. Seko Y., Kato T., Morimoto T., et al., “Association Between Body Mass Index and Prognosis of Patients Hospitalized With Heart Failure,” Scientific Reports 10 (2020): 16663. [DOI] [PMC free article] [PubMed] [Google Scholar]
- 23. Zheng W., McLerran D. F., Rolland B., et al., “Association Between Body‐Mass Index and Risk of Death in More Than 1 Million Asians,” New England Journal of Medicine 364 (2011): 719–729. [DOI] [PMC free article] [PubMed] [Google Scholar]
- 24. Nagahiro T., Konishi M., Kagiyama N., et al., “Prognostic Value of Weight Loss in Hospitalized Patients With Heart Failure,” European Heart Journal ‐ Quality of Care and Clinical Outcomes (2024): qcae058, 10.1093/ehjqcco/qcae058. [DOI] [PubMed] [Google Scholar]
- 25. Konishi M., Kaneko H., Itoh H., et al., “Association of Weight Change and In‐Hospital Mortality in Patients With Repeated Hospitalization for Heart Failure,” Journal of Cachexia, Sarcopenia and Muscle 14 (2023): 642–652. [DOI] [PMC free article] [PubMed] [Google Scholar]
Associated Data
This section collects any data citations, data availability statements, or supplementary materials included in this article.
Supplementary Materials
Figure S1. Patient flow chart.
Figure S2. Kaplan–Meier survival curves of overall survival rate in patients divided into five groups based on the number of overlaps of cachexia evaluated by AWGC and Evans’ criteria, sarcopenia, and malnutrition.AWGC, Asia Working Group for Cachexia.
Table S1. Patient characteristics.
Table S2. Cox regression analyses of the association of the coexistence of multiple diagnoses for the all‐cause death.
Data Availability Statement
Data described in the manuscript, code book and analytic code will be made available upon request pending application and approval.