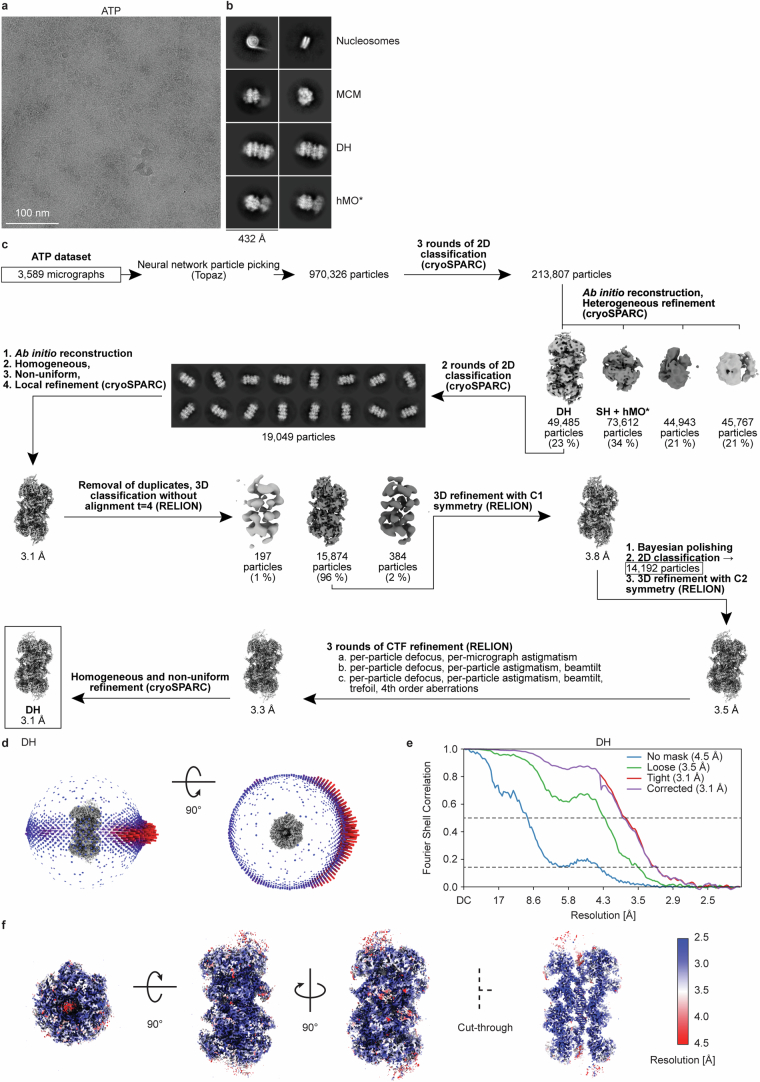
Extended Data Fig. 2.
a, Representative cryo-electron micrograph of the human MCM loading reaction. b, 2D averages of nucleosomes, MCM, hMO* and hDH were observed in the dataset. Box size 432 Å. c, Processing pipeline for the hDH. d, Angular distribution of the hDH structure. e, Fourier shell correlation plot for the hDH structure. f, Three rotated views and one cut-through view of the hDH structure, color-coded according to the local resolution as estimated in cryoSPARC.

