Abstract
A lifetime of successive bone remodeling events leads to trabeculae which are composed of a patchwork of bone structural units (BSUs) called hemi-osteons or trabecular packets. Traditionally, only intact surface BSUs have been studied, which are those that have been created most recently. Accordingly, the complex changes in the size and distribution of BSU throughout the trabeculae have been overlooked. In this study, the BSUs within the trabeculae of the second lumbar vertebrae were manually traced, using ImageJ software, in osteopontin immunostained sections of eight young women (aged 19-38 yr) and eight older women (aged 69-96 yr). A series of BSU profile properties including area, width, length, and perimeter were quantified, along with properties of each trabecular profile such as the number of BSU and cement line length. The relationships between these properties and age, as well as selected trabecular microstructural properties assessed with microcomputed tomography, and bone strength assessed on the neighboring third lumbar vertebrae, were investigated. The median BSU profile length and perimeter decreased with age, while the median BSU profile area and width was unchanged. Moreover, age was associated with an increase in the number of BSU profiles and cement line length per trabecular profile area. However, changes in BSU profile geometry, the number of BSU profiles, and the cement line length per trabecular profile were strongly correlated with trabecular bone volume fraction, structure model index, and bone strength. Further research is needed to understand how these changes in BSU properties affect the mechanical and failure properties of trabecular bone.
Keywords: bone structural unit (BSU), cement line, age, trabecular architecture, bone remodeling
Graphical Abstract
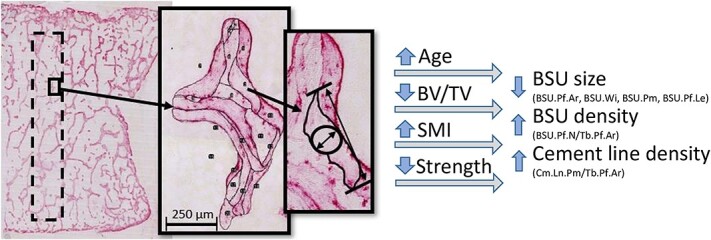
Graphical Abstract.
Introduction
Age-related fractures, which affect a large portion of the population in industrialized countries, most commonly occur in regions with high proportions of cancellous bone, such as the hip, wrist, and spine.1 These fractures have a significant impact on both those who sustain them and the healthcare systems that treat them. Because the incidence of age-related fractures is expected to rise with ageing demographics,2 efforts have been made to better predict fracture risk in the elderly. Areal BMD (aBMD), determined by dual-energy X-ray absorptiometry, is commonly used to assess fracture risk and forms the basis of the WHO criteria for diagnosing osteoporosis. However, aBMD has been shown to be an imperfect predictor of fracture risk, and fails to account for approximately one-third of traumatic fractures.2–4 In order to overcome this, a Fracture Risk Assessment Tool (FRAX) has been developed to estimate the fracture probability based on multiple risk parameters beyond aBMD.5 Neither aBMD nor FRAX includes bone volume fraction (BV/TV) or architectural properties such as trabecular thickness (Tb.Th) or structure model index (SMI), which have been shown to improve the prediction of fractures.6 Moreover, the trabecular mechanical properties, composition, and microstructure are also ignored.
Two microstructural features of trabeculae that have received little attention to date are the bone structural units (BSUs) and the cement lines “gluing” them together. In some papers, BSUs are referred to as trabecular packets7 or hemiosteons8 in trabecular bone, and as osteons in cortical bone,8 although BSU is the preferred term for trabecular bone, as well as also applies to cortical osteons, and is included in standardized histomorphometry nomenclature.9,10 Bone structural units are regions of lamellar bone tissue formed during an individual bone remodeling transaction. The cumulative results of multiple, discrete bone remodeling transactions are trabeculae that are composed of a patchwork of BSUs of different ages separated from one another by cement lines.8 The structure is analogous to a brick wall composed of (irregularly shaped) BSU “bricks” separated by mortar (cement lines). Due to the way trabecular bone is remodeled, the BSUs at the bone surface are newer, and thus less mineralized, than those remaining at the center of the trabeculae.11 This morphological composition results in heterogeneous material properties, which are expected to affect the mechanical properties of trabecular bone. Consequently, the size, distribution, and composition of the BSUs are expected to be important determinants of the mechanical properties of the bone tissue.
Only a few studies have characterized changes in trabecular BSU morphometry with age. Instead, most studies have focused exclusively on characterizing the mean wall thickness (W.Th) of the newest BSUs and have found that W.Th decreases with age and osteoporosis.12–15 Wall thickness is estimated by averaging multiple measurements of the wall width (W.Wi) between the quiescent bone surface and the cement line of the newest BSUs, and then multiplying this value with π/4 in order to convert the 2D width to a 3D thickness.10 The few studies that considered other morphometric parameters such as the area and length of BSUs reported that they also decreased with age.16–18 However, a limitation of these previous studies is that they only considered the surface (newest) BSUs that have not yet been altered by subsequent remodeling events. Although studying only the most recent BSUs will provide insight into the recent state of bone formation, it fails to address how repeated remodeling cycles form the mosaic-like BSU populations which may influence the mechanical properties of trabeculae.
Limiting the analyses to only the surface BSUs also overlooks changes to the amount of cement line present. To continue the wall analogy—which is not a new concept, as cement lines were originally called “kittlinien” (glue or mortar line)19—if there are a greater number of smaller bricks in the wall then the proportion of mortar holding them together increases exponentially. In 2D, the length of the mortar is roughly proportional to the square of the number of bricks. In other words, halving the brick dimensions results in a 4-fold increase in the length of mortar; the relationship would be cubic in 3D. Following this logic, small age-related decreases in BSU size can be expected to result in large increases in the proportion of cement line, as measured in length per unit area, throughout the trabeculae. Any such microstructural changes could affect the mechanical behavior, as cement lines are thought to play an important role in preventing crack propagation and in energy absorption.20 Although little is known about its mechanical properties, some studies suggest that cement lines are weaker and more brittle than bone matrix,20,21 while others have highlighted that the difference in mineralization between cement lines and the surrounding matrix decreases over time.22 Recently, it was shown that the apparently hypermineralized cement lines contain fewer nanochannels (~30 nm in diameter) and canaliculi channels penetrating the mineralized extracellular matrix than the adjacent lamellar bone,23 while the extracellular matrix itself is similar in the two.24 Moreover, microcracks have been observed to grow preferentially along cement lines of BSUs (osteons) in cortical bone25–27 and BSUs in trabecular bone,28 supporting the concept that cement lines deflect propagating microcracks.
Therefore, an increase in the proportion of cement lines associated with age-related decreases in the size of the BSUs is expected to affect the mechanical properties of trabecular bone. Yet the nature of the effect remains unclear. Studies have shown that an increased proportion of cement lines is associated with increased fatigue life in cortical bone.29 This is thought to result from crack blunting and deflection, similar to grain size effects observed in some metallic systems.30 Alternatively, the increased number of preferential pathways for crack growth may lead to earlier failure. A better understanding of the properties and behavior of cement lines versus BSUs will be needed to clarify the effect. However, before the mechanical implications can be understood, a method for quantifying the size and distribution of trabecular BSUs is needed.
The objective of the present study was to quantify changes in the 2D size and distribution of trabecular BSUs in the lumbar spine, as well as the surrounding cement lines, in relation to age, 3D volumetric and architectural parameters, and compressive bone strength. In a recent study, the authors quantified the change in the newest surface BSUs with age in 16 lumbar vertebrae from young and old women. The same 16 samples are re-analyzed to include all BSUs rather than just the most recent ones, and the trabecular profile in which they are located. New metrics are introduced to quantify the length of cement line and number of BSU profiles per trabecular area. We hypothesize that these metrics increase in the vertebrae of old compared to young individuals, and correlate with architectural parameters and compressive bone strength of the vertebrae. This would support the notion that the BSU composition affects the mechanical properties of trabecular bone.
Materials and methods
Bone specimens
Second lumbar vertebrae (L2) from 8 young (aged 19-38 yr) and 8 old (aged 69-96 yr) Caucasian women were examined. These specimens were used in a previous study by the authors18 and represent a subset, selected as the 8 youngest and 8 oldest women within the biobank of 41 L2 vertebrae previously collected, which were chosen to obtain having the greatest difference in microstructural and biomechanical parameters.31 Individuals with identified vertebral fracture, cancer, metabolic disease, severe liver or kidney disease, the use of medication affecting bone metabolism, or those who had a period of more than 2 wk of immobilization prior to death were excluded, as previously described.31 Consequently, the individuals studied represent a normal population that were considered to be in reasonably good health prior to their death.
The L2 vertebral bodies had been halved along the medial plane. A roughly 9-mm-thick frontal section was taken from the center of the one half vertebra, embedded in methyl methacrylate while undecalcified, and imaged in a μCT scanner (μCT35 Scanco Medical AG, Brüttisellen, Switzerland) with an isotropic voxel size of 18.5 μm. A volume of interest was selected (average dimensions 20.9 × 6.3 × 25.9 mm3) within each scan, Gaussian and threshold filtered, and analyzed to determine various microarchitectural parameters including BV/TV and SMI.31
The strength measures used in the current study, which are reported elsewhere,36 were obtained from the corresponding L3 vertebrae from the same individuals. Briefly, the vertebral bodies were loaded in compression at a constant rate of 5 mm/min. The strength (σmax) was determined by dividing the maximum applied load (Fmax) during the test by the cross-sectional area at the center of the vertebral body.
Specimen preparation
The undecalcified vertebral specimens described above, already embedded in methyl-methacrylate,31 were further analyzed in this study. The embedded samples were cut in 7.5-μm-thick frontal sections using a Leica SM 2500 microtome (Leica Biosystems; Wetzlar, Germany), placed on microscope slides, and immunohistochemically stained for osteopontin.
Immunohistochemistry
The sections were immunohistochemically stained for osteopontin to outline the cement lines of the BSU, as previous described.18 In short, the sections were first blocked with 0.5% casein and an avidin/biotin blocking kit (Dako; Glostrup, Denmark), and then incubated in a goat anti-osteopontin antibody solution (305-065-046; Jackson ImmunoResearch; West Grove, PA, USA). The primary antibody was detected with alkaline-phosphatase-conjugated BrightVision anti-rabbit IgG (ImmunoLogic; Duiven, The Netherlands) and visualized with Liquid Permanent Red (Dako; Glostrup, Denmark). The stained sections were mounted with Aquatex mounting medium.
Trabecular BSU histomorphometry
The prepared microscope slides were digitized at a resolution of 0.46 μm/pixel using a high-resolution scanner (NanoZoomer 2.0HT; Hamamatsu; Iwata City, Japan). A 75 mm2 region of interest (ROI) orientated along the superior–inferior direction of the vertebral body was identified from each scan for 2-D analysis (Figure 1A).
Figure 1.
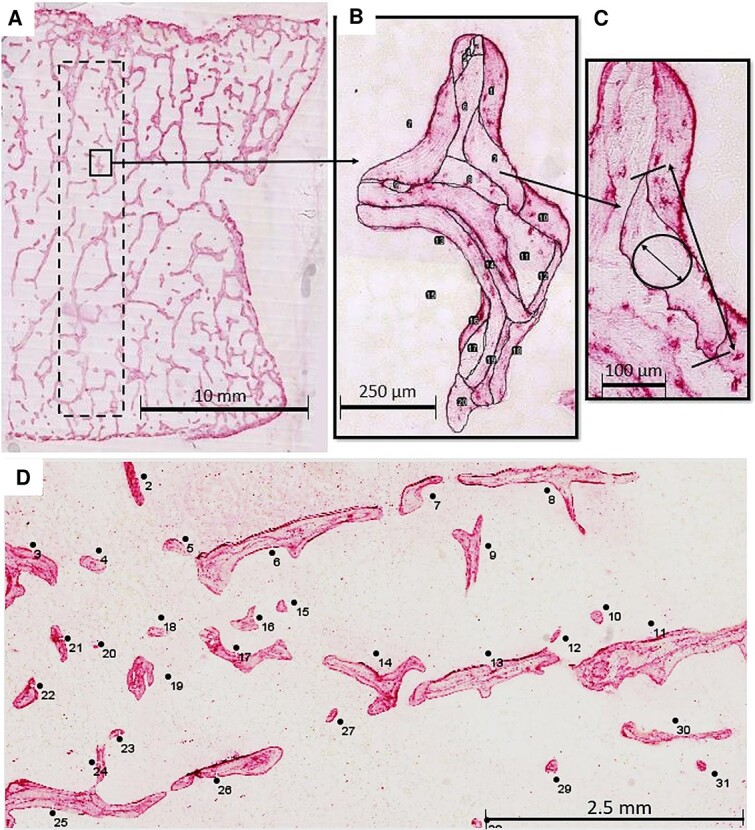
Histomorphometric analysis of BSUs and their delimiting cement lines in osteopontin immunostained sections. (A) The region of interest (ROI) included a 75 mm2 rectangle (dotted line) within a half of a frontal section of an L2 vertebra. (B) All trabeculae and their BSUs within the ROI were traced manually and given an identification number using ImageJ. (C, D) The area (BSU.Pf.Ar), length (BSU.Pf.Le), width (BSU.Pf.Wi), and perimeter (BSU.Pf.Pm) were recorded for all BSUs within the ROI. Abbreviation: BSU, bone structural unit.
The contour of each BSU within the analysis area was manually traced in ImageJ32 by a single operator (Britney A. Lamache) and given a BSU profile identification number (Figure 1B). In order to reduce bias from objects that extended beyond the borders of the ROI, any BSUs that straddled the upper and right borders of the ROI were included in the analysis, while any crossing the lower or left borders were not. When the staining was ambiguous, the slides were viewed using polarized light microscopy to distinguish between the lamellar patterns of adjacent BSU. The previous study of these samples, which considered only the most recent BSUs, found little evidence of modeling-based formation (minimodeling). Therefore, based on this previous result, and the challenge of identifying scalloped cement lines in older, partially resorbed BSUs, no efforts were made to distinguish BSUs created by remodeling- or modeling-based bone formation.
As the profiles of the BSUs were traced, their area (BSU.Pf.Ar), width (BSU.Pf.Wi), perimeter (BSU.Pf.Pm), and length (BSU.Pf.Le) were recorded using a measurement function in ImageJ. The BSU profile width was defined as the diameter of the maximum inscribed circle,33 while the BSU profile length was the maximum distance that would be measured by calipers (Figure 1C). Although BSU.Pf.Wi is similar, in terms of what is being measured, to the W.Wi used in previous studies, the latter relies on the average length of lines oriented normal to the BSU surface as opposed to the largest inscribed circle. Therefore, BSU.Pf.Wi is used throughout to make these differences clear.
Additionally, each trabecular profile within the analyzed area was traced. In the present study, a trabecular profile was defined as a discrete and continuous area of trabecular bone in the 2D section, but which does not necessarily correspond to a single trabecula in the 3D structure (Figure 1D). Trabecular profile area (Tb.Pf.Ar) and perimeter (Tb.Pf.Pm) were measured for each trabecular profile. These parameters allowed for the number of BSU profiles per trabecular profile area (BSU.Pf.N/Tb.Pf.Ar) to be recorded, and for the length of cement line per trabecular profile area (Cm.Ln.Pm/Tb.Pf.Ar) to be calculated, such that:
 |
Although the one term represents an areal number density (BSU.Pf.N/Tb.Pf.Ar), while the other is a length per unit area (Cm.Ln.Pm/Tb.Pf.Ar), they will be referred to as “BSU density” and “cement line density” for convenience. These terms should not be confused with the true density (mass per unit volume) of either phase.
Statistical analysis
A first analysis was performed to quantify differences in the distribution of BSU.Pf.Ar, BSU.Pf.Wi, BSU.Pf.Pm, BSU.Pf.Le, Cm.Ln.Pm/Tb.Pf.Ar, and BSU.Pf.N/Tb.Pf.Ar between the young and old individuals. A nested analysis in Stata (StataCorp LLC; College Station, TX) was used to determine the best-fit model and compare the two groups. The nested analysis considered the group, individual, and trabecular profile from which measures were obtained, which accounted for the varying number of BSU or trabecular profiles measured in each individual. The best-fit model was selected on logical grounds from three mixed-effect models: a normal (Gaussian), a negative-binomial, or a gamma distribution. No other distributions were considered due to a risk of overstating the results or breaching assumptions due to the positive-skewed shape of the data. The differences, if significant, were quantified by a z-value, which is a standardized variable given when using a mixed-effect model (similar to a t-score), and evaluated with reference to a standard normal distribution and reflects the strength of the group effect within the regression. There were not enough specimens in this study to justify a statistical comparison between models; however, if two models fit the data similarly, analysis was performed for both models to ensure the conclusions would not depend on the model selected.
For the second set of analyses, the summary statistics for BSU.Pf.Ar, BSU.Pf.Wi, BSU.Pf.Pm, BSU.Pf.Le, Cm.Ln.Pm/Tb.Pf.Ar, and BSU.Pf.N/Tb.Pf.Ar were tabulated for each individual. Simple linear regressions were performed using Prism (GraphPad Software; San Diego, CA), where the individual’s morphometric parameters were plotted against their age, as well as against their 3D architectural parameters obtained through μCT and compression strength determined in prior studies.31,34,35 These 3D architectural parameters include BV/TV, SMI, connectivity density (Conn.D), trabecular number (Tb.N), trabecular separation (Tb.Sp), and Tb.Th. Median values of the BSU profile parameters were used if the data followed a gamma or negative-binomial model to represent the positive skew of the data better, while the means were used if the parameter followed a normal distribution. In these analyses, the p-values indicate the significance of the slope being non-zero.
Because the samples selected were chosen to represent young and old populations, with no individuals from 39 to 68 yr, age was also considered as a discrete rather than a continuous variable. T-tests were performed on the medians of the BSU and profile metrics for the young and old groups to assess whether the results were dependent on the analysis method.
Values of p < .05 were considered significant for all analyses.
Results
In all, 664-1526 BSU, from 40 to 105 trabecular profiles were measured for each individual (Figure 1). Spreadsheets containing the 2D metrics for all 16 851 BSU and 1137 trabecular profiles are available for download as open data; summary statistics are provided as PDF tables. Finally, the 3D architectural parameters of L2, along with the compressive bone strength of the adjacent L3 obtained in previous studies,35,36 are also accessible. Consult the Data Availability Statement for more details.
BSU size distribution of young and old groups
BSU.Pf.Le (z = 2.15, p = .031) was significantly lower in the younger women (median = 169.1 μm) than in the older women (median = 143.4 μm), which was best described by a negative binomial model. BSU.Pf.Pm also followed a negative binomial model, and was significantly larger (z = 2.28, p = .023) in the younger women (398.7 μm) compared to the older women (342.3 μm). BSU.Pf.Ar and BSU.Pf.Wi followed gamma distributions, but their medians did not differ between the younger and older women (Figure 2).
Figure 2.
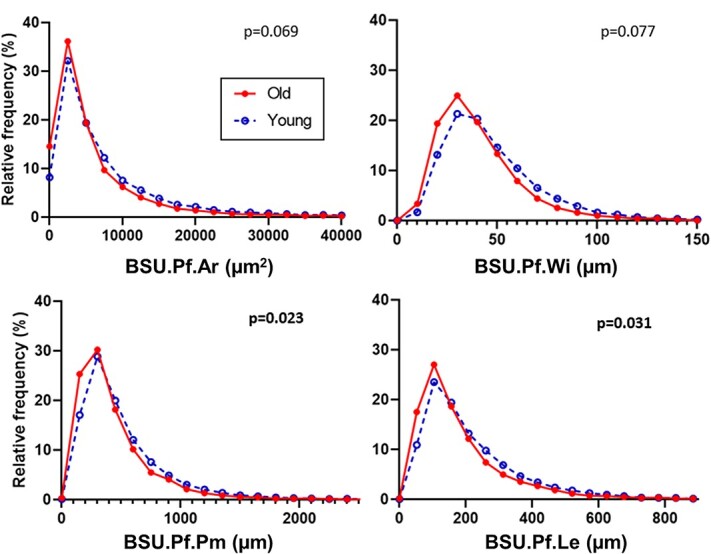
Frequency distribution of BSU.Pf.Ar, BSU.Pf.Wi, BSU.Pf.Pm, and BSU.Pf.Le within L2 vertebrae from 8 younger women (aged 19-38 yr) and 8 older women (aged 69-96 yr). The frequency plots are not normalized to account for different numbers of BSU per individual; however, the p-values are for the nested analyses (GROUP → INDIVIDUAL → TRABECULAR PROFILE) which do. Abbreviation: BSU, bone structural unit.
BSU and cement line density distribution of young and old groups
The analysis of the profile metrics revealed that BSU density (BSU.Pf.N/Tb.Pf.Ar) followed a gamma model and that the number of BSU per unit area was significantly (z = 3.12, p = .002) higher for the older women (median = 292 BSU/mm2) than for the younger women (median = 172 BSU/mm2) (Figure 3). Cement line density (Cm.Ln.Pm/Tb.Pf.Ar) followed a normal (Gaussian) distribution. The older women had significantly more cement line per unit area (mean = 31.0 mm/mm2) compared to the younger women (mean = 26.0 mm/mm2), (z = 2.02, p = .043) (Figure 3).
Figure 3.
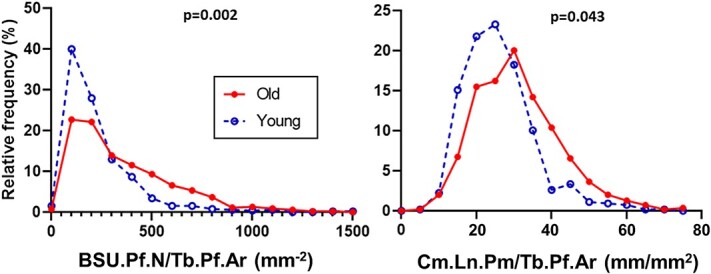
Frequency distribution of BSU.Pf.N/Tb.Pf.Ar and Cm.Ln.Pm/Tb.Pf.Ar within L2 vertebrae from 8 younger women (aged 19-38 yr) and 8 older women (aged 69-96 yr). The frequency plots are not normalized to account for different numbers of trabecular profiles measured per individual; however, the p-values are for the nested analyses (GROUP → INDIVIDUAL → TRABECULAR PROFILE) which do. Abbreviation: BSU, bone structural unit.
Correlation of BSU size with age, trabecular bone volume, and architecture
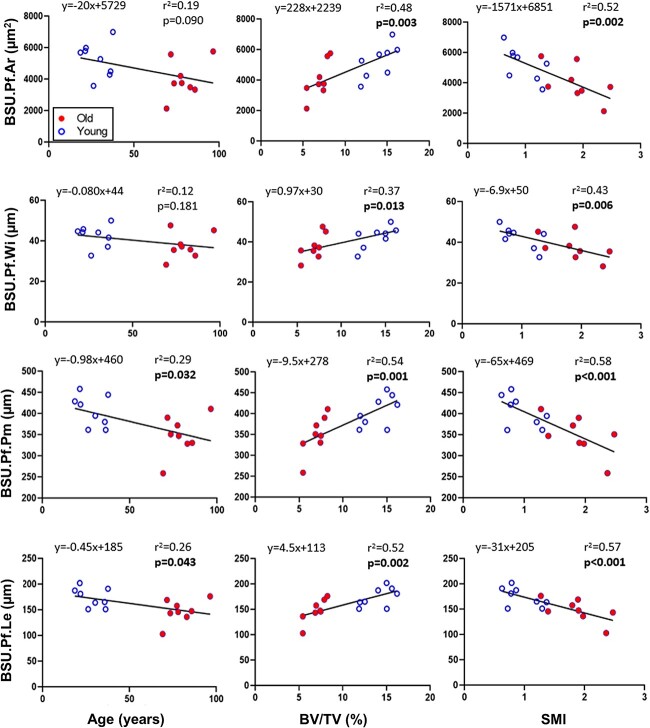
When linear regression was performed on the individuals’ summary statistics, all four BSU profile parameters were significantly correlated to BV/TV and SMI, but only BSU perimeter and length were correlated to age (Figure 4). Except for BSU.Pf.Wi, which was positively correlated to Tb.Th (p = .031, r2 = 0.029, y = 0.15 × x + 21), none of the BSU profile parameters were significantly correlated to any of the other 3D architectural parameter (Conn.D, Tb.N, Tb.Sp, or Tb.Th).
Figure 4.
Linear regression of median BSU.Pf.Ar, BSU.Pf.Wi, BSU.Pf.Pm, and BSU.Pf.Le with respect to age, BV/TV, and SMI. If the slope of the linear regression is significantly different from zero, the corresponding p-value is shown in bold. Abbreviations: BSU, bone structural unit; BV/TV, bone volume fraction; SMI, structure model index.
Two-tailed t-tests were also performed on the medians of the BSU metrics for the young and old groups, given that the samples were selected based on age. The linear regression analysis proved to be a more conservative approach. Significant differences were found between the young and old groups for three of the profile parameters (BSU.Pf.Ar: p = .044; BSU.Pf.Pm: p = .015; BSU.Pf.Le: p = .021) when using the t-test, with only BSU.Pf.Wi (p = .113) failing to reach significance.
Correlation of BSU and cement line density with age, trabecular bone volume, and architecture
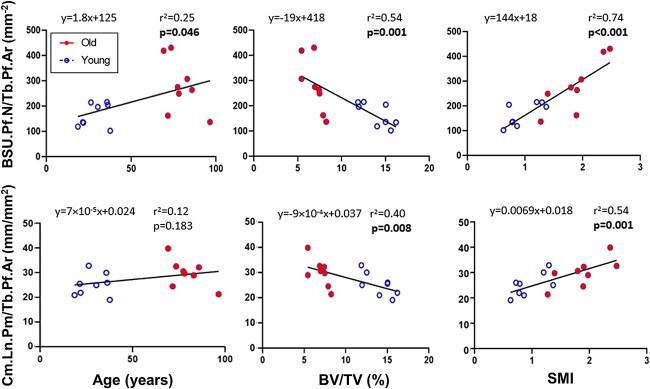
When linear regression was performed on the trabecular profile parameters, BSU.Pf.N/Tb.Pf.Ar was significantly correlated to age (p = .046), BV/TV (p = .001), and SMI (p < .001), while Cm.Ln.Pm/Tb.Pf.Ar was only correlated to BV/TV (p = .008) and SMI (p = .001) (Figure 5). Age was also significant for BSU.Pf.N/Tb.Pf.Ar (p = .015) when two-tailed t-tests were performed on the medians of the young and old groups, but not for Cm.Ln.Pm/Tb.Pf.Ar (p = .093).
Figure 5.
Linear regression of median BSU.Pf.N/Tb.Pf.Ar and Cm.Ln.Pm/Tb.Pf.Ar with respect to age, BV/TV, and SMI. If the slope of the linear regression is significantly different from zero, the corresponding p-value is shown in bold. Abbreviations: BSU, bone structural unit; BV/TV, bone volume fraction; SMI, structure model index.
Correlation between BSU and cement line parameters and compression strength
When analyzed individually, all four BSU profile parameters and both trabecular profile parameters were significantly linearly correlated with compression strength (Figure 6). The BSU parameters were positively correlated to bone strength, while BSU.Pf.N/Tb.Pf.Ar and Cm.Ln.Pm/Tb.Pf.Ar were negatively correlated to bone strength. However, BSU.Pf.N/Tb.Pf.Ar and Cm.Ln.Pm/Tb.Pf.Ar have less explanatory power of bone strength than either BV/TV (p < .001, r2 = 0.90) or SMI (p < .001, r2 = 0.73) alone.
Figure 6.
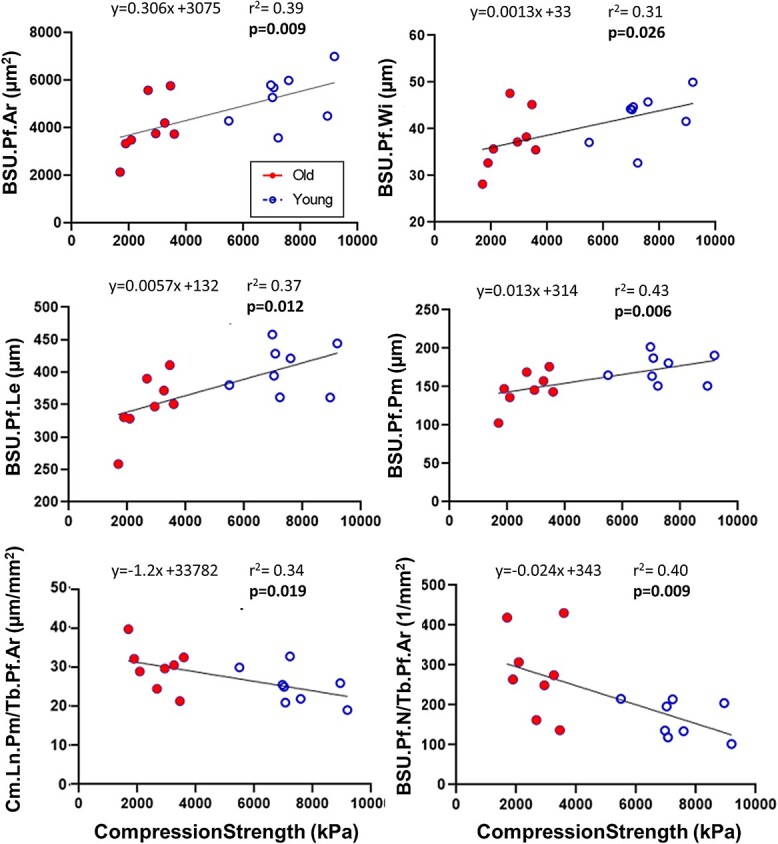
Linear regression of median BSU.Pf.Ar, BSU.Pf.Wi, BSU.Pf.Le, BSU.Pf.Pm, Cm.Ln.Pm/Tb.Pf.Ar, and BSU.Pf.N/Tb.Pf.Ar of L2 vertebra with respect to compression strength of the adjacent L3 vertebra. If the slope of the linear regression is significantly different from zero, the corresponding p-value is shown in bold. Abbreviation: BSU, bone structural unit.
Discussion
This study set out to quantify the size of trabecular BSUs, as well as the number of BSU (BSU density) and length of cement line in a trabecular profile (cement line density), and determine the relationships of these parameters with age, 3D microstructure, and compressive strength. To this end, over 16 000 BSU profiles from a defined ROI in 16 human lumbar vertebrae were quantified within 1137 unique trabecular profiles. To our knowledge, these results provide the first evidence linking the size and density of BSUs, as well as cement line density, with trabecular bone volume and architecture, vertebral compressive strength, and—to a lesser extent—age. These findings are summarized in Figure 7 and discussed in the paragraphs below.
Figure 7.
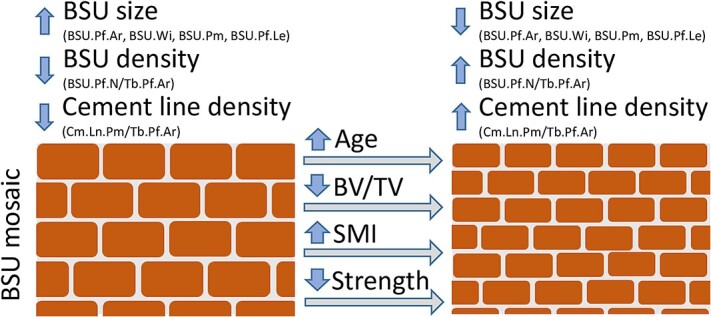
An analogy comparing the trabecular BSU mosaic/composition to that of a brick-and-mortar wall, where bricks reflect the BSUs and mortar the cement lines. The brick-and-mortar wall either has larger bricks and less mortar, or smaller bricks and more mortar. Reduced trabecular bone volume, increased SMI, reduced vertebral compressive strength, and to some extent age correlated with a shift to the right, toward trabeculae with smaller bricks and more mortar. Abbreviations: BSU, bone structural unit; SMI, structure model index.
BSU size correlates more strongly with trabecular bone volume and architecture, than age
The BSU profile sizes are highly variable within each individual, as well as among the individuals within the included younger and older women. The BSU profiles of all BSUs are smaller than the most recently formed BSU along the bone surface.16–18 This difference reflects the fact that the deeper embedded older BSUs have been partially resorbed during the subsequent remodeling transactions, leaving only part of the original BSU behind, thereby forming a mosaic of BSU of different ages.37 In this study, we assume that changes in the size of the 2D BSU profiles overall reflect changes in the size of the 3D BSU, but that the size of individual 2D BSU profiles may not be directly transferable to the size of 3D BSU in trabecular bone. The true size of individual 3D BSU in trabecular bone remains, however, to be investigated and warrants further study.
In this study, the BSU profile size parameters were only slightly decreased with age when comparing the younger and older women using both distribution plots and linear correlations, and only significantly for BSU profile length and perimeter, but not BSU profile area and width. This result is in contrast to our previous study that focused on the recently formed superficial BSU of the same individuals,18 where we observed a stronger link between all the BSU profile size parameters and age. This difference is not surprising, as superficial BSUs reflect the recent events, while BSUs at the interior may be years or decades old and reflect the remains after subsequent bone resorptions. On the other hand, the size parameters of both superficial18 and all [this study] BSU profiles in trabecular bone show a stronger correlation with the trabecular bone volume and architecture (SMI), than age. Structure model index is widely used to measure the extent of rods (SMI = 3) versus plates (SMI = 1) in trabecular bone. It is clear that individuals having a lower trabecular bone volume also have a more disconnected, rod-like trabecular structure, which would result in smaller, disconnected trabecular profiles in 2D with smaller BSU profiles. This relationship supports the notion that the BSUs are smaller in trabecular rods versus plates, where the plate-to-rod transition is the result of a reduced trabecular bone volume and, to some extent, age.38,39 Future 3D studies of individual rods and plates, and the size of their respective BSU populations, may confirm this notion.
BSU and cement line density correlate more strongly with trabecular bone volume and architecture, than age
In order to understand the population of BSUs that make up trabecular bone, one should not only focus on the size of the individual BSU profiles, but also on the density of BSU profiles and cement lines. In this study, two novel trabecular BSU microstructural parameters were introduced: BSU density (BSU.Pf.N/Tb.Pf.Ar), as the number of BSU profiles per trabecular profile area; and, cement line density (Cm.Ln.Pm/Tb.Pf.Ar), as the cement line length per trabecular profile areas. Utilizing both these microstructural parameters, the frequency distribution of BSU and cement line densities was found to increase significantly in the old group compared to the young group. It is interesting that the BSU density increased significantly with age, while the area of the BSU profiles did not show significant age-related changes. This trend is likely due to the fact that when normalized by trabecular area―which tends to be smaller in the old individuals―the values are amplified. On the other hand, both BSU and cement line density show a stronger correlation with the trabecular bone volume and architecture (SMI) than with age, similar to what was observed for the BSU profile size parameters.
This link between BSU size, and BSU profile and cement line density, can be explained through the brick-and-mortar analogy, where bricks representing the BSU and the mortar the cement line (Figure 7). Smaller bricks increase both the number of bricks, and the length of mortar, per unit area. Similarly, smaller BSUs increase BSU density (BSU.Pf.N/Tb.Pf.Ar) and the cement line density (Cm.Ln.Pm/Tb.Pf.Ar), changes which are correlated with decreased BV/TV, and increased SMI and age. These increases in BSU and cement line density could have implications on the fracture risk, as will be discussed in the next section. However, it is important to note that the method of measuring the cement line results in a 1D property (length), while any change in the thickness of the cement line was not measured. Better visualization techniques would be required to measure the thickness of the cement lines due to their small scale.
The BSUs measured in the present study were limited to those from the second lumbar vertebrae in healthy women. Changes in BSU geometry and increases in the length of cement line, and their behavioral consequences, should also be examined in other scenarios. Age-related changes in men compared with women, skeletal site-to-site differences, and effects of drug treatment are all of interest, as are pathological changes to the amount and distribution of the cement lines. For example, Paget’s disease, which manifests as aggressive bone remodeling, results in crenated, jigsaw-like cement lines. Individuals suffering from this disease are prone to incomplete fractures and bowing of the affected bones due to increased tissue heterogeneity and plasticity.40,41 Autosomal dominant osteopetrosis, also known as Albers–Schönberg disease, is likewise of interest because it results in thickened cement lines.42
Vertebral compressive strength correlates with trabecular BSU size and density, and cement line density
The BSU profile size, and BSU and cement line density of the L2 vertebrae, all exhibited significant correlations with the compressive strength of the adjacent L3 measured in a previous study43; however, the relationships were much weaker than those for BV/TV or SMI alone. Testing of individual trabeculae may provide clearer understanding of how changes in microstructure affect mechanical properties and failure behavior by eliminating the confounding effects of microarchitecture.
As stated earlier, cement lines are likely harder and more brittle than the surrounding tissue due to its apparent higher level of mineralization and its collagen deficiency.20,21 Though very little research has been done to further understand its local mechanical properties, cement lines have been shown to deflect microcrack propagation, causing microcracks to run along the cement lines in both cortical25–27 and trabecular28 bones. An extended finite element model study found that when assigning high strength and low toughness to cement line―consistent with a hard and brittle material―the load required to initiate cracks decreased.26 Similarly, an increase in the number of osteons per area in cortical bone resulted in a lower ultimate tensile strength, and this change was attributed to an increase in the amount of brittle cement line that accompanied an increased number of osteons.44 Conversely, an increased proportion of cement lines has been shown to be associated with longer fatigue life in cortical bone.29 Numerical simulations such as these may prove helpful in clarifying whether an increased proportion of cement lines has a beneficial or deleterious effect on trabecular bone strength.
Non-geometric studies of BSU
Although the current research is the first to characterize the geometry of the entire population of BSU profiles throughout the cross-section of trabeculae, geometry alone is not the sole determinant of fragility in cancellous bone. For example, BSUs at the surface of the trabeculae have been found to have lower mineralization levels and stiffness relative to those deeper within the trabeculae.7,45 This gradient through the cross-section is associated with a concentration of microdamage within that deeper, more mineralized, stiffer tissue.45 Both experimental46 and numerical studies47 have shown that the orientation of the lamellar bone within the BSUs affects crack growth. Finally, the mineralization of cement lines is not constant, but seems to be correlated to the mineralization of the adjacent BSUs in cortical bone.22 All these geometric, compositional, and mechanical differences will need to be considered in concert to understand their individual contributions to trabeculae fragility.
Study limitations
This study has a few limitations. First, the 2D measurements reported herein do not necessarily reflect the complexity of the 3D BSU morphology. A BSU that wraps around the periphery of a rod-like trabecula, for example, has the possibility of being sectioned such that it appears as two separate BSUs. This would lead to an underestimation of the actual area, width and length, and an overestimation of the number of BSUs. Similarly, both the trabeculae and the BSUs are anisotropic, and their orientations relative to the sectioning plane can result in over- or underestimations of the parameters.
A related issue is that the size of the BSU profiles may be dependent on the rod- or plate-like geometry of the trabeculae from which they are measured. Given that the trabecular bone becomes more rod-like with age, an architecture-dependence of BSU geometry could possibly skew the 2D results. A method of considering the local trabecular architecture in which the BSUs are located should be considered in future work.
The manual tracing of the BSU may also incorporate some subjectivity into the results. Although this effect was minimized in the current study by having a single operator perform all the measurements with the help of polarized light microscopy, as well as by the high resolution of the imaging relative to the size of the features being measured, it cannot be eliminated.
Finally, it was not possible to perform a meaningful power calculation before the study was conducted as key outcome parameters such as BSU density and cement line density are newly introduced in this work. Consequently, information on mean values and standard deviations for these parameters was not available before the study was conducted. Prior studies focus on the size and shape of the recently formed BSU revealed highly significant differences between the young and old groups,18 supporting that the group sizes have a sufficient power to obtain valid conclusions. The study was designed to investigate the trabecular BSU composition across age in women; therefore, further studies are needed to address any sex-related differences.
Conclusion
In the trabecular bone of human lumbar vertebrae, the BSU profile size (only length and perimeter) decreases with age, while the BSU and cement line density increase with age. Interestingly, the BSU profile size, along with the BSU and cement line densities, has much stronger correlations with the trabecular bone volume, architecture (plate-to-rod transition), and vertebral compression strength, than with age. The implication of these differences in trabecular BSU populations requires further investigation.
Acknowledgments
The authors gratefully acknowledge the help of Dr. Bruce Oddson with the statistical analysis, and Kaja Søndergaard Laursen and Birgit MacDonald with their technical assistance. The VELUX Foundation is gratefully acknowledged for donating the μCT scanner.
Additional Information: The article is dedicated to the memory of Britney A. Lamarche (February 17, 1996-September 8, 2024), a brilliant young engineer whose life was cut short by cancer.
Contributor Information
Britney A Lamarche, School of Engineering and Computer Science, Laurentian University, Sudbury, ON P3E 2C6, Canada.
Jesper Skovhus Thomsen, Department of Biomedicine, Aarhus University, 8000 Aarhus C, Denmark.
Christina Møller Andreasen, Department of Pathology, Odense University Hospital, 5000 Odense C, Denmark; Molecular Bone Histology (MBH) Lab, Department of Clinical Research, University of Southern Denmark, 5230 Odense M, Denmark.
Thomas Levin Andersen, Department of Pathology, Odense University Hospital, 5000 Odense C, Denmark; Molecular Bone Histology (MBH) Lab, Department of Clinical Research, University of Southern Denmark, 5230 Odense M, Denmark; Molecular Bone Histology (MBH) Lab, Department of Forensic Medicine, Aarhus University, 8200 Aarhus N, Denmark.
W Brent Lievers, School of Engineering and Computer Science, Laurentian University, Sudbury, ON P3E 2C6, Canada; School of Natural Sciences, Laurentian University, Sudbury, ON P3E 2C6, Canada.
Author contributions
Britney Lamarche (Conceptualization, Data curation, Formal analysis, Investigation, Methodology, Visualization, Writing—original draft, Writing—review & editing), Jesper Thomsen (Methodology, Resources, Writing—review & editing), Christina Andreasen (Investigation, Methodology, Writing—review & editing), Thomas Andersen (Conceptualization, Funding acquisition, Methodology, Project administration, Resources, Supervision, Writing—review & editing), and W. Brent Lievers (Conceptualization, Data curation, Funding acquisition, Methodology, Project administration, Supervision, Writing—review & editing). Thomas L. Andersen and W. Brent Lievers are shared senior authorship.
Funding
This study was supported by the Natural Sciences and Engineering Research Council of Canada (NSERC) (Grant RGPIN-2015-05019) and Mitacs (Grant IT13951).
Conflicts of interest
The authors have no conflicts to disclose.
Data availability
The data underlying this article are available in Borealis, at https://doi.org/10.5683/SP3/IDJ6GW.
References
- 1. Burge R, Dawson-Hughes B, Solomon DH, Wong JB, King A, Tosteson A. Incidence and economic burden of osteoporosis-related fractures in the United States, 2005-2025. J Bone Miner Res. 2007;22(3):465-475. 10.1359/jbmr.061113 [DOI] [PubMed] [Google Scholar]
- 2. World Health Organization . WHO Scientific Group on the Assessment of Osteoporosis at Primary Health Care Level. Geneva: World Health Organization; 2004.
- 3. Alswat KA. Gender disparities in osteoporosis. J Clin Med Res. 2017;9(5):382-387. 10.14740/jocmr2970w [DOI] [PMC free article] [PubMed] [Google Scholar]
- 4. Pasco JA, Seeman E, Henry MJ, Merriman EN, Nicholson GC, Kotowicz MA. The population burden of fractures originates in women with osteopenia, not osteoporosis. Osteoporos Int. 2006;17(9):1404-1409. 10.1007/s00198-006-0135-9 [DOI] [PubMed] [Google Scholar]
- 5. Kanis J, Johnell O, Oden A, Johansson H, McCloskey E. FRAX and the assessment of fracture probability in men and women from the UK. Osteoporos Int. 2008;19(4):385-397. 10.1007/s00198-007-0543-5 [DOI] [PMC free article] [PubMed] [Google Scholar]
- 6. Ulrich D, van Rietbergen B, Laib A, Rüegsegger P. The ability of three-dimensional structural indices to reflect mechanical aspects of trabecular bone. Bone. 1999;25(1):55-60. 10.1016/s8756-3282(99)00098-8 [DOI] [PubMed] [Google Scholar]
- 7. Ciarelli TE, Tjhia C, Rao DS, Qiu S, Parfitt AM, Fyhrie DP. Trabecular packet-level lamellar density patterns differ by fracture status and bone formation rate in white females. Bone. 2009;45(5):903-908. 10.1016/j.bone.2009.07.002 [DOI] [PubMed] [Google Scholar]
- 8. Parfitt AM. Osteonal and hemi-osteonal remodeling: the spatial and temporal framework for signal traffic in adult human bone. J Cell Biochem. 1994;55(3):273-286. 10.1002/jcb.240550303 [DOI] [PubMed] [Google Scholar]
- 9. Hengsberger S, Kulik A, Zysset P. A combined atomic force microscopy and nanoindentation technique to investigate the elastic properties of bone structural units. eCM. 2001;1:12-17. 10.22203/eCM.v001a02 [DOI] [PubMed] [Google Scholar]
- 10. Dempster DW, Compston JE, Drezner MK, et al. Standardized nomenclature, symbols, and units for bone histomorphometry: a 2012 update of the report of the ASBMR histomorphometry nomenclature committee. J Bone Miner Res. 2013;28(1):2-17. 10.1002/jbmr.1805 [DOI] [PMC free article] [PubMed] [Google Scholar]
- 11. Fratzl P, Gupta H, Paschalis L, Roschger P. Structure and mechanical quality of the collagen-mineral nano-composite in bone. J Mater Chem. 2004;14(14):2115-2123. 10.1039/B402005G [DOI] [Google Scholar]
- 12. Dempster DW, Arlot MA, Meunier PJ. Mean wall thickness and formation periods of trabecular bone packets in corticosteroid-induced osteoporosis. Calcif Tissue Int. 1983;35(1):410-417. 10.1007/BF02405069 [DOI] [PubMed] [Google Scholar]
- 13. Kragstrup J, Melsen F, Mosekilde L. Thickness of bone formed at remodeling sites in normal human iliac trabecular bone: variations with age and sex. Metab Bone Dis Relat Res. 1983;5(1):17-21. 10.1016/0221-8747(83)90046-2 [DOI] [PubMed] [Google Scholar]
- 14. Lips P, Courpron P, Meunier P. Mean wall thickness of trabecular bone packets in human iliac crest—changes with age. Calcif Tissue Int. 1978;26(1):13-17. 10.1007/BF02013227 [DOI] [PubMed] [Google Scholar]
- 15. Carbonare LD, Arlot ME, Chavassieux PM, Roux JP, Portero NR, Meunier PJ. Comparison of trabecular bone microarchitecture and remodeling in glucocorticoid-induced and postmenopausal osteoporosis. J Bone Miner Res. 2001;16(1):97-103. 10.1359/jbmr.2001.16.1.97 [DOI] [PubMed] [Google Scholar]
- 16. Ohno A, Amagai H, Miyagawa S, Yoshikawa S. Mean wall thickness of iliac trabecular bone packets in 98 normal Japanese females. In: Takahasi H, editor. International Congress on Bone Morphometry. Vol. 5. Nishimura, 1990:392-395. [Google Scholar]
- 17. Yamaguchi K, Croucher PI, Compston JE. Comparison between the lengths of individual osteoid seams and resorption cavities in human iliac crest cancellous bone. J Bone Miner Res. 1993;23(1):27-33. 10.1016/S0169-6009(08)80088-8 [DOI] [PubMed] [Google Scholar]
- 18. Lamarche B, Skovhus Thomsen J, Møller Andreasen C, Lievers WB, Levin AT. 2D size of trabecular bone structure units (BSU) correlate more strongly with 3D architectural parameters than age in human vertebrae. Bone. 2022;160:116399. 10.1016/j.bone.2022.116399 [DOI] [PubMed] [Google Scholar]
- 19. Von Ebner V. Über den Feineren Bau der Knochensubstanz. 1875.
- 20. Skedros JG, Holmes JL, Vajda EG, Bloebaum RD. Cement lines of secondary osteons in human bone are not mineral-deficient: new data in a historical perspective. Anat Rec A Discov Mol Cell Evol Biol. 2005;286A(1):781-803. 10.1002/ar.a.20214 [DOI] [PubMed] [Google Scholar]
- 21. Smith JW. Age changes in the organic fraction of bone. J Bone Joint Surg. 1963;45-B(4):761-769. 10.1302/0301-620X.45B4.761 [DOI] [PubMed] [Google Scholar]
- 22. Milovanovic P, vom Scheidt A, Mletzko K, et al. Bone tissue aging affects mineralization of cement lines. Bone. 2018;110:187-193. 10.1016/j.bone.2018.02.004 [DOI] [PubMed] [Google Scholar]
- 23. Repp F, Kollmannsberger P, Roschger A, et al. Coalignment of osteocyte canaliculi and collagen fibers in human osteonal bone. J Struct Biol. 2017;199(3):177-186. 10.1016/j.jsb.2017.07.004 [DOI] [PubMed] [Google Scholar]
- 24. Tang T, Landis W, Blouin S, et al. Subcanalicular nanochannel volume is inversely correlated with calcium content in human cortical bone. J Bone Miner Res. 2023;38(2):313-325. 10.1002/jbmr.4753 [DOI] [PubMed] [Google Scholar]
- 25. Gustafsson A, Wallin M, Khayyeri H, Isaksson H. Crack propagation in cortical bone is affected by the characteristics of the cement line: a parameter study using an XFEM interface damage model. Biomech Model Mechanobiol. 2019;18(4):1247-1261. 10.1007/s10237-019-01142-4 [DOI] [PMC free article] [PubMed] [Google Scholar]
- 26. Ural A, Mischinski S. Multiscale modeling of bone fracture using cohesive finite elements. Eng Fract Mech. 2013;103:141-152. 10.1016/j.engfracmech.2012.05.008 [DOI] [Google Scholar]
- 27. Jepsen KJ, Davy DT, Krzypow DJ. The role of the lamellar interface during torsional yielding of human cortical bone. J Biomech. 1999;32(3):303-310. 10.1016/s0021-9290(98)00179-1 [DOI] [PubMed] [Google Scholar]
- 28. Choi K, Goldstein SA. A comparison of the fatigue behavior of human trabecular and cortical bone tissue. J Biomech. 1992;25(12):1371-1381. 10.1016/0021-9290(92)90051-2 [DOI] [PubMed] [Google Scholar]
- 29. Gibson VA, Stover SM, Gibeling JC, Hazelwood SJ, Martin RB. Osteonal effects on elastic modulus and fatigue life in equine bone. J Biomech. 2006;39(2):217-225. 10.1016/j.jbiomech.2004.12.002 [DOI] [PubMed] [Google Scholar]
- 30. Chen AY, Li DF, Zhang JB, Liu F, Liu XR, Lu J. Study of toughening mechanisms through the observations of crack propagation in nanostructured and layered metallic sheet. Mater Sci Eng A. 2011;528(29-30):8389-8395. 10.1016/j.msea.2011.07.063 [DOI] [Google Scholar]
- 31. Thomsen JS, Ebbesen EN, Mosekilde L. Zone-dependent changes in human vertebral trabecular bone: clinical implications. Bone. 2002;30(5):664-669. 10.1016/S8756-3282(02)00686-5 [DOI] [PubMed] [Google Scholar]
- 32. Rueden CT, Schindelin J, Hiner MC, et al. ImageJ2: ImageJ for the next generation of scientific image data. BMC Bioinformatics. 2017;18(1):529. 10.1186/s12859-017-1934-z [DOI] [PMC free article] [PubMed] [Google Scholar]
- 33. Burri O. Max Inscribed Circles. BioImaging and Optics Platform (BIOP)2018. Accessed June 4, 2020. https://github.com/BIOP/ijp-max-inscribed-circles [Google Scholar]
- 34. Thomsen JS, Ebbesen EN, Mosekilde LI. Age-related differences between thinning of horizontal and vertical trabeculae in human lumbar bone as assessed by a new computerized method. Bone. 2002;31(1):136-142. 10.1016/S8756-3282(02)00801-3 [DOI] [PubMed] [Google Scholar]
- 35. Thomsen JS, Jensen MV, Niklassen AS, Ebbesen EN, Brüel A. Age-related changes in vertebral and iliac crest 3D bone microstructure—differences and similarities. Osteoporos Int. 2015;26:219-228. 10.1007/s00198-014-2851-x [DOI] [PubMed] [Google Scholar]
- 36. Ebbesen EN, Thomsen JS, Beck-Nielsen H, Nepper-Rasmussen HJ, Mosekilde L. Age- and gender-related differences in vertebral bone mass, density, and strength. J Bone Miner Res. 1999;14(8):1394-1403. 10.1359/jbmr.1999.14.8.1394 [DOI] [PubMed] [Google Scholar]
- 37. Andersen TL, Delaissé J-M, Thomsen JS, Andreasen CM. Significance of reversal-resorption phase in bone loss. In: Takahashi HE, Burr DB, Yamamoto N, editors. Osteoporotic Fracture and Systemic Skeletal Disorders, Springer; 2022, p. 101-110. doi: 10.1007/978-981-16-5613-2_7 [DOI] [Google Scholar]
- 38. Homminga J, Van-Rietbergen B, Lochmüller EM, Weinans H, Eckstein F, Huiskes R. The osteoporotic vertebral structure is well adapted to the loads of daily life, but not to infrequent “error” loads. Bone. 2004;34(3):510-516. 10.1016/j.bone.2003.12.001 [DOI] [PubMed] [Google Scholar]
- 39. Choksi P, Jepsen KJ, Clines GA. The challenges of diagnosing osteoporosis and the limitations of currently available tools. Clin Diabetes Endocrinol. 2018;4(1):12. 10.1186/s40842-018-0062-7 [DOI] [PMC free article] [PubMed] [Google Scholar]
- 40. Whyte MP. Paget’s disease of bone. N Engl J Med. 2006;355(6):593–600. 10.1056/NEJMcp060278 [DOI] [PubMed] [Google Scholar]
- 41. Zimmermann EA, Busse B, Ritchie RO. The fracture mechanics of human bone: influence of disease and treatment. Bonekey Rep. 2015;4:743. 10.1038/bonekey.2015.112 [DOI] [PMC free article] [PubMed] [Google Scholar]
- 42. Semba I, Ishigami T, Sugihara K, Kitano M. Higher osteoclastic demineralization and highly mineralized cement lines with osteocalcin deposition in a mandibular cortical bone of autosomal dominant osteopetrosis type II: ultrastructural and undecalcified histological investigations. Bone. 2000;27(3):389-395. 10.1016/S8756-3282(00)00330-6 [DOI] [PubMed] [Google Scholar]
- 43. Thomsen JS, Ebbesen EN, Li M. Predicting human vertebral bone strength by vertebral static histomorphometry. Bone. 2002;30(3):502-508. 10.1016/S8756-3282(01)00702-5 [DOI] [PubMed] [Google Scholar]
- 44. Evans FG, Bang S. Differences and relationships between the physical properties and the microscopic structure of human femoral, tibial and fibular cortical bone. Am J Anat. 1967;120(1):79-88. 10.1002/aja.1001200107 [DOI] [Google Scholar]
- 45. Smith LJ, Schirer JP, Fazzalari NL. The role of mineral content in determining the micromechanical properties of discrete trabecular bone remodeling packets. J Biomech. 2010;43(16):3144-3149. 10.1016/j.jbiomech.2010.07.038 [DOI] [PubMed] [Google Scholar]
- 46. Wang X, Zauel RR, Rao DS, Fyhrie DP. Cancellous bone lamellae strongly affect microcrack propagation and apparent mechanical properties: separation of patients with osteoporotic fracture from normal controls using a 2D nonlinear finite element method (biomechanical stereology). Bone. 2008;42(6):1184-1192. 10.1016/j.bone.2008.01.022 [DOI] [PMC free article] [PubMed] [Google Scholar]
- 47. Hammond MA, Wallace JM, Allen MR, Siegmund T. Mechanics of linear microcracking in trabecular bone. J Biomech. 2019;83:34-42. 10.1016/j.jbiomech.2018.11.018 [DOI] [PubMed] [Google Scholar]
Associated Data
This section collects any data citations, data availability statements, or supplementary materials included in this article.
Data Availability Statement
The data underlying this article are available in Borealis, at https://doi.org/10.5683/SP3/IDJ6GW.


