Abstract
Nanofiber filters are widely used in air filtration applications due to their superior performance over microfiber filters. Velocity slip around nanofibers has been identified as a key factor contributing to their high figure of merit, yet its impact on filter performance, especially particle collection efficiency, remains unclear due to the difficulty in isolating the slip effect as the sole variable. This study combines experimental and simulation methods to investigate the slip effect by adjusting the air molecule mean free path, rather than varying fiber size as done in previous studies. Filter media with mean fiber sizes ranging from 16.2 to 0.084 µm are utilized. An image‐based regression method is developed to address the challenge of determining the solidity of thin nanofiber layers. The results show that the slip effect is enhanced as the testing pressure decreases, reducing pressure drop by less than 15% for microfiber filters and over 50% for nanofiber filters ≈100 nm. The enhanced slip effect at low pressures (i.e., relatively low pressure compared to the ambient environment) significantly improves filtration efficiency, especially for particles larger than 100 nm. It also proposes semi‐empirical equations for predicting filter performance in slip and transition flow regimes.
Keywords: air filtration, fibrous filter media, low‐pressure, nanofiber, slip effect
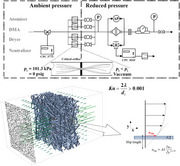
This paper investigates the slip effect by adjusting the air molecule mean free path, rather than varying fiber size as in previous studies. Using experimental and simulation methods, it examines the filtration performance of filters with fiber sizes from 16.2 µm to 0.084 µm under varied pressures, revealing how the slip effect enhances both permeability and particle filtration efficiency.
1. Introduction
Air filtration techniques have been applied in different scenarios, ranging from industrial clean rooms and residential or commercial HVAC systems to personal protective equipment such as N95 or FFP2 respirators, which have been of great concern in the past 4 years due to the COVID‐19 pandemic that started in 2019. Airborne aerosol dissemination has been considered an important transmission route for SARS‐CoV‐2 RNA,[ 1 , 2 ] and by implementing HEPA‐air filtration, airborne viruses can be effectively removed to levels below the qPCR limit.[ 3 ] The key to air filtration techniques lies in the filters. Fibrous filters, in particular, are recognized as the most cost‐effective solution for high‐efficiency filtration of submicron particles, due to their 3D fiber networks that trap aerosols while maintaining high air permeability.[ 4 ]
Filtration efficiency and pressure drop typically exhibit a trade‐off: increasing filtration efficiency often leads to higher pressure drop and energy costs, thereby no obvious improvement in the figure of merit (FOM = −ln (P)/Δp).[ 5 ] Nanofibers, however, offer a potential solution, providing high filtration efficiency with relatively low‐pressure drop due to their thin diameter and high specific surface area (typically spanning from 3 to 300 m2 g−1).[ 6 , 7 , 8 , 9 , 10 , 11 , 12 ] This enhances interception (R = d p/d f)[ 13 ] and diffusion mechanisms, ultimately improving FOM.
More importantly, as gas flows over a fiber, within the so‐called Knudsen layer with a thickness of the order of the gas molecular mean free path, the gas becomes rarefied, and velocity slip occurs. When the fiber size d f is close to the mean free path λ, that is the Knudsen number (i.e., ) is relatively large (Kn > 0.001), the slip effect from the Knudsen layer can be evident.[ 14 ] Many studies have mentioned that the slip flow at the nanofiber surface leads to reduced skin friction drag between the fluid and the fiber surface, which translates into lower pressure drop.[ 15 , 16 ] Meanwhile, the slippage gives the double benefit of enhancement in interception and diffusion effects.[ 17 , 18 ] However, most of these studies rely on replacing the zero tangential velocity boundary condition with a slip velocity proportional to the tangential stress for the Kuwabara flow field.[ 19 , 20 ] Few papers have verified and studied how the slip effect on the nanofiber filtration performance experimentally due to the difficulty in characterizing the physical properties of nanofiber filter media precisely.[ 21 , 22 ] Previous research, such as that by Zhao et al., suggested that the slip effect reduces pressure drop and improves FOM, especially for fibers with diameters close to λ.[ 23 ] However, maintaining consistent solidity (also known as fiber packing density or fiber volume fraction) or solidity inhomogeneity when fabricating nanofibers of different sizes is challenging, making it difficult to isolate the slip effect by simply adjusting fiber size. Additionally, their simulations, which were used to explain the experimental results, did not account for slip boundary conditions, and the fiber volume fraction was inconsistent. Hence, discerning whether the slip effect led to a reduction in the pressure drop is challenging. As the Knudsen number can also be changed by the gas molecular mean free path (i.e., , where µ, p, R, and T denote the fluid viscosity, pressure, gas constant, and temperature, respectively), some studies characterized the slip correction factor of nanoparticles as a function of the Knudsen number by adjusting the operating pressure ranging from atmospheric pressure down to 0.2 kPa.[ 24 , 25 ] Some filters may be operated at low‐pressure conditions when sampling at high altitudes such as in the upper troposphere,[ 26 ] or in some special processes such as the atomic layer deposition process in the semiconductor industry.[ 27 ] Bao et.al. proposed to verify the slip flow in nanofiber filter media (70 < d f < 500 nm) on pressure drop reduction at low‐pressure conditions to distinguish the interference from the inhomogeneity of the filters.[ 28 , 29 ] However, the mass flow rate during the testing was fixed, while the volume flow rate as well as the face velocity increased inversely proportional to the pressure. Therefore, the slip effect on the pressure drop could not be obtained directly. Their studies were limited to the discussion of the slip effect on flow resistivity, while the filter performance on the particle collection was not investigated. He et.al. experimentally studied the filtration performance of metal filters (d f = 1.24 µm) that are typically used in the semiconductor industry under low‐pressure operation. They found the maximum value of particle penetration changed significantly with the operating pressure. Liu et al. explored the impact of operational pressure on the filtration performance of electret filter media that contain fibers exceeding ten microns in size.[ 30 ] While these studies focused on examining filter performance in relation to pressure, an unresolved question remains regarding whether low pressure induces a similar reduction in pressure drop for filters featuring diverse fiber sizes. The influence of low pressure also extends to particle diffusion, potentially enhancing diffusion collection efficiency. Consequently, the slip effect around the fibers and its impact on filtration efficiency remains unclear.
Regarding the numerical simulation of nanofiber filter performance, two primary challenges remain accurate characterization of the thin nanofiber layer and the applicability of the slip model at a high Knudsen number. First, due to the limitations of the mechanical properties, the thin nanofiber layer could be easily crushed during the sample preparation to determine the thickness or porosity.[ 31 ] Second, most air filtration studies have been conducted under the assumption of the continuum flow regime. As the fiber size goes smaller, the classical Navier–Stokes equations with certain slip boundary conditions on the fiber wall, such as the well‐known Maxwell's slip velocity expression (0.001 < Kn < 0.25) can be employed to capture the flow behavior in the filter. Krish et al. stated the slip model can be applied in the early transition regime (0.25 < Kn < 1).[ 32 ] For cases where the Knudsen number is relatively high, indicating a free molecular regime (Kn > 10), such as air filtration with carbon nanotubes or under extremely low pressures,[ 33 ] the kinetic model based on Boltzmann equation or extended Navier–Stokes should be utilized instead. Maze et al. mentioned that the airflow field distribution from fibers can be negligible, and the particle filtration efficiency of nanofiber filters would be dominated by Brownian diffusion and interception.[ 34 ] However, in the transition regime (1 < Kn < 10), Maxwell's first‐order slip boundary was reported to overestimate the slip velocity.[ 35 ] To address this, modified first‐order slip boundary[ 16 , 36 ] or generalized second‐order slip boundary conditions[ 14 ] were proposed to simulate the flow, but these models have not been applied to nanofiber filter performance predictions.
In this study, distinguishing the uncertainties from the filter media, the slip effect on the filter performance (i.e., pressure drop and initial filtration efficiency) was investigated at low‐pressure operation. Using critical flow conditions, different orifices with specific sizes were used to fix the face velocity at ≈10.5 cm s−1 when adjusting the testing pressure. A calibrated and modified condensation particle counter (CPC, TSI model 3010) was used to monitor the particle number concentration upstream and downstream of the filter media at low pressures. Two microfiber filters with a mean fiber diameter of 3.93 and 16.2 µm, and four nanofiber filters with a mean fiber diameter in the range of 0.084–0.432 µm were selected for the experimental study. An image‐based regression method was proposed to solve the difficulty in determining the filter solidity of the nanofiber layers. To distinguish the slip effect's impact on filtration efficiency performance from other factors such as particle diffusion, three cases with controlled variables were simulated and subsequently compared to the experimental results. Semi‐empirical equations for predicting the filter performance in the slip flow and transition flow regimes are proposed. This research was undertaken to provide a more comprehensive understanding of how the slip effect influences the initial filtration performance of fibrous filters.
2. Results and Discussion
2.1. Characterization of Filters
The surface morphologies of the microfiber‐based filter (referred to as MF)) samples are shown in Figure 1a,b. The nanofiber layer of nanofiber‐based filters (referred to as NF) samples are shown in Figure 1c–f. The cellulose fibers in MF‐1 have irregular shapes and rough surfaces, while the melt‐blown fibers in MF‐2 and nanofibers in NF samples, were straighter and have regular shapes, and the fiber surfaces were smoother. The fiber size of the samples is summarized in Table 1 . Both filters MF‐1 and MF‐2 has a single‐layer structure, mean size of the fibers were 16.2 and 3.9 µm, respectively. The nanofiber membranes of NF‐1, NF‐2, and NF‐3 were sandwiched by two meshes, the mean nanofiber sizes were 0.432, 0.138, and 0.097 µm, respectively. The mean size of nanofibers coated on a substrate of NF‐4 was 0.084 µm. The cross‐sectional SEM images of MF‐2 were depicted in Figure 1g, and the measured thickness was 92.7 µm, and the estimated actual solidity was 15.0%. The tilted cross‐section of the nanofiber membrane of NF‐2 is shown in Figure 1h, and the corrected thickness was 0.979 µm. For filter NF‐2 where the nanofiber layer can be distinguished easily from the two support mesh layers with relatively large pore spaces, the solidity of its nanofiber layer was obtained using an image‐based regression method as depicted in Figure 2a (see Experimental Section for details). Due to multilayer fiber stacking, the solidity directly determined from the top‐view SEM images, denoted as multi‐layered solidity, tends to overestimate the actual solidity. To address this, we built a regression curve showing the relationship between multi‐layered solidity from the 2D top‐view image and actual solidity as depicted in Figure 2b, based on 3D virtual nanofiber filters. As the multi‐layered solidity of the NF‐2 nanofiber layer can be obtained from its segmented surface SEM images, which was 45.6% here, then its actual solidity was deducted as 6.0%.
Figure 1.
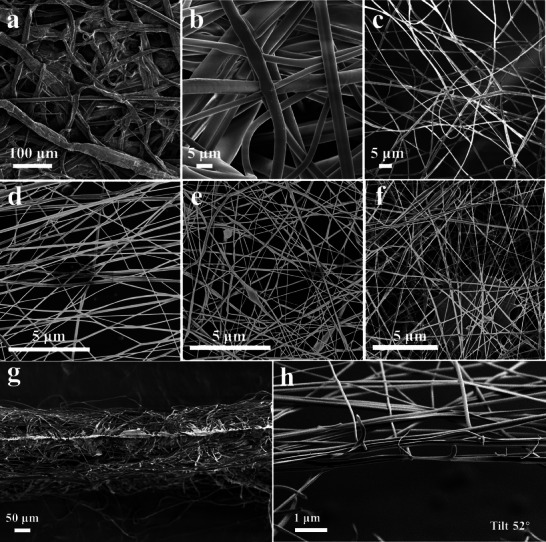
Top‐view SEM images of a) MF‐1 (d f = 16.2 µm), b) MF‐2 (d f = 3.93 µm), and the nanofiber layer of c) NF‐1 (d f = 0.432 µm), d) NF‐2 (d f = 0.138 µm), e) NF‐3 (d f = 0.097 µm), f) NF‐4 (d f = 0.084 µm). Cross‐section SEM image of g) MF‐2. Cross‐sectional SEM image of h) nanofiber layer of NF‐2 cut with FIB.
Table 1.
Fiber size features of the filter samples.
| Sample | Producer | Mean fiber size (µm) | ||
|---|---|---|---|---|
| Upper layer | Middle layer | Bottom layer | ||
| MF‐1 | FibrWay | N/A | 16.2 (7.7) a) | N/A |
| MF‐2 | 3M Corporation | N/A | 3.9 (0.9) | N/A |
| NF‐1 | POLLENTEC | 174.9 (17.3) | 0.432 (0.232) | 106.8 (9.0) |
| NF‐2 | SHEMA | 46.4 (3.4) | 0.138 (0.070) | 46.4 (3.4) |
| NF‐3 | PLASMAGEAR | 62.7 (1.7) | 0.097 (0.04) | 62.7 (1.7) |
| NF‐4 | AIRQUEEN | N/A | 0.084 (0.035) | 26.4 (3.4) |
Standard deviation in parentheses.
Figure 2.
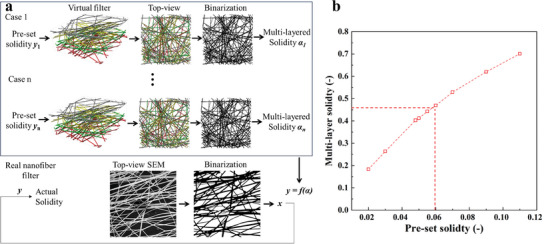
Determination of the solidity of nanofiber filter media. a) Schematic figure showing the image‐based regression method. b) Multi‐layered solidity from 2D top‐view image as a function of the pre‐set solidity of the 3D virtual filter.
The schematic diagram of the setup for testing the pressure drop and particle filtration efficiency of samples is shown in Figure 3 (see Experimental Section for details). As the presence of electrostatic charge on the fibers can significantly affect the particle penetration, interfering with our study on the slip effect, the electrostatic charges were fully eliminated with saturated isopropanol (IPA) vapor. The initial filtration efficiencies of the filters as a function of particle diameter at ambient pressure are shown in Figure 4a, wherein the efficiencies of the original filters and IPA‐treated (i.e., electrostatic charge removed) filters were represented by solid and hollow symbols, respectively. The testing face velocity was 5.35 cm s−1. In general, typical U‐shape curves were obtained for all the samples. After the treatment with IPA, the filtration efficiency at MPPS (most penetrating particle size) of MF‐2 from the 3M masks decreased, indicating this mask was made of electrostatic charge‐enhanced fibers. The efficiency of NF‐3 also decreased slightly. For the other samples, the filtration efficiencies were nearly unchanged. The most penetrating particle size (MPPS) of the IPA‐treated MF samples was ≈200 nm, while the MPPS of NF samples were ≈100 nm or even smaller due to the higher contributions from the enhanced interception effect.
Figure 3.

Schematic diagram of the testing setup for reduced pressure conditions.
Figure 4.
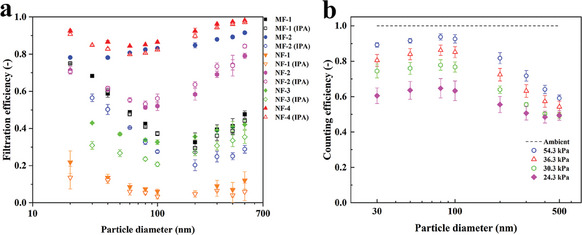
a) Initial filtration efficiencies of the filters at ambient pressure, b) counting efficiencies of CPC 3010 at low pressures.
2.2. CPC Counting Efficiency at Low Pressures
Before the filter performance testing, the counting efficiencies of the CPC 3010 (TSI, USA) at low pressures were evaluated as shown in Figure 4b. The efficiency was normalized by the counting efficiency of particles at ambient pressure, assumed to be 100%. The temperature difference between the saturator and condenser was set to 25 °C instead of the default value of 17 °C to improve the counting efficiencies at lower pressures.[ 37 ] Here, the counting efficiency is defined as Equation (1),
| (1) |
where C is the number concentration at a low‐pressure p; C 0 is the number concentration at ambient pressure p 0. Figure 4b demonstrates that the efficiency of CPC 3010 decreased gradually as the testing pressure dropped. At 24.3 kPa, the counting efficiency was only ≈0.6 times the ambient pressure value. The reduction in counting efficiency could be due to the higher internal particle losses on the CPC walls, and to particle losses when passing through the CPC upstream critical orifice due to turbulent deposition.[ 27 ]
2.3. Pressure Drop of Filters at Low Pressures
The flow behavior of nanofiber filters at low pressures was investigated and compared with the microfiber filters. The low‐pressure experiment's test conditions are detailed in Table 2 . The pressure drops were measured with clean filters, separate from the filtration efficiency testing. Instead of using a constant mass flow rate,[ 28 ] a constant testing face velocity was maintained at ≈10.5 cm s−1, following the NIOSH standard.[ 38 ] This adjustment in face velocity is crucial, as it significantly impacts the filter's pressure drop. To achieve this, four critical orifices ranging from 0.838 to 0.583 mm, together with a mass flow controller downstream of the filter holder, were utilized to attain absolute testing pressures of 54.3, 36.3, 30.3, and 24.3 kPa, respectively. Figure 6a displays the pressure drop tested at a constant face velocity, under various pressure conditions. As shown in Figure 6a1, the pressure drop is reduced with the decrease of the testing pressures. Here, the logarithmic x‐axis and y‐axis represent the absolute testing pressure and pressure drop across the filter media, respectively. For the MFs, the curves (back and blue dot lines) appeared flatter, whereas for the NFs, particularly those with the nanofiber ≈100 nm, the curves (pink, green, and red dot lines) were considerably steeper. To delve deep into the slip effect on filter pressure drop, as shown in Figure 6a2, the x‐axis was changed to refer to the Knudsen number reflecting the fiber diameter and testing pressure, and the pressure drops were normalized by the corresponding measured values at ambient pressure. According to the Knudsen number, the flow through the two MFs is of slip flow character (0.001 < Kn < 0.1), while the flow through the NFs is the transition flow regime (1 < Kn < 10). As the Knudsen number decreased by reducing the operating pressure, the pressure drop of the filters was reduced. At 24.3 kPa, the pressure drop of MF‐1 (d f = 16.2 µm) and MF‐2 (d f = 3.9 µm) decreased to 0.93 and 0.86 of the corresponding values at ambient pressure. For NF‐1‐containing nanofibers with a mean size of 432 nm, the pressure drop was reduced to 0.82 of its original value. It seems that its pressure drop curve showed a similar behavior as for MFs. This could be explained by the fact that the contribution of the nanofibers on the pressure drop was not dominant due to the low solidity of the nanofibers or sparse nanofibers (Figure 1c) in the nanofiber layer of the filter, which can also be reflected by the lower initial filtration efficiency as shown in Figure 4a. For the other NFs containing fibers with a size of ≈100 nm, the pressure drops were reduced sharply as the Knudsen number increased, to ≈0.4 of the tested values at ambient pressures. As the testing face velocity was fixed, this means the velocity slip around the fiber surface could exert a more pronounced impact on the flow resistivity of nanofiber filter media compared to microfiber filter media.
Table 2.
Test conditions for the low‐pressure experiments.
| Absolute pressure (kPa) | ≈99 | 54.3 | 36.3 | 30.3 | 24.3 |
| Orifice diameter (mm) | N/A | 0.838 | 0.711 | 0.635 | 0.584 |
| Gas mean free path (nm) | 65.7 | 129.7 | 161.0 | 212.4 | 252.8 |
| Mass flow rate (ls min−1) a) | 10.9 | 5.9 | 3.9 | 3.3 | 2.6 |
| Face velocity (cm s−1) | 10.5 | 10.5 | 10.5 | 10.5 | 10.5 |
Standard liters per minute referenced to 21.1 °C and 101.3kP absolute pressure.
Figure 6.
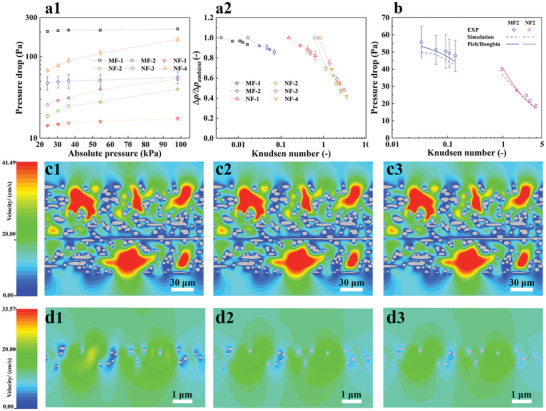
Pressure drop results of the filter samples. a1) The pressure drop tested under different pressure conditions, a2) normalized pressure drop as a function of the Knudsen number. b) Comparisons between simulated and experimental results of MF‐2 and NF‐2. Flow field inside the MF‐2 at c1) ambient pressure, c2) 36.3 kPa, and c3) 24.3 kPa. Flow field inside the NF‐2 at d1) ambient pressure, d2) 36.3 kPa, and d3) 24.3 kPa.
To confirm this, the flow behaviors in the MF‐2 and NF‐2 were further studied through numerical simulations. The computational domain and configurations of the boundary conditions can be seen in Figure 5 . The bulk flow behavior outside the Knudsen layer in the computation domain was simulated by solving the Navier–Stokes equations for steady and incompressible Newtonian fluid. In the cases for this work, assuming the fiber diameter as the characteristic length, the Reynold number was sufficiently small (Re ≪ 1), so the inertial term can be neglected, and the momentum balance equation was simplified into the Stokes equation as shown in Equation (2) to save computational cost,
| (2) |
where is the flow velocity (m s−1). Within the Knudsen layer around the fibers where the rarefaction effect is obvious, the gas velocity difference between the fiber surface and gas interface decreases (i.e., velocity slippage occurs). In cases for this work, the Knudsen number was relatively large due to the small fiber size and low‐pressure conditions, the modified Maxwell's first‐order boundary condition as shown in Figure 5 was used and modified to study the velocity slippage within the Knudsen layer on the bulk flow field,
| (3) |
is the normal direction to the fiber surface, denotes any direction such that , A λ defined as the slip length, and A is the slip coefficient, λ is the air molecular mean free path that varies with the testing pressure. For MF‐2 with Kn smaller than 0.1, A was 1, and Equation (3) can be simplified to Maxwell's slip model. Inspired by the assumption that the existence of a “molecular layer” surrounding the fiber inside of which the airflow is of molecular character. A was set to 0.8183 for NF‐2 with Kn larger than 0.25 (transition flow).[ 16 ] Using the calculated air molecular mean free path based on the tested absolute pressures listed in Table 2, Aλ was set as an input parameter to describe the flow velocity slippage around the fibers under different testing pressure conditions. The comparison between the pressure drops from simulated and experiments as a function of Knudsen number is shown in Figure 6b. With the modified slip model, the simulated values still agree well with the testing results even for the NF‐2 in the transition flow regime. Figure 6c,d separately depict the flow fields of MF‐2 and NF‐2 under different operating pressures (ambient pressure, 36.3 and 24.3 kPa from left to right figure). For the NF‐2 composed of nanofibers with a size close to the gas molecule mean free path, the bulk flow field became more uniform with the decrease in operating pressure of NF‐2. It is expected that the influence of the fiber arrays can completely disappear when the flow through the filter is in the free molecular flow.[ 34 ] While for the MF‐2 sample, the influence of velocity slip within the Knudsen layer on the bulk flow field was not so obvious, the bulk flow velocity distribution seemed unchanged when the operating pressure decreased, resulting in the reduction of overall pressure drop that was not as large as for the nanofiber filter sample.
Figure 5.
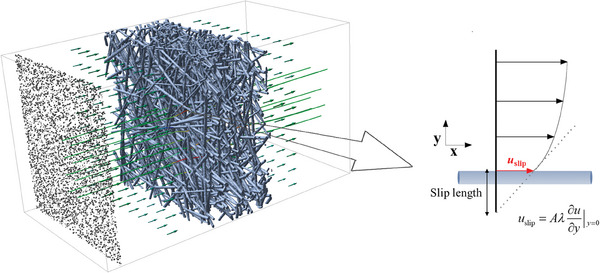
Schematic diagram of the filter computational domain and slip boundary configuration for the nanofibers.
In addition to the numerical simulation results, calculations from semi‐empirical equations were investigated and compared with the experimental data. Pich[ 15 ] summarized the empirical or semi‐empirical equations for the pressure drop as a function of operating pressure for the continuum, slip flow, and free‐molecule regions. Then for MF‐2 in the slip flow regime, the pressure drop is given as Equation (4),
| (4) |
where U 0 denotes the face velocity (m s−1); α denotes the solidity of a filter; t is the filter thickness (m). For NF‐2 in the transition regime, our previous work[ 39 ] by fitting simulation results considering the slip effect on the nanofiber surface with a nonlinear regression with a similar formula of Brown's equation gives
| (5) |
where Ku = −0.5ln α − 0.75 + α − 0.25α2is Kuwabara parameter, andA = 18.35(1 − α)2 − 3.79(1 − α). As shown in Figure 6b, the results from the above two semi‐empirical equations, represented by solid lines, agreed well with the experimental data and simulation results. Moreover, the above equations can also explain the experimental results shown in Figure 6a2, the normalized pressure drop decreased with the increase of Knudsen number and can be affected by the filter solidity as well.
2.4. Particle Filtration Performance at Low Pressures
2.4.1. Experimental and Numerical Simulation Results
The performance of the six fibrous media filtering sub‐micron particles was tested at a face velocity of 10.5 cm s−1 under different operating pressures. Two pneumatic solenoid valves were used to sequentially sample the aerosol flow upstream and downstream of the filter. A 30 s interval was applied after each valve switch to ensure flow and concentration stability. In each test, the efficiency for each particle size was calculated using Equation (13) (see Experimental Section). The measured filtration efficiencies as a function of particle diameter for filters MF‐2, NF‐2, and NF‐4 are plotted in Figure 7a1,b1,c1, respectively (results of the other samples can be found in Figure S1, Supporting Information). As illustrated in these figures, the discharged filter samples showed the typical U‐shape fractional filtration efficiency curves regardless of different fiber sizes and operating pressures due to the interactions between the increased influence of particle diffusion, interception, and inertial impaction. The most penetrating particle size (i.e., MPPS) of the filters was almost unchanged as the pressure was reduced. The fractional filtration efficiencies of the filter samples were significantly improved as the operating pressures decreased (or increased in Knudsen number). For a better description, their normalized particle penetrations are plotted in Figure 7a2,b2,c2 (results of the other samples can be found in Figure S1, Supporting Information). The tested penetrations were normalized by the corresponding results at ambient pressure. Similarly, the fractional penetrations of the filters decreased as the operating pressure was reduced. At 24.3 kPa, the penetrations at the MPPS of MF‐2, NF‐2, and NF‐4 decreased to ≈0.69, 0.67, and 0.37 of the corresponding penetrations at ambient pressure. The possible reasons explaining the improved filtration performance as the pressure decreased are: 1) Regardless of fiber diameter, the enhanced slip effect around the fiber surface makes the fluid flow streamlines closer to the fiber surface, and more particles following these streamlines can be captured by the interception effect; 2) The particle diffusion is enhanced at low pressures, especially for smaller particles of nanometer sizes; 3) The “slip” at the particle surface is enhanced, and whether this will affect the filtration efficiency is unknown.
Figure 7.
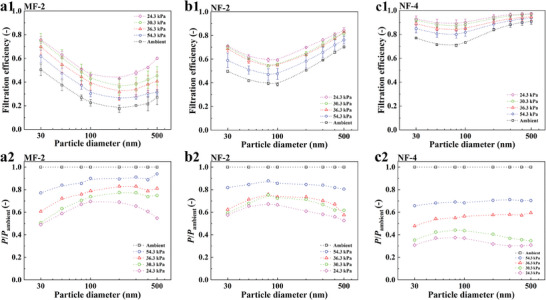
Filtration efficiency against particle diameters for filters a1) MF‐2, b1) NF‐2, and c1) NF‐4. Normalized particle penetrations against particle diameters of filter a2) MF‐2, b2) NF‐2, and c2) NF‐4.
To further depict the slip effect around the fibers on the filter performance, numerical simulations with different controlled variables of filter MF‐2 and NF‐2 were conducted separately (see Experimental Section for simulation details). The filtration efficiency results of three cases are shown in Figure 8 . The simulation results are shown by dashed lines, and the experimental data are shown by symbols. In case 1, we considered all the factors above that depend on the pressure, such as velocity slippage around the fiber, Brownian motion effect (i.e., diffusion), and Cunningham slip correction factor C C (see Equation (15) in Experimental Section) to correct the slip on the particle surfaces; In case 2, we fixed the slip length reflecting the slip effect around the fiber, while keeping the other conditions as in case 1; In case 3, we fixed the particle diffusivity and Cunningham factor C C, but we varied the slip length with the changing pressure. As shown in Figure 8a1,a2 of case 1, the experimental and simulated efficiencies of MF‐2 were in good agreement. The simulated efficiencies of NF‐2 were slightly higher than the experimental ones, which could be attributed to the non‐uniformity of the real samples as the nanofiber layer was only ≈1‐µm thick. However, the general trend of the data from both methods was consistent. Figure 8a2,b2 present the simulated results of case 2. As the operating pressure increased, the slip effect around the fiber surface would not change due to the fixed slip length. For particles with a size larger than 100 nm strongly affected by the interception effect, the fractional filtration efficiencies just increased slightly, much less than in case 1. For particles smaller than 100 nm, which were mainly diffused to the fibers, the overall data were close to the results in case 1. It can be concluded the enhanced slip effect was the main factor that improved the filter performance for larger particles (d p > 100 nm). The simulation results of case 3 are shown in Figure 8a3,b3. Contrary to case 2, the particle diffusivity and C C were fixed, but the increase in filtration efficiency for smaller particles was not as obvious as in case 1. But for larger particles, since the slip effect around the fiber was enhanced with the decreased operating pressure, the fractional efficiency curves showed the same shapes as in case 1. Therefore, the best agreement between experimental and numerical results is obtained for case 1 which includes the effects of flow slip, particle diffusion, and particle slip as the pressure is reduced.
Figure 8.
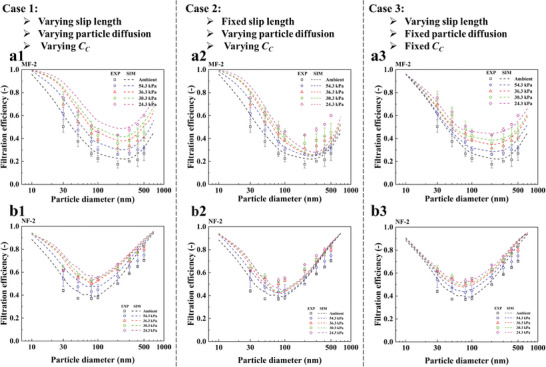
Simulated filtration efficiency results with different controlled variables. Simulated results of MF‐2 in a1) case 1, a2) case 2, a3) case 3. Simulated results of NF‐2 in b1) case 1, b2) case 2, and b3) case 3.
2.4.2. Regression Model Prediction
Using the experimental and simulation data of filter efficiency as a function of particle size and operating pressure conditions, semi‐empirical equations according to the Knudsen number reflecting the flowing regimes are proposed. For filter behavior in continuum and slip flow regime, the particle filtration efficiency as a function of particle diameter was investigated based on the single fiber theory of previous studies.[ 40 ] The filter penetration correlates with the total single‐fiber efficiency (E ∑) through,
| (6) |
where E Σ, defined as the ratio of particles collected by fiber to the total number of particles within the volume of air swept out by the fiber's geometry, is contributed from filtration efficiencies due to diffusion (E D), interception (E R), impaction (E I), and optional term (E DR) accounting for the interception of the diffusing particles.[ 13 ]
| (7) |
Then for the filter MF‐2 in the slip flow regime, the expressions accounting for diffusion and interception terms from Lee and Liu[ 41 ] were applied
| (8) |
| (9) |
where a 1 = 1, and a 2 = 1.6; R = d p/d f is the interception parameter, and d p is the particle size; Pe = d f U 0/D is the Peclet number, and D is the diffusion coefficient. As shown in Figure 9a, the calculated results with the modified semi‐empirical equations, depicted by meshes, agree well with simulation results, while the symbols representing experimental data closely align with the curves.
Figure 9.
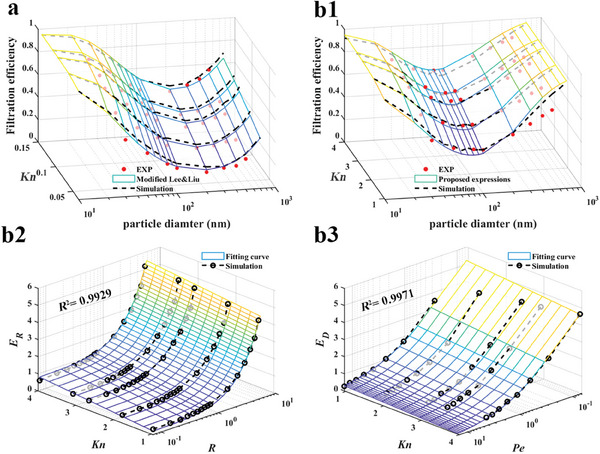
Regression of semi‐empirical equations. Filtration efficiency as a function of particle size and Knudsen number for filter a) MF‐2 and b1) NF‐2. Singe fiber efficiencies of filter NF‐2 contributed from b2) interception and b3 diffusion effects.
As mentioned above, most of the studies only focused on filter behaviors with Knudsen number <0.25. To get a semi‐empirical equation predicting the nanofiber filter NF‐2 in the transition flow regime, the penetration solely contributed by the interception or inertial impaction was obtained by numerical simulation. As the particle density is set as 0 kg m−3, and the Brownian motion term in Equation (15) (see Experimental Section) is dropped, the penetration solely contributed by interception (P R) can be obtained, and then the single fiber efficiency E R can be derived with Equation (6). Similarly, the penetration contributed by a combination of interception and impaction (P R ×P I) by dropping the Brownian motion term but with a particle density. Then P R and E D can be obtained with a combination of Equations (6) and (10). For simplicity, the enhancement filtration efficiency contributed by interception of the diffusing particles was not considered.
| (10) |
Based on the data from our numerical simulation, the non‐linear regression with similar functional forms as the semi‐empirical equation from Lee and Liu (E R) and Brown (E D) was proposed as follows,
| (11) |
| (12) |
where the obtained b 1, b 2, and b 3 equals 0.77, 0.24, and 0.21, respectively; c 1, c2 , and c3 equals 2.28, −0.08, and −0.67, respectively. Figure 9b2 shows the comparison between the simulation results (dashed lines) and empirical correlations on E R with respect to R and Kn (meshes), the R‐squared value is 0.9929. Figure 9b3 depicts the fitting results of E D as a function of Kn and Pe, and the R‐squared value is 0.9971. The R‐squared values are close to 1, demonstrating that the obtained regression equations agree well with the simulation results. Finally, Figure 9b1 illustrates that the calculated results obtained through semi‐empirical equations, depicted by meshes, align closely with simulation results. Additionally, the data points from experiments fall in proximity to the curves. The complete equations can be seen in Text S1 (Supporting Information).
2.5. Figure of Merit
The FOM of the filter samples is shown in Figure 10 . As expected, the FOM of the filters was improved as the operating pressure decreased due to the reduced pressure drop and improved particle filtration performance. The NFs showed higher FOM than the two microfiber filters. Filter NF‐2 showed the highest FOM regardless of the operating pressures. Except for filter NF‐1 of which sparse nanofibers had less impact on the overall performance, the increase in FOM of nanofiber filters was higher than for microfiber filters. For filtering larger particles, such as particles with a size of 300 nm, strongly affected by the enhanced slip effect as mentioned above, the FOM of MF‐1, MF‐2, NF‐2, NF‐3, and NF‐4 at 24.3 kPa were respectively improved by 165%, 175%, 243%, 297%, and 275% compared to the corresponding FOMs at ambient pressure.
Figure 10.
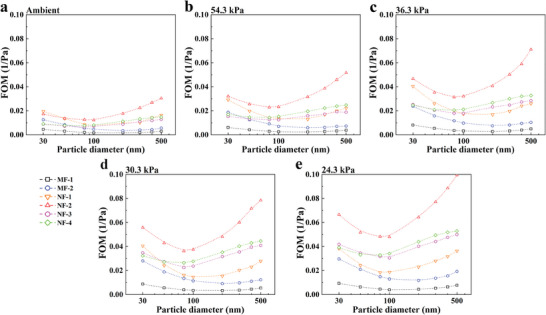
FOM of the filter media at different testing pressures.
3. Conclusion
In this work, the investigation of the pressure drop and initial particle filtration performance of fibrous media at various operating pressures provides valuable insights into the complex interplay between the slip effect around the fiber surface and filter performance. The pressure drop across the filters was observed to decrease with decreasing testing pressures, with distinct differences between microfiber (MF) and nanofiber (NF) media. The slip effect on pressure drop, analyzed through Knudsen numbers, revealed that MFs exhibited slip flow characteristics, while NFs, especially those with nanofibers ≈100 nm, demonstrated transition flow characteristics.
Numerical simulations using the modified Maxwell's first‐order slip model further confirmed the observed trends in pressure drop, aligning well with experimental results. The simulations highlighted the significance of slip effects, particularly in NFs with nanofibers with diameters close to the gas molecule mean free path. The influence of velocity slip within the Knudsen layer on the bulk flow field was more pronounced in NFs compared to MFs, elucidating the role of the nanofiber characteristics in governing fluid dynamics.
Moving on to particle filtration performance, the experiments demonstrated a notable improvement in fractional filtration efficiencies as the operating pressures decreased. The simulations further illustrated the impact of slip effects on filtration efficiency, with enhanced slip contributing to improved performance for sub‐micron particles with sizes larger than 100 nm regardless of fiber size. The semi‐empirical equations revealing the filtration efficiency as a function of particle diameter and Knudsen number for filters in the slip flow and transition flow regimes have been proposed based on experimental and simulation data.
Overall, the findings underscore the importance of considering slip effects and operating pressures in understanding and optimizing fibrous media for both pressure drop and particle filtration performance. This research contributes to the fundamental understanding of fluid dynamics in fibrous media and provides valuable insights for the design and improvement of filtration systems, by making use of numerical modeling and experimental filter performance measurements.
4. Experimental Section
Material and Sample Preparation
To fully understand how slip effect influences fibrous filter performance, a total of six filter media samples were prepared, incorporating two microfiber‐based and four nanofiber‐based filters. The sample MF‐1 composed of cellulose fibers, was prepared using the wet‐laid method (Fibr Way Co., Ltd). The middle melt‐blown layer of a commercial Procedure Mask (3M Corporation) was employed as another microfiber filter MF‐2. For nanofiber‐based filters, the sample NF‐1 was cut from a nano screen filter (POLLENTEC) for residential air filtration, in which an electro‐spun nanofiber layer was sandwiched by two protective meshes (See Figure S2a, Supporting Information). The samples NF‐2 (SHEMA) and NF‐3 (PLASMAGEAR) with a similar three‐layer structure (See Figure S2b,c, Supporting Information) as NF‐1 were taken from two commercial filter face masks, respectively. The sample NF‐4 (AirQueen) was from the middle layer of a face mask after removing the two outside spunbond fabrics. It had a typical structure where the nanofiber layer was supported by a microfiber‐based substrate (See Figure S2d, Supporting Information).
Filter Characterization—Filter Structures
The fiber diameter distribution of the nanofiber layer of the NF samples was measured from the surface SEM (Helios NanoLab G4 dual‐beam, FEI) images using a validated open‐source nanofiber diameter measurement software plugin (i.e., DiameterJ of ImageJ[ 42 ]). Images with a magnification of 5000 or 10 000 were selected to ensure enough fibers and high resolution. Due to the irregular shape of the fibers and compact structure where fibers often overlap each other in axial directions, the fiber size of MF samples was determined by manually measuring over 50 fibers in each image. The filter thickness was obtained from the cross‐sectional SEM images. Specially, to prevent the thin nanofiber layer from being crushed during the sample preparation, the cross‐sections were milled by being exposed under the patterned Focused Ion Beam (FIB). For the nanofiber layer of NF‐2, a voltage of 5 kV and a current of 26 pA were applied during the FIB process. More details of the method can be found in our previous work.[ 43 ]
With the fiber size and filter thickness obtained using the method above, the solidity of filter MF‐2 and NF‐2 were determined next. The solidity of MF‐2 consisting of microscale fibers was determined by matching the simulated pressure drop of the virtual filter with pre‐set solidity with the experimental result measured at ambient pressure.[ 13 ]
Filter Characterization—Solidity of Nanofiber Membrane
For the nanofiber‐based filter NF‐2, an image‐based regression method was used. As depicted in Figures 2a and 3D virtual filters with pre‐set solidities (y) were first generated using PaperGeo (M2M, Germany). Subsequently, the top‐view images of these virtual filters were captured. The solidity of each image (α) was determined by quantifying the number of black pixels representing the fibers on the corresponding segmented or binarized images using a Python code snippet. Similar to the SEM images, this solidity estimation may be inflated due to the superposition of fibers from multiple layers. To address this limitation, the regression of multi‐layered solidity and actual solidity was established. By obtaining the multi‐layered solidity from SEM images, the actual solidity of the real filter could be deduced. It was important to note that this method was particularly suited for thin nanofiber layers, where even fibers at the bottom of the filter can be identified in SEM images.
Pressure Drop and Particle Collection Performance at Low Pressures
Before the testing, the filter samples were discharged with saturated isopropanol for 12 h and dried in a fume hood for 2 h.[ 44 ] The schematic diagram of the setup for testing the pressure drop and particle filtration efficiency of samples under low‐pressure conditions is shown in Figure 3. In general, the front part mainly consisting of aerosol generation and particle size classification (by electrical mobility) was operated at ambient pressure conditions, while the rear part containing the filter holder for mounting the samples with an effective filtration area of 17.34 cm2 was at reduced pressures. The testing pressure was adjusted by a critical orifice operated at choked flow conditions (i.e., the gas velocity in the orifice was sonic velocity when the downstream‐to‐upstream absolute pressure ratio was smaller than 0.528).[ 45 ] To test the fractional efficiency, a standard method to generate monodisperse particles was followed.[ 13 ] The aerosols were generated by aerosolizing the 1 wt.% NaCl solution using a Collison‐type atomizer (TSI 3076, U.S.A). After passing through a diffusion dryer and Po‐210 bipolar charger, the polydisperse particles were size‐classified by a differential mobility analyzer (DMA) to obtain monodisperse particles in the range of 30–500 nm. The DMA was operated with a sheath flow rate of 5 L min−1 and an aerosol flow rate of 0.5 L min−1. The DMA sheath and excess aerosol flow rates were controlled by dedicated mass flow controllers. Then the selected particles from the DMA mostly carrying one electrical charge were charge‐neutralized by another Po‐210 neutralizer to give the particles a Boltzmann equilibrium charge distribution. A calibrated condensation particle counter (CPC 3775, TSI) upstream of the critical orifice was set to monitor the particle number concentration at atmospheric pressure. On the downstream side, four separate flow paths with specific critical orifices (O'Keefe Controls, U.S.A) were used in addition to the straight tube leg. This allowed us to fix the volumetric flow rate as well as the filtration face velocity while reducing the downstream pressure to specific values. A vacuum pressure gauge was used to monitor the real‐time testing pressure. Another modified and pressure‐calibrated CPC (CPC 3010, TSI) was used to measure the particle number concentration upstream and downstream of the testing samples at reduced pressure conditions, and the filtration efficiency E was given as in Equation (13),
| (13) |
where was the particle penetration (C down: downstream particle number concentration; C up: upstream concentration). The CPC 3010 was selected because of its simple design that was easy to modify for low‐pressure operation and to minimize the risk of flooding with the working fluid. The purge air inlet on the exhaust was blocked to achieve a stable operating pressure. The measured number concentration was corrected for coincidence error by the following equation,
| (14) |
where Ca and Ci were the corrected and indicated concentration (#/cm3), respectively. Qn was the nominated flow rate (L min−1), Qa was the actual flow rate (L min−1), and τp = 0.4 ms was the effective time each particle resided in the viewing volume. The pulse shape and height indicating the electronic signal of the photodetector were also checked to make sure an adequate signal‐to‐noise ratio could be achieved even at the lowest testing pressure (i.e., 24 kPa). To maintain a consistent sampling volumetric flow rate at various testing conditions (i.e., 0.92 L min−1), a vacuum pump with a working pressure below 10 kPa was used downstream of the CPC 3010, along with a critical orifice to maintain constant volumetric sampling flow rate for the CPC. The testing setup was controlled using a custom LabVIEW‐based (NI, U.S.A) program to configure the testing conditions such as the flow rates, and retrieve the data from the CPC and other sensors automatically.
Simulation of Filter Performance
The virtual fibrous structures of these filters were generated based on the filter characterization results, i.e., fiber size distribution, solidity, and thickness using PaperGeo (M2M, Germany) with a voxel‐based grid. Here, the term “voxel,” short for volume elements, refers to a type of Cartesian grid with a regular structure. According to the fiber morphologies shown in Figure 1, straight cylinders with specified size distribution were assumed to represent the synthetic fibers in the real filters. Fibers in the models were assumed to be isotropically distributed in the in‐plane direction and stacked homogeneously in the through‐plane direction.
In this work, the airflow and particle transport during the filtration process were simulated using the FilterDict‐Media module of the voxel‐based simulation software package GeoDict (M2M, Germany). With the obtained flow field with Equations (2) and (3), the particle transport under different testing pressures can be tracked by solving the motion governing equations considering the fluid drag, Brownian motion, and inertial impaction as shown in Equations (15) and (16)[ 43 ]
| (15) |
| (16) |
where was the friction drag, and wherein was the Cunningham slip correction factor for the slip effect on the particle surface? The electrostatic effect was not included to match the experimental conditions. For simplicity, a particle was considered captured by the filter when the distance between the centroid and fiber surface was detected as smaller than the particle radius. For each size, the motion of 1000 spherical particles with the same density as NaCl (2165 kg m−3) was tracked. Efficiency was quantified as the ratio of the captured particles to the total number introduced into the computational domain.
The computational domain and configurations of the boundary conditions can be seen in Figure 5. Periodic boundary conditions were utilized at the tangential planes parallel to the flow direction. Periodic boundary conditions were verified and used at the air inlet and outlet planes based on the structural characteristics of the fibrous filter.[ 46 , 47 , 48 ] The filter size was configured as 700 × 700 × thickness voxel3 and an empty region of 200 voxels thick was added upstream and downstream of the filter, respectively, to prevent flow channel closure. The voxel size for each case was determined by voxel dependence verification results (See Text S2 and Figure S3, Supporting Information for details). The particle injection plane was set 1 µm downstream from the inlet and particles would be reflected into the domain at the inlet plane to avoid small nanoparticles across the inlet due to the Brownian motion.
Conflict of Interest
The authors declare no conflict of interest.
Author Contributions
Z.P. performed conceptualization, methodology, validation, investigation, curated data, wrote the original draft, wrote the review and performed the editing, and created the visualization. Q.O. conducted the investigation, wrote the review and performed the editing. F.J.R. conducted the investigation, wrote the review and performed the editing. W.C. conducted the investigation, wrote the review and performed the editing. Y.L. conceptualized the project and provided supervision. D.Y.H.P. conceptualized the project, methodology, provided supervision, administered the project, and acquired the funding.
Supporting information
Supporting Information
Acknowledgements
The authors would like to thank the support of members of the Center for Filtration Research: 3M Corporation, Applied Materials, Inc., BASF Corporation, Boeing Company, China Yancheng Environmental Protection Science and Technology City, Cummins Filtration Inc., Donaldson Company, Inc., Entegris, Inc., Ford Motor Company, Freudenberg Filtration Technology, Guangxi Wat Yuan Filtration System Co., Ltd., LG Electronics Inc., Mann+Hummel, Math2Market, Midea, MSP Corporation, Parker Hannifin, Samsung Electronics Co., Ltd., Xinxiang Shengda Filtration Technology Co., Ltd., Shigematsu Works Co., Ltd., TSI Inc., W. L. Gore & Associates, Inc., and the affiliate member National Institute for Occupational Safety and Health (NIOSH).
Pan Z., Ou Q., Romay F. J., Chen W., Liang Y., Pui D. Y. H., Experimental and Numerical Investigation of Slip Effect on Nanofiber Filter Performance at Low Pressures. Small 2024, 20, 2406619. 10.1002/smll.202406619
Contributor Information
Zhengyuan Pan, Email: zpan@umn.edu.
Qisheng Ou, Email: qou@umn.edu.
Data Availability Statement
The data that support the findings of this study are available from the corresponding author upon reasonable request.
References
- 1. Zhou J., Otter J. A., Price J. R., Cimpeanu C., Meno Garcia D., Kinross J., Boshier P. R., Mason S., Bolt F., Holmes A. H., Barclay W. S., Clin. Infect. Dis. 2021, 73, e1870. [DOI] [PMC free article] [PubMed] [Google Scholar]
- 2. Greenhalgh T., Jimenez J. L., Prather K. A., Tufekci Z., Fisman D., Schooley R., Lancet 2021, 397, 1603. [DOI] [PMC free article] [PubMed] [Google Scholar]
- 3. Conway Morris A., Sharrocks K., Bousfield R., Kermack L., Maes M., Higginson E., Forrest S., Pereira‐Dias J., Cormie C., Old T., Brooks S., Hamed I., Koenig A., Turner A., White P., Floto R. A., Dougan G., Gkrania‐Klotsas E., Gouliouris T., Baker S., Navapurkar V., Clin. Infect. Dis. 2022, 75, e97. [DOI] [PMC free article] [PubMed] [Google Scholar]
- 4. Pan Z., Ou Q., Romay F. J., Chen W., You T., Liang Y., Wang J., Pui D. Y. H., Sep. Purif. Technol. 2023, 304, 122317. [Google Scholar]
- 5. Wang J., Kim S. C., Pui D. Y. H., J. Aerosol Sci. 2008, 39, 323. [Google Scholar]
- 6. Scaffaro R., Citarrella M. C., Macromol. Mater. Eng. 2023, 308, 2300072. [Google Scholar]
- 7. Lu T., Cui J., Qu Q., Wang Y., Zhang J., Xiong R., Ma W., Huang C., ACS Appl. Mater. Interfaces 2021, 13, 23293. [DOI] [PubMed] [Google Scholar]
- 8. Yang Z., Zhang X., Qin Z., Li H., Wang J., Zeng G., Liu C., Long J., Zhao Y., Li Y., Yan G., Small 2022, 18, e2107250. [DOI] [PubMed] [Google Scholar]
- 9. Zuo F., Zhang S., Liu H., Fong H., Yin X., Yu J., Ding B., Small 2017, 13, 1702139. [DOI] [PubMed] [Google Scholar]
- 10. Zhang S., Liu H., Zuo F., Yin X., Yu J., Ding B., Small 2017, 13, 1603151. [DOI] [PubMed] [Google Scholar]
- 11. Misslitz H., Kreger K., Schmidt H. W., Small 2013, 9, 2053. [DOI] [PubMed] [Google Scholar]
- 12. Shakil U. A., Hassan S. B. A., Yahya M. Y., Rejab M. R. M., Nanotechnol. Rev. 2022, 11, 1991. [Google Scholar]
- 13. Wang J., Tronville P., J. Nanopart. Res. 2014, 16, 2417. [Google Scholar]
- 14. Guo Z., Qin J., Zheng C., Phys. Rev. E Stat. Nonlin. Soft Matter Phys. 2014, 89, 013021. [DOI] [PubMed] [Google Scholar]
- 15. Pich J., J. Colloid Interface Sci. 1971, 37, 912. [Google Scholar]
- 16. Loyalka S. K., Petrellis N., Storvick T. S., Phys. Fluids 1975, 18, 1094. [Google Scholar]
- 17. Stechkina I. B., Kirsch A. A., Fuchs N. A., Ann. Occup. Hyg. 1969, 12, 1. [DOI] [PubMed] [Google Scholar]
- 18. Brown R. C., Air Filtration: An Integrated Approach to the Theory and Applications of Fibrous Filters, Pergamon Press, New York: 1993. [Google Scholar]
- 19. Yeh H.‐C., Liu B. Y. H., J. Aerosol Sci. 1974, 5, 191. [Google Scholar]
- 20. Chmielewski R. D., Goren S. L., Environ. Sci. Technol. 1972, 6, 1101. [Google Scholar]
- 21. Širc J., Hobzová R., Kostina N., Munzarová M., Juklíčková M., Lhotka M., Kubinová Š., Zajícová A., Michálek J., J. Nanomater. 2012, 2012, 327369. [Google Scholar]
- 22. Tan E. P. S., Lim C. T., Compos. Sci. Technol. 2006, 66, 1102. [Google Scholar]
- 23. Zhao X., Wang S., Yin X., Yu J., Ding B., Sci. Rep. 2016, 6, 35472. [DOI] [PMC free article] [PubMed] [Google Scholar]
- 24. Allen M. D., Raabe O. G., Aerosol Sci. Technol. 2007, 4, 269. [Google Scholar]
- 25. Kim J. H., Mulholland G. W., Kukuck S. R., Pui D. Y. H., J. Res. Natl. Inst. Stand. Technol. 2005, 110, 31. [DOI] [PMC free article] [PubMed] [Google Scholar]
- 26. Hermann M., Wiedensohler A., J. Aerosol Sci. 2001, 32, 975. [Google Scholar]
- 27. He M., Dhaniyala S., Wagner M., Aerosol Sci. Technol. 2016, 50, 417. [Google Scholar]
- 28. Bao L., Seki K., Niinuma H., Otani Y., Balgis R., Ogi T., Gradon L., Okuyama K., Sep. Purif. Technol. 2016, 159, 100. [Google Scholar]
- 29. Choi H.‐J., Kumita M., Seto T., Inui Y., Bao L., Fujimoto T., Otani Y., J. Aerosol Sci. 2017, 114, 244. [Google Scholar]
- 30. Liu Z., Chen D.‐R., Niu Q., Mensah D. A., Ji Z., Aerosol Air Qual. Res. 2023, 23, 220405. [Google Scholar]
- 31. Leung W. W. F., Hung C. H., Yuen P. T., Sep. Purif. Technol. 2010, 71, 30. [Google Scholar]
- 32. Kirsch A. A., Fundam. Aerosol Sci. 1978, 165. [Google Scholar]
- 33. Li P., Wang C., Zhang Y., Wei F., Small 2014, 10, 4543. [DOI] [PubMed] [Google Scholar]
- 34. Maze B., Vahedi Tafreshi H., Wang Q., Pourdeyhimi B., J. Aerosol Sci. 2007, 38, 550. [Google Scholar]
- 35. Zhang X., Liu J., Liu C., Process Saf. Environ. Prot. 2023, 174, 548. [DOI] [PMC free article] [PubMed] [Google Scholar]
- 36. Cercignani C., Cercignani C., The Boltzmann Equation, Springer, Berlin: 1988. [Google Scholar]
- 37. Mertes S., Schröder F., Wiedensohler A., Aerosol Sci. Technol. 1995, 23, 257. [Google Scholar]
- 38. Brown P., Cox C. L., Fibrous Filter Media, Woodhead Publishing, Sawston, Cambridge: 2017. [Google Scholar]
- 39. Kwak D.‐B., Lee S., Pan Z., Liang Y., Lee H., Pui D. Y. H., Sep. Purif. Technol. 2023, 324, 124585. [Google Scholar]
- 40. Lee K. W., Liu B. Y. H., Aerosol Sci. Technol. 2007, 1, 147. [Google Scholar]
- 41. Liu B. Y. H., Rubow K. L., Proc. 5th World Filtration Congress , Vol. 112, Nice, France: 1990. [Google Scholar]
- 42. Hotaling N. A., Bharti K., Kriel H., Simon C. G. Jr., Biomaterials 2015, 61, 327. [DOI] [PMC free article] [PubMed] [Google Scholar]
- 43. Pan Z., Zhang X., Sun Z., Jiang F., Lin L., Liang Y., Tang M., Wang J., J. Membr. Sci. 2021, 620, 118925. [Google Scholar]
- 44. Tang M., Thompson D., Chen S.‐C., Liang Y., Pui D. Y. H., Build. Environ. 2018, 141, 206. [Google Scholar]
- 45. Grace H., Lapple C. E., Trans. ASME. 1951, 73, 639. [Google Scholar]
- 46. Wang Y., Cai R., Chen L., Cai X., Chen R., Chen C., Ge G., Environ. Sci. Technol. 2018, 52, 8733. [DOI] [PubMed] [Google Scholar]
- 47. Gervais P. C., Bémer D., Bourrous S., Ricciardi L., Chem. Eng. Sci. 2017, 165, 154. [Google Scholar]
- 48. Azimian M., Kühnle C., Wiegmann A., Chem. Eng. Technol. 2018, 41, 928. [Google Scholar]
Associated Data
This section collects any data citations, data availability statements, or supplementary materials included in this article.
Supplementary Materials
Supporting Information
Data Availability Statement
The data that support the findings of this study are available from the corresponding author upon reasonable request.


