

Abstract
Intramuscular injection of botulinum neurotoxin type A (BoNT‐A) is commonly used to improve or maintain the joint range of motion in young children with spasticity. However, the effectiveness of BoNT‐A treatment is variable and movement limitations are recurrent. Here we show long‐term effects of a single, bilateral abobotulinumtoxinA (aboBoNT‐A) injection in the gastrocnemius medialis and soleus muscles of wild‐type and spastic (B6.Cg‐Glrbspa/J with a mutation in the glycine receptor) mice at a young age (6–7 days). Specifically, we evaluated the impact of aboBoNT‐A‐A on gait, physical performance, and spontaneous physical behavior, as well as on contractile force characteristics, morphology, and histological phenotype of soleus and gastrocnemius muscles by comparing their results to those of saline‐injected controls up to 9 weeks after the injection. The detailed time course of the study specifies the timing of the aboBoNT‐A injection at 1 week, the period of behavioral studies from 4–9 weeks, and the age of the mice (10 weeks) at the time of contractile force characteristics and histology assessments. In spastic mice, aboBoNT‐A injection had a minor and very specific effect on physical performance, by only modestly increasing stride length as a function of age. aboBoNT‐A injection caused a reduction in the force‐generating capacity and a slightly smaller physiological cross‐sectional area in gastrocnemius medialis, but not in soleus. Reduced physiological cross‐sectional area in aboBoNT‐A‐injected muscles was due to a lower number of muscle fibers, rather than reduced muscle fiber cross‐sectional area. The percentage of slow‐type muscle fibers and mitochondrial succinate dehydrogenase activity were increased, which was associated with an improved muscle endurance capacity. In conclusion, aboBoNT‐A injection reduced the number of muscle fibers, causing muscle hypertrophy in remaining fibers and a shift towards more oxidative fibers, resulting in an improved endurance capacity and gait. This study proposed potential cellular mechanisms for the therapeutic efficacy of aboBoNT‐A in spasticity.
Keywords: chemical denervation, gait, muscle endurance, muscle fiber typing, muscle oxidative capacity, physiological cross‐sectional area, plantar flexor muscles, sarcomeres
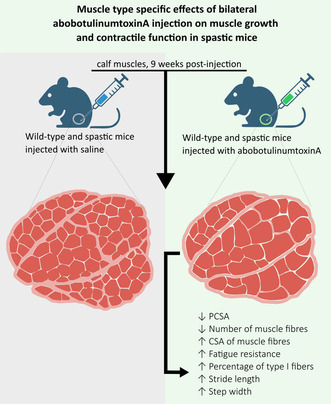
Wild‐type and spastic mice were injected into the calf muscle with saline or abobotulinumtoxinA to investigate its effects on muscle function and morphology. Nine weeks post‐injection, abobotulinumtoxinA altered muscle morphology and function in both types of mice, reducing physiological cross‐sectional area due to fewer muscle fibers. The percentage of slow‐type muscle fibers and mitochondrial succinate dehydrogenase activity increased, enhancing muscle endurance. These changes led to a slightly improved gait, suggesting potential cellular mechanisms for the therapeutic efficacy of abobotulinumtoxinA in spasticity.
Abbreviations
- aboBoNT‐A
AbobotulinumtoxinA
- ANOVA
Analysis of Variance
- AVD
Animal Welfare Guidelines
- BoNT‐A
Botulinum Neurotoxin Type A
- B6.Cg‐Glrbspa/J
A genetic mouse model with a mutation in the Glycine Receptor β‐subunit
- DAPI
4',6‐Diamidino‐2‐Phenylindole
- FDA
Food and Drug Administration
- GM
Gastrocnemius Medialis Muscle
- MHC
Myosin Heavy Chain
- PBS
Phosphate‐Buffered Saline
- PCSA
Physiological Cross‐Sectional Area
- SDH
Succinate Dehydrogenase
- SEM
Standard Error of the Mean
- SO
Soleus Muscle
- TL
Tibia Length
- WT
Wild‐Type
1. INTRODUCTION
Botulinum neurotoxin type A (BoNT‐A) is commonly used to chemically denervate muscles with the aim of achieving therapeutic efficacy in patients suffering from neuromuscular hyperactivity disorders such as spasticity. BoNT‐A inhibits temporarily the presynaptic release of acetylcholine in the neuromuscular junction and results in transient flaccid paralyzes in the target muscle. 1 , 2 Recovery of neurotransmission and gradual reduction in therapeutic efficacy generally occurs in 3–6 months after the injection. 3 There is evidence of early recovery (i.e., after 28 days) of neurotransmission that is induced by sprouting of new nerve endings. 3 , 4
The most common indicator for BoNT‐A efficacy in young children with cerebral palsy‐related spasticity is an improvement in ankle range of motion that otherwise shows hyper‐resistance in the plantar flexor muscles. 5 The hyper‐resistance is induced by overactivity of the stretch reflex, with or without enhanced muscle stiffness, and causes tip‐toe walking (also referred to as “equinus”). 6 , 7 Treatments to increase or maintain the ankle range of motion and to reduce pain aim to reduce the overactivity of the stretch reflex and to improve gait. 8 , 9 , 10 , 11 , 12 , 13
BoNT‐A is clinically used to reduce muscle overactivity, often in combination with serial joint casting or physical activity, to keep the muscles in a strained condition and prevent hyper‐resistance or to stimulate longitudinal growth of muscle fibers. 14 , 15 , 16 Treatment with BoNT‐A is the most promising at young age (i.e., below the age of 6 years). The most frequent age range for the use of BoNT‐A in children with spasticity is about 2–4 years, 8 , 9 but it can also be used in children younger than 1 year. 17
During development, skeletal muscles increase in size due to the growth of sarcomeres both in series and in parallel. 18 , 19 , 20 Satellite cell activation and myonuclear accretion are associated with postnatal muscle growth. 21 , 22 , 23 , 24 Muscles from children with spasticity have fewer satellite cells, which has been associated with impaired radial and longitudinal muscle fiber growth. 25 , 26 , 27 This latter has been suggested to be caused by a lag in the increased number of sarcomeres in series. Such limited longitudinal sarcomerogenesis in children with spasticity results often in shorter fascicles and a shorter gastrocnemius medialis belly length, while Achilles tendon length is increased. 28 , 29 , 30 , 31 , 32 , 33 , 34 , 35 Although interventions with BoNT‐A aim to stimulate longitudinal muscle fiber growth in spastic muscles, the effects of BoNT‐A on muscle growth during development have been barely studied.
Animal studies show secondary effects of BoNT‐A, such as decreased force‐generating capacity and muscle atrophy of targeted, agonistic, and/or synergistic muscles, accompanied by increased intramuscular connective tissue content. 36 , 37 , 38 Rodent muscles injected with BoNT‐A show a higher percentage of slow type I fibers in comparison to fast type II fibers. 39 , 40 , 41 , 42 Long‐term effects of BoNT‐A on contractile function of these structural adaptations are not well studied, and the link with physical performance, such as gait, remains unclear.
The aim of this study was to investigate long‐term effects of abobotulinumtoxinA (aboBoNT‐A) injection on soleus and gastrocnemius medialis muscle function and morphology in wild‐type mice and mice deficient in the beta subunit of the Glycine receptor (B6.Cg‐Glrbspa/J). Recently, comparison of physical movement behavior and muscle morphology of WT and glycine receptor subunit‐β‐deficient mice has shown how this genetic deficiency leads to spasticity with physical performance deficits, growth impairment, and reduced muscle strength, characteristics that closely resemble those seen in humans with spastic cerebral paresis and inherited spasticity. 43
This spastic mouse model's characteristics are likely the result of spasticity and secondary impairment of skeletal muscle growth (a model for spasticity 43 , 44 ). The soleus and gastrocnemius medialis were elected to quantify the effects of aboBoNT‐A as these muscles differ in geometry, phenotype, and function. The soleus is a parallel‐fibered muscle with a high oxidative capacity and its main function is to control posture. The gastrocnemius medialis, a highly pennate‐fibered muscle with both a high and a low oxidative muscle region is mainly involved in the push‐off during locomotion. Moreover, the performance, morphology, and phenotype of these muscles were shown to be affected in the spastic mouse model. 43 We injected aboBoNT‐A or saline in mice 6–7 days of age and studied the development of motor function, gait, as well as physical activity between 4 and 9 weeks of age. Ten weeks after aboBoNT‐A treatment, we harvested these muscles to study in situ contractile function, as well as their morphology and histological phenotype in aboBoNT‐A or saline‐injected wild‐type and spastic mice.
2. MATERIALS AND METHODS
2.1. Animals
All experiments were approved by the Dutch Central Committee on Animal Experimentation and in strict agreement with the guidelines and regulations concerning animal welfare recommended by the Dutch law (AVD112002016772).
Mice carrying a spontaneous mutation in the LINE‐1 element insertion of the glycine receptor ß‐subunit 45 were obtained from a cryopreserved stock at Jackson laboratories (Stock 000066; B6.Cg‐Glrbspa/J; Bar Harbour, ME, USA). The colony was maintained on a C57Bl/6J background (Charles River Laboratories, L'Arbresle, France; European supplier of Jackson Laboratories) in the local animal facilities, and was backcrossed to C57Bl/6J at least every 3rd generation. Experimental homozygous Glrbspa mice and wild‐type littermate controls (WT mice hereafter) were obtained by breeding heterozygous carriers. At the age of approximately 2 days toe tissue samples were taken for genotyping, and mice were weaned at the age of 3–4 weeks. As described previously, 43 there is considerable variability in the viability of homozygous Glrbspa mice, which is noticeable by extremely small body size and low body weights at the age of 1 to 2 weeks, and premature death before 4 weeks of age. Both during breeding and experiments, mice were maintained at a 12‐h light/dark cycle, ~50% humidity, and room temperature between 19–22°C. Water and food were available ad libitum.
2.2. Study design
At 6–7 days of age, animals were injected bilaterally with 1.2 units of abobotulinumtoxinA (Dysport®; Ipsen Limited, Wrexham, UK) dissolved in 5 μL of saline, or only with vehicle (5 μL saline). The gastrocnemius was palpated and using a microscope the muscle was injected at about a 45‐degree angle. To determine the appropriate injection volume and ensure homogeneous muscle permeation, we conducted pilot studies using different volumes of saline mixed with Evans blue. This allowed us to observe the distribution of the solution within the hind limbs. For the study, we selected a volume that was sufficient to permeate both calf muscles completely, without excessive diffusion beyond the targeted area (i.e., superficial posterior compartment of the leg).
After BoNT‐A injections, the pups exhibited significant motor deficits. They displayed clear signs of neuromuscular blockade, such as dragging their hind paws and an inability to use their hind limbs for crawling. Instead, their hind limbs hung passively behind their bodies, indicating effective denervation. As described, between birth at ~4 weeks of age pups carrying the spastic mutation died prematurely, 43 and there was no difference between these expected premature deaths between saline and aboBoNT‐A‐injected pups. Ultimately, for spontaneous behavior analyses and performance measurements, we used all available 28 WT (saline n = 14/aboBoNT‐A n = 14) and 24 spastic mice (saline n = 12/aboBoNT‐A n = 12), 28 of the 52 mice were male. For in situ measurements and tissue analyses we used 29 WT (saline n = 15/aboBoNT‐A n = 14) and 24 spastic mice (saline n = 12/aboBoNT‐A n = 12), these experiments contained 29 males.
In this study, we chose abobotulinumtoxinA due to its well‐documented efficacy and safety profile. AbobotulinumtoxinA is widely used across Europe, including the Netherlands, for treating spasticity, particularly in the lower legs. 46 In addition, greater amounts of active neurotoxin are injected with Dysport®, at FDA‐approved doses, than with other forms of the neurotoxin. 47
2.3. Spontaneous behavior
Mice were individually housed in a PhenoTyper automated home‐cages for 3 days as described before, with access to water, food, and a shelter, without human intervention. 48 With respect to spontaneous behavior in the first 3 days in the PhenoTyper, six categories of behavioral parameters were defined as described below and were analyzed using AHCODA™ (Sylics, Amsterdam, the Netherlands) with respect to temporal aspects, as previously described. 48
2.4. Neurological score and righting reflex
The neurological score was adapted from a scoring system originally developed to score the progression of a mouse model of amyotrophic lateral sclerosis. 49 For the neurological score, three items were scored; extension reflex, curling toes, and tremor. A more detailed description of the methods applied to score these variables is provided in Rivares et al. 43
2.5. Grip strength measurements
The neuromuscular function was assessed by measuring the peak force (N) mice exerted in grasping a pull bar being connected to a force transducer (1027DSM Grip Strength Meter, Columbus Instruments, Columbus, OH, USA). Mice were allowed to grasp the pull bar five times with front paws only, followed by grasping five times with front and hind paws.
2.6. Motor coordination
The motor coordination was assessed using an accelerating rotarod (Roto‐rod series 8, IITC Life Science, Woodland Hills, CA, USA). In the first week of testing, on the first day mice performed two habituation trials of 120 s (acceleration from 0 to 20 rpm in 120 s) followed by three trials (acceleration from 0 to 40 rpm in 180 s), and five trials on the second day. During subsequent testing weeks (i.e., 4th, 6th, and 9th postnatal week), the assessment on the rotarod consisted of five trials (acceleration from 0 to 40 rpm in 180 s).
2.7. Gait analysis
Gait measurements were recorded and analyzed using the CatWalk system (Noldus IT, Wageningen, the Netherlands). Mice were introduced to the CatWalk system on day 1 for habituation, and on the second day mice were tested. The CatWalk system produces dozens of parameters that were all assessed during the analyses. For reporting purposes, a selection of readouts was taken that had also been shown to display genotype differences between WT and spastic mice in a previous study 43 : (1) maximum contact area, that is, maximum area of a paw in contact with the glass plate, (2) intensity of a print (ranging from 0 to 255), that is, the degree of contact between a paw and the glass plate (which increases with weight), was used to measure weight, (3) print length and width, that is, the horizontal and vertical direction, respectively, of the complete paw print. The complete print is the sum of all contacts with the glass plate, as if the animal's paw would have been inked, and print area is the surface area of the complete print, (4) stride length, defined as the distance between successive placements of the same paw, and (5) the base of support, that is, the mean distance between either front paws or hind paws.
2.8. Surgery and preparation for in situ muscle function measurements
Mice received 0.1 mg·kg−1 Temgesic® (Buprenorphine, Reckeitt Benckiser, UK) 20 min prior to anesthesia with 4% isoflurane. During surgery, isoflurane levels were maintained at 0.5–2.0%, and body temperature at 35°C. The lower leg was placed in a self‐irrigating humidifier with a constant temperature of 35°C and a humidity of 80%–90% to avoid dehydration.
Soleus and gastrocnemius medialis muscles were dissected free from surrounding tissue and from distal insertion leaving blood supply and innervation intact. 43 Cuff electrodes were placed around gastrocnemius medialis and gastrocnemius lateralis branches of the tibial nerve, to stimulate the muscles. The femur was fixated at the distal condyle by a clamp.
2.9. Experimental setup and in situ muscle force measurements
We assessed the following contractile force characteristics: (a) length‐force relationship, (b) rate of maximal force development, (c) frequency‐force relationship, and (d) fatigability. Contractions for all protocols were induced by supramaximal electrical stimulation of gastrocnemius medialis and gastrocnemius lateralis branches of the tibial nerve for either soleus or gastrocnemius medialis muscle, respectively. The distal end of the Achilles tendon was attached to a custom‐made servo‐controlled motor arm using a force transducer (miniature strain gauge transducer, Honeywell International Inc., Morrice Township, New Jersey, USA). The amplitude of the electrical current for optimal stimulation (in mA) was firstly determined (DS3 Isolated Current Stimulator, Digitimer, Hertfordshire, UK), and further experiments were performed at this amplitude. All contractions were performed with 2‐min intervals.
For the assessment of the length‐force relationship, tetanic contractions (150 Hz, 300 ms) were evoked at increasing muscle lengths (0.5 mm stepwise increase). Each tetanus was preceded by two twitches, to allow adjustment of muscle length. Muscles were lengthened to about 1 mm over their optimum length. Muscle and muscle‐tendon complex length were calculated by measuring the distance between the markers placed on the proximal and distal parts of the muscle, as well as on the distal part of the tendon on the images made with a Panasonic HC‐V720 camera. Passive muscle force as a function of muscle length was obtained by the mean force between the second twitch and the tetanus and was fitted using a two‐term exponential function (Equation 1). Active muscle force was calculated by subtracting passive force at each muscle length from total muscle force. The active length‐force was fitted by a polynomial function (Equation 2).
| (1) |
| (2) |
In Equations (1) and (2), b 0 to b n represent constants determined by the least square fitting procedure. To select the polynomial order that describes the length‐force relationship most adequately, fits between a 2nd and a 5th order were tested using one‐way ANOVA. The lowest polynomial order that yielded a significant improvement in the length‐force fit was selected. Muscle optimum length and muscle active slack were defined as the muscle lengths at which the maximum of the polynomial was encountered, and the intercept of the fitted curve with the x‐axis, respectively.
The rate of maximal force development (i.e., the rate at which the active force went from zero to maximal active force) was determined by applying a 400 Hz, 150 ms pulse train. The rate of force developed at 50% of the time to maximal force was further used for the analysis, as well as this value normalized (by maximal force) values.
Calcium sensitivity in soleus and gastrocnemius medialis (i.e., frequency‐force relationship) was assessed by electrical muscle stimulation over a range of frequencies (i.e., 5–250 Hz) during 300 ms at muscle at optimum length. The force‐frequency relationship was obtained by subtracting mean passive muscle force from total force and dividing total force at each frequency by maximal force.
To test fatigue resistance, soleus, and gastrocnemius medialis muscles were stimulated once every second for 2 min (soleus: 330 ms pulse train at 100 Hz, gastrocnemius medialis: 150 ms pulse train at 30–80 Hz, a frequency corresponding with that evoking 40% of optimum force). Fatigability was assessed by calculating the decrease in active muscle force at the end of the series of contractions and expressed as percentage of the maximal force obtained during the protocol. Matlab scripts were used for evaluation of the force data, (version R2018a, The MathWorks, Inc., Massachusetts, USA).
Mice were sacrificed by an overdose of 20% Euthasol® injected intracardially. Plantar flexor muscles together with tibialis anterior were carefully removed and aligned according to their muscle fiber arrangement at a length near slack length and by pinning the proximal and distal tendons to a piece of wooden rail with a Ø 0.14 mm needle tips (Seirin Corporation, Shizuoka, Japan). The right muscles were frozen in liquid nitrogen. The left muscles were fixated in 4% formaldehyde and stored at room temperature.
2.10. Morphometric analyses
Serial numbers of sarcomeres were determined in muscle fibers from fixated soleus and gastrocnemius medialis muscles. Four proximal and four distal muscle fibers were isolated and mounted on glass slides with 50% glycerol, covered with a coverslip, and sealed with nail polish as described previously. 50 Images were taken of every single fiber using a bright field microscope and a 10× objective (Axioskop 50 microscope, Zeiss). For assessment of the serial number of sarcomeres, muscles were dissected from the mid‐longitudinal plane, and most proximal and distal fibers were randomly taken from very small bundles at the most proximal and distal sites of this plane of analysis. This method ensured a representative sample of muscle fibers from each muscle. Detailed methodology and a representative image of the muscle fiber's integrity after isolation can be found elsewhere. 43 The number of sarcomeres per muscle fiber was calculated by dividing the measured muscle fiber length by the mean sarcomere length within the respective muscle fiber 51 using Matlab scripts for calculation of number of sarcomeres in series (version R2018a, The MathWorks, Inc., Massachusetts, USA). Optimum muscle fiber length was calculated by multiplying the number of sarcomeres in series with the optimum sarcomere length (i.e., 2.2 μm). Physiological cross‐sectional area was estimated by dividing muscle volume by fiber length. Muscle volume was obtained by dividing muscle mass by muscle tissue density (i.e. 1.0597 mg∙mm−3). 52 The tendon length at optimum muscle length was obtained from the images taken during length‐force measurements by subtracting muscle belly length from gastrocnemius medialis muscle‐tendon complex length at optimum length.
2.11. Cryosectioning and Histology
Serial cross‐sections (10 μm) were cut from the mid‐belly of soleus and gastrocnemius medialis using a cryostat (Adamas, MICROM HM 550) at −20°C. Sections were mounted on glass slides (Menzel‐Gläser, superfrost® plus, Germany), air dried, and stored at −80°C until further use.
2.12. Succinate dehydrogenase activity
After cryosectioning, muscle sections were dried for 15 min after which they were stained for succinate dehydrogenase (SDH) as described previously. 53 SDH activity was expressed as the absorbance at 660 nm, per section thickness per second of incubation time (ΔA660·μm−1·s−1). The spatially‐integrated SDH activity was obtained by multiplying SDH activity by muscle fiber cross‐sectional area.
2.13. Immunohistochemical staining of myosin heavy chain isoform expression
Serial sections of soleus and gastrocnemius medialis were immunohistochemically stained for type I, IIA, IIB, and IIX myosin heavy chain (MHC) using primary monoclonal antibodies BAD5 (1 μg·mL−1), SC‐71 (1 μg·mL−1), 6H1 (10 μg·mL−1), and BF‐F3 (1 μg·mL−1) (Developmental Studies Hybridoma Bank, USA), respectively using a double myosin fluorescence staining method. 43 , 54 Sections were blocked with 10% normal goat serum for 60 min. Sections were incubated with a cocktail of two primary antibodies for 60 min. Subsequently, sections were washed in phosphate‐buffered saline (PBS) for 3 × 5 min, and incubated in the dark with a cocktail of two secondary antibodies Alexa Fluor IgG2b 647/IgM 488, IgG1 488/IgM647 (Life Technologies, the Netherlands) for 60 min. After washing, sections were incubated with wheat germ agglutinin (Texas red‐WGA, 1:50, Life Technologies, the Netherlands) for 20 min, and washed. Finally, sections were mounted within Vectashield®‐hardset mounting medium with 4′,6‐diamidino‐2‐phenylindole (DAPI; 1.5 μg·mL−1, Vector Laboratories, USA). Images of the gastrocnemius medialis were captured at 10× and images of the soleus at 20× magnification using a CCD camera (PCOl Sensicam, Kelheim, Germany) connected to a fluorescence microscope (Axiovert 200 M; Zeiss, Göttingen, Germany) with image processing software Slidebook 5.0 (Intelligent Image Innovations, Denver, Colorado). Muscle fiber type (MHC) was identified for as many fibers as possible. Hybrid fibers were taken into account, however, since the percentage of these was very low (mean < 5%) we did not perform statistics on these values.
Muscle fiber cross‐sectional area was manually measured using ImageJ (version 1.4.3.67, National Institutes of Health, Bethesda, MD) of more than 50 fibers per muscle. For soleus, no distinction between muscle fiber types was made to determine the muscle fiber cross‐sectional area, while for gastrocnemius medialis muscle fiber cross‐sectional area was determined in high and low oxidative regions making a distinction between muscle fiber types. As in the low oxidative region most fibers were type IIB fibers, only the cross‐sectional area of these was measured. The public domain software ImageJ (version 1.52e, US National Institutes of Health, Maryland, USA) was used to assess the myofiber type and fiber CSA.
2.14. Quantification of intramuscular connective tissue
Intramuscular connective tissue was determined and quantified as described previously. 43 , 55 In short, sections were air‐dried for 10 min and fixed with acetone for 10 min at −20°C. Subsequently, the sections were fixated with Bouin for 30 min and stained in Sirius Red saturated with picric acid for 30 min. After the sections were washed in 0.01 M HCl, they were rinsed in ethanol and in xylene, and mounted within Entellan® (Merck, the Netherlands). Unless otherwise stated, all images were taken using a bright field microscope and a 20x magnification using a CCD camera (PCOl Sensicam, Kelheim, Germany) connected to a fluorescence microscope (Axiovert 200 M; Zeiss, Göttingen, Germany) (Axioskop 50 microscope, Zeiss). In the images, the contrast between cytoplasm (yellow) and the red stained connective tissue was enhanced by filtering the image with a green filter (i.e., using the same filter values for each image) using ImageJ (version 1.52e, US National Institutes of Health, Maryland, USA). The images were converted into binary images, so that red areas in the cross‐section were coloured with black.
The endomysium, which is the connective tissue surrounding a single muscle fiber, was quantified by selecting ten regions within the muscle cross‐section containing only endomysium and muscle fibers. Black areas within the selected areas represent the absolute endomysial area. Absolute endomysium per muscle fiber was calculated by dividing the absolute endomysium area by the number of muscle fibers in the selected region. Mean perimeter of muscle fibers was calculated based on the fiber cross‐sectional area. Endomysium thickness (le) was calculated by dividing the absolute endomysium by the perimeter length.
The thickness of three domains of perimysium were also measured separately: thickness of connective tissue surrounding the smallest muscle fiber fascicles, thickness of connective of larger fascicles that contain several primary fascicles, and thickness of connective tissue which did traverse the cross‐section (traversing the cross‐section, i.e., neuro‐vascular tracts). The thicknesses of three domains of perimysium was measured every 25 μm for at least five fascicles over a length of 1 mm. The public domain software ImageJ (version 1.52e, US National Institutes of Health, Maryland, USA) was used to assess the quantity of endomysium, perimysium.
2.15. Myonuclear density and satellite cell number per muscle fiber
To quantify myonuclear density and muscle stem cell number per muscle fiber, sections were co‐stained with DAPI and anti‐Pax7 antibodies. 43 , 56 Sections were fixed in 4% formaldehyde in PBS for 10 min, washed with PBST, and blocked in 10% normal goat serum in PBS for 30 min. Subsequently, sections were incubated in 0.1% bovine serum albumin‐PBS solution containing 4 μg·mL−1 Pax7 antibody (Developmental Studies Hybridoma Bank, USA) in the dark for 60 min, washed in PBST, incubated with Alexa Fluor 488 (1:500, Molecular Probes, Life Technologies) goat anti‐mouse secondary antibody (Invitrogen, Breda, The Netherlands) and washed with PBST. Then sections were incubated in the dark for 20 min with Texas red‐WGA (1:50) conjugate (Invitrogen, Breda, The Netherlands) and washed with PBS. Finally, sections were mounted within Vectashield®‐hardset mounting medium with DAPI (Vector Laboratories, USA). The number of myonuclear fragments per muscle fiber cross‐section was manually counted in an average of 50 fibers in soleus and 60 in gastrocnemius medialis, while muscle stem cell fragments per muscle fiber cross‐section were counted throughout the cross‐section. To calculate the number of myonuclei (Mn) within a length part of a muscle fiber, we used Equation (3), as suggested in Ref. [57].
| (3) |
where N n,s is the counted myonuclei per fiber cross‐section, L f is the muscle fiber length, and D s is the thickness of the cross‐section (i.e., 10 μm). Based on a previous study, 10 μm was taken as the length of mouse myonuclei. 56 As the length of the myonuclei was similar to the thickness of the cross‐sections, and myonuclear fragments of 1 mm length were visible, the sectioning was considered to divide a myonucleus into two parts, which implies that any nucleus is visible in two consecutive sections. In order to correct for multiple counting of nuclei, the number of nuclei per cross‐section was divided by two. The myonuclear domain was obtained by dividing the fiber cross‐sectional area by the myonuclei per 1 mm of fiber length. Number of muscle stem cells is reported as counted number of muscle stem cell fragments per muscle fiber cross‐section of soleus and gastrocnemius medialis muscles.
2.16. Statistics
Data were tested for normality and homogeneity and in case assumptions were not met, data was transformed (i.e., (natural)‐ log, exponential, or square‐root transformation).
Three‐way mixed ANOVAs (treatment*group*sex*length or frequency) were used to test the length‐force and force‐frequency relationships. Three‐way multivariate ANOVA (treatment*group*sex*fiber type) was used to analyze the MHC and SDH parameters. Three‐way ANOVAs (treatment*group*sex) were used to test all other parameters, in case effects of sex could not be tested, a 2‐way ANOVA was used (treatment*group). Interaction effects and group, as well as sex main effects, were explicitly described within the figures when present. Interaction effects (when including the effect of treatment) were described in the text if present, otherwise, only treatment main effects were reported.
Statistical analyses were performed using SPSS (IBM SPSS statistics 25, New York, USA) and in R (3.6.3). Effects were considered significant at p < .05. Data are presented as mean ± SEM.
3. RESULTS
Note that in the written part of the results section, we have chosen to highlight the effects of aboBoNT‐A. Differences between spastic and wild‐type mice, and between sexes are summarized in the figures and tables.
3.1. Body mass and tibial length
AboBoNT‐A and saline‐injected mice had similar body mass during development, which increased at the same rate in two groups (Figure 1A,B). At 10 weeks of age, tibial bone length did not differ between AaoBoNT‐A and saline‐injected controls (Figure 1C).
FIGURE 1.

Effects of aboBoNT‐A on body growth. (A) Body weight of male mice during development. (B) Body weight of female mice during development. Note that for assessment of the number of sarcomeres was used for further assessment, but due to the time‐intensive nature of the muscle contraction measurements study, only one mouse could be measured per day, resulting in a lower number of mice being assessed. (C) Tibia length at 10 weeks of age. Results are reported as mean ± SEM. *Significant differences (p < .05) between saline and treated mice, #Significant differences between WT and spastic mice, and $Significant differences between male and female mice. AboBoNT‐A and saline‐injected mice had similar body mass, comparable rates of increase of body mass and tibial bone lengths during development.
3.2. Motor function
AboBoNT‐A and saline‐injected spastic animals exhibited similar activity on the rotarod (i.e., the speed at which mice fell from the rotarod) (Figure 2A). The two groups also did not differ in grip force, which increased in both groups during development (p < .0001; Figure 2B). At all ages, the neurological score of the saline‐injected spastic mice was higher than that of the wild‐type mice, aboBoNT‐A injection did not alter this. The neurological score remained constant during the first 10 weeks of development.
FIGURE 2.

Effects of aboBoNT‐A on motor function and spontaneous behavior. (A) Rotarod performance of male and female mice. (B) Grip strength of front and hind limbs together of male and female mice. (C) Activity time during light of male and female mice. (D) Activity time during dark of male and female mice. (E) Shelter time during dark of male and female mice. (F) Long distances displacement velocity of male and female mice. Results are reported as mean ± SEM. *Significant differences between saline and treated mice, #Significant differences (p < .05) between WT and spastic mice, and $Significant differences between male and female mice. AboBoNT‐A and saline‐injected mice showed similar motor function and activity levels, with no significant differences in rotarod performances, grip forces, or home cage activity parameters. The neurological scores remained unchanged by aboBoNT‐A injection.
3.3. Home cage activity
The active time in the dark increased similarly during development for all mice (p < .0001). Physical activity during light and dark phase, as well as time in shelter during dark phase, was not affected by aboBoNT‐A injection (Figure 2C–E). AboBoNT‐A and saline‐injected mice showed similar displacement velocities during activity bouts (Figure 2F).
3.4. Gait
There were minor differences in gait patterns between aboBoNT‐A and saline‐injected mice at all ages (Figure 3A–F). Spastic mice injected with saline had lower stride lengths at all ages compared to wild‐type mice. In spastic mice, aboBoNT‐A injection improved the stride length between week 4 and week 6 (p < .01; Figure 3A). AboBoNT‐A‐injected mice showed at all ages smaller step widths of the hind paws compared to saline‐injected mice (p < .05), however, the step width increased similarly in both saline and aboBoNT‐A‐injected mice between week 4 and week 6 (p < .05 and p < .01, respectively; Figure 3G).
FIGURE 3.

Effects of aboBoNT‐A on gait. (A) Stride length of hind limbs of male and female mice. (B) Print length of hind limb of male and female mice. (C) Print width of hind limbs of male and female mice. (D) Contact time of single hind limb of male and female mice. (E) Dual stance time of hind limbs of male and female mice. (F) Step width of front limb of male and female mice. (G) Step width of hind limb of male and female mice. (H) Example of footprints as registered by the Catwalk. Results are reported as mean ± SEM. *Significant differences (p < .05) between saline and treated mice, #Significant differences between WT and spastic mice, and $Significant differences between male and female mice. AboBoNT‐A‐injected mice showed improved stride length in spastic mice between weeks 4 and 6 and had smaller hind paw step widths at all ages compared to saline‐injected mice. However, both groups exhibited similar increases in step width from week 4 to week 6.
3.5. Muscle contractile force characteristics and morphological determinants of active and passive muscle length‐force characteristics
3.5.1. Length‐force characteristics
In soleus, aboBoNT‐A injections in spastic mice resulted in a 21% lower optimal muscle force compared to that in saline‐injected muscles (p < .01), but muscle force normalized for size (i.e., specific force) was not different (Table 1). Optimum muscle length and length range of active and passive force exertion were also not affected by aboBoNT‐A (Figure 4A,B; Table 2).
TABLE 1.
Force characteristics of the soleus (SO).
| Saline n = 22 | aboBoNT‐A n = 25 | p‐value | ||||||||||
|---|---|---|---|---|---|---|---|---|---|---|---|---|
| WT n = 10 | Spastic n = 12 | WT n = 13 | Spastic n = 12 | |||||||||
| Male n = 5 | Female n = 5 | Male n = 8 | Female n = 4 | Male n = 7 | Female n = 6 | Male n = 6 | Female n = 6 | Group | Treatment | Sex | ||
| SO | Fmao [mN] | 267 ± 7 | 228 ± 22 | 148 ± 11 | 129 ± 6 | 209 ± 10 | 181 ± 17 | 141 ± 9 | 122 ± 14 | <.001 | .003* 1 | .008 |
| Fmao/BM [mN/g] | 9.86 ± 0.66 | 10.84 ± 0.83 | 6.17 ± 0.44 | 6.91 ± 0.44 | 7.59 ± 0.37 | 8.83 ± 0.78 | 6.05 ± 0.42 | 6.51 ± 0.73 | ||||
| Fmao/MM [mN/mg] | 4.16 ± 0.39 | 5.28 ± 0.40 | 2.71 ± 0.21 | 3.40 ± 0.21 | 4.05 ± 0.25 | 4.61 ± 0.29 | 3.19 ± 0.25 | 3.88 ± 0.39 | ||||
| Fmao/PCSA [mN/mm2] | 24.80 ± 1.48 | 29.74 ± 2.67 | 15.16 ± 1.36 | 18.52 ± 1.39 | 23.08 ± 1.96 | 25.62 ± 1.36 | 17.15 ± 1.22 | 21.99 ± 1.81 | ||||
Note: Group = WT vs. spastic; Treatment, saline vs. BTX; Sex = male vs. female.
Abbreviations: BM, body mass; Fmao, force of the active muscle at optimum length; MM, muscle mass; PCSA, physiological cross‐sectional area.
1 = besides main effect, also group*treatment.
FIGURE 4.

Effects of aboBoNT‐A on muscle length‐force relationship, maximal rate of force development (MRFD) and force‐frequency relationship as well as determinants of muscle (−tendon complex) length (lm and lmtc) and muscle force (Fm and Fmtc). (A) Soleus (SO) relative length‐force relationship (lm rel to lo) of male mice. (B) Soleus relative length‐force relationship of female mice. (C) Gastrocnemius medialis (GM) relative length‐force relationship of male mice. (D) Gastrocnemius medialis relative length‐force relationship of female mice. (E) Absolute rate of maximal force development of soleus muscle (SO). (F) Rate of maximal force development of soleus normalized for maximal force. (G) Absolute rate of maximal force development of gastrocnemius medialis muscle (GM), (H) Rate of maximal force development of gastrocnemius medialis, (I) Force‐frequency relationship of soleus muscle, (J) Force‐frequency relationship of gastrocnemius medialis muscle. (K) Soleus muscle volume. (L) Gastrocnemius medialis muscle volume. (M) Physiological cross‐sectional area (PCSA) of soleus. (N) Physiological cross‐sectional area of gastrocnemius medialis. (O) Number of muscle fibers within a soleus cross‐section area. (P) Number of muscle fibers within a gastrocnemius medialis cross‐section area. Results are reported as mean ± SEM. *Significant differences (p < .05) between saline and iterated mice, #Significant differences between WT and spastic mice, and $Significant differences between male and female mice. In spastic mice, aboBoNT‐A injections led to lower optimal muscle force in both soleus and the gastrocnemius medialis muscles. The force‐frequency relationships and optimum muscle lengths were unaffected, but the volumes of the injected SO and gastrocnemius medialis were lower, and muscle fiber numbers were significantly reduced in both soleus and gastrocnemius medialis.
TABLE 2.
Muscle length characteristics of Soleus muscle (SO).
| Saline n = 22 | aboBoNT‐A n = 25 | p‐value | ||||||||||
|---|---|---|---|---|---|---|---|---|---|---|---|---|
| WT n = 10 | Spastic n = 12 | WT n = 13 | Spastic n = 12 | |||||||||
| Male n = 5 | Female n = 5 | Male n = 8 | Female n = 4 | Male n = 7 | Female n = 6 | Male n = 6 | Female n = 6 | Group | Treatment | Sex | ||
| SO | Lmao [mm] | 12.06 ± 0.20 | 10.77 ± 0.21 | 12.26 ± 0.19 | 11.06 ± 031 | 11.74 ± 0.30 | 10.32 ± 0.55 | 11.64 ± 0.35 | 11.93 ± 0.44 | 0.001 | ||
| Slack [mm] | 8.17 ± 0.16 | 7.63 ± 0.23 | 8.96 ± 0.20 | 7.84 ± 0.14 | 7.73 ± 0.15 | 6.69 ± 0.48 | 8.41 ± 0.20 | 8.72 ± 0.34 | <.001* 12 | .004 | ||
| Range [mm] | 3.90 ± 0.15 | 3.14 ± 0.28 | 3.30 ± 0.21 | 3.2 ± 0.33 | 4.01 ± 0.15 | 3.63 ± 0.47 | 3.22 ± 0.24 | 3.21 ± 0.29 | .039 | |||
| Lmao/TL | 0.65 ± 0.02 | 0.59 ± 0.01 | 0.67 ± 0.01 | 0.63 ± 0.02 | 0.63 ± 0.01 | 0.57 ± 0.03 | 0.65 ± 0.02 | 0.68 ± 0.02 | <.001 | .026 | ||
| Lmas/TL | 0.44 ± 0.01 | 0.42 ± 0.01 | 0.49 ± 0.02 | 0.45 ± 0.00 | 0.41 ± 0.01 | 0.37 ± 0.02 | 0.47 ± 0.01 | 0.50 ± 0.02 | <.001* 12 | |||
Note: Group = WT vs. spastic; Treatment, saline vs. BTX; Sex = male vs. female.
Abbreviations: Lmao, length of the active muscle at optimum length; Lmas, length of the muscle in active slack; TL, Tibia length.
1 = condition*treatment*sex, 2 = condition*treatment.
In gastrocnemius medialis, aboBoNT‐A‐injected muscles resulted in a lower force‐generating capacity over most of the muscle length‐force range of force exertion and a 35% lower optimal muscle force compared to saline‐injected muscles (p < .05 and p < .001, respectively). AboBoNT‐A‐injected gastrocnemius medialis also showed a 23% lower specific muscle force (p < .05; Table 3). AboBoNT‐A did not alter optimum muscle length and, length range of active and passive force exertion (Figure 4C,D; Table 4).
TABLE 3.
Force characteristics of gastrocnemius medialis (GM).
| Saline n = 21 | aboBoNT‐A n = 23 | p‐value | ||||||||||
|---|---|---|---|---|---|---|---|---|---|---|---|---|
| WT n = 10 | Spastic n = 11 | WT n = 11 | Spastic n = 12 | |||||||||
| Male n = 5 | Female n = 5 | Male n = 7 | Female n = 4 | Male n = 5 | Female n = 6 | Male n = 6 | Female n = 6 | Group | Treatment | Sex | ||
| GM | Fmao [mN] | 1272 ± 106 | 959 ± 118 | 1092 ± 145 | 950 ± 50 | 723 ± 138 | 831 ± 144 | 659 ± 135 | 544 ± 147 | <.001 | ||
| Fmao/BM [mN/g] | 46.7 ± 3.5 | 46.7 ± 5.1 | 46.2 ± 6.5 | 50.6 ± 1.5 | 25.4 ± 4.5 | 40.5 ± 7.1 | 659 ± 135 | 544 ± 147 | .001 | |||
| Fmao/MM [mN/mg] | 19.4 ± 1.3 | 23.1 ± 2.6 | 19.8 ± 2.6 | 24.9 ± 0.7 | 13.8 ± 2.8 | 20.5 ± 3.1 | 28.4 ± 6.0 | 29.4 ± 8.0 | .02 | .034 | ||
| Fmao/PCSA [mN/mm2] | 104.3 ± 6.9 | 111.1 ± 12.9 | 98.3 ± 15.4 | 118.0 ± 6.3 | 74.3 ± 14.0 | 108.6 ± 17.1 | 14.2 ± 2.4 | 17.7 ± 4.8 | .031 | |||
Note: Group = WT vs. spastic; Treatment, saline vs. BTX; Sex = male vs. female.
Abbreviations: BM, body mass; Fmao, force of the active muscle at optimum length; MM, muscle mass; PCSA, physiological cross‐sectional area.
TABLE 4.
Muscle belly and muscle tendon complex length characteristics gastrocnemius medialis (GM).
| Saline n = 27 | aboBoNT‐A n = 26 | p‐value | ||||||||||
|---|---|---|---|---|---|---|---|---|---|---|---|---|
| WT n = 15 | spastic n = 12 | WT n = 14 | spastic n = 12 | |||||||||
| Male n = 5 | Female n = 5 | Male n = 7 | Female n = 4 | Male n = 5 | Female n = 6 | Male n = 6 | Female n = 6 | Group | Treatment | Sex | ||
| GM belly | Lmao [mm] | 12.3 ± 0.4 | 11.3 ± 0.5 | 11.9 ± 0.4 | 10.8 ± 0.3 | 11.7 ± 0.3 | 11.4 ± 0.3 | 11.1 ± 0.3 | 9.6 ± 0.4 | .004 | .029 | .001 |
| Slack [mm] | 8.8 ± 0.4 | 8.0 ± 0.4 | 8.6 ± 0.4 | 7.7 ± 0.4 | 8.7 ± 0.2 | 8.0 ± 0.2 | 8.2 ± 0.3 | 6.6 ± 0.2 | .01 | <.001 | ||
| Lmao/TL | 0.66 ± 0.02 | 0.62 ± 0.03 | 0.65 ± 0.02 | 0.62 ± 0.01 | 0.63 ± 0.02 | 0.63 ± 0.02 | 0.62 ± 0.02 | 0.55 ± 0.02 | .019 | |||
| Slack/TL | 0.47 ± 0.02 | 0.44 ± 0.02 | 0.47 ± 0.02 | 0.44 ± 0.02 | 0.47 ± 0.02 | 0.45 ± 0.01 | 0.46 ± 0.01 | 0.38 ± 0.01 | .003 | |||
| GM MTC | Lmao [mm] | 16.8 ± 0.4 | 16.0 ± 0.3 | 16.1 ± 0.3 | 15.4 ± 0.4 | 16.6 ± 0.2 | 16.4 ± 0.3 | 15.5 ± 0.3 | 14.7 ± 0.6 | <.001 | .037 | |
| Slack [mm] | 12.8 ± 0.4 | 12.3 ± 0.4 | 12.1 ± 0.5 | 12.3 ± 0.4 | 13.0 ± 0.5 | 12.8 ± 0.3 | 12.0 ± 0.3 | 10.9 ± 0.4 | .003 | |||
| Ltendon [mm] | 3.98 ± 0.34 | 4.26 ± 0.38 | 3.45 ± 0.28 | 4.63 ± 0.39 | 4.34 ± 0.30 | 4.77 ± 0.21 | 3.83 ± 0.23 | 4.35 ± 0.27 | .007 | |||
| Lmao/TL | 0.90 ± 0.02 | 0.88 ± 0.02 | 0.88 ± 0.02 | 0.88 ± 0.02 | 0.90 ± 0.02 | 0.91 ± 0.02 | 0.87 ± 0.02 | 0.84 ± 0.03 | ||||
| Lmas/TL | 0.68 ± 0.03 | 0.67 ± 0.02 | 0.66 ± 0.03 | 0.70 ± 0.01 | 0.70 ± 0.03 | 0.71 ± 0.02 | 0.67 ± 0.02 | 0.63 ± 0.02 | ||||
| Ltendon/TL | 0.21 ± 0.02 | 0.23 ± 0.02 | 0.19 ± 0.02 | 0.26 ± 0.02 | 0.24 ± 0.02 | 0.26 ± 0.01 | 0.21 ± 0.01 | 0.25 ± 0.02 | .002 | |||
Note: Group = WT vs. spastic; Treatment = saline vs. BTX; Sex = male vs. female.
Abbreviations: Lmao, length of the active muscle at optimum length; Lmas, length of the muscle in active slack; TL, Tibia length.
3.5.2. Excitation‐contraction coupling and force‐frequency relationship
Upon aboBoNT‐A injection, the soleus had a lower maximal rate of force development compared to saline‐injected (p < .05; Figure 4E), but no effect of aboBoNT‐A was observed in maximal rate of force development (Figure 4F), or normalized maximal rate of force development (Figure 4G,H). The force‐frequency relationship of both muscles was unaffected by aboBoNT‐A‐injection (Figure 4I,J).
3.5.3. Morphology of the muscle‐tendon complex
In both soleus and gastrocnemius medialis, the absolute number of sarcomeres in series (i.e., in proximal and distal fibers) and number of sarcomeres in series normalized to tibia length were similar for saline and aboBoNT‐A‐injected muscles (Table 5).
TABLE 5.
Number of sarcomeres in series in soleus (SO) and gastrocnemius medialis (GM); TL, Tibia length.
| Saline n = 27 | aboBoNT‐A n = 26 | p‐value | ||||||||||
|---|---|---|---|---|---|---|---|---|---|---|---|---|
| WT n = 15 | spastic n = 12 | WT n = 14 | spastic n = 12 | |||||||||
| Male n = 8 | Female n = 7 | Male n = 8 | Female n = 4 | Male n = 7 | Female n = 7 | Male n = 6 | Female n = 6 | Group | Treatment | Sex | ||
| SO | Proximal | 2556 ± 131 | 2382 ± 103 | 2364 ± 47 | 2344 ± 201 | 2372 ± 121 | 2431 ± 93 | 2277 ± 89 | 2475 ± 117 | |||
| Distal | 2404 ± 75 | 2472 ± 96 | 2430 ± 43 | 2373 ± 107 | 2502 ± 90 | 2382 ± 40 | 2373 ± 116 | 2466 ± 77 | ||||
| Proximal/TL | 135 ± 17.3 | 131 ± 15.7 | 130 ± 6.4 | 134 ± 20.5 | 127 ± 14.8 | 134 ± 14.7 | 128 ± 12.0 | 142 ± 15.2 | ||||
| Distal/TL | 127 ± 11.5 | 136 ± 14.2 | 133 ± 5.6 | 136 ± 11.8 | 134 ± 10.6 | 131 ± 7.9 | 133 ± 12.9 | 141 ± 10.4 | .0211 | |||
| GM | Proximal | 2181 ± 66 | 1866 ± 66 | 1861 ± 82 | 1845 ± 94 | 2131 ± 137 | 2169 ± 154 | 1951 ± 174 | 1675 ± 164 | |||
| Distal | 2438 ± 65 | 2238 ± 37 | 2387 ± 83 | 2226 ± 68 | 2440 ± 90 | 2267 ± 70 | 2273 ± 62 | 1995 ± 65 | ||||
| Proximal/TL | 115 ± 3.49 | 102 ± 3.15 | 102 ± 5.18 | 106 ± 5.25 | 115 ± 8.62 | 120 ± 9.65 | 109 ± 9.76 | 96 ± 8.71 | ||||
| Distal/TL | 128 ± 3.53 | 123 ± 2.09 | 131 ± 5.70 | 127 ± 3.45 | 131 ± 5.85 | 125 ± 4.37 | 127 ± 4.27 | 114 ± 2.94 | ||||
Note: Group = WT vs. spastic; Treatment = saline vs. BTX; Sex = male vs. female.
The volumes of aboBoNT‐A‐injected soleus and gastrocnemius medialis were, respectively, 12% and 14% lower than those of saline‐injected muscles (p < .05 and p < .01; Figure 4K,L).
Saline and aboBoNT‐A‐injected soleus showed similar physiological cross‐sectional areas (Figure 4M). AboBoNT‐A‐injected gastrocnemius medialis had a 10% smaller physiological cross‐sectional area than saline‐injected gastrocnemius medialis (p < .01; Figure 4N).
Both absolute Achilles tendon lengths and normalized Achilles tendon lengths (by tibia length) were similar for saline and aboBoNT‐A‐injected mice (Table 5).
3.5.4. Number of muscle fibers per muscle
Since in soleus muscle of saline and aboBoNT‐A‐injected mice the physiological cross‐sectional area and number of sarcomeres in series were similar, we anticipated that lower volume in aboBoNT‐A‐injected muscles was due to differences in number of fibers. Indeed, the number of muscle fibers was lower. For soleus and gastrocnemius medialis, the numbers of muscle fibers per mid‐muscle cross‐section were 26% and 31% lower in aboBoNT‐A‐injected than in saline‐injected muscles, respectively (p < .0001 and p < .0001; Figure 4G–J).
3.5.5. Muscle fiber cross‐sectional area
For soleus muscle, aboBoNT‐A‐injection induced a 22% larger mean fiber cross‐sectional area compared to saline‐injected mice (p < .0001; Figure 5C).
FIGURE 5.

Effects of aboBoNT‐A on passive muscle force determinants. (A, B) Typical example of a cross‐section stained with sirius red of saline and an aboBoNT‐A‐injected muscle, connective tissue within a cross‐section is stained red, magnifications show different areas within cross‐sections. (C) Soleus (SO) muscle fiber cross‐sectional area (fCSA) per muscle fiber type. (D) Gastrocnemius medialis (GM) muscle fiber cross‐sectional area per muscle fiber type in the low oxidative muscle region (E) and high oxidative muscle region. (F) Soleus primary perimysium length (lp1). (G) secondary perimysium length (lp2). (H) Soleus tertiary perimysium length (lp3). (I) Soleus percentage of endomysium area per fiber area. (J) Gastrocnemius medialis primary perimysium length. (K) Gastrocnemius medialis secondary perimysium length. (L) Gastrocnemius medialis tertiary perimysium length. (M) Gastrocnemius medialis percentage of endomysium area per fiber area. Results are reported as mean ± SEM. *Significant differences (p < .05) between saline and treated mice, #Significant differences between WT and spastic mice, and $Significant differences between male and female mice. AboBoNT‐A injection resulted in larger mean muscle fiber cross‐sectional areas in the soleus compared to saline, and in larger cross‐sectional areas for type IIB fibers in the low‐oxidative region of the gastrocnemius medialis. Additionally, in the high‐oxidative region of the gastrocnemius medialis, type I, IIA, IIX, and IIB fibers were significantly larger in aboBoNT‐A‐injected muscles compared to saline‐injected muscles.
In the low‐oxidative region of the gastrocnemius medialis, only fiber cross‐sectional area of type IIB fibers was 34% decreased by aboBoNT‐A injection (p < .01; Figure 5D).
In the high‐oxidative region of the gastrocnemius medialis, a significant interaction effect showed that the sizes of type I muscle fibers in saline and aboBoNT‐A‐injected spastic mice were similar, however, those of aboBoNT‐A‐injected wild‐type mice were 33% larger than those of saline‐injected wild‐type mice (p < .05). Moreover, aboBoNT‐A‐injected gastrocnemius medialis showed in the high oxidative muscle region ~21% larger type IIA, IIX and IIB fibers sizes compared to the saline‐injected (p < .05, p < .01 and p < .05, respectively; Figure 5E).
3.5.6. Intramuscular connective tissue content
Saline and aboBoNT‐A‐injected soleus muscles showed similar primary and secondary perimysium thickness (Figure 5F,G). However, aboBoNT‐A‐injected soleus showed smaller tertiary perimysium thickness than saline‐injected soleus (p < .05, Figure 5H). The percentage of endomysium area per unit muscle cross‐section was 57% higher in aboBoNT‐A‐injected soleus compared to saline‐injected soleus (p < .05, Figure 5I).
The primary perimysium thickness was higher in aboBoNT‐A‐injected gastrocnemius medialis compared to saline‐injected muscle (p < .05; Figure 5J). The secondary and tertiary perimysium thicknesses were not different between groups (Figure 5K,L). The percentage area of endomysium per muscle cross‐section was 63% higher in aboBoNT‐A‐injected gastrocnemius medialis compared to saline‐injected muscle (p < .001; Figure 5M).
3.6. Muscle fatigue resistance and determinants of endurance capacity
3.6.1. Muscle fatigue resistance
For soleus muscle, the percentage decrease in force after 2 min of stimulation was similar for saline and aboBoNT‐A‐injected muscles (Figure 6A,B).
FIGURE 6.

Effects of aboBoNT‐A on endurance capacity, as well as endurance determinants. (A) Endurance curve of soleus (SO). (B) Percentage of decreased muscle force at the end of the fatigue protocol of soleus. (C) Endurance curve of gastrocnemius medialis (GM). (D) Percentage of decreased muscle force at the end of the fatigue protocol of gastrocnemius medialis. (E–G) Typical example of muscle fiber type matching with SDH stained cross‐section of a saline‐injected muscle. (H–J) Typical example of muscle fiber type matching with SDH stained cross‐section of an aboBoNT‐A‐injected muscle. (K) Soleus MHC distribution of male mice. (L) Soleus MHC distribution of female mice. (M) Gastrocnemius medialis MHC distribution in the high oxidative muscle region. (N) Gastrocnemius medialis MHC distribution in the low oxidative muscle region. (O) SDH activity of soleus. (P) SDH activity in the high oxidative muscle region of gastrocnemius medialis muscle. (Q) SDH activity in the low oxidative muscle region of gastrocnemius medialis muscle. Results are reported as mean ± SEM. *Significant differences (p < .05) between saline and treated mice, #Significant differences between WT and spastic mice, and $Significant differences between male and female mice. Fmax: Maximal muscle force at optimum muscle length. AboBoNT‐A‐injected gastrocnemius medialis muscles exhibited improved fatigue resistance with lower force reductions after 4 min of stimulation compared to saline‐injected muscles. Additionally, aboBoNT‐A injection caused a shift towards slower muscle fiber types in both the soleus and the high oxidative region of the gastrocnemius medialis, with increased percentages of type I fibers and decreased percentages of type IIA, IIX, and IIB fibers.”
For gastrocnemius medialis muscle, 4 min of stimulation yielded a 16% lower force reduction in aboBoNT‐A‐injected gastrocnemius medialis muscles compared to saline‐injected (p < .05; Figure 6C,D) indicating improved fatigue resistance.
3.6.2. Muscle fiber typing
The percentage of hybrid fibers was very low (<5%) and was therefore excluded from the analyses.
In aboBoNT‐A‐injected soleus muscle, the fiber type distribution shifted towards more slow type muscle, as the percentage of type I fibers was higher (p < .0001), and the percentages of IIA and IIX lower compared to saline‐injected soleus (p < .0001 and p < .01, respectively; Figure 6K,L).
Similar to in soleus muscle, in the high oxidative region of gastrocnemius medialis muscle, aboBoNT‐A injection also caused a shift in fiber type distribution towards slower muscle fiber types. AboBoNT‐A‐injected gastrocnemius medialis had 55% more type I fibers (p < .0001) and 55% less type IIB fibers compared to the saline‐injected gastrocnemius medialis (p < .01; Figure 6M). In the low oxidative muscle region, the distribution of the muscle fiber types in saline and aboBoNT‐A‐injected gastrocnemius medialis was unaffected (Figure 6N).
3.6.3. Succinate dehydrogenase activity
In aboBoNT‐A‐injected soleus muscle, muscle fiber succinate dehydrogenase SDH‐activity was similar to that in saline‐injected soleus muscle (Figure 6O), which is indicative of an unaltered oxidative metabolism. The spatially‐integrated SDH activity (muscle fiber cross‐sectional area multiplied by SDH) provides an estimate of the total oxidative metabolic power of muscle fibers. Because of the larger muscle fiber size after aboBoNT‐A, in aboBoNT‐A‐injected soleus was 17% higher than that in saline‐injected soleus (p < .01; Figure 6P).
In the high oxidative region of the gastrocnemius medialis, aboBoNT‐A injections did not affect SDH activity (Figure 6Q). However, the integrated SDH activity of type I fibers in aboBoNT‐A‐injected gastrocnemius medialis was 28% higher than in saline‐injected gastrocnemius medialis (p < .05; Figure 6R). Other muscle fiber types of the aboBoNT‐A‐injected gastrocnemius medialis did not show any significant changes in integrated SDH activity.
In the low oxidative muscle region of the gastrocnemius medialis, muscle fiber SDH‐activity in aboBoNT‐A‐injected muscles was similar to that in saline‐injected (Figure 6S). However, the integrated SDH‐activity of the aboBoNT‐A‐injected IIB muscle fibers was 40% higher than that of saline‐injected IIB fibers (p < .001; Figure 6T). This was likely due to the greater muscle fiber cross‐sectional area in aboBoNT‐A‐injected muscles.
3.7. Myotrophic determinants
3.7.1. Muscle satellite cell content
Muscle stem cells proliferate and fuse in growing muscle fibers, increasing the number of myonuclei. Quantification of muscle stem cells allows clarification concerning the potential of a muscle to regenerate in case of injury (e.g., by injection) and the potential to supply myonuclei for longitudinal muscle fiber growth. For saline and aboBoNT‐A‐injected soleus and gastrocnemius medialis muscles, both numbers of satellite cells per muscle cross‐section and numbers of satellite cells per muscle fiber in 10 μm thick sections were similar (Figure 7A–D).
FIGURE 7.

Effects of aboBoNT‐A on myotrophic determinants. (A) Number of satellite cells (SC) per cross‐section in soleus (SO). (B) Number of satellite cells per cross‐section (10 μm thick section) in soleus. (C) Number of satellite cells per cross‐section area in gastrocnemius medialis (GM). (D) Number of satellite cells per muscle fiber cross‐section (10 μm thick section) in gastrocnemius medialis. (E) Number of myonuclei per 1 mm of muscle fiber in soleus. 45 (F) Number of myonuclei per 1 mm of muscle fiber in the low oxidative muscle region of the gastrocnemius medialis. (G) Number of myonuclei per 1 mm of muscle fiber in the high oxidative muscle region of the gastrocnemius medialis. (H) Myonuclear domain in soleus. (I) Myonuclear domain in the low oxidative muscle region of the gastrocnemius medialis. (J) Myonuclear domain in the high oxidative muscle region of the gastrocnemius medialis. Results are reported as mean ± SEM. “*” indicates significant differences (p < .05) between saline and treated mice, “#” indicates significant differences between WT and spastic mice, and “$” indicates significant differences between male and female mice. In both soleus and gastrocnemius medialis muscles, the numbers of satellite cells per muscle cross‐section and per muscle fiber were similar between saline and aboBoNT‐A‐injected groups. However, in the low oxidative region of the gastrocnemius medialis, aboBoNT‐A injection resulted in a higher number of myonuclei per 1 mm of fiber length compared to saline injection, while myonuclear domains were similar across all conditions. A typical example of myonuclei and satellite cells (indicated by white arrows) in saline and aboBoNT‐A‐injected muscles can be found in this figure.
3.7.2. Myonuclear density
Saline and aboBoNT‐A‐injected soleus showed similar numbers of nuclei per 1 mm of muscle fiber length and myonuclear domains were also similar (Figure 7G,H, respectively).
In the low oxidative area of gastrocnemius medialis muscle, aboBoNT‐A injection induced a 35% higher number of myonuclei per 1 mm of muscle fiber length compared to saline‐injection muscle (p < .0001; Figure 7I). In the high oxidative area, saline and aboBoNT‐A‐injected muscles had similar numbers of myonuclei per 1 mm muscle fiber length (Figure 7J). In both the low and high oxidative gastrocnemius medialis regions, myonuclear domains were similar for saline and aboBoNT‐A‐injected muscles (Figure 7K,L).
4. DISCUSSION
This study aimed to characterize the effects of aboBoNT‐A injection on physical performance, contractile force characteristics, morphology, as well as histological phenotype of the soleus and gastrocnemius medialis muscles. Our results show that aboBoNT‐A injection had minor effects on physical performance, but reduced the force‐generating capacity of the calf muscles, which was due to a smaller physiological cross‐sectional area and a lower specific force. Muscle optimum length and length range of active force exertion remained unchanged in line with the lack of effect on the number of sarcomeres in series. The endurance capacity of the gastrocnemius medialis was improved, which was associated with an increased percentage slow‐type muscle fibers. In the aboBoNT‐A‐injected gastrocnemius muscle, the larger muscle fiber size was accompanied by a higher number of nuclei per muscle fiber, but unaltered myonuclear domains. Together these results show that aboBoNT‐A injection in mouse muscle at a young age does not affect muscle growth potential, but improves endurance capacity. Our study showed that aboBoNT‐A did not affect spastic mice and their muscles differently than those of wild‐type mice, which indicates that the effects of aboBoNT‐A injection are similar in muscles from both wild‐type and spastic mice. Moreover, differences between spastic and wild‐type mice, as well as sex differences are in line with the previous report. 43 We refer the reader to Rivares et al. 43 for an extensive description of the characteristics of spastic mice performance, behavior, and muscle characteristics during development.
4.1. Effects of aboBoNT‐A on body growth during maturation of mice
We used neonatal mice, to model the potential effects of aboBoNT‐A in young children. In the experiments, mice were euthanized at 10 weeks of age and went through the suckling and juvenile phase reaching puberty at 8 weeks of age. Life phases of the experimental mice relate well to those of children with neuromuscular disorders receiving aboBoNT‐A injections. Therefore, our results are a valuable contribution to the understanding of the effects of aboBoNT‐A injections in young muscle tissue.
Our results show that aboBoNT‐A‐injected wild‐type and spastic mice had similar body weight, and tibia length as control mice. Saline and aboBoNT‐A‐injected mice showed similar physical activity and had a similar shelter behavior. Therefore, it is reasonable to assume that the mice were subjected to similar physical load, and as such similar stimuli for musculoskeletal adaptation.
4.2. Effects of aboBoNT‐A on muscle growth
Injections of aboBoNT‐A have been associated with muscle fiber atrophy in rodents and rabbits. 38 , 40 , 58 Here we show that the physiological cross‐sectional area of the aboBoNT‐A‐injected gastrocnemius medialis was smaller compared to that of saline‐injected controls. However, the smaller physiological cross‐sectional area is explained by lower number of muscle fibers instead of by muscle fiber atrophy. In contrast to mentioned studies, we show that the remaining muscle fibers show hypertrophy.
aboBoNT‐A injection at very young age prevents plantar flexor contractures (e.g., Cosgrove and Graham 1994), as spastic mice have shorter muscle belly lengths due to an assumed lower number of sarcomeres in series (Cosgrove and Graham 1994; Ziv et al., 1984, 1971). 59 , 60 , 61 In this and in a previous 43 study, we measured the number of sarcomeres in series and show that the number of sarcomeres in series is similar in wild‐type and spastic muscles. Since muscles from spastic mice were not inherently shorter with less sarcomeres in series, aboBoNT‐A injection will not have a preventive effect on muscle belly shortening. Further studies on (animal) models with short muscles (i.e., reduced number of sarcomeres) might provide further evidence of an altered muscle (fiber) length and longitudinal muscle fiber growth following aboBoNT‐A injection.
Here we show that in the aboBoNT‐A‐injected gastrocnemius medialis muscle, the absolute muscle belly length at optimum muscle length was shorter compared to saline‐injected muscles. However, normalization of the belly length by tibial bone length yielded no differences between saline and aboBoNT‐A‐injected muscles. This latter, indicates that aboBoNT‐A injection did not delay the longitudinal growth of the muscle belly, and shows that aboBoNT‐A‐injected muscles can adapt to longitudinal tibia growth.
4.3. Effects of aboBoNT‐A on contractile force characteristics
The present study shows that aboBoNT‐A injection lowers the muscle force‐generating capacity (i.e., muscle force and maximal rate of force development). Muscle force‐generating capacity is proportional to the number of sarcomeres arranged in parallel within a muscle (i.e., cross‐sectional area of muscle fibers) and the number of fibers within the muscle. 62 Our results show a 10% smaller physiological cross‐sectional area in gastrocnemius muscle in aboBoNT‐A‐treated mice, while the optimal tetanic force in aboBoNT‐A‐treated muscle was about 35% lower in these muscles. This difference indicates that in addition to reductions in physiological cross‐sectional area, in gastrocnemius muscle, aboBoNT‐A also reduced the force generating capacity per unit physiological cross‐sectional area (i.e., the specific force was reduced). The observed decrease in specific muscle force after aboBoNT‐A injection is likely explained by changes in muscle fiber type composition which also explains the observed reduction in maximal rate of force development. Animal studies show that changes in muscle fiber type composition contribute to the reduction in specific muscle force, as well as to the maximal rate of force development. 63 , 64 , 65
Our study results suggest that aboBoNT‐A affects muscles composed of fast fiber types more than those composed of slow fiber types. In contrast to the aboBoNT‐A‐injected gastrocnemius, in the slow fiber typed soleus, muscle force was only slightly lower at optimum length and the specific muscle force was similar to that of saline‐injected soleus muscles. In addition, the physiological cross‐sectional area of the aboBoNT‐A‐injected soleus was not lower compared to that of saline‐injected muscles. These findings concerning the different outcomes of aboBoNT‐A injection on contractile force characteristics of muscles with different fiber type compositions indicate that it could be favorable to start with specific muscle training before aboBoNT‐A treatment. Specific muscle training before aboBoNT‐A treatment can stimulate shifts in muscle fiber type composition towards more slow fiber types, which may be beneficial in order to prevent strong decreases in muscle force generating capacity.
4.4. Effects of aboBoNT‐A on muscle fiber type composition, mitochondrial enzyme activity and fatigue resistance
Muscle fiber type composition within a muscle is a key determinant of contraction velocity and muscle fatigability and may change in response to mechanical overload or disuse. 64 Previous animal experiments have shown that BoNT‐A injection in muscles composed mostly of fast fibers caused substantial adaptations towards more slow and fatigue resistant fibers. 39 , 40 , 41 , 42 In the current study, we observed a similar change in the gastrocnemius medialis muscle. Moreover, the current study shows that in the predominantly slow and fatigue resistance‐fibered soleus muscle, the percentage of type I fibers increased further at the expense of the percentage IIA and IIX muscle fibers. This indicates that in muscles with both slow and fast fiber types, aboBoNT‐A injection induces a shift toward a slow type muscle fiber type.
Another key determinant of fatigue resistance is the oxidative capacity, 66 together with the capacity for oxygen supply to the mitochondria. 67 Muscle fiber size (i.e., cross‐sectional area) and mitochondrial enzyme activity are typically inversely related. 68 Signaling for protein synthesis and mitochondrial biosynthesis have shown their interference 68 and as such a simultaneous increase in muscle fiber size and SDH activity is complicated. Nevertheless, our data shows that the SDH activity in muscle fibers was similar in saline and aboBoNT‐A‐injected muscles, which indicates that the increase in muscle fiber cross‐sectional area was accompanied by an increase in mitochondrial enzyme activity. The combined increase in both size and SDH activity demonstrates that after aboBoNT‐A injection, the muscle fibers had the potential for concurrent hypertrophy and mitochondrial biosynthesis. Moreover, our data shows that aboBoNT‐A injection induces changes in determinants of fatigue resistance (i.e., muscle fiber type composition and oxidative capacity), which are accompanied by an enhanced endurance capacity.
Patients with cerebral palsy show impaired exercise tolerance (e.g., 6‐min walking test) and early signs of muscle fatigue after prolonged walking. 69 , 70 , 71 Excessive contraction of spastic muscles contributes to the net torque over target joints during locomotion. As a consequence, antagonist muscles need to exert higher forces in order to accomplish a particular movement, resulting in an increased energy demand. 72 , 73 , 74 , 75 Due to the smaller physiological cross‐sectional area, and lower optimal muscle force, muscles require to be active at a relatively higher percentage of their maximal contraction capacity in children with spasticity than in typical developing children, which contributes to fatigue. Clinical studies often focus on treatments that suppress the neural component of spasticity, stimulate morphological adaptations and improve muscle function in order to enhance functional performance (e.g., gait kinetics and kinematics, as well as signs of fatigue during gait). However, to our knowledge, no prior studies have examined the effects of treatment with BoNT‐A injections on the key determinant of fatigue resistance (i.e., muscle fiber type composition and oxidative capacity) and muscle fatigue in humans with spasticity. Our results show promising adaptations after aboBoNT‐A injection at young age, such as muscle fiber growth with unchanged potential for mitochondrial biogenesis and a shift of fast fatigable to fatigue resistant muscle fibers. In resume, the above reported adaptations are promising therapeutic outcomes for children with spasticity or other neuromuscular diseases, as improved muscle endurance might contribute to improvements in participation in physical activities.
4.5. Effects of aboBoNT‐A on absolute passive length‐force characteristics
Saline and aboBoNT‐A‐injected muscles showed similar passive length‐force characteristics indicating that the aboBoNT‐A injection did not change the net effect of any alterations in determinant of passive force characteristics. Passive resistance to stretch is determined by the physiological cross‐sectional area, number of sarcomeres in series, and connective tissue content. Particularly the perimysium contributes to the passive resistance to stretch, as it is composed of a high amount of type I collagen, which forms a rigid meshwork with high tensile stiffness. 76 Here we show only a slight increase in connective tissue content (i.e., primary perimysium and percentage endomysium area per unit muscle cross‐section). However, the smaller physiological cross‐sectional area of the aboBoNT‐A‐injected muscles has likely counterbalanced this effect resulting in similar passive length‐force characteristics. In clinical settings, reducing the steepness of the passive length‐force curve can be an intended outcome of the treatment for children suffering from joint hyper‐resistance, because it likely benefits the range of joint motion.
4.6. Effects of aboBoNT‐A on the number of muscle fibers
The current study is the first that shows the total count of muscle fibers within aboBoNT‐A‐injected muscles. Here we show that aboBoNT‐A‐injected muscles have about 30% fewer muscle fibers compared to of control muscles. Whether this is caused by a loss of muscle fibers, lack of growth‐induced hyperplasia, or lack of muscle fiber splitting/branching is unknown.
A plausible explanation for the lower number of muscle fibers in aboBoNT‐A‐treated muscles may be the lack or an attenuated increase in muscle fibers early after the injection at days 6–7. In rat lumbrical muscles the addition of secondary myotubes has been shown to reach a total stable number on the 7th post‐natal day. 77 Development of secondary myotubes requires the presence and activity of motorneurons. 78 , 79 Some studies show new muscle fibers within interstitial spaces of the plantaris muscle in rats up to the 10th postnatal day. 80 , 81 As primary myotubes differentiate only into fetal type I and type IIA fibers, and secondary myotubes can differentiate in all other muscle fiber types, including type I and IIA, lower aboBoNT‐A induced addition of secondary myotubes can also explain the shift observed in muscle fiber composition.
Another explanation for the lower number of muscle fibers due to aboBoNT‐A injection may be that aboBoNT‐A‐injected muscles are subjected to unloading. Several animal studies have reported lateral muscle fiber branches and longitudinal splitting caused for example by overload (damage), muscular dystrophy and to maintain oxygen diffusion capacity in trophic muscle fibers. 82 , 83 , 84 , 85 , 86 , 87 In the current study, we did not find signs of muscle fiber splitting or branching during muscle fiber dissections. As body weight and activity time of the mice were similar, it is more likely that the reduced number of muscle fibers is due to a lack or a reduction in this, rather than due to reduced overload‐induced branching or splitting.
It is not clear whether lack and reduced secondary myogenesis caused this reduction in muscle fibers or whether the toxin damaged fibers causing fiber apoptosis or necrosis, however, it is a relevant observation. In humans, there is no evidence of hyperplasia after birth. Moreover, in children with spasticity, treatment with BoNT‐A starts between 2 and 4 years of age (occasionally before 1 year). 8 , 9 , 17 It is therefore very unlikely that children treated with BoNT‐A will show a reduced number of muscle fibers. Further research to obtain a more detailed insight concerning the cause of reduced number of muscle fibers is warranted.
4.7. Fiber cross‐sectional area in aboBoNT‐A‐injected muscles
Both the aboBoNT‐A‐injected soleus and gastrocnemius medialis showed a substantial increase in the muscle fiber cross‐sectional area compared to saline‐injected muscles. This observation was not expected, as the literature suggests that neurotoxins induce muscle atrophy in animal models. 38 , 40 , 41 , 58 , 88
Muscle fiber hypertrophy of aboBoNT‐A‐injected muscles was accompanied by an increase in the number of myonuclei and an unaltered myonuclear domain. This indicates that during development accretion of myonuclei, which is typical during muscle growth 21 was not affected by aboBoNT‐A injection. Irrespective of the cause of the lower muscle fiber number, the lower number of muscle fibers implies that these remaining fibers were likely subjected to overload as the body weight of the mice did not differ between groups. Mechanical overload is a strong stimulus for hypertrophy 89 and could explain the difference in muscle fiber size between aboBoNT‐A and saline‐injected muscles. This study shows that the ability of aboBoNT‐A‐injected muscles to grow and hypertrophy was not compromised.
4.8. Minor effects of aboBoNT‐A injection on physical performance
Spastic mice showed considerable differences from wild‐type mice in physical performance and spontaneous behavior, in line with our previous report. 43 Despite a relatively broad screening of putative effects of aboBoNT‐A injection in a range of assays, only modest effects were found on a specific set of gait parameters as measured on the Catwalk. Hence, in mice, the overt changes in muscle endurance capacity as mentioned above, these long term changes induced by aboBoNT‐A injection lead to very specific and minor effects on gait.
4.9. Clinical implications
Our study results show that aboBoNT‐A injection(s) as a single intervention is stimulating a switch in muscle fiber typing towards a slow muscle phenotype and enhanced exercise tolerance. As discussed above, in patients who suffer from early muscle fatigue during locomotion, the adaptation of the phenotype may be beneficial as it could improve the muscle endurance and participation in physical activities. aboBoNT‐A injection is not likely to enhance addition of sarcomeres in series in spastic muscles which do not show contractures, nor does it increase the muscle length or muscle length range of force exertion. The aboBoNT‐A injection in combination with serial casting seems inevitable to increase these latter and improve an equinus gait, as has been suggested in several of other studies into the effects of aboBoNT‐A injection children with spasticity. 90 Moreover, in patients with spasticity or other neuromuscular disorders, denervation of muscles using aboBoNT‐A injection is very likely to cause (temporal) atrophy and muscle weakness. To compensate for the loss of volume and the muscle weakness, power training is recommendable. 91 Since our study shows that the accretion of myonuclei and the potential for trophy is not affected by the toxin, power training to increase the muscle physiological cross‐sectional area seems favorable.
5. CONCLUSION
AboBoNT‐A injection at a young age in mouse plantar flexor muscles induces a reduction in muscle force‐generating capacity in both gastrocnemius medialis and soleus muscles in the long‐term, being more prominent in the gastrocnemius medialis than in soleus muscle. The lower muscle force is associated with a reduced physiological cross‐sectional area, while longitudinal muscle fiber growth remains unaffected. The reduced trophy was due to a lower number of muscle fibers while cross‐sectional area growth of muscle fibers was enhanced (i.e., hypertrophy). AboBoNT‐A injection improved fatigue resistance, likely explained by a high percentage of type I fibers. Both muscles showed a higher amount of connective tissue, but this did not affect active and passive contractile function. In addition, stride length and step width of spastic muscles‐injected with aboBoNT‐A improved.
AUTHOR CONTRIBUTIONS
AV, MK, ML, and RJ developed the concept of the current manuscript. CR, WN, GB, and BK collected the data. CR, WN, and GB analyzed the data. CR, RW, and RJ interpreted the results. CR, RW, and RJ drafted the manuscript. All authors contributed to the revision. All authors read and approved the submitted version.
FUNDING INFORMATION
This study was supported by Ipsen Innovation (Les Ulis, France). The funders had no role in the data collection, analysis, or decision to publish.
DISCLOSURES
Alban Vignaud is an Ipsen employee, and Mikhail Kalinichev was an Ipsen employee at the time the research was conducted but is now employed elsewhere.
ACKNOWLEDGEMENTS
We would like to thank Mohammad Haroon for his help in formatting the graphs.
Rivares C, Vignaud A, Noort W, et al. Muscle type‐specific effects of bilateral abobotulinumtoxinA injection on muscle growth and contractile function in spastic mice. The FASEB Journal. 2024;38:e70141. doi: 10.1096/fj.202302258R
DATA AVAILABILITY STATEMENT
The datasets generated during this study are subject to an embargo until the publication date of this article. Following the embargo period, the data will be made available in the GitHub repository at 10.5281/zenodo.10987645. Detailed access instructions and any conditions or restrictions related to the use of the data will be provided at this location.
REFERENCES
- 1. Cocco A, Albanese A. Recent developments in clinical trials of botulinum neurotoxins. Toxicon. 2018;147:77‐83. doi: 10.1016/j.toxicon.2017.08.014 [DOI] [PubMed] [Google Scholar]
- 2. Montal M. Botulinum neurotoxin: A marvel of protein design. Annu Rev Biochem. 2010;79:591‐617. doi: 10.1146/annurev.biochem.051908.125345 [DOI] [PubMed] [Google Scholar]
- 3. De Paiva A, Meunier FA, Molgó J, Aoki KR, Dolly JO. Functional repair of motor endplates after botulinum neurotoxin type a poisoning: biphasic switch of synaptic activity between nerve sprouts and their parent terminals. Proc Natl Acad Sci USA. 1999;96(6):3200‐3205. doi: 10.1073/pnas.96.6.3200 [DOI] [PMC free article] [PubMed] [Google Scholar]
- 4. Cichon JV, McCaffrey TV, Litchy WJ, Knops JL. The effect of botulinum toxin type a injection on compound muscle action potential in an in vivo rat model. Laryngoscope. 1995;105(2):144‐148. doi: 10.1288/00005537-199502000-00006 [DOI] [PubMed] [Google Scholar]
- 5. Graham HK, Rosenbaum P, Paneth N, et al. Cerebral palsy. Nat Rev Dis Primers. 2016;2:15082. doi: 10.1016/B978-0-12-385157-4.01035-6 [DOI] [PMC free article] [PubMed] [Google Scholar]
- 6. van den Noort JC, Bar‐On L, Aertbeliën E, et al. European consensus on the concepts and measurement of the pathophysiological neuromuscular responses to passive muscle stretch. Eur J Neurol. 2017;24(7):981.e38. doi: 10.1111/ene.13322 [DOI] [PubMed] [Google Scholar]
- 7. Goldstein M, Harper DC. Management of cerebral palsy: equinus gait. Dev Med Child Neurol. 2001;43(8):563‐569. doi: 10.1111/j.1469-8749.2001.tb00762.x [DOI] [PubMed] [Google Scholar]
- 8. Koman LA, Mooney JF, Smith B, Goodman A, Mulvaney T. Management of cerebral palsy with botulinum‐a toxin: preliminary investigation. J Pediatr Orthop. 1993;13(4):489‐495. doi: 10.1097/01241398-199307000-00013 [DOI] [PubMed] [Google Scholar]
- 9. Cosgrove AP, Corry IS, Graham HK. Botulinum toxin in the management of the Lower Limb in cerebral palsy. Dev Med Child Neurol. 1994;36(5):386‐396. doi: 10.1111/j.1469-8749.1994.tb11864.x [DOI] [PubMed] [Google Scholar]
- 10. Graham HK, Aoki KR, Autti‐Rämö I, et al. Recommendations for the use of botulinum toxin type a in the management of cerebral palsy. Gait Posture. 2000;11(1):67‐79. doi: 10.1016/S0966-6362(99)00054-5 [DOI] [PubMed] [Google Scholar]
- 11. Heinen F, Molenaers G, Fairhurst C, et al. European consensus table 2006 on botulinum toxin for children with cerebral palsy. Eur J Paediatr Neurol. 2006;10(5–6):215‐225. doi: 10.1016/j.ejpn.2006.08.006 [DOI] [PubMed] [Google Scholar]
- 12. Heinen F, Desloovere K, Schroeder AS, et al. The updated European consensus 2009 on the use of botulinum toxin for children with cerebral palsy. Eur J Paediatr Neurol. 2010;14(1):45‐66. doi: 10.1016/j.ejpn.2009.09.005 [DOI] [PubMed] [Google Scholar]
- 13. Love SC, Novak I, Kentish M, et al. Botulinum toxin assessment, intervention and after‐care for lower limb spasticity in children with cerebral palsy: international consensus statement. Eur J Neurol. 2010;17(SUPPL. 2):9‐37. doi: 10.1111/j.1468-1331.2010.03126.x [DOI] [PubMed] [Google Scholar]
- 14. Bottos M, Benedetti MG, Salucci P, Gasparroni V, Giannini S. Botulinum toxin with and without casting in ambulant children with spastic diplegia: a clinical and functional assessment. Dev Med Child Neurol. 2003;45(11):758‐762. doi: 10.1017/S0012162203001403 [DOI] [PubMed] [Google Scholar]
- 15. Graham HK. Botulinum toxin type a management of spasticity in the context of orthopaedic surgery for children with spastic cerebral palsy. Eur J Neurol. 2001;8(SUPPL. 5):30‐39. doi: 10.1046/j.1468-1331.2001.00036.x [DOI] [PubMed] [Google Scholar]
- 16. Eames NWA, Baker R, Hill N, Graham K, Taylor T, Cosgrove A. The effect of botulinum toxin a on gastrocnemius length: magnitude and duration of response. Dev Med Child Neurol. 1999;41(4):226‐232. doi: 10.1017/S0012162299000493 [DOI] [PubMed] [Google Scholar]
- 17. Pascual‐Pascual SI, Pascual‐Castroviejo I. Safety of botulinum toxin type a in children younger than 2 years. Eur J Paediatr Neurol. 2009;13(6):511‐515. doi: 10.1016/j.ejpn.2008.10.006 [DOI] [PubMed] [Google Scholar]
- 18. Dayanidhi S, Lieber RL. Skeletal muscle satellite cells: mediators of muscle growth during development and implications for developmental disorders. Muscle Nerve. 2014;50(5):723‐732. doi: 10.1002/mus.24441 [DOI] [PMC free article] [PubMed] [Google Scholar]
- 19. Enesco M, Puddy D. Increase in the number of nuclei and weight in skeletal muscle of rats of various ages. Am J Anat. 1964;114(2):235‐244. doi: 10.1002/aja.1001140204 [DOI] [PubMed] [Google Scholar]
- 20. Williams PE, Goldspink G. Longitudinal growth of striated muscle fibres. Science (80‐). 1971;9(3):751‐767. doi: 10.2307/1934593 [DOI] [PubMed] [Google Scholar]
- 21. White RB, Biérinx AS, Gnocchi VF, Zammit PS. Dynamics of muscle fibre growth during postnatal mouse development. BMC Dev Biol. 2010;10:21. doi: 10.1186/1471-213X-10-21 [DOI] [PMC free article] [PubMed] [Google Scholar]
- 22. Dumont NA, Wang YX, Rudnicki MA. Intrinsic and extrinsic mechanisms regulating satellite cell function. Development (Cambridge). 2015;142(9):1572‐1581. doi: 10.1242/dev.114223 [DOI] [PMC free article] [PubMed] [Google Scholar]
- 23. Moss FP, Leblond CP. Satellite cells as the source of nuclei in muscles of growing rats. Anat Rec. 1971;170(4):421‐435. doi: 10.1002/ar.1091700405 [DOI] [PubMed] [Google Scholar]
- 24. Sambasivan R, Yao R, Kissenpfennig A, et al. Erratum to Pax7‐expressing satellite cells are indispensable for adult skeletal muscle regeneration (development (2011), 138 (3647‐3656)). Development. 2011;138(19):4333. doi: 10.1242/dev.073601 [DOI] [PubMed] [Google Scholar]
- 25. Smith LR, Chambers HG, Lieber RL. Reduced satellite cell population may lead to contractures in children with cerebral palsy. Dev Med Child Neurol. 2013;55(3):264‐270. doi: 10.1111/dmcn.12027 [DOI] [PMC free article] [PubMed] [Google Scholar]
- 26. Domenighetti XAA, Mathewson MA, Pichika R, et al. Loss of myogenic potential and fusion capacity of muscle stem cells isolated from contractured muscle in children with cerebral palsy. Am J Physiol Cell Physiol. 2019;28:247‐257. doi: 10.1152/ajpcell.00351.2017 [DOI] [PMC free article] [PubMed] [Google Scholar]
- 27. Dayanidhi S, Dykstra PB, Lyubasyuk V, Mckay BR, Chambers HG, Lieber RL. Reduced satellite cell number in situ in muscular contractures from children with cerebral palsy. J Orthop Res. 2015; 33(7):1039‐1045. doi: 10.1002/jor.22860 [DOI] [PubMed] [Google Scholar]
- 28. Wren TAL, Cheatwood AP, Rethlefsen SA, Hara R, Perez FJ, Kay RM. Achilles tendon length and medial gastrocnemius architecture in children with cerebral palsy: and equinus gait. J Pediatr Orthop. 2010;30(5):479‐484. doi: 10.1097/BPO.0b013e3181e00c80 [DOI] [PubMed] [Google Scholar]
- 29. Weide G, Huijing PA, Bar‐On L, et al. Gastrocnemius medialis muscle geometry and extensibility in typically developing children and children with spastic paresis aged 6–13 years. Front Physiol. 2020;11:528522. doi: 10.3389/fphys.2020.528522 [DOI] [PMC free article] [PubMed] [Google Scholar]
- 30. Barber L, Hastings‐Ison T, Baker R, Barrett R, Lichtwark G. Medial gastrocnemius muscle volume and fascicle length in children aged 2 to 5 years with cerebral palsy. Dev Med Child Neurol. 2011;53(6):543‐548. doi: 10.1111/j.1469-8749.2011.03913.x [DOI] [PubMed] [Google Scholar]
- 31. Herskind A, Ritterband‐Rosenbaum A, Willerslev‐Olsen M, et al. Muscle growth is reduced in 15‐month‐old children with cerebral palsy. Dev Med Child Neurol. 2016;58(5):485‐491. doi: 10.1111/dmcn.12950 [DOI] [PubMed] [Google Scholar]
- 32. Malaiya R, McNee AE, Fry NR, Eve LC, Gough M, Shortland AP. The morphology of the medial gastrocnemius in typically developing children and children with spastic hemiplegic cerebral palsy. J Electromyogr Kinesiol. 2007;17(6):657‐663. doi: 10.1016/j.jelekin.2007.02.009 [DOI] [PubMed] [Google Scholar]
- 33. Mohagheghi AA, Khan T, Meadows TH, Giannikas K, Baltzopoulos V, Maganaris CN. In vivo gastrocnemius muscle fascicle length in children with and without diplegic cerebral palsy. Dev Med Child Neurol. 2008;50(1):44‐50. doi: 10.1111/j.1469-8749.2007.02008.x [DOI] [PubMed] [Google Scholar]
- 34. Barber L, Barrett R, Lichtwark G. Medial gastrocnemius muscle fascicle active torque‐length and Achilles tendon properties in young adults with spastic cerebral palsy. J Biomech. 2012;45(15):2526‐2530. doi: 10.1016/j.jbiomech.2012.07.018 [DOI] [PubMed] [Google Scholar]
- 35. Gao F, Zhao H, Gaebler‐Spira D, Zhang LQ. In vivo evaluations of morphologic changes of gastrocnemius muscle fascicles and Achilles tendon in children with cerebral palsy. Am J Phys Med Rehabil. 2011;90(5):364‐371. doi: 10.1097/PHM.0b013e318214f699 [DOI] [PubMed] [Google Scholar]
- 36. Filiz A, Can YA. Botulinum toxin type‐a affects mechanics of non‐injected antagonistic rat muscles. J Mech Behav Biomed Mater. 2018;84:208‐216. doi: 10.1016/j.jmbbm.2018.05.027 [DOI] [PubMed] [Google Scholar]
- 37. Kaya CS, Yılmaz EO, Akdeniz‐Doğan ZD, Yucesoy CA. Long‐term effects with potential clinical importance of botulinum toxin type‐a on mechanics of muscles exposed. Front Bioeng Biotechnol. 2020;8:1‐12. doi: 10.3389/fbioe.2020.00738 [DOI] [PMC free article] [PubMed] [Google Scholar]
- 38. Fortuna R, Aurélio Vaz M, Rehan Youssef A, Longino D, Herzog W. Changes in contractile properties of muscles receiving repeat injections of botulinum toxin (Botox). J Biomech. 2011;44(1):39‐44. doi: 10.1016/j.jbiomech.2010.08.020 [DOI] [PubMed] [Google Scholar]
- 39. Inagi K, Connor NP, Schultz E, Ford CN, Cook CH, Heisey DM. Muscle fiber‐type changes induced by botulinum toxin injection in the rat larynx. Otolaryngol Head Neck Surg. 1999;120(6):876‐883. doi: 10.1016/S0194-5998(99)70330-X [DOI] [PubMed] [Google Scholar]
- 40. Dodd SL, Selsby J, Payne A, Judge A, Dott C. Botulinum neurotoxin type a causes shifts in myosin heavy chain composition in muscle. Toxicon. 2005;46(2):196‐203. doi: 10.1016/j.toxicon.2005.03.022 [DOI] [PubMed] [Google Scholar]
- 41. Legerlotz K, Matthews KG, Christopher MD, Smith HK. Botulinum toxin‐induced paralysis leads to slower myosin heavy chain isoform composition and reduced titin content in juvenile rat gastrocnemius muscle. Muscle Nerve. 2009;39(4):472‐479. doi: 10.1002/mus.21247 [DOI] [PubMed] [Google Scholar]
- 42. Kranjc BS, Sketelj J, D'Albis A, Eržen I. Long‐term changes in myosin heavy chain composition after botulinum toxin a injection into rat medial rectus muscle. Investig Ophthalmol Vis Sci. 2001;42(13):3158‐3164. [PubMed] [Google Scholar]
- 43. Rivares C, Vignaud A, Noort W, et al. Glycine receptor subunit‐β‐deficiency in a mouse model of spasticity results in attenuated physical performance, growth, and muscle strength. Am J Physiol Regul Integr Comp Physiol. 2022;322(5):R368‐R388. doi: 10.1152/ajpregu.00242.2020 [DOI] [PMC free article] [PubMed] [Google Scholar]
- 44. Wright J, Rang A. The spastic mouse: and the search for an animal model of spasticity in human beings. Clin Orthop Relat Res. 1990;253:12‐19. doi: 10.1097/00003086-199004000-00003 [DOI] [PubMed] [Google Scholar]
- 45. Mülhardt C, Fischer M, Gass P, et al. The spastic mouse: aberrant splicing of glycine receptor $\beta{\$}subunit mRNA caused by intronic insertion of Ll element. Neuron. 1994;13(4):1003‐1015. doi: 10.1016/0896-6273(94)90265-8 [DOI] [PubMed] [Google Scholar]
- 46. Ferrari A, Manca M, Tugnoli V, Pini LA. Pharmacological differences and clinical implications of various botulinum toxin preparations: a critical appraisal. Funct Neurol. 2018;33(1):7‐18. doi: 10.11138/FNEUR/2018.33.1.007 [DOI] [PMC free article] [PubMed] [Google Scholar]
- 47. Field M, Splevins A, Picaut P, et al. AbobotulinumtoxinA (Dysport®), OnabotulinumtoxinA (Botox®), and IncobotulinumtoxinA (Xeomin®) neurotoxin content and potential implications for duration of response in patients. Toxins. 2018;10(12):535. doi: 10.3390/toxins10120535 [DOI] [PMC free article] [PubMed] [Google Scholar]
- 48. Loos M, Koopmans B, Aarts E, et al. Sheltering behavior and locomotor activity in 11 genetically diverse common inbred mouse strains using home‐cage monitoring. PLoS One. 2014;9(9):e108563. doi: 10.1371/journal.pone.0108563 [DOI] [PMC free article] [PubMed] [Google Scholar]
- 49. Hatzipetros T, Kidd JD, Moreno AJ, Thompson K, Gill A, Vieira FG. A quick phenotypic neurological scoring system for evaluating disease progression in the SOD1‐G93A mouse model of ALS. J Vis Exp. 2015;2015(104):1‐6. doi: 10.3791/53257 [DOI] [PMC free article] [PubMed] [Google Scholar]
- 50. Heslinga JW, Huijing PA. Effects of growth on architecture and functional characteristics of adult rat gastrocnemius muscle. J Morphol. 1990;206(1):119‐132. doi: 10.1002/jmor.1052060112 [DOI] [PubMed] [Google Scholar]
- 51. Tijs C, van Dieën JH, Maas H. Effects of epimuscular myofascial force transmission on sarcomere length of passive muscles in the rat hindlimb. Physiol Rep. 2015;3(11):e12608. doi: 10.14814/phy2.12608 [DOI] [PMC free article] [PubMed] [Google Scholar]
- 52. Mendez J, Keys A. Density and composition of mammalian muscle. Metabolism. 1960;9:184‐188. [Google Scholar]
- 53. Van Der Laarse WJ, Diegenbach PC, Elzinga G. Maximum rate of oxygen consumption and quantitative histochemistry of succinate dehydrogenase in single muscle fibres of xenopus laevis. J Muscle Res Cell Motil. 1989;10(3):221‐228. doi: 10.1007/BF01739812 [DOI] [PubMed] [Google Scholar]
- 54. Bloemberg D, Quadrilatero J. Rapid determination of myosin heavy chain expression in rat, mouse, and human skeletal muscle using multicolor immunofluorescence analysis. PLoS One. 2012;7(4):e35273. doi: 10.1371/journal.pone.0035273 [DOI] [PMC free article] [PubMed] [Google Scholar]
- 55. De Bruin M, Smeulders M, Kreulen M, Huijing P, Jaspers RT. Intramuscular connective tissue differences in spastic and control muscle: a mechanical and histological study. PLoS One. 2014;9(6):e101038. doi: 10.1371/journal.pone.0101038 [DOI] [PMC free article] [PubMed] [Google Scholar]
- 56. van der Meer SFT, Jaspers RT, Jones DA, Degens H. The time course of myonuclear accretion during hypertrophy in young adult and older rat plantaris muscle. Ann Anat. 2011;193(1):56‐63. doi: 10.1016/j.aanat.2010.08.004 [DOI] [PubMed] [Google Scholar]
- 57. Jaspers RT, Feenstra HM, Van Beek‐Harmsen BJ, Huijing PA, Van Der Laarse WJ. Differential effects of muscle fibre length and insulin on muscle‐specific mRNA content in isolated mature muscle fibres during long‐term culture. Cell Tissue Res. 2006;326(3):795‐808. doi: 10.1007/s00441-006-0227-z [DOI] [PubMed] [Google Scholar]
- 58. Das R, Rich J, Kim HM, McAlinden A, Thomopoulos S. Effects of botulinum toxin‐induced paralysis on postnatal development of the supraspinatus muscle. J Orthop Res. 2011;29(2):281‐288. doi: 10.1002/jor.21234 [DOI] [PMC free article] [PubMed] [Google Scholar]
- 59. Cosgrove AP, Graham HK. Botulinum toxin A prevents the development of contractures in the hereditary spastic mouse. Dev Med Child Neurol. 1994;36(5):379‐385. doi: 10.1111/j.1469-8749.1994.tb11863.x [DOI] [PubMed] [Google Scholar]
- 60. Ziv I, Blackburn N, Rang M, Koreska J. Muscle growth in Normal and spastic mice. Dev Med Child Neurol. 1984;26:94‐99. [DOI] [PubMed] [Google Scholar]
- 61. Ziv I, Blackburn N, Rang M, Koreska J. Spastic mice. Dev Med Child Neurol. 1971;26:94‐99. [DOI] [PubMed] [Google Scholar]
- 62. Kruse A, Rivares C, Weide G, Tilp M, Jaspers RT. Stimuli for adaptations in muscle length and the length range of active force exertion—a narrative review. Front Physiol. 2021;12:742034. doi: 10.3389/fphys.2021.742034 [DOI] [PMC free article] [PubMed] [Google Scholar]
- 63. Geiger PC, Cody MJ, Macken RL, Sieck GC. Maximum specific force depends on myosin heavy chain content in rat diaphragm muscle fibers. J Appl Physiol. 2000;89(2):695‐703. doi: 10.1152/JAPPL.2000.89.2.695/ASSET/IMAGES/LARGE/DG0800112004.JPEG [DOI] [PubMed] [Google Scholar]
- 64. Moss RL, Diffee GM, Greaser ML. Contractile properties of skeletal muscle fibers in relation to myofibrillar protein isoforms. Rev Physiol Biochem Pharmacol. 1995;126:1‐63. doi: 10.1007/bfb0049775 [DOI] [PubMed] [Google Scholar]
- 65. Schiaffino S, Reggiani C. Fiber types in mammalian skeletal muscles. Physiol Rev. 2011;91(4):1447‐1531. doi: 10.1152/physrev.00031.2010 [DOI] [PubMed] [Google Scholar]
- 66. Van Der Laarse WJ, Des Tombe AL, Lee‐De Groot MBE, Diegenbach PC. Size principle of striated muscle cells. Neth J Zool. 1998;48(3):213‐223. doi: 10.1163/156854298x00075 [DOI] [Google Scholar]
- 67. Des Tombe AL, Van Beek‐Harmsen BJ, Lee‐De Groot MBE, Van Der Laarse WJ. Calibrated histochemistry applied to oxygen supply and demand in hypertrophied rat myocardium. Microsc Res Tech. 2002;58(5):412‐420. doi: 10.1002/jemt.10153 [DOI] [PubMed] [Google Scholar]
- 68. Van Wessel T, De Haan A, Van Der Laarse WJ, Jaspers RT. The muscle fiber type‐fiber size paradox: hypertrophy or oxidative metabolism? Eur J Appl Physiol. 2010;110(4):665‐694. doi: 10.1007/s00421-010-1545-0 [DOI] [PMC free article] [PubMed] [Google Scholar]
- 69. Beard L, Harro C, Bothner K. The effect of body weight support treadmill training on gait function in cerebral palsy: two case studies. Pediatr Phys Ther. 2005;17(1):72. [Google Scholar]
- 70. Mulligan H, Abbott S. The outcome of a functional exercise programme in an adolescent with cerebral palsy: a single case study. N Z J Physiother. 2004;32(1):30‐38. [Google Scholar]
- 71. Ettema S, Oudenhoven LM, Roeleveld K, Buizer AI, van der Krogt MM. The effect of prolonged walking on muscle fatigue and neuromuscular control in children with cerebral palsy. Gait Posture. 2022;93:7‐13. doi: 10.1016/j.gaitpost.2022.01.004 [DOI] [PubMed] [Google Scholar]
- 72. Damiano DL, Martellotta TL, Sullivan DJ, Granata KP, Abel MF. Muscle force production and functional performance in spastic cerebral palsy: relationship of cocontraction. Arch Phys Med Rehabil. 2000;81(7):895‐900. doi: 10.1053/apmr.2000.5579 [DOI] [PubMed] [Google Scholar]
- 73. Van Den Hecke A, Malghem C, Renders A, Detrembleur C, Palumbo S, Lejeune TM. Mechanical work, energetic cost, and gait efficiency in children with cerebral palsy. J Pediatr Orthop. 2007;27(6):643‐647. doi: 10.1097/BPO.0b013e318093f4c3 [DOI] [PubMed] [Google Scholar]
- 74. Ikeda AJ, Abel MF, Granata KP, Damiano DL. Quantification of cocon‐ traction in spastic cerebral palsy. Electromyogr Clin Neurophysiol. 1998;38:497‐504. doi: 10.1016/s0966-6362(98)90226-0 [DOI] [PubMed] [Google Scholar]
- 75. Unnithan VB, Dowling JJ, Frost GBOO. Role of cocontraction in the O2 cost of walking in children with cerebral palsy. Med Sci Sports Exerc. 1996;31(12):1703‐1708. doi: 10.1097/00005768-199912000-00003 [DOI] [PubMed] [Google Scholar]
- 76. Kovanen V. Intramuscular extracellular matrix: complex environment of muscle cells. Exerc Sport Sci Rev. 2002;30(1):20‐25. doi: 10.1097/00003677-200201000-00005 [DOI] [PubMed] [Google Scholar]
- 77. Ross JJ, Duxson MJ, Harris AJ. Formation of primary and secondary myotubes in rat lumbrical muscles. Development. 1987;100(3):383‐394. doi: 10.1242/dev.100.3.383 [DOI] [PubMed] [Google Scholar]
- 78. Harris AJ. Embryonic growth and innervation of rat skeletal muscles. I. Neural regulation of muscle fibre numbers. Phil Trans Roy Soc Lond B. 1981;293:257‐277. [DOI] [PubMed] [Google Scholar]
- 79. Ross JJ, Duxson MJ, Harris AJ. Neural determination of muscle fibre numbers in embryonic rat lumbrical muscles. Development. 1987;100(3):395‐409. doi: 10.1242/dev.100.3.395 [DOI] [PubMed] [Google Scholar]
- 80. Tamaki T, Uchiyama S. Absolute and relative growth of rat skeletal muscle. Physiol Behav. 1995;57(5):913‐919. doi: 10.1016/0031-9384(94)00359-D [DOI] [PubMed] [Google Scholar]
- 81. Tamaki T, Akatsuka A, Yoshimura S, Roy RR, Edgerton VR. New fiber formation in the interstitial spaces of rat skeletal muscle during postnatal growth. J Histochem Cytochem. 2002;50(8):1097‐1111. doi: 10.1177/002215540205000812 [DOI] [PubMed] [Google Scholar]
- 82. Gonyea W, Ericson GC, Bonde‐Petersen F. Skeletal muscle fiber splitting induced by weight‐lifting exercise in cats. Acta Physiol Scand. 1977;99(1):105‐109. doi: 10.1111/j.1748-1716.1977.tb10358.x [DOI] [PubMed] [Google Scholar]
- 83. Hall‐Craggs EC. The longitudinal division of fibres in overloaded rat skeletal muscle. J Anat. 1970;107(Pt 3):459‐45970. [PMC free article] [PubMed] [Google Scholar]
- 84. Hall‐Craggs ECB. The significance of longitudinal fibre division in skeletal muscle. J Neurol Sci. 1972;15(1):27‐33. doi: 10.1016/0022-510X(72)90119-0 [DOI] [PubMed] [Google Scholar]
- 85. James NT. Compensatory hypertrophy in the extensor digitorum longus muscle of the rat. J Anat. 1973;116(1):57‐65. [PMC free article] [PubMed] [Google Scholar]
- 86. Gonyea WJ. Role of exercise in inducing increases in skeletal muscle fiber number. J Appl Physiol Respir Environ Exerc Physiol. 1980;48(3):421‐426. doi: 10.1152/jappl.1980.48.3.421 [DOI] [PubMed] [Google Scholar]
- 87. Reitsma W. Skeletal muscle hypertrophy after heavy exercise in rats with surgically reduced muscle function. Anat Embryol. 1969;48:237–249. [PubMed] [Google Scholar]
- 88. Hong B, Chen M, Hu X. Influence of injection of Chinese botulinum toxin type a on the histomorphology and myosin heavy chain composition of rat gastrocnemius muscles. J Zhejiang Univ Sci B. 2013;14(11):983‐992. doi: 10.1631/jzus.B1300021 [DOI] [PMC free article] [PubMed] [Google Scholar]
- 89. Huijing PA, Jaspers RT. Adaptation of muscle size and myofascial force transmission: a review and some new experimental results. Scand J Med Sci Sports. 2005;15(6):349‐380. doi: 10.1111/j.1600-0838.2005.00457.x [DOI] [PubMed] [Google Scholar]
- 90. Milne N, Miao M, Beattie E. The effects of serial casting on lower limb function for children with cerebral palsy: a systematic review with meta‐analysis. BMC Pediatr. 2020;20(1):1‐23. doi: 10.1186/s12887-020-02122-9 [DOI] [PMC free article] [PubMed] [Google Scholar]
- 91. Gillett JG, Boyd RN, Carty CP, Barber LA. The impact of strength training on skeletal muscle morphology and architecture in children and adolescents with spastic cerebral palsy: a systematic review. Res Dev Disabil. 2016;56:183‐196. doi: 10.1016/j.ridd.2016.06.003 [DOI] [PubMed] [Google Scholar]
Associated Data
This section collects any data citations, data availability statements, or supplementary materials included in this article.
Data Availability Statement
The datasets generated during this study are subject to an embargo until the publication date of this article. Following the embargo period, the data will be made available in the GitHub repository at 10.5281/zenodo.10987645. Detailed access instructions and any conditions or restrictions related to the use of the data will be provided at this location.