

Abstract
Multiple myeloma is an incurable hematological malignancy that impacts tens of thousands of people every year in the U.S. Treatment for eligible patients involves induction, consolidation with stem cell rescue, and maintenance. High dose therapy with the DNA alkylating agent, melphalan, remains the primary drug for consolidation therapy in conjunction with autologous stem cell transplant; as such, melphalan resistance remains a relevant clinical challenge. Here, we describe a proteometabolomics approach to examine mechanisms of acquired melphalan resistance in two cell line models. Drug metabolism, steady-state metabolomics, activity-based protein profiling (ABPP, data available at PRIDE: PXD019725), acute treatment metabolomics, and western blot analyses have allowed us to further elucidate metabolic processes associated with melphalan resistance. Proteometabolomics data indicate that drug resistant cells have higher levels of pentose phosphate pathway metabolites. Purine, pyrimidine and glutathione metabolism were commonly altered, and cell line-specific changes in metabolite levels were observed, which could be linked to the differences in steady state metabolism of naïve cells. Inhibition of selected enzymes in purine synthesis and the pentose phosphate pathways was evaluated to determine their potential to improve melphalan’s efficacy. The clinical relevance of these proteometabolomics leads was confirmed by comparison of tumor cell transcriptomes from newly diagnosed MM patients and patients with relapsed disease after treatment with high dose melphalan and autologous stem cell transplantation. The observation of common and cell line specific changes in metabolite levels suggest that omics approaches will be needed to fully examine melphalan resistance in patient specimens and define personalized strategies to optimize the use of high dose melphalan.
Keywords: Multiple Myeloma, Metabolism, Activity-based Protein Profiling (ABPP), Proteometabolomics, Purines, Pentose Phosphate Pathway, LC-MS Metabolomics, RNAseq
Graphical Abstract

Introduction
Multiple myeloma (MM) is a bone marrow resident malignancy of plasma cells. It is estimated that MM accounts for 1.8% of total diagnosed cancers in the US and contributes to 2.1% of all cancer-related deaths per annum. MM is more common in males than females and more prevalent in African-Americans than other demographic groups.1 At the current time, MM is treatable, but remains incurable.2 Advances in treatment strategies and development of novel drugs has significantly improved prognosis over the last decade. These treatments fall under several categories: alkylating agents, proteasome inhibitors, histone deacetylase inhibitors, immunomodulatory drugs and monoclonal antibodies.3–4 A common course of therapy consists of three stages of treatment: induction, consolidation, and maintenance.5–6 The current objective of this sequence is to achieve a maximum response and delay disease progression.3 One typical regimen for induction therapy in newly diagnosed MM patients includes a proteasome inhibitor, an immunomodulatory drug, and a corticosteroid.7 After induction, eligible patients undergo consolidation therapy, which involves the administration of high dose melphalan (HDM), a DNA alkylating agent (also called Alkeran®, Evomela®, or L-phenylalanine nitrogen mustard), followed by autologous stem cell transplant (ASCT) for rescue.8–9 In turn, maintenance therapy is administered after the transplant, which primarily consists of an immunomodulatory drug.10 The importance of melphalan in this setting is supported by a median progression-free survival in patients receiving HDM-ASCT of 50 months compared to 36 months in those who did not.11 However, HDM is associated with well-known acute and chronic side effects.6, 12–15 Outside the U.S., melphalan and other alkylating agents remain a central component of initial therapy for transplant ineligible patients in approved 3 and 4 drug combinations.16–18 Accordingly, there remains a critical need to better characterize melphalan resistance to improve our ability to identify patients who are resistant, maximize benefit from HDM or other melphalan-based treatment, minimize risk of toxicity, and identify novel targetable pathways that may be utilized for combination therapy for improved efficacy. 19–20
Melphalan has been used for over 60 years as a chemotherapeutic agent in several types of cancers.21 The similarity of melphalan to an amino acid (specifically phenylalanine) enhances the cellular uptake and assists in chaperoning it to the nucleus, where it binds to DNA and creates interstrand crosslinks through reaction with the N7 of guanine or the N3 of adenine.22–23 As a result, this alkylating agent inhibits DNA replication leading to apoptotic cell death.24 It is used for bone marrow ablation to target MM tumor cells before ASCT.25 In addition to its myeloablative properties, melphalan can poison other hematological cell types leading to immunosuppression as well as other acute and chronic toxicities .26–30 After melphalan treatment and ASCT, minimal residual disease (MRD) remains and ultimately results in relapse.31 Effective alternatives for consolidation therapy have yet to be successful in the clinic, and patient response to melphalan is difficult to predict. One can envision that if patients systemically clear melphalan more rapidly or the MM cells are resistant to melphalan, this strategy will not be as effective, and patients will more rapidly relapse and could derive greater benefit from another mode of therapy. Despite improvements in therapy for MM over the decades, resistance to alkylating agents has persisted as an unmet medical need. Therefore, biomarker discovery to identify patients that benefit most from alkylating agents has obvious value. As such, we expect that improvements to the dosing of and/or use of melphalan regimen would focus its use in patients that would derive the most benefit from this treatment.32–33 Elucidation of mechanisms of resistance to melphalan will help eliminate MRD to prolong progression free survival and improve patient outcomes.
Advanced technologies, such as proteomics and metabolomics, generate data that can address multiple hypotheses in the same experiment and more thoroughly assess the biology of melphalan resistance. These tools allow significant steps forward from our previous understanding of acquired melphalan resistance.19, 34–37 Contributing processes include melphalan detoxification, reduced melphalan uptake, increased base excision repair, reduced interstrand DNA crosslinks, and increased response to oxidative stress, which all lead to decreased apoptosis.37 In additional DNA repair and cell cycle gene sets, our transcriptomic evaluation of melphalan resistance identified increased expression of genes involved in amino acid and glutathione metabolism.35 However, a more directed investigation of the diverse metabolic pathways involved in melphalan resistance has yet to be evaluated. To elucidate these mechanisms, isogenic naïve and chronically exposed drug resistant cell lines model changes in cellular metabolism after chronic drug exposure and their association with melphalan resistance in MM.
Here, we combined metabolomics and proteomics of naïve and drug-resistant cell lines with evaluation of pharmacological inhibitors and transcriptomics data to evaluate the role of metabolic changes in melphalan resistance in MM and their applicability in patient assessment (Figure 1A). We utilized liquid chromatography-mass spectrometry (LC-MS) for in vitro melphalan stability, processing, and drug metabolism, steady-state levels of metabolites in naïve and drug resistant cells as well as during acute treatment to characterize metabolic complexities related to drug resistance. In parallel, we applied activity-based protein profiling (ABPP) with ATP probes to examine enzymes to complement the metabolomics data. As expected, drug processing and efflux were not significantly altered by either of two melphalan-resistant cell lines, enabling the use of these model systems to investigate changes in metabolism associated with melphalan resistance in MM. Therefore, numerous mechanisms are associated with drug resistance, rather than having one event that specifically causes therapeutic escape. Adding to previous publications exploring melphalan resistance, we have shown that levels of metabolites in the pentose phosphate pathway (PPP) were observed at higher levels in both drug resistant cell lines, when compared to their naïve counterparts. Consistent with the potential role of the PPP in melphalan resistance, pharmacological targeting of 6-phosphogluconate dehydrogenase with 6-aminonicotinamide overcame melphalan resistance in both cell line models. Despite the same melphalan resistant phenotype, additional cell line specific changes in metabolic pathways were observed, such as modulation of purine metabolism and glutathione metabolism. These results suggest the acquisition of melphalan resistance employs different metabolic programs informed by the tumor cell’s baseline metabolism. Accordingly, metabolic targeting could enhance patient outcomes from HDM, and proteometabolomics is optimally positioned to assist with biomarker development and monitoring in this process.
Figure 1: Experimental Workflow and Qualification of Melphalan Resistant Cell Lines to Rule out Drug Efflux or Drug Metabolism as Resistance Mechanisms.

Proteometabolomics of naïve and derived drug resistant cell lines was used to investigate changes in metabolism in multiple myeloma cells; pharmacological inhibition of selected enzymes and transcriptomics of multiple myeloma tumor cells from newly diagnosed and relapsed patients were used to evaluate the mechanism and assess potential clinical utility. Ion signals for intracellular levels of melphalan as well as its monohydroxylated and dihydroxylated metabolites were summed; ratios of this total ion signal value in drug resistant cells versus naïve cells show that drug efflux pumps do not significantly contribute to melphalan resistance for 8226 and U266 model systems (B and C, respectively). This metric of exposure shows no overall difference in the levels of melphalan and melphalan metabolites over the first 24 hours after treatment. Furthermore, drug resistant cell lines did not detoxify melphalan faster than their respective naïve cell line. At early time points, drug resistant cells appeared to detoxify melphalan slightly more slowly than naïve cells (D and E). See also Supplemental Table S3. * p < 0.05 and ** p < 0.01.
Materials and Methods
Methods are described here, but a detailed experimental protocol has been previously published.38 Cell culture was performed using complete RPMI-1640 media (R8758, Sigma) with 10% fetal bovine serum (Foundation 900-108, Gemini) and 1% penicillin-streptomycin-glutamine 100x (10378016 Gibco, Thermo). Cell pellets were washed with phosphate buffered saline, PBS (BP2438, Fisher Scientific) prior to harvesting for metabolomics and proteomics. Melphalan was purchased from Sigma (M2011) and prepared in acid ethanol as a 33 mM stock solution and stored at −20 °C. Each aliquot of melphalan stock was diluted to the experimental concentration prior to use. We ruled out degradation of melphalan by direct observation during experiments with LC-MS (see Supplemental Methods). Metabolic inhibitors tested in the cell line panel included Allopurinol (S1630, Selleckchem), Febuxostat (S1547, Selleckchem), and 6-aminonicotinamide (A68203, Sigma); stock solutions were prepared in DMSO. Solvents and additives for LC-MS included LC-MS grade water (Burdick and Jackson), LC-MS grade acetonitrile (Burdick and Jackson), and formic acid (A1171, Thermo).
The following materials were used for immunoblotting: lysis buffer with aqueous 150 mM NaCl (S7653, Sigma), 20 mM Tris pH 7.5 (161-0719, Bio-Rad), 1% Triton X-100 (131193, Fisher), and 0.1% SDS (28365, Thermo ) as well as 0.1% dithiothreitol (Sigma) and a tablet of protease and phosphatase inhibitors (A32961, Thermo). Tris buffered saline containing 0.1% Tween 20, TBS-T, (BP337-500, Fisher Scientific), PVDF membranes (IPFL00010, Immobilon-FL), Ponceau S (P7170, Sigma), and SDS-PAGE running buffer (1610772, Bio-Rad) were used for transfer. Sodium azide (S8032 BioXtra, Sigma) was used for inactivating secondary antibodies. Antibodies against guanine deaminase (ab233221) and xanthine oxidase (ab109235) were purchased from Abcam (Cambridge, UK). Antibodies targeting β-Actin ((C4): sc-47778) were purchased from Santa Cruz Biotechnology (Santa Cruz, CA). Secondary antibodies were purchased from Jackson ImmunoResearch (West Grove, PA).
Cell Culture
Parental naïve cell lines, RPMI-8226 (8226) and U266B1 (U266), were acquired from the American Type Culture Collection (ATCC.org); both of these naïve cell lines routinely have LD50 values for melphalan treatment between 2 and 6 μM. Melphalan resistant cell lines, 8226/LR5 (referred to as LR5) and U266/LR6 (referred to as LR6), were derived in-house from their respective naïve cell lines by chronic exposure to melphalan and have been selected with weekly doses of 5 μM and 6 μM drug, respectively.34, 39 Melphalan resistance was confirmed using CCK-8 reagent (Dojindo Laboratories) for cell viability. To examine the impact of inhibition of selected enzymes in purine synthesis and the pentose phosphate pathway, a larger cell line panel was examined, which was expanded to include H929 and MM1.S cells from ATCC as well as OPM-2 and KAS-6 cells from Cellosaurus. All cell lines were grown in complete RPMI-1640 (Sigma) with 10% fetal bovine serum and 1% penicillin/streptomycin. Cells were grown in a humidified incubator at 37 °C with 5% CO2 (Thermo). Cell identity was confirmed biannually with STR profiling, and cells were checked quarterly to rule out mycoplasma contamination. All steady-state analyses were performed after 1 week after removal of drug to examine durable changes in drug resistance.
Untargeted Metabolomics of Naïve and Melphalan Resistant MM Cells
Five biological replicates of each cell line were used for metabolite identification and quantification with UHPLC-MS using an Ultimate 3000 Ultra High-Performance Liquid Chromatograph and Q Exactive Mass Spectrometer (Thermo, San Jose, CA).38 The LC separation used the following solvent system: A) 100% water 0.1% formic acid and B) 100% ACN with 0.1% formic acid. A 21 minute experiment with a gradient from 0 to 80% B was applied after loading analytes on an ACE C18-PFP reversed phase column. Samples in the autosampler as maintained at 9 °C. An aliquot (2 μL) of each sample is injected for positive ion mode analysis; negative mode analysis uses 4 μL. The UHPLC gradient is delivered at 350 μL/min and includes the following steps: 0% B from 0–3 minutes, ramping to 80% B at 13 minutes, staying at 80% B until 16 minutes, returning to 0% B at 16.8 minutes, and re-equilibration at 600 μL/min until 20.5 minutes. MS instrument parameters included 50 a.u. sheath gas flow rate, 10 a.u. auxiliary gas flow rate, 350 °C auxiliary gas temperature, 3 kV spray voltage, and 325 °C capillary temperature. MS data were acquired for 17.5 minutes over the range, m/z 70–1000 with resolution set to 35,000 at m/z 200. Data were acquired in positive and negative ionization modes in two separate analyses. Metabolites were identified by matching the retention time (0.2 minute window) and the m/z value (5 ppm mass accuracy and 0.001 tolerance) to a library of standards using MZmine2.40 A batch file was used to automate the following modules: centroid mass detection, ADAP chromatogram builder (with 5 scans minimum group size and group intensity threshold and minimum highest intensity set to 1.0E4), smoothing (set to 5), deconvolution by local minimum search (with Chromatographic threshold 95%, 0.05 minutes search minimum in RT range, 10% minimum relative height: 10%, 1.0E4 minimum absolute height, minimum peak top/edge set to 1, and 0.05-5 minutes peak duration), isotopic peak grouping (with 10 ppm m/z tolerance, 0.25 minute Retention time tolerance, and maximum charge state 2), peak alignment (using m/z and RT tolerances from the previous step with 75% weighting for m/z and 25% weighting for RT), gap filling using peak finder (with 10% intensity tolerance and m/z and RT tolerances set as in the previous steps), , duplicate peak filtering (in new average mode with m/z and RT tolerances as above), custom database search (using an in-house library with m/z tolerance 10 ppm and RT tolerance 0.3 minutes), adduct and complexes search, peak list row filtering, and peak list export. Metabolites were selected by |log2 ratio value| >1 and p value < 0.05 and then analyzed with MetaboAnalyst 4.0 41 to identify pathways involved with drug resistance.
Activity Based Protein Profiling (ABPP)
Activity based protein profiling (ABPP) using desthiobiotinylating adenosine triphosphate (ATP) probes characterized ATP-utilizing proteins in naïve and melphalan-resistant cells (88310, Thermo). Reactive probes were added to the cell lysates after depletion of endogenous ATP, which then bound to lysine residues near the ATP binding pocket of their target enzymes. Three biological replicates of each cell line were used. After digestion, avidin-biotin complex capture, and elution, each replicate was analyzed in duplicate with LC-MS/MS. The LC-MS/MS method consisted peptide enrichment on a trapping column and separation using a 120-minute experiment with mobile phases of A) aqueous 2% ACN with 0.1% formic acid and B) 90% ACN/10% water with 0.1% formic acid on a C18 PepMap100 reversed phase column with a RSLCnano Ultra High-Performance Liquid Chromatograph and Q Exactive Plus Mass Spectrometer (Thermo, San Jose, CA). The gradient program was delivers at 300 nl/min and started with 95% solvent A and 5% Solvent B for 8 minutes during sample loading, ramping solvent B from 5% to 38.5% over 90 minutes, ramping solvent B from 50 to 90% over 7 minutes, washing the column for 5 minutes with 90% B, returning to initial conditions over 1 minute prior to 10 minutes of re-equilibration. Sixteen tandem mass spectra were collected in a data-dependent manner following each survey scan using normalized collision energy set at 28 and excluding previously sampled peptide peaks with 10 ppm mass tolerance for 60 seconds. Resolution for MS and MS/MS scans were set at 70,000 and 17,500, respectively. Ion accumulation (AGC) targets for MS and MS/MS scans were set at 3E6 and 1E5, respectively. Peptide identification and quantification was achieved using MaxQuant 42 to search against human entries in the UniProt database with lysine desthiobiotinylation and methionine oxidation as variable modifications. Pathway mapping was performed with GeneGO Metacore (Clarivate Analytics). To evaluate whether ABPP was reporting data for peptides near the active sites or ATP-binding pockets, publicly available Protein Data Bank (PDB) structures were reviewed in the LiteMol viewer at the UniProt website (https://www.uniprot.org/) to visualize the lysine and its relationship to the ATP or nucleotide binding pocket.
Immunoblotting
Western blot analysis was performed in triplicate by separating protein from 8226, LR5, U266 and LR6 cell lysates on a 4-15% precast protein gel (Midi size, Criterion TGX, Bio-Rad). Complete cell lysis buffer was added to each pellet containing 5 x 10⁶ cells and incubated at 100 °C for 5 minutes. After clarification, lysate containing protein from 1x10⁶ cells was added to each well and separated at 100 volts for 1 hour. Gel and PVDF membrane were sandwiched between filter paper and transferred at 100 volts for 45 minutes in 4 °C pre-chilled transfer buffer. β-Actin antibody was used at a dilution factor of 1:1,000, while guanine deaminase (GDA) and xanthine oxidase (XDH/XO) antibodies were used at 1:500. Membranes were incubated in TBS-T and 5% milk at 4 °C overnight on an automated rocker. Goat anti-rabbit secondary antibody with horseradish peroxidase at 1:5,000 dilution was added to both membranes in TBS-T with 5% milk the following day for GDA and XDH/XO binding and incubated at room temperature on an automated rocker for two hours. After incubation, the membrane was washed with TBS-T. Finally, 1 mL of electrochemiluminescence (ECL) substrate (Pierce 32106, Thermo) was added to each membrane for development. After images were recorded on a scanner (V700 Photo, Epson), the membranes were submerged in 5% milk and treated with ~0.5 mg of sodium azide (Sigma) to inactivate the secondary antibody during rocking incubation at room temperature for 1 minute prior to probing with antibodies against β-actin. Goat anti-mouse secondary antibody with horseradish peroxidase was then added at 1:10,000 dilution in TBS-T with 5% milk and incubated on the room temperature rocker for two hours to bind β-actin. ECL detection was redeveloped as described above.
In vitro Pharmacokinetics and Pharmacodynamics using Untargeted Metabolomics of Acute Melphalan Treatment in MM Cells
In order to assess the extra- and intra-cellular melphalan products and endogenous metabolites, cell culture media and cell pellets were collected at 0, 0.5, 1, 2, 4, 6 and 24 and measured using LC-MS. All cell culture flasks were placed in a 37 °C incubator during the experiment. Melphalan was added after the 0 hour pre-treatment sample was taken. Quantification of melphalan, monohydroxymelphalan and dihydroxymelphalan was achieved with UHPLC-MS using a Vanquish Ultra High-Performance Liquid Chromatograph and Q Exactive HF Orbitrap mass spectrometer (Thermo, San Jose, CA). The LC analysis method consisted of a 21-minute gradient with 0% B to 80% B on an ACE C18-PFP reversed phase column with the following mobile phases: A) LC-MS grade water with 0.1% formic acid and B) LC-MS grade acetonitrile. Samples in the autosampler were maintained at 5 °C, and 4 μL was injected for LC-MS. The column temperature was maintained at 30 °C. The gradient is delivered at 350 μL/min included loading at 0% B from 0–3 minutes, ramping from 0% to 80% B over 13 minutes, washing at 80% B until 16 minutes, returning to 0% B at 16.5 minutes, and re-equilibrating at 600 μL/min until 21 minutes. All samples were analyzed in positive mode with a resolution of 120,000 at m/z 200 with a heated electrospray ion source with 50 a.u. sheath gas flow rate, 10 a.u. auxiliary gas flow rate, 350 °C auxiliary gas temperature, 1 a.u. sweep gas flow rate, 3.5 kV spray voltage, and 320 °C capillary temperature; data were acquired for m/z 60–900 with resolution set to 120,000. Maximum injection time was set to 100 ms with automatic gain control at 3E6. After LC-MS data acquisition, extra- and intra-cellular melphalan detoxification products were identified by XCalibur Quan Browser (Thermo, San Jose, CA), and the endogenous metabolites in each cell line were identified with MZmine2, as described above.40
Proteometabolomic Pathway Mapping
Known metabolites identified by library matching selected as significant by a p value < 0.05 and differentially expressed by |log2 ratio value| greater than one standard deviation from the mean of known metabolites were put into MetaboAnalyst 4.0 41 for pathway analysis of each cell line model. Log2 transformation was used prior to statistical analysis. Iterative rank order normalization (IRON) is used to normalize metabolite and peptide signals of untargeted steady-state metabolomics, ABPP and acute treatment metabolomics data sets.43 Consistent differences in metabolites and labeled peptides selected by log2 ratio and p values were mapped and integrated to pathways manually. Pathway maps were adapted from the Kyoto Encyclopedia of Genes and Genomes (KEGG).44
Cell Viability Assays to Evaluate Impact of Inhibiting Metabolic Enzymes
Cell lines were cultured in RPMI-1640 medium supplemented with 10% fetal bovine serum, 100 μg/mL penicillin-streptomycin and 100 μg/mL non-essential amino acids. KAS-6 also required 1 ng/mL recombinant human Interleukin 6. The CCK-8 assay was used to measure the cytotoxic effects of Allopurinol, Febuxostat, and 6-aminonicotinamide (6-AN) over a range of concentrations, from DMSO vehicle control to 150 μM, to quantify changes in cell survival using each metabolic inhibitor as a single agent or in combination with melphalan. Cells were plated at 1,500 per well in 384 well plates in 90 μL of media. After 72 hours, the extent of cell growth was assessed by adding 9 μL of CCK-8 assay reagent to each well, followed by incubation for 3 hours at 37°C. The absorbance at 450 nm was determined by a multiplate reader (Cytation3, BioTek). For each drug concentration, mean absorbance values were calculated from 4 replicate wells, and cell viability was expressed as a percentage of control (untreated) cells. Data were acquired in 4 replicate experiments and averaged. Statistical significance was determined by 2-tailed t-tests assuming unequal variance.
Molecular Genomics of MM Cells from Newly Diagnosed and Relapsed Patients
Multiple myeloma cells were purified from bone marrow aspirates by CD138 affinity chromatography (Miltenyi, Bergisch Gladbach, Germany), and nucleic acids were isolated from frozen tissue samples containing 1 million purified myeloma cells. DNA extraction was performed using Qiagen QIASymphony DNA purification. RNA extraction was performed using Qiagen RNAeasy plus mini kits. RNASeq was performed using the Illumina TruSeq RNA Exome with single library hybridization, cDNA synthesis, library preparation, and sequencing performed on an Illumina NovaSeq 6000 instrument to 100 million reads per sample. Relative gene expression was calculated as z-normalized data.
Adapter sequences were trimmed from the raw tumor sequencing FASTQ file via k-mer matching, quality trimming, contaminant-filtering, sequence masking, GC-filtering, length filtering and entropy-filtering. The trimmed FASTQ file was used as the input for the read alignment process using the human genome reference (GRCh38/hg38, available at https://www.ncbi.nlm.nih.gov/assembly/GCF_000001405.39) and the Gencode genome annotation v. 32 using the Spliced Transcripts Alignment to a Reference (STAR) software.45 STAR generated multiple output files used for Gene Fusion Prediction and Gene Expression Analysis. RNA expression values were calculated and reported by RNA-Seq by Expectation Maximization (RSEM) 46 using estimated mapped reads, Fragments Per Kilobase of transcript per Million mapped reads (FPKM), and Transcripts Per Million mapped reads (TPM) at both transcript level and gene level based on transcriptome alignment generated by STAR. Further processing of the RNAseq expression data eliminated analytical variability and batch effects associated with preservation methods. Multitier RNAseq expression data normalization was performed to generate normalized log2(TPM) values. Scaling factors are calculated based on a mean TPM range of 35% - 95% for protein-coding genes, and scaled TPM was log2 transformed using the following equation: log2(TPM+0.001). Values were LOESS normalized using limma 47 in R (www.r-project.org) with a span of 0.66. To address the normalization of different preservation methods, ComBat 48 is used to eliminate batch effects and the impact of different preservation methods (FBS/DMSO viability preservation, snap frozen, or other methods were used for heme malignancies). Since multiple myeloma cells were enriched by CD138 positive selection, their transcriptomes were processed separately from other datasets. During this process, outliers were identified by principal component analysis and removed from the dataset. For the comparison here, transcript levels from the RNAseq data were compared for MM tumors cells from newly diagnosed patients prior to treatment (n = 177) and from MM tumors refractory to high dose melphalan and ASCT (n = 52) using violin plots and p values calculated by Student’s t-tests.
Results and Discussion
Resistant Cells do not Detoxify Melphalan Faster than Naïve Cells
The stability of melphalan was evaluated during protein precipitation and storage in the metabolite extraction solvent (Supplemental Tables S1 and S2) by comparing the ion signals observed for melphalan and its oxidative dechlorination degradation products. No significant changes in melphalan ion signal were observed during extraction or storage in the autosampler prior to LC-MS analysis, so drug quantification could be integrated with our metabolomics workflow.
To confirm that melphalan resistance was not linked to differential rates of drug efflux or detoxification, we compared intracellular and extracellular levels of melphalan and its metabolites in sensitive and melphalan resistant cell line pairs. When compared to control incubation in cell culture media (Supplemental Figure S1), increased oxidative dechlorination of melphalan was observed in both naïve and melphalan resistant cell cultures when examining both extracellular levels in cell culture media and intracellular levels using cell pellets (Supplemental Figures S2 and S3), so all cell lines detoxify melphalan faster than it spontaneously decays. Melphalan half-life values for all cell lines were approximately 4 hours. Total intracellular drug and melphalan metabolite levels were not significantly different between naïve and drug resistant cell lines (Figure 1B and 1C, Supplemental Table S3); average ratios for 24 hours after treatment of the summed signal intensity of melphalan and its hydroxylated metabolites in drug resistant and naïve cells were 1.03 for LR5/8226 and 0.995 for LR6/U266. Total levels of melphalan and its metabolites are lower at 30 minutes in drug resistant cells compared to the naïve parental cells, but the differences were not significant (p > 0.05). To compare intracellular drug levels, the average ratios for 24 hours after treatment of the melphalan ion signals from metabolite extracts of melphalan resistant and naïve cells were 1.05 for LR5/8226 and 1.27 for LR6/U266. Therefore, the total drug exposure was similar in melphalan-resistant cells when compared to their naïve parental cells (not significant according to Student’s t-test), which ruled out changes in drug efflux transporters as a major contributor to melphalan resistance in these models.
The formation of detoxified melphalan metabolites differed only slightly between naïve and melphalan resistant cells; incrementally higher levels of detoxified metabolites were observed in naïve cells when compared to their drug resistant counterparts (Supplemental Figures S2 and S3). To compare detoxification rate, the detoxified-to-reactive ratio of the fully detoxified dihydroxymelphalan to the sum of the unmetabolized drug and its reactive metabolite, monohydroxymelphalan, were calculated in naïve and drug resistant cells (Figure 1D and 1E, Supplemental Figure S4). Melphalan processing in naïve and resistant cells were then compared using these detoxified-to-reactive ratios. Minor differences are observed at early time points, but differences between the naïve and drug-resistant cells were gone within 2 hours after treatment. LR5 cells did not detoxify melphalan as quickly as 8226 naïve cells; the detoxified-to-reactive ratios were lower in drug resistant cells at 30 minutes (resistant-to-naïve ratio 0.45, p = 0.011) and 1 hour after treatment (resistant-to-naïve ratio 0.56, p = 0.013). LR6 cells did show higher detoxification than U266 naïve cells at 30 minutes after treatment (resistant-to-naïve ratio 1.72, p = 0.0045), but the difference was gone at the 1 hour time point. Therefore, drug detoxification may play minor role in melphalan resistance in LR6 cells, but not in LR5 cells. Given the transience of these differences (0.5-1 hours) in comparison to the 4 hour half-life of melphalan in these cell lines, the contribution of drug detoxification was expected to be minimal. As hypothesized above, these experiments confirmed that drug transport and detoxification were not the major modes of drug resistance in these cell lines. In addition, no other melphalan metabolites, including drug conjugates with guanine or glutathione, were detected in these experiments in either the cells or the culture media, ruling out differences in glutathionylation or other detoxification strategies.49–50 These data indicate melphalan resistance is not dependent on changes in drug detoxification, consistent with previously published results 34 and supporting the hypothesis that other metabolic changes are contributing to drug resistance.
The Metabolome is Altered in Acquired Melphalan Resistance
Having confirmed that melphalan detoxification was not a major contributor to melphalan resistance in our models, we next focused on the metabolome. Untargeted metabolomics of naïve and drug resistant cells revealed differences between the naïve parental cell lines as well as changes in metabolites associated with acquired drug resistance. In this dataset (see Supplemental Table S4), 2,666 ion signals were consistently detected; these data included 164 knowns annotated with m/z and retention time. The two parental cell lines differ in their baseline metabolism and have significant differences in metabolite levels. Specifically, U266 is more dependent on oxidative phosphorylation, while 8226 cells are more glycolytic; differences in metabolite levels for these cellular energetics pathways were observed in the metabolomics data (Supplemental Figure S5). In addition, several pathways expected to be involved detoxification and DNA repair in support of melphalan resistance (e.g. glutathione, pyrimidine, and purine synthesis) also showed significant differences in baseline metabolite levels in these two naïve cells (Supplemental Figure S6).
Because the naïve and drug resistant cell lines are paired, differences within each model system were considered first prior to examination of common or cell line specific changes. In 8226 and LR5, 12 metabolites were consistently higher in drug resistant cells, while 9 metabolites were consistently lower in drug resistant cells (|log2 ratio| exceeding 1 standard deviation from the mean of library-identified metabolites, p value < 0.05). Applying the same criteria in U266 and LR6, 10 metabolites were consistently higher in drug resistant cells, while 16 metabolites were consistently lower in drug resistant cells. In Figure 2A and 2B, heat maps illustrate the differentially detected metabolites in 8226 and LR5 as well as U266 and LR6 cells (see the full list provided in Supplemental Table S4 as well as the correlation plot and Venn diagram in Supplemental Figure S7). The same selected data were submitted to MetaboAnalyst 4.0 for pathway analysis.41 Although the selected metabolites had both similarities and differences between 8226 and U266 cell line models, they consistently indicated changes in the same pathways (Figure 2C and 2D as well as Supplemental Figure S8). Alterations in the pentose phosphate pathway, purine synthesis, and glutathione metabolism were observed in melphalan resistance and need to be further investigated as potential vulnerabilities.
Figure 2: Steady-state Metabolomics Reveals Metabolites and Pathways Associated with Melphalan Resistance.

Five replicates of naïve and drug resistant cells were analyzed with LC-MS metabolomics. Using log2 ratio values to compare metabolite levels in naïve and resistant cells, known metabolites from library matching observed with levels >1 standard deviation from the mean log2 ratio of the known metabolites and with a p-value < 0.05 are visualized in heat maps to compare the largest and most consistent differences in metabolites in the 8226 (A) and U266 (B) model systems. Red signifies metabolites that are observed at higher levels in drug resistant cells and blue indicates lower levels in resistant cells. MetaboAnalyst 4.0 was used to define pathways associated with these metabolites for the 8226 (C) and U266 (D) model systems. Data are presented in Supplemental Table S3. Additional details for the MetaboAnalyst results are shown in Supplemental Figure S8.
The Proteome is Altered in Acquired Melphalan Resistance
To complement these metabolomics results, we performed activity-based protein profiling (ABPP) on the same isogenic models of melphalan resistance and integrated the data for ATP probe uptake into our proteometabolomic analysis. ABPP was performed on 3 biological replicates of each naïve and drug resistant cell line with 2 LC-MS/MS analyses for each sample. In this dataset (see Supplemental Table S5), 7,230 desthiobiotinylated (DTB) peptides were detected and quantified by ion signal intensity. As with the metabolites, we examined the differences in ATP probe binding and chemical labeling between naïve and drug resistant cells for each cell line. In 8226 and LR5, 32 DTB peptides were consistently higher in drug resistant cells, while 16 DTB peptides were consistently lower in drug resistant cells using the following selection criteria: detected in > 80% of samples, |log2 ratio| exceeding 2 standard deviations from the global mean, and p value < 0.05. Applying the same criteria in U266 and LR6, 6 DTB peptides were consistently higher in drug resistant cells, while 20 DTB peptides were consistently lower in drug resistant cells. Heat maps were prepared for the most differentially desthiobiotinylated peptides between naïve and drug resistant cells (see Supplemental Figure S9). Pathway mapping of the changes in the proteome detected by ATP probe uptake and desthiobiotinylation indicated diverse mechanisms contributing to drug resistance (Supplemental Figure S9 and Supplemental Table 6). ABPP indicated specific pathways associated with drug resistance in both cell line pairs, but there was little overlap with the pathways determined by MetaboAnalyst, because only some steps in these metabolic pathways involve ATP-binding enzymes. Specifically, some of the enzymes in the metabolic pathways were not detected in the ABPP experiment. Based on these results, we continued to focus on changes in the metabolomics data that could be further supported by manual curation of the ABPP data to produce annotated pathway maps.
Upregulation of the Pentose Phosphate Pathway in Melphalan Resistance
To focus on common metabolic changes in both LR5 and LR6, the metabolites in the pentose phosphate pathway (PPP) have higher intracellular stores after the acquisition of drug resistance (Figure 3). Increased erythrose-4-phosphate, 6-phosphogluconic acid, and D-ribose-5-phosphate/ribulose-5-phosphate PPP intermediates are detected in increased quantities in both drug resistant cells, when compared to their naïve counterparts. Integration of the ABPP results provides complementary data showing changes in the probe uptake for ribose-phosphate pyrophosphokinase 1 (PRPS1). PRPS1 is a critical enzyme that converts ribose-5-phosphate to phosphoribosyl pyrophosphate (PRPP) upstream of purine and DNA synthesis. Ion signal for 2 DTB-labeled PRPS1 peptides increased in both drug resistant cell lines, which could indicate either higher protein expression or increased enzymatic activity. Values for PRPS1 in Figure 3 were taken from the DTB-labeled peptide containing K194 with the peptide sequence unique to PRPS1, LNVDFALIHK(de)ERK, where the desthiobiotinylated lysine is denoted by (de). PRPS1 utilizes ATP to provide diphosphate to make 5-phospho-α-D-ribose 1-diphosphate. Using the Protein Data Bank 2HCR structure from Li et al.,51 K194 is located near the binding pocket and oriented toward the reactive site for desthiobiotinylation when the ATP probe is in the enzyme’s ATP-binding pocket, so this peptide is expected to report specifically on probe binding into the enzyme. The change in the amount of this labeled PRPS1 peptide was greater between LR5 and 8226 (p < 0.05), perhaps because the U266 naïve cell line already had higher levels of PRPS1 ABPP labeling than the 8226 naïve cells. As the PPP produces critical metabolites for purine and DNA synthesis, these findings are consistent with the increased need for DNA repair in melphalan resistance and confirm increased stores of the metabolites needed to support those pathways. These data suggest that the PPP is a common metabolic pathway associated with melphalan resistance deserving further investigation as a therapeutic vulnerability or biomarker of alkylator resistance.
Figure 3: Common Metabolic Changes in Melphalan Resistance in both 8226 and U266 Model Systems Indicate the Importance of the Pentose Phosphate Pathway.

A diagram of the pentose phosphate pathway and guanine salvage has been annotated heat maps for each detected metabolite; if the metabolite was not detected, no data are shown. Font color is used to indicate whether a metabolite is higher in resistant cells (red), lower in resistant cells (blue), unchanged in acquired drug resistance (black), or undetected (gray). Protein ellipses indicate the results from ABPP for 8226/LR5 (left half) and U266/LR6 (right half); both annotated proteins were labeled more in LR5 cells, but not in the LR6 cells, when compared to their naïve counterparts. Asterisks indicate isomers that are indiscernible by LC-MS. Ion signal log2 values in the bar graph represent PRPS1 (K194_LNVDFALIHK(de)ERK) and HPRT1 (K103_LK(de)SYCNDQSTGDIK) ATP probe uptake in naïve cells 8226 and U266 (N) and resistant LR5 and LR6 (R).
Altered Purine Metabolism is Associated with Melphalan Resistance
Our proteometabolomic analysis also demonstrated that resistant cells had differences in levels of purine metabolites; however, the differences were cell line specific and could indicate challenges with disrupting the network of purine metabolism that has several redundancies to maintain purine synthesis. In both cell line pairs, guanine and guanosine were observed at lower levels in drug resistant cells, yet GMP was unchanged (Figure 3B). Unchanged levels of GMP in both resistant cell lines could be indicative of pooled amounts that are constantly being made and then subsequently used for DNA synthesis. These data suggest that purine metabolism or purine salvage is altered to maintain levels of GMP in the context of chronic melphalan exposure, but isotope tracer experiments or metabolic flux calculations would be needed for confirmation. Importantly, our data demonstrate that LR5 (8226) and LR6 (U266) cells appear to utilize different mechanisms to achieve this goal (see Figure 4A and Supplemental Figure S10). In the 8226-derived LR5 cells, xanthine accumulates, while XMP is observed at lower levels. Furthermore, increases in LR5 ABPP probe uptake are observed for several enzymes in this pathway in drug resistant cells relative to their naïve counterparts. First, desthiobiotinylation of hypoxanthine-guanine phosphoribosyltransferase (HPRT1), which converts purine bases into purine nucleotides, was consistently higher in LR5 than 8226. Values for HPRT1 in Figure 3 and Figure 4A were taken from the DTB-labeled peptide containing K103 with the peptide sequence: LK(de)SYCNDQSTGDIK, which is unique to HPRT1. While HPRT is not expected to enzymatically modify adenine bases to make AMP (that function is carried out by adenine phosphoribosyltransferase), HPRT1 does bind purines, including guanine/GMP and hypoxanthine/inosine monophosphate, so the ABPP probe may bind promiscuously to this protein, particularly given its high concentration (10 mM) in this experiment. Using the Protein Data Bank 1BZY structure from Shi et al.,52 K103 is in a disordered loop that passes over the active site, so this lysine should be accessible to desthiobiotinylation by the ATP probe when it is bound in the active site. ABPP labeled peptides from adenosine monophosphate dehydrogenase 3 (AMPD3), inosine monophosphate dehydrogenase (IMPDH), and guanosine monophosphate synthase (GMPS) were also observed at higher levels in LR5 cells than 8226 naïve cells. A comprehensive list of ABPP DTB-labeled peptides is provided in Supplemental Table S5. Together, these enzymatic and metabolic changes are consistent with the hypothesis that GMP production could be driven by higher levels of metabolites in the PPP, altered levels of purine monophosphate nucleosides, and guanine conversion into xanthine for purine salvage in acquired melphalan resistance in LR5 cells, but the hypothesis would need to be confirmed with isotope tracer experiments or metabolic flux calculations. Further evidence to support this hypothesis was shown by immunoblots for guanine deaminase (GDA) and xanthine dehydrogenase/xanthine oxidase (XDH/XO), which complemented the ABPP data by indicating increases in protein expression in acquired melphalan resistance in LR5 cells consistent with the proteometabolomic analysis (Figure 4B and 4C, respectively and Supplemental Figure S11).
Figure 4: Levels of Purine and Glutathione Metabolites are Altered in Melphalan Resistance in LR5 Cells.
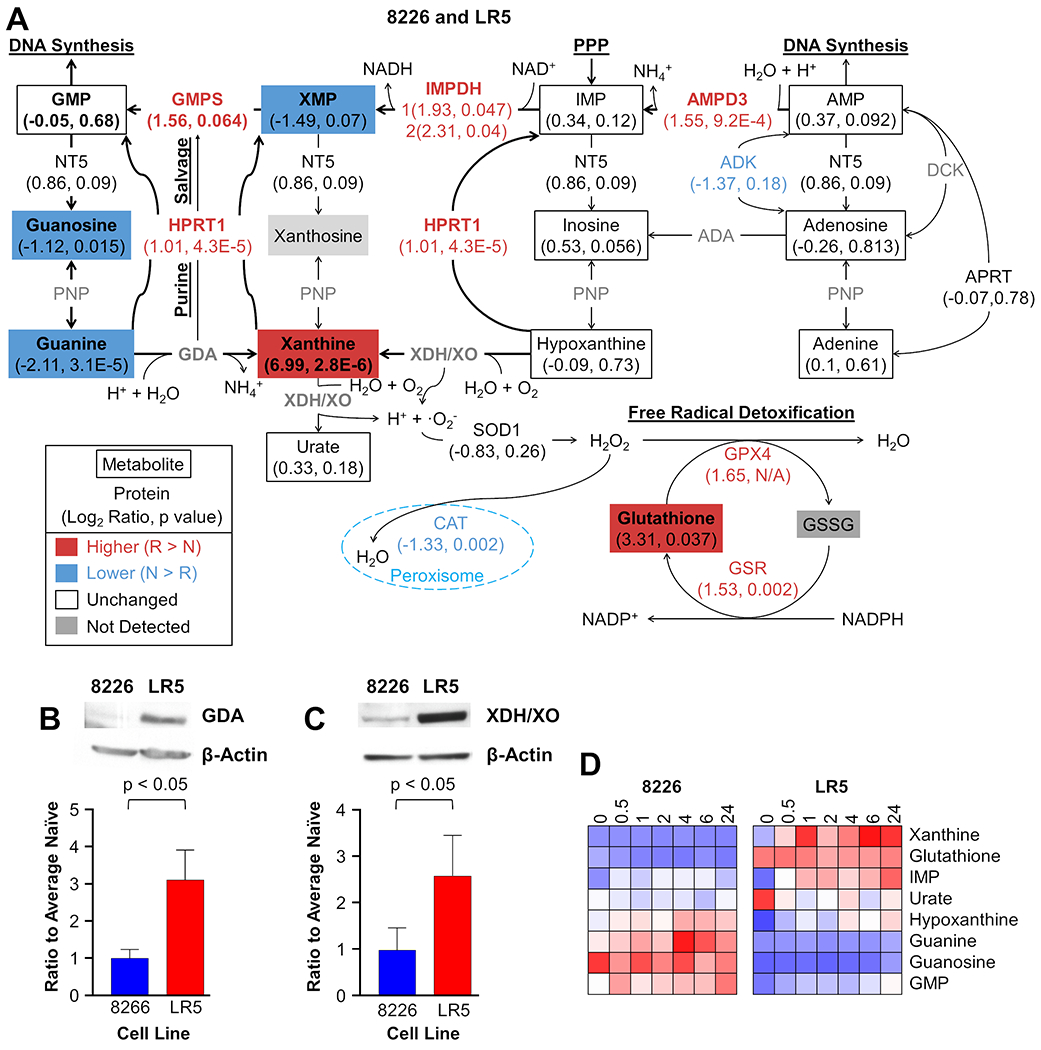
Proteometabolomics data combining untargeted metabolomics and activity-based protein profiling with ATP probes were mapped on the purine synthesis pathway to illustrate differences between naïve 8226 cells and LR5 drug resistant cells (A). Other than guanine and guanosine, differences between naïve and resistant cells in this model system are not recapitulated in U266/LR6 model system, yet other changes are noted in this pathway (see Supplemental Figure S10 for comparison). Metabolites are shown in rectangles, while proteins are listed as text associated with the arrows denoting relationships between metabolites; both are annotated with the log2 ratio followed by the p value. |Log2 ratio| > 0.5 and a p value < 0.05 or a |log2 ratio| > 1 were considered changed. Red indicates higher values in drug resistant cells, blue shows lower values in drug resistant cells, and white is used when no significant difference was observed. N/A is used for the p value when the number of measurements were insufficient for a t test. Metabolites and proteins in bold font and arrows with heavier line thickness represent potential metabolic reprogramming of purine synthesis and salvage to maintain GMP levels in melphalan resistant cells. To further support the proteometabolomics data, Western blots were used to assess levels of guanine deaminase, GDA (B) and xanthine dehydrogenase/oxidase, XDH/XO, (C) for 8226 and LR5 cells with bar graphs presenting the densitometry data from 3 replicates. Heat maps (D) show relative levels of purine metabolites in 8226 (left) and LR5 (right) cells up to 24 hours after acute melphalan exposure at the LD50 of the naïve cells. Ion signal intensity (relative abundance) is normalized to the average naïve cell pretreatment controls. Red indicates increased levels from the 0-hour time point in naïve cells, white is unchanged, blue is decreased levels, and grey is not detected.
We also observed increased glutathione (GSH) levels in LR5, which had been previously described.34 A possible role for higher glutathione levels could be linked to detoxification of ammonium cations produced by GDA and AMPD3 as well as superoxide anions produced by XDH/XO.53 Additionally, the loss of catalase and increased ATP probe uptake by GPX4 in LR5 cells was also consistent with increased detoxification of hydrogen peroxide through GSH scavenging (Figure 4A).54
Different purine metabolites were modulated in the U266 and LR6 melphalan resistance model. In LR6 cells, inosine monophosphate (IMP) levels increased, urate decreased, and adenosine levels dropped (Supplemental Figures S10). The increased signal for AMPD3 peptides in LR6 in the ABPP experiment suggests that adenosine may be lower due to increased conversion of AMP to IMP to support GMP synthesis, but this result would need to be confirmed with isotope tracer experiments or metabolic flux calculations. Except for lower levels of guanine and guanosine and higher ATP probe uptake of AMPD3, the LR6 cells did not share the same alterations in purine metabolism that are shown by LR5 cells; in fact, most steady-state levels of purine metabolites did not change in this model system. These results suggest that acquired melphalan resistance employs different metabolic programs that converge to produce a common drug resistance phenotype.
Cell Line Responses to Acute Melphalan Treatment
Thus far, we have illustrated steady state changes in metabolomics associated with melphalan resistance. To examine the metabolic changes during acute melphalan treatment and determine whether chronic exposure selected for changes needed for intrinsic drug resistance, selected metabolites were monitored over time with LC-MS in positive ion mode in naïve and drug resistant cells after melphalan exposure at their LD50. We focused on GSH and purine synthesis to further evaluate the dependencies of the individual isogenic pairs and their cell specific metabolic networks of resistance.
First, we focused on the commonalities between the metabolic changes in both melphalan resistant cell lines: LR5 and LR6. IMP levels increased and GMP remained steady in both resistant cell lines during acute treatment with melphalan (Figure 4D, Supplemental Figures S12 and S13, and Supplemental Tables S7 and S8). After melphalan exposure, LR5 cells gradually increased IMP, while LR6 exhibited an initial spike of IMP in LR6 at 0.5 hours, which then steadily leveled off. Consistent with pools of GMP in the steady state data, GMP levels remained relatively unchanged throughout the 24 hours after treatment in naïve and resistant cells. Increased IMP and constant levels of GMP in resistant cells are consistent with upstream activation of the PPP feeding into purine and DNA synthesis. Additionally, guanine and guanosine levels were lower in both resistant cell lines throughout the 24 hours without significant modulation after exposure.
Acute treatment metabolism confirms the metabolites involved in the metabolic reprogramming responsible for maintaining melphalan resistance. After melphalan is introduced, LR5 cells had increased levels of xanthine and hypoxanthine, while 8226 naïve cells had increased guanine levels. More specifically, the LR5 resistant cells increased xanthine levels 3 to 6 times higher after melphalan exposure compared to their steady-state pre-treatment levels (0 hours) and hypoxanthine levels increased to similar levels as those in 8226 naïve cells at 24 hours (Figure 4D, Supplemental Figure S13 and Supplemental Table S7). Guanine was lower in resistant cells than naïve, and GSH was higher, but neither are modulated significantly after melphalan treatment in LR5. Increased xanthine after melphalan exposure is consistent with the steady-state metabolomics data as well as the increased expression of GDA and XDH/XO (Figure 4B and 4C). Additionally, urate was higher at 0 hours in LR5, but goes down to relatively similar levels as naïve after melphalan was introduced, suggesting that increased xanthine levels are not producing urate, but rather entering purine salvage and feeding GMP production (Figures 4A, 4D and Supplemental Figure S12). However, urate efflux could be changed, and isotope tracer experiments or metabolic flux calculations would definitively determine changes in the utilization of the purine salvage pathway.
GSH levels were higher in LR5 and lower in LR6 throughout the 24 hours, consistent with the steady-state metabolomics data and previous findings (Figure 4D, Supplemental Figures S12 and S13, and Supplemental Table S4) 34. However, GSH levels went down after treatment and were considered significantly decreased at 6 and 24 hours in both resistant cell lines indicating consumption of this metabolite during acute treatment. Hypoxanthine levels were lower at LR5 at 0 hours but by 24 hours the LR5 resistant cells have similar stores to those of the naïve 8226 cells. Xanthine and hypoxanthine metabolite fluctuations observed in purine metabolism of LR5 were not observed in LR6 (Supplemental Figure S13). Increased IMP in both cell lines and xanthine production in LR5 illustrate the immediate metabolic response by resistant cells. Metabolic fluctuations in response to melphalan characterize the activated pathways involved in resistance and elucidate targets for inhibition.
Using Metabolic Inhibitors to Overcome Melphalan Resistance
To examine the potential for combination therapy approaches and build on metabolic inhibitor studies reported by Zub et al.,37 cell viability studies were conducted for treatment with Febuxostat and Allopurinol inhibiting xanthine oxidase in the purine synthesis pathway as well as 6-aminonicotinamide (6-AN) inhibiting glucose-6-phosphate dehydrogenase in the pentose phosphate pathway (PPP). Febuxostat and allopurinol had no impact on cell viability and did not potentiate the effects of melphalan (Supplemental Figure S14). These results were expected, because no synergy or improvement in melphalan efficacy has been noted when allopurinol has been given concomitantly with melphalan for prophylaxis of tumor lysis syndrome. However, treatment with 6-AN did have single agent activity with median lethal dose (LD50) values ranging from 4.88 to 34.67 μM in a panel of MM cell lines (Figure 5A); these values are significantly lower than the low mM concentrations applied when 6-AN is used as a tool compound to inhibit the pentose phosphate pathway for metabolism studies.37 6-AN overcame melphalan resistance in both the 8226 and U266 model systems; naïve and melphalan resistant cells were equally susceptible to treatment with single agent 6-AN (Figure 5B, 5C), as indicated by similar LD50 values. When examined in combination with melphalan, 6-AN (1 μM) did increase cell death in LR5 when compared to 8226 (Figure 5D) and in LR6 when compared to U266 (Figure 5E). Cell viability data after treatment with 6-AN alone and in combination with a low fixed dose of melphalan also show the impact of PPP inhibition in combination with melphalan (Supplemental Figure S15). These data indicate a novel role for targeting the PPP in MM and the potential for combination treatment to overcome melphalan resistance, though a therapeutic window has not yet been determined.
Figure 5: Multiple Myeloma Cell Lines are Sensitive to Pentose Phosphate Pathway and Tumor Cell Death is Increased by Combination Treatment with Melphalan and 6-Aminonicotinamide.
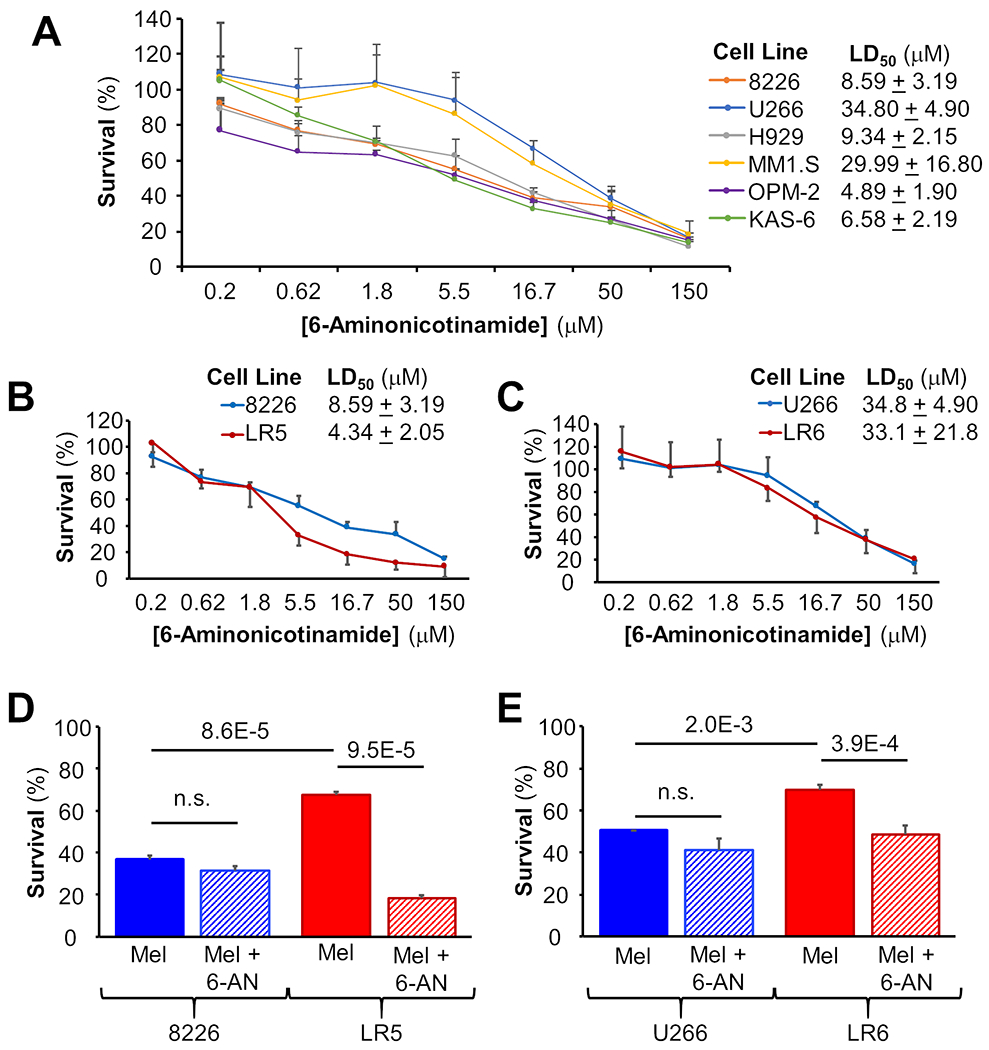
Cell viability assays for six MM cell lines treated with 6-aminonicotinamide (6-AN) show LD50 values in the low micromolar range (A). Melphalan-resistant LR5 cells are more sensitive to 6-AN than 8226 naïve cells (B), but no difference is observed between LR6 and U266 cells (C). Combination treatment with melphalan and 6-AN in combination does not improve efficacy in 8226 or U266 naïve cells but does in LR5 and LR6 melphalan-resistant cells (D and E, respectively).
Evaluation of Gene Expression in Primary Patient Specimens
To further assess potential clinical applicability of the metabolic pathways associated with melphalan resistance in cell lines, the levels of selected genes related to the PPP, purine metabolism and glutathione metabolism implicated in the proteometabolomics data were compared in RNAseq data from primary patient samples from 177 therapy-naïve and 52 patients who relapsed after high dose melphalan and autologous stem cell transplantation (HDM-ASCT). In the PPP, increased relative expression was observed in PRPS1, RPIA, TKT, ALDOA and TALDO1 (Figure 6). PGD and IDNK were not significantly different between naïve and relapsed patients. Genes related to purine metabolism including: HPRT1, GDA, GMPS, IMPDH and APRT were also observed with increased expression in relapsed patients after HDM-ASCT; however, XDH and PNP expression were unchanged and not significant. GSR and GSS genes in glutathione metabolism demonstrated increased expression, while GPX4 and GGT did not.
Figure 6: Expression of Key Pentose Phosphate, Guanine Metabolism, and Glutathione Pathway Genes is Higher in Relapsed Myeloma Patients After Melphalan Therapy than in MM cells from Newly Diagnosed Treatment-Naïve Patients.
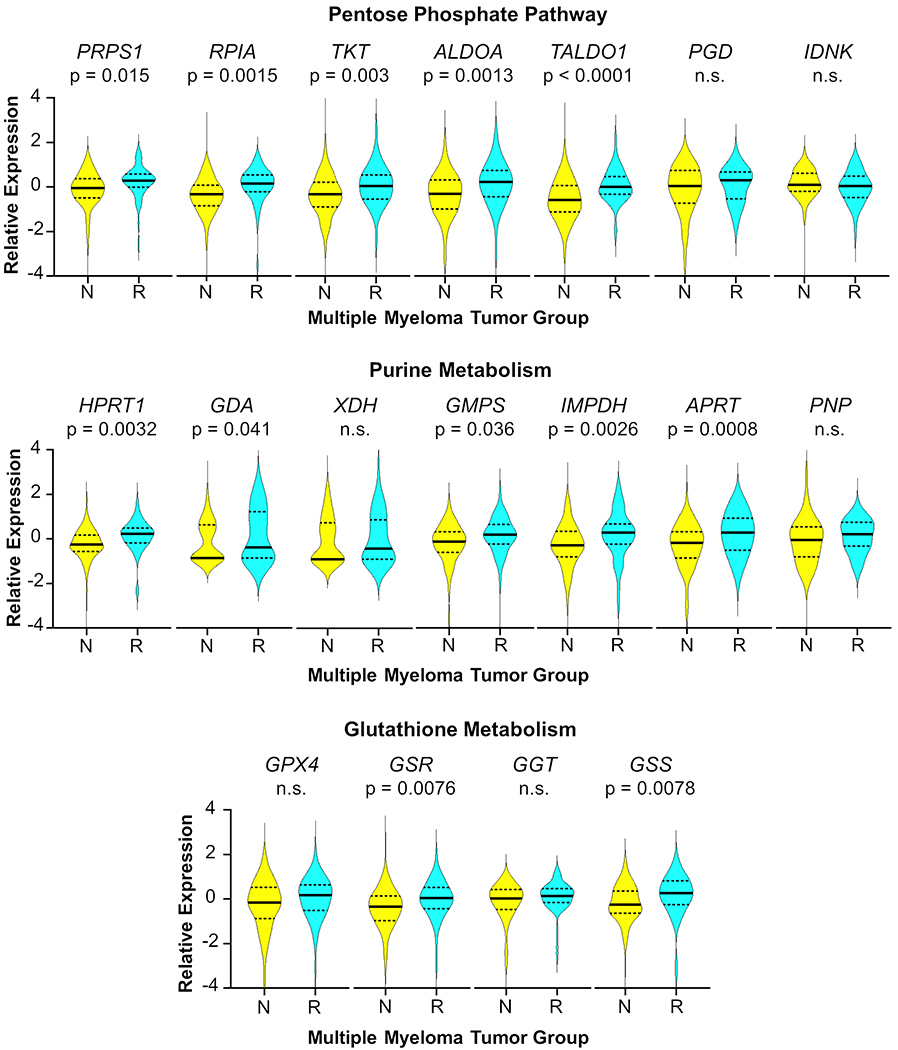
RNAseq was performed on purified myeloma cells from therapy-naïve patients, N, (n = 177) and specimens taken at relapse following high-dose melphalan therapy, R, (n = 52). Time from therapy to relapse was 2 to 62 months; all maintenance regimens are considered. Relative gene expression is normalized data expressed as z-scores. Solid lines represent the median and dashed lines indicate quartiles. The p values were determined by two-sided Student’s T tests. Not significant is indicated by n.s.
Increased PRPS1 gene expression in relapsed patients after melphalan therapy was consistent with increased ATP probe uptake of the PRPS1 enzyme in melphalan-resistant LR5 cells. Increased expression of genes related to purine metabolism (HPRT1, GMPS, IMPDH, and APRT) was also consistent with the ATP probe uptake of these enzymes in the ABPP data, as well as increased expression of GDA from the immunoblot (Figure 4). XDH gene expression was not consistently different between groups in this patient population, similar to what was observed in cell line models, as shown in the immunoblots of XDH protein expression in the two pairs of MM cell lines (Supplemental Figure S11). Some resistance mechanisms may involve XDH, while others may not, so a significant shift in the gene expression in the two groups is not observed. This observation is consistent with the hypothesis that gene expression, enzymatic activity and metabolite levels related to melphalan resistance are heterogeneous in these two cell line pairs as well as patient cohorts. These data suggest that melphalan resistance in MM tumor cells in vivo could be linked to the pathways investigated here; however, proteometabolomics of patient specimens will need to be conducted to fully understand the importance of these metabolic changes for melphalan resistance in patients.
Conclusions
Melphalan resistance remains a critical hurdle in the care of MM patients today.8–10, 16–18 Here, we utilized LC-MS analysis of melphalan stability and processing, untargeted metabolomics, steady-state levels of ATP-utilizing enzymes and metabolites, and quantification of the impact of acute treatment on the metabolome to uncover metabolic changes related to drug resistance in MM. Investigation of the metabolic alterations in resistant cell lines elucidates potential targets for therapy and biomarkers for improved prediction of resistance. Despite expectations of resistant cells detoxifying melphalan more efficiently, we observed minimal differences between them and their respective naïve cells. Furthermore, glutathionylated and purine adducts of melphalan were not observed in any of the cell lines; these results were consistent with previous literature describing difficulty in their synthesis and detection.49
Higher levels of metabolites in the pentose phosphate pathway and lower levels of guanine and guanosine in both resistant cell lines suggested improved precursor formation and purine salvage, respectively, for DNA synthesis to overcome covalent modification of guanine bases, consistent with melphalan’s mechanism of action. For the 8226 and LR5 cell line pair, GSH levels in resistant cells were higher, consistent with a previously identified observation for the mechanism of action for melphalan resistance.35 GSH has been identified as upregulated in melphalan resistance; however, its direct impact was unknown.54 Here, we provide data suggesting that higher levels of GSH counteract the higher levels of production of ammonium cations and superoxide anions from increases in purine synthesis and higher expression of GDA and XDH/XO, respectively. While GSH likely still has a role in melphalan resistance, it does not contribute directly to melphalan detoxification. Furthermore, catalase (CAT) is down regulated in LR5 and GSH peroxidase (GPX4) and glutathione-S-transferase (GST) are both upregulated (Figure 4A), consistent with the hypothesis detoxification of reactive oxygen species is shifted from the peroxisome to other locations in the cell and supported by higher levels of glutathione. Elevated levels of GSH and its associated building blocks may be a response to oxidative stress and not specifically a response to melphalan toxicity, indicating that GSH may have alternate or additional roles in melphalan resistance. However, definitive proof of these mechanisms would involve additional experiments with pharmacological inhibitors or tool compounds as well as isotope tracer experiments or metabolic flux calculations.
Both resistant cell lines demonstrated that higher levels of metabolites in the pentose phosphate pathway are important for melphalan resistance. In addition, PRPS1 and HPRT1 ATP probe uptake of these enzymes is higher in LR5 cells than 8226 naïve cells and expression of PRPS1 and HPRT1 genes is higher in relapsed patients, which suggests that the PPP and purine salvage could be contributing to melphalan resistance. The PPP produces purine precursors and eventually IMP, while purine salvage reincorporates xanthine and guanine into GMP. Both processes may be contributing to improved nucleotide synthesis and DNA repair mechanisms and ultimately resistance to melphalan. However, isotope tracer and CRISPR knockout or siRNA knockdown experiments will need to be performed in the future to confirm these hypotheses. Baseline differences between cell line pairs illustrate the diverse levels and compensatory mechanisms required for acquired melphalan resistance. Although resistance is phenotypically similar, the manner in which each cell line pair achieves resistance is heterogeneous, which is consistent with previous observations in patients.55 These data provide insight into the differences and similarities between two cell line pairs, yet clearly there are both common and alternate avenues to achieve melphalan resistance in vitro.
Analysis of the metabolite levels after acute treatment showed that IMP levels increased significantly in both resistant cell line models, and increased xanthine was cell line specific to LR5. GSH levels were higher in LR5 than 8226 naïve cells and lower in LR6 than U266 naïve cells at steady-state, and they did not fluctuate significantly over time in any cell line after melphalan introduction. These data indicate the changes in metabolites levels associated with response to melphalan in resistant cells and further elucidate the steady-state data associated with melphalan resistance.
Integrated proteomics and metabolomics data were used to investigate the metabolites associated with melphalan resistance in cell line models and RNA-sequencing of primary specimens was employed for correlation of the pathways utilizing these metabolites to patients. This platform can be used for understanding other chemotherapies used for MM as well as other cancers to investigate the roles of metabolism in drug resistance. Despite melphalan being a well-established therapy, drug derivatives and novel compounds with similar mechanism of action (e.g. melflufen) have recently shown excellent activity in preclinical experiments and early and late phase clinical trials.56–58 Therefore, improved understanding of metabolomic pathways associated with melphalan resistance are critical to develop novel drug combinations or predictive biomarkers. In light of our proteometabolomics data, rational combinations with drugs targeting purine metabolism could be re-evaluated, for example previously described clinical trials with mycophenolate mofetil, an IMPDH inhibitor, demonstrated no significant progress in improving patient outcomes.59–60 Our proteometabolomics data suggest that IMPDH can be bypassed by other routes of purine synthesis and subsequent salvage with HPRT1 and GMPS. Potential inhibition of HPRT1 and GMPS or PRPS1 and upstream PPP enzymes, like 6-phosphogluconate dehydrogenase targeted here with the 6-aminonicotinamide tool compound, could lead to sensitization of melphalan resistant cells. Further investigation of primary specimens with proteometabolomics is required to identify whether proteomic biomarkers such as HPRT1, PRPS1, GDA, and XDH/XO expression and metabolite levels such as those previously mentioned in the PPP as well as IMP, guanine, xanthine and glutathione could help predict patient response to melphalan before undergoing consolidation therapy. Ultimately, knowledge of the metabolic reprogramming involved in melphalan resistance can guide possible combination treatments to improve patient outcomes.
Supplementary Material
Acknowledgements
This project was supported by the Pentecost Family Foundation Grant and pilot funding from the Moffitt Innovation and Technology Committee and the Molecular Medicine Program. Moffitt’s Proteomics & Metabolomics Core is supported in part by an NCI Cancer Center Support Grant (P30-CA076292), which conveys Moffitt’s status as a Comprehensive Cancer Center, and the Moffitt Foundation. UF Metabolomics is supported as part of the Southeast Center for Integrative Metabolomics (U24 DK097209). RNA sequencing supported by Oncology Research Information Exchange Network (ORIEN) and M2Gen. A special thank you to William S. Dalton PhD, MD for development of the LR5 and LR6 cell lines, Karen Burger, PhD for in-depth discussion and suggestions, and to Jack Webster, PhD, and Leigh West, MS at the University of South Florida’s Morsani College of Medicine for helpful insight during this project.
Footnotes
Conflict of Interest Statement
The following authors (OH and ZJ) are employed by M2Gen, a for profit company focused on providing oncology health informatics solutions to accelerate cancer treatment discovery, development, and delivery by leveraging clinical and molecular data.
Supporting Information
The following supporting information is available free of charge at ACS website: http://pubs.acs.org. Supplemental Methods, Supplemental Figure S1: Melphalan Degrades by Oxidative Dechlorination in an Aqueous Environment, Supplemental Figure S2: Oxidative Dechlorination of Melphalan Does Not Contribute Significantly to Drug Resistance in Two Cell Line Models, Supplemental Figure S3: Intracellular Levels of Melphalan and its Metabolites do not Differ Significantly between Naïve and Drug Resistant Cells, Supplemental Figure S4: Trajectories of Melphalan Detoxification Were Similar in Naïve and Drug-Resistant Cell Lines, Supplemental Figure S5: Baseline Levels of Metabolites Involved in Cellular Energetics are Different Between 8226 and U266 Naïve Cells, Supplemental Figure S6: Baseline Levels of Metabolites in Oxidative Stress and DNA Synthesis are Inherently Different in Naïve 8226 and U266 Cells, Supplemental Figure S7: Differentially Detected Metabolites Elucidate Commonalities and Differences in Adaptations in Two Models of Acquired Resistance to Melphalan, Supplemental Figure S8: Metabolomics Reveals Pathways Associated with Melphalan Resistance in Two Cell Line Model Systems, Supplemental Figure S9: Differentially Desthiobiotinylated (DTB) Peptides Indicate Involvement of Diverse Proteins, but Similar Pathways, Supplemental Figure S10: The Major Compensatory Change in Purine Metabolism in U266/LR6 is Higher Levels of IMP, while Adenosine and Urate are Lower, Supplemental Figure S11: Example Full Gel Western Blots for Guanine Deaminase (GDA) and Xanthine Dehydrogenase/Oxidase (XDH/XO) Show Higher Expression in LR5 Melphalan Resistant Cells Compared to 8226 Naïve Cells, Supplemental Figure S12: Xanthine, Hypoxanthine and IMP Increase in Response to Melphalan in LR5 Cells, Supplemental Figure S13: IMP Levels Increase in Response to Melphalan in LR6 Cells, Supplemental Figure S14: Allopurinol and Febuxostat do not Impact Viability of Multiple Myeloma Cell Lines with or without Melphalan Treatment, Supplemental Figure S15: Melphalan Increases Cell Death caused by 6-Aminonicotinamide, Supplemental Table S1: Melphalan is Stable during Metabolite Extraction in 8:1 ACN/MeOH, Supplemental Table S2: Melphalan does not Degrade while Stored in the Autosampler in 8:1 ACN/MeOH, Supplemental Table S3: Changes of Melphalan Detoxification in Resistant Cells were Minimal (< 16% Difference from Naïve Cells), Supplemental Table S4: Untargeted Metabolomics Reveals Significant Changes of the Metabolome in Melphalan Resistant Cells, Supplemental Table S5: Activity Based Protein Profiling shows Levels of ATP Probe Uptake of Enzymes Involved in Melphalan Resistance, Supplemental Table S6: Activity Based Protein Profiling Implicates Pathways Involved in Melphalan Resistance, Supplemental Table S7: Melphalan Acute Treatment Metabolomics of 8226 and LR5 Demonstrates Metabolic Pathways Activated by Melphalan Exposure, Supplemental Table S8: Melphalan Acute Treatment Metabolomics of U266 and LR6 Demonstrates Metabolic Pathways Activated by Melphalan Exposure.
References
- 1.Siegel RL; Miller KD; Jemal A, Cancer statistics, 2019. CA Cancer J Clin 2019, 69 (1), 7–34. [DOI] [PubMed] [Google Scholar]
- 2.Abdi J; Chen G; Chang H, Drug resistance in multiple myeloma: latest findings and new concepts on molecular mechanisms. Oncotarget 2013, 4 (12), 2186–207. [DOI] [PMC free article] [PubMed] [Google Scholar]
- 3.Rajkumar SV; Kumar S, Multiple Myeloma: Diagnosis and Treatment. Mayo Clin Proc 2016, 91 (1), 101–19. [DOI] [PMC free article] [PubMed] [Google Scholar]
- 4.Chim CS; Kumar SK; Orlowski RZ; Cook G; Richardson PG; Gertz MA; Giralt S; Mateos MV; Leleu X; Anderson KC, Management of relapsed and refractory multiple myeloma: novel agents, antibodies, immunotherapies and beyond. Leukemia 2018, 32 (2), 252–262. [DOI] [PMC free article] [PubMed] [Google Scholar]
- 5.Jackson GH; Davies FE; Pawlyn C; Cairns DA; Striha A; Collett C; Hockaday A; Jones JR; Kishore B; Garg M; Williams CD; Karunanithi K; Lindsay J; Jenner MW; Cook G; Russell NH; Kaiser MF; Drayson MT; Owen RG; Gregory WM; Morgan GJ; Group U. N. H.-o. C. S., Lenalidomide maintenance versus observation for patients with newly diagnosed multiple myeloma (Myeloma XI): a multicentre, open-label, randomised, phase 3 trial. Lancet Oncol 2019, 20 (1), 57–73. [DOI] [PMC free article] [PubMed] [Google Scholar]
- 6.Attal M; Lauwers-Cances V; Marit G; Caillot D; Moreau P; Facon T; Stoppa AM; Hulin C; Benboubker L; Garderet L; Decaux O; Leyvraz S; Vekemans MC; Voillat L; Michallet M; Pegourie B; Dumontet C; Roussel M; Leleu X; Mathiot C; Payen C; Avet-Loiseau H; Harousseau JL; Investigators IFM, Lenalidomide maintenance after stem-cell transplantation for multiple myeloma. N Engl J Med 2012, 366 (19), 1782–91. [DOI] [PubMed] [Google Scholar]
- 7.Jasielec JK; Jakubowiak AJ, Current approaches to the initial treatment of symptomatic multiple myeloma. Int J Hematol Oncol 2013, 2 (1) , 10.2217/ijh.13.3. [DOI] [PMC free article] [PubMed] [Google Scholar]
- 8.Willenbacher E; Balog A; Willenbacher W, Short overview on the current standard of treatment in newly diagnosed multiple myeloma. Memo 2018, 11 (1), 59–64. [DOI] [PMC free article] [PubMed] [Google Scholar]
- 9.Al Hamed R; Bazarbachi AH; Malard F; Harousseau JL; Mohty M, Current status of autologous stem cell transplantation for multiple myeloma. Blood Cancer J 2019, 9 (4), 44. [DOI] [PMC free article] [PubMed] [Google Scholar]
- 10.Kumar S, Stem cell transplantation for multiple myeloma. Current Opinion in Oncology 2009, 21 (2), 162–170. [DOI] [PMC free article] [PubMed] [Google Scholar]
- 11.Attal M; Lauwers-Cances V; Hulin C; Leleu X; Caillot D; Escoffre M; Arnulf B; Macro M; Belhadj K; Garderet L; Roussel M; Payen C; Mathiot C; Fermand JP; Meuleman N; Rollet S; Maglio ME; Zeytoonjian AA; Weller EA; Munshi N; Anderson KC; Richardson PG; Facon T; Avet-Loiseau H; Harousseau JL; Moreau P; Study IFM, Lenalidomide, Bortezomib, and Dexamethasone with Transplantation for Myeloma. N Engl J Med 2017, 376 (14), 1311–1320. [DOI] [PMC free article] [PubMed] [Google Scholar]
- 12.McCarthy PL; Owzar K; Hofmeister CC; Hurd DD; Hassoun H; Richardson PG; Giralt S; Stadtmauer EA; Weisdorf DJ; Vij R; Moreb JS; Callander NS; Van Besien K; Gentile T; Isola L; Maziarz RT; Gabriel DA; Bashey A; Landau H; Martin T; Qazilbash MH; Levitan D; McClune B; Schlossman R; Hars V; Postiglione J; Jiang C; Bennett E; Barry S; Bressler L; Kelly M; Seiler M; Rosenbaum C; Hari P; Pasquini MC; Horowitz MM; Shea TC; Devine SM; Anderson KC; Linker C, Lenalidomide after stem-cell transplantation for multiple myeloma. N Engl J Med 2012, 366 (19), 1770–81. [DOI] [PMC free article] [PubMed] [Google Scholar]
- 13.Joseph NS; Kaufman JL; Dhodapkar MV; Hofmeister CC; Almaula DK; Heffner LT; Gupta VA; Boise LH; Lonial S; Nooka AK, Long-Term Follow-Up Results of Lenalidomide, Bortezomib, and Dexamethasone Induction Therapy and Risk-Adapted Maintenance Approach in Newly Diagnosed Multiple Myeloma. J Clin Oncol 2020, 38, (17), 1928–1937. [DOI] [PMC free article] [PubMed] [Google Scholar]
- 14.Holstein SA; Jung SH; Richardson PG; Hofmeister CC; Hurd DD; Hassoun H; Giralt S; Stadtmauer EA; Weisdorf DJ; Vij R; Moreb JS; Callander NS; van Besien K; Gentile TG; Isola L; Maziarz RT; Bashey A; Landau H; Martin T; Qazilbash MH; Rodriguez C; McClune B; Schlossman RL; Smith SE; Hars V; Owzar K; Jiang C; Boyd M; Schultz C; Wilson M; Hari P; Pasquini MC; Horowitz MM; Shea TC; Devine SM; Linker C; Anderson KC; McCarthy PL, Updated analysis of CALGB (Alliance) 100104 assessing lenalidomide versus placebo maintenance after single autologous stem-cell transplantation for multiple myeloma: a randomised, double-blind, phase 3 trial. Lancet Haematol 2017, 4 (9), e431–e442. [DOI] [PMC free article] [PubMed] [Google Scholar]
- 15.McCarthy PL; Holstein SA; Petrucci MT; Richardson PG; Hulin C; Tosi P; Bringhen S; Musto P; Anderson KC; Caillot D; Gay F; Moreau P; Marit G; Jung SH; Yu Z; Winograd B; Knight RD; Palumbo A; Attal M, Lenalidomide Maintenance After Autologous Stem-Cell Transplantation in Newly Diagnosed Multiple Myeloma: A Meta-Analysis. J Clin Oncol 2017, 35 (29), 3279–3289. [DOI] [PMC free article] [PubMed] [Google Scholar]
- 16.Palumbo A; Bringhen S; Larocca A; Rossi D; Di Raimondo F; Magarotto V; Patriarca F; Levi A; Benevolo G; Vincelli ID; Grasso M; Franceschini L; Gottardi D; Zambello R; Montefusco V; Falcone AP; Omede P; Marasca R; Morabito F; Mina R; Guglielmelli T; Nozzoli C; Passera R; Gaidano G; Offidani M; Ria R; Petrucci MT; Musto P; Boccadoro M; Cavo M, Bortezomib-melphalan-prednisone-thalidomide followed by maintenance with bortezomib-thalidomide compared with bortezomib-melphalan-prednisone for initial treatment of multiple myeloma: updated follow-up and improved survival. J Clin Oncol 2014, 32 (7), 634–40. [DOI] [PubMed] [Google Scholar]
- 17.Facon T; Lee JH; Moreau P; Niesvizky R; Dimopoulos M; Hajek R; Pour L; Jurczyszyn A; Qiu L; Klippel Z; Zahlten-Kumeli A; Osman M; Paiva B; San-Miguel J, Carfilzomib or bortezomib with melphalan-prednisone for transplant-ineligible patients with newly diagnosed multiple myeloma. Blood 2019, 133 (18), 1953–1963. [DOI] [PubMed] [Google Scholar]
- 18.Mateos MV; Cavo M; Blade J; Dimopoulos MA; Suzuki K; Jakubowiak A; Knop S; Doyen C; Lucio P; Nagy Z; Pour L; Cook M; Grosicki S; Crepaldi A; Liberati AM; Campbell P; Shelekhova T; Yoon SS; Iosava G; Fujisaki T; Garg M; Krevvata M; Chen Y; Wang J; Kudva A; Ukropec J; Wroblewski S; Qi M; Kobos R; San-Miguel J, Overall survival with daratumumab, bortezomib, melphalan, and prednisone in newly diagnosed multiple myeloma (ALCYONE): a randomised, open-label, phase 3 trial. Lancet 2020, 395 (10218), 132–141. [DOI] [PubMed] [Google Scholar]
- 19.Yarde DN; Oliveira V; Mathews L; Wang X; Villagra A; Boulware D; Shain KH; Hazlehurst LA; Alsina M; Chen DT; Beg AA; Dalton WS, Targeting the Fanconi anemia/BRCA pathway circumvents drug resistance in multiple myeloma. Cancer Res 2009, 69 (24), 9367–75. [DOI] [PMC free article] [PubMed] [Google Scholar]
- 20.Nishihori T; Alekshun TJ; Shain K; Sullivan DM; Baz R; Perez L; Pidala J; Kharfan-Dabaja MA; Ochoa-Bayona JL; Fernandez HF; Yarde DN; Oliveira V; Fulp W; Han G; Kim J; Chen DT; Raychaudhuri J; Dalton W; Anasetti C; Alsina M, Bortezomib salvage followed by a Phase I/II study of bortezomib plus high-dose melphalan and tandem autologous transplantation for patients with primary resistant myeloma. Br J Haematol 2012, 157 (5), 553–63. [DOI] [PMC free article] [PubMed] [Google Scholar]
- 21.Blokhin N; Larionov L; Perevodchikova N; Chebotareva L; Merkulova N, Clinical Experiences with Sarcolysin in Neoplastic Diseases. Annals of the New York Academy of Sciences 1958, 68 (3), 1128–1132. [DOI] [PubMed] [Google Scholar]
- 22.Polavarapu A; Stillabower JA; Stubblefield SGW; Taylor WM; Baik MH, The Mechanism of Guanine Alkylation by Nitrogen Mustards: A Computational Study. Journal of Organic Chemistry 2012, 77 (14), 5914–5921. [DOI] [PubMed] [Google Scholar]
- 23.Osborne MR; Lawley PD, Alkylation of DNA by melphalan with special reference to adenine derivatives and adenine-guanine cross-linking. Chem Biol Interact 1993, 89 (1), 49–60. [DOI] [PubMed] [Google Scholar]
- 24.Povirk LF; Shuker DE, DNA damage and mutagenesis induced by nitrogen mustards. Mutat Res 1994, 318 (3), 205–26. [DOI] [PubMed] [Google Scholar]
- 25.Bayraktar UD; Bashir Q; Qazilbash M; Champlin RE; Ciurea SO, Fifty Years of Melphalan Use in Hematopoietic Stem Cell Transplantation. Biology of Blood and Marrow Transplantation 2013, 19 (3), 344–356. [DOI] [PMC free article] [PubMed] [Google Scholar]
- 26.Nooka AK; Harvey RD; Langston A; Collins H; Lonial S; Kaufman JL, Optimal dosing of melphalan as high-dose therapy before autologous hematopoietic stem cell transplantation in myeloma patients with solitary kidney: a case series. Clin Lymphoma Myeloma Leuk 2014, 14 (2), e59–63. [DOI] [PubMed] [Google Scholar]
- 27.Kuczma M; Ding ZC; Zhou G, Immunostimulatory Effects of Melphalan and Usefulness in Adoptive Cell Therapy with Antitumor CD4+ T Cells. Crit Rev Immunol 2016, 36 (2), 179–191. [DOI] [PMC free article] [PubMed] [Google Scholar]
- 28.Musto P; Anderson KC; Attal M; Richardson PG; Badros A; Hou J; Comenzo R; Du J; Durie BGM; San Miguel J; Einsele H; Chen WM; Garderet L; Pietrantuono G; Hillengass J; Kyle RA; Moreau P; Lahuerta JJ; Landgren O; Ludwig H; Larocca A; Mahindra A; Cavo M; Mazumder A; McCarthy PL; Nouel A; Rajkumar SV; Reiman A; Riva E; Sezer O; Terpos E; Turesson I; Usmani S; Weiss BM; Palumbo A; International Myeloma Working G, Second primary malignancies in multiple myeloma: an overview and IMWG consensus. Ann Oncol 2017, 28 (2), 228–245. [DOI] [PubMed] [Google Scholar]
- 29.Jones JR; Cairns DA; Gregory WM; Collett C; Pawlyn C; Sigsworth R; Striha A; Henderson R; Kaiser MF; Jenner M; Cook G; Russell NH; Williams C; Pratt G; Kishore B; Lindsay J; Drayson MT; Davies FE; Boyd KD; Owen RG; Jackson GH; Morgan GJ, Second malignancies in the context of lenalidomide treatment: an analysis of 2732 myeloma patients enrolled to the Myeloma XI trial. Blood Cancer J 2016, 6 (12), e506. [DOI] [PMC free article] [PubMed] [Google Scholar]
- 30.Rollison DE; Komrokji R; Lee JH; Hampras S; Fulp W; Fisher K; Baz R; Nishihori T; Xu Q; Olesnyckyj M; Kenvin L; Knight R; Sullivan D; Alsina M; Dalton W; Shain KH, Subsequent primary malignancies among multiple myeloma patients treated with or without lenalidomide. Leuk Lymphoma 2017, 58 (3), 560–568. [DOI] [PMC free article] [PubMed] [Google Scholar]
- 31.Paiva B; van Dongen JJ; Orfao A, New criteria for response assessment: role of minimal residual disease in multiple myeloma. Blood 2015, 125 (20), 3059–68. [DOI] [PMC free article] [PubMed] [Google Scholar]
- 32.Pinguet F; Culine S; Bressolle F; Astre C; Serre MP; Chevillard C; Fabbro M, A phase I and pharmacokinetic study of melphalan using a 24-hour continuous infusion in patients with advanced malignancies. Clin Cancer Res 2000, 6 (1), 57–63. [PubMed] [Google Scholar]
- 33.Tranchand B; Ploin YD; Minuit MP; Sapet C; Biron P; Philip T; Ardiet C, High-dose melphalan dosage adjustment: possibility of using a test-dose. Cancer Chemother Pharmacol 1989, 23 (2), 95–100. [DOI] [PubMed] [Google Scholar]
- 34.Bellamy WT; Dalton WS; Gleason MC; Grogan TM; Trent JM, Development and Characterization of a Melphalan-Resistant Human Multiple-Myeloma Cell-Line. Cancer Research 1991, 51 (3), 995–1002. [PubMed] [Google Scholar]
- 35.Hazlehurst LA; Enkemann SA; Beam CA; Argilagos RF; Painter J; Shain KH; Saporta S; Boulware D; Moscinski L; Alsina M; Dalton WS, Genotypic and phenotypic comparisons of de Novo and acquired melphalan resistance in an isogenic multiple myeloma cell line model. Cancer Research 2003, 63 (22), 7900–7906. [PubMed] [Google Scholar]
- 36.Xiang Y; Remily-Wood ER; Oliveira V; Yarde D; He L; Cheng JQ; Mathews L; Boucher K; Cubitt C; Perez L; Gauthier TJ; Eschrich SA; Shain KH; Dalton WS; Hazlehurst L; Koomen JM, Monitoring a nuclear factor-kappaB signature of drug resistance in multiple myeloma. Mol Cell Proteomics 2011, 10 (11), M110 005520. [DOI] [PMC free article] [PubMed] [Google Scholar]
- 37.Zub KA; de Sousa MML; Sarno A; Sharma A; Demirovic A; Rao S; Young C; Aas PA; Ericsson I; Sundan A; Jensen ON; Slupphaug G, Modulation of Cell Metabolic Pathways and Oxidative Stress Signaling Contribute to Acquired Melphalan Resistance in Multiple Myeloma Cells. Plos One 2015, 10 (3) , e0119857. [DOI] [PMC free article] [PubMed] [Google Scholar]
- 38.Koomen DC; Guingab-Cagmat JD; Oliveira PS; Fang B; Liu M; Welsh EA; Meads MB; Nguyen T; Meke L; Eschrich SA; Shain KH; Garrett TJ; Koomen JM, Proteometabolomics of Melphalan Resistance in Multiple Myeloma. Methods Mol Biol 2019, 1996, 273–296. [DOI] [PMC free article] [PubMed] [Google Scholar]
- 39.Chen Q; Van der Sluis PC; Boulware D; Hazlehurst LA; Dalton WS, The FA/BRCA pathway is involved in melphalan-induced DNA interstrand cross-link repair and accounts for melphalan resistance in multiple myeloma cells. Blood 2005, 106 (2), 698–705. [DOI] [PMC free article] [PubMed] [Google Scholar]
- 40.Pluskal T; Castillo S; Villar-Briones A; Oresic M, MZmine 2: Modular framework for processing, visualizing, and analyzing mass spectrometry-based molecular profile data. Bmc Bioinformatics 2010, 11, 395. [DOI] [PMC free article] [PubMed] [Google Scholar]
- 41.Chong J; Soufan O; Li C; Caraus I; Li SZ; Bourque G; Wishart DS; Xia JG, MetaboAnalyst 4.0: towards more transparent and integrative metabolomics analysis. Nucleic Acids Research 2018, 46 (W1), W486–W494. [DOI] [PMC free article] [PubMed] [Google Scholar]
- 42.Cox J; Mann M, MaxQuant enables high peptide identification rates, individualized p.p.b.-range mass accuracies and proteome-wide protein quantification. Nat Biotechnol 2008, 26 (12), 1367–72. [DOI] [PubMed] [Google Scholar]
- 43.Welsh EA; Eschrich SA; Berglund AE; Fenstermacher DA, Iterative rank-order normalization of gene expression microarray data. BMC Bioinformatics 2013, 14, 153. [DOI] [PMC free article] [PubMed] [Google Scholar]
- 44.Kanehisa M; Goto S, KEGG: Kyoto Encyclopedia of Genes and Genomes. Nucleic Acids Research 2000, 28 (1), 27–30. [DOI] [PMC free article] [PubMed] [Google Scholar]
- 45.Dobin A; Davis CA; Schlesinger F; Drenkow J; Zaleski C; Jha S; Batut P; Chaisson M; Gingeras TR, STAR: ultrafast universal RNA-seq aligner. Bioinformatics 2013, 29 (1), 15–21. [DOI] [PMC free article] [PubMed] [Google Scholar]
- 46.Li B; Dewey CN, RSEM: accurate transcript quantification from RNA-Seq data with or without a reference genome. BMC Bioinformatics 2011, 12, 323. [DOI] [PMC free article] [PubMed] [Google Scholar]
- 47.Ritchie ME; Phipson B; Wu D; Hu Y; Law CW; Shi W; Smyth GK, limma powers differential expression analyses for RNA-sequencing and microarray studies. Nucleic Acids Res 2015, 43 (7), e47. [DOI] [PMC free article] [PubMed] [Google Scholar]
- 48.Johnson WE; Li C; Rabinovic A, Adjusting batch effects in microarray expression data using empirical Bayes methods. Biostatistics 2007, 8 (1), 118–27. [DOI] [PubMed] [Google Scholar]
- 49.Dewaele D; Sobott F; Lemiere F, Covalent adducts of melphalan with free amino acids and a model peptide studied by liquid chromatography/tandem mass spectrometry. Rapid Commun Mass Spectrom 2016, 30 (6), 719–30. [DOI] [PubMed] [Google Scholar]
- 50.Tilby MJ; Lawley PD; Farmer PB, Alkylation of DNA by melphalan in relation to immunoassay of melphalan-DNA adducts: characterization of mono-alkylated and cross-linked products from reaction of melphalan with dGMP and GMP. Chem Biol Interact 1990, 73 (2-3), 183–94. [DOI] [PubMed] [Google Scholar]
- 51.Li S; Lu Y; Peng B; Ding J, Crystal structure of human phosphoribosylpyrophosphate synthetase 1 reveals a novel allosteric site. Biochem J 2007, 401 (1), 39–47. [DOI] [PMC free article] [PubMed] [Google Scholar]
- 52.Shi W; Li CM; Tyler PC; Furneaux RH; Grubmeyer C; Schramm VL; Almo SC, The 2.0 A structure of human hypoxanthine-guanine phosphoribosyltransferase in complex with a transition-state analog inhibitor. Nat Struct Biol 1999, 6 (6), 588–93. [DOI] [PubMed] [Google Scholar]
- 53.Murthy CR; Bender AS; Dombro RS; Bai G; Norenberg MD, Elevation of glutathione levels by ammonium ions in primary cultures of rat astrocytes. Neurochem Int 2000, 37 (2-3), 255–68. [DOI] [PubMed] [Google Scholar]
- 54.Gourzones C; Bellanger C; Lamure S; Gadacha OK; De Paco EG; Vincent L; Cartron G; Klein B; Moreaux J, Antioxidant Defenses Confer Resistance to High Dose Melphalan in Multiple Myeloma Cells. Cancers (Basel) 2019, 11 (4) , 439. [DOI] [PMC free article] [PubMed] [Google Scholar]
- 55.Manier S; Salem KZ; Park J; Landau DA; Getz G; Ghobrial IM, Genomic complexity of multiple myeloma and its clinical implications. Nat Rev Clin Oncol 2017, 14 (2), 100–113. [DOI] [PubMed] [Google Scholar]
- 56.Chauhan D; Ray A; Viktorsson K; Spira J; Paba-Prada C; Munshi N; Richardson P; Lewensohn R; Anderson KC, In vitro and in vivo antitumor activity of a novel alkylating agent, melphalan-flufenamide, against multiple myeloma cells. Clin Cancer Res 2013, 19 (11), 3019–31. [DOI] [PMC free article] [PubMed] [Google Scholar]
- 57.Wickstrom M; Nygren P; Larsson R; Harmenberg J; Lindberg J; Sjoberg P; Jerling M; Lehmann F; Richardson P; Anderson K; Chauhan D; Gullbo J, Melflufen - a peptidase-potentiated alkylating agent in clinical trials. Oncotarget 2017, 8 (39), 66641–66655. [DOI] [PMC free article] [PubMed] [Google Scholar]
- 58.Richardson PG; Bringhen S; Voorhees P; Plesner T; Mellqvist UH; Reeves B; Paba-Prada C; Zubair H; Byrne C; Chauhan D; Anderson K; Nordstrom E; Harmenberg J; Palumbo A; Sonneveld P, Melflufen plus dexamethasone in relapsed and refractory multiple myeloma (O-12-M1): a multicentre, international, open-label, phase 1-2 study. Lancet Haematol 2020, 7 (5), e395–e407. [DOI] [PubMed] [Google Scholar]
- 59.Takebe N; Cheng X; Wu S; Bauer K; Goloubeva OG; Fenton RG; Heyman M; Rapoport AP; Badros A; Shaughnessy J; Ross D; Meisenberg B; Tricot G, Phase I clinical trial of the inosine monophosphate dehydrogenase inhibitor mycophenolate mofetil (cellcept) in advanced multiple myeloma patients. Clin Cancer Res 2004, 10 (24), 8301–8. [DOI] [PubMed] [Google Scholar]
- 60.Naffouje R; Grover P; Yu H; Sendilnathan A; Wolfe K; Majd N; Smith EP; Takeuchi K; Senda T; Kofuji S; Sasaki AT, Anti-Tumor Potential of IMP Dehydrogenase Inhibitors: A Century-Long Story. Cancers (Basel) 2019, 11 (9) , 1346. [DOI] [PMC free article] [PubMed] [Google Scholar]
Associated Data
This section collects any data citations, data availability statements, or supplementary materials included in this article.