Abstract
This work proposes a novel method of temporal signal-to-noise ratio (SNR) guided adaptive acoustic output adjustment and demonstrates this approach during in vivo fetal imaging. Acoustic output adjustment is currently the responsibility of sonographers, but ultrasound safety studies show recommended ALARA (As Low As Reasonably Achievable) practices are inconsistently followed. This study explores an automated ALARA method that adjusts the Mechanical Index (MI) output, targeting imaging conditions matching the temporal noise perception threshold. A 28 dB threshold SNR is used as the target SNR, following prior work showing relevant noise quantities are imperceptible once this image data quality level is reached. After implementing adaptive output adjustment on a clinical system, the average MI required to achieve 28 dB SNR in an eleven-volunteer fetal abdomen imaging test ranged from 0.17 to 0.26. The higher MI levels were required when imaging at higher frequencies. During tests with 20-second MI adjustment imaging periods, the degree of motion impacted the adaptive performance. For stationary imaging views, target SNR levels were maintained in 90% of SNR evaluations. When scanning between targets the imaging conditions were more variable, but the target SNR was still maintained in 71% of the evaluations. Given the relatively low MI recommended when performing MI adjustment and the successful adjustment of MI in response to changing imaging conditions, these results encourage adoption of adaptive acoustic output approaches guided by temporal SNR.
Keywords: Acoustic exposure, adaptive imaging, fetal ultrasound, image quality, noise sensitivity, temporal SNR
I. Introduction
Tremendous advances in ultrasound system hardware and imaging methods have dramatically improved image quality over the past several decades [1], [2]. With the steady decrease of noise floor levels and improvements in signal isolation methods, it follows that the current generation of ultrasound scanners likely requires less acoustic output to produce high quality images than systems from earlier generations. Previously, a sonographer might elect to use all the acoustic output power available on a system to minimize noise. Guided by empirical evaluation of the visual characteristics of images produced with acoustic output significantly reduced from default levels, the authors hypothesize that in many common ultrasound applications, such as abdominal and fetal imaging, high image quality is retained even at relatively low acoustic output. To ensure this potential acoustic output reduction is realized, this work explores an autonomous acoustic output selection method, balancing image quality considerations with bioeffect risk mitigation.
Regulatory and advisory bodies recommend acoustic output be set based on the ALARA (As Low as Reasonably Achievable) principle [4], [5]. This guideline calls for output to be low as possible while still maintaining sufficient quality to guide a potential diagnosis from the scan results. While ultrasound is considered generally safe when these guidelines are followed, using excessive output has the potential to cause tissue damage from inertial cavitation or heating effects [6], [7]. Display of Mechanical Index (MI) and Thermal Index (TI) metrics is required on scanners to convey the potential risk for each of these bioeffects given the current imaging configuration [4]. For this study, which uses focused imaging beams, only the MI is considered for analysis, as this instantaneous pressure-based method is typically more relevant for this imaging scenario. However, as both MI and TI are directly related to the acoustic output, observing the ALARA principle for MI by decreasing output power also results in the other metric, TI, being reduced as well.
The formula calculating MI combines two factors that effect the likelihood of inertial cavitation, the instantaneous pressure and imaging frequency, into one expression:
| #1 |
The numerator of this expression considers the position, , along an insonified beam axis where the pulse intensity magnitude is greatest and the peak rarefractional pressure in megapascals, , at that point derated by 0.3 dB/cm/MHz. This peak negative pressure is divided by the square root of the center frequency of the imaging pulse, . MI must not exceed 1.9 during diagnostic imaging [4]. While scanning at MI levels relevant for diagnostic imaging has not been linked to detrimental outcomes in human studies, levels of acoustic exposure consistent with such scans have been shown to alter gene expression, reduce learning rates, and impair memory in small animals [8]–[10]. While it is unclear to the extent these effects would extend to humans, the ALARA principle is relevant and important to observe during ultrasound imaging to ensure any potential for harm is mitigated.
Despite recommendations to follow this principle, sonographers are minimally aware of acoustic output during scanning given the numerous other tasks they are responsible for. An eye tracking study determined that acoustic output metrics displayed on the scanner were examined during just 4.2% of obstetric scans in the study [11], and sonographers self-report that output is largely not considered during scanning [12]. As a result, it is likely that a default acoustic output setting, rather than an output set based on the ALARA principle, is used for an overwhelming majority of scans. While the authors are not aware of reports documenting clinically used MI levels, for the modern clinical ultrasound systems we have access to, such default MI levels typically range from 0.7–1.4. Because this is not a task that is performed regularly in clinical practice, adaptive acoustic output selection has been a recent topic of research, with new methods introduced that automatically enforce the ALARA principle during scanning.
Existing efforts in adaptive acoustic output adjustment have used a spatial coherence image quality metric, lag-one coherence (LOC), to evaluate image quality [13], [14]. The general approach entails sweeping acoustic output, monitoring LOC, then choosing for scanning the output that achieves 98% of the LOC maximum. A shortcoming of this approach is that LOC is impacted by two types of noise, clutter noise and electronic noise, but these noise sources are separately affected by changing acoustic output levels. As such, trying to achieve a fixed threshold percent of the LOC maximum will result in varied image quality conditions as relative levels of noise and clutter change. Clutter noise arises from acoustic propagation phenomena, such as reverberation or phase aberration [15]–[17]. Increasing acoustic output maintains these propagation-related effects, so signal-to-clutter levels do not directly increase with additional transmit power. Electronic noise, however, arises from electromagnetic effects and interference in the system circuitry unrelated to the acoustic output [18]. Increasing the echo signal strength improves image quality by causing this electronic noise floor to be increasingly exceeded. Without decoupling the separate response of clutter and electronic noise, adaptive output adjustment based on LOC will yield inconsistent visual image quality as the degree to which electronic noise presents itself will be varied.
A more direct approach, explored in this paper, is to use temporal signal-to-noise ratio (SNR) as the image quality metric for adaptive output adjustment. As temporal SNR is dependent on the electronic noise level, this metric captures the relevant noise quantity for acoustic output adjustment. Furthermore, recent work has identified a target temporal SNR that can be used for ALARA output adjustment [19]. This work found the temporal noise perception threshold to be 28 dB, meaning that for SNR above this level, noise is low enough relative to the signal that human observers cannot perceive its presence. Therefore, a temporal SNR target of 28 dB is used for acoustic output adjustment as visual quality will be maximized at this SNR while acoustic output is minimized. In this work, a clinical ultrasound system with a temporal SNR-based adaptive acoustic output adjustment tool is evaluated during in vivo fetal imaging in eleven pregnant volunteers. The clinical ultrasound system used for these analyses, along with most other current-generation systems, can operate in B-mode with low enough electronic noise levels that achieving the 28 dB targeted noise perception threshold is a feasible goal, even in the harmonic imaging case explored here.
II. Theory
The signals received by an ultrasound system and used to form B-mode images are the superposition of electronic noise, tissue echoes, and clutter noise. Mathematically, following the terminology of Vienneau [20], the received signal () can be represented as the sum of these tissue signals, (), noise signals (), and clutter signals ().
| #2 |
The observed temporal SNR is the ratio of the sum of the power of the signal components that are temporally correlated, and , over the power of the temporally incoherent component, .
| #3 |
Assuming acquisition-to-acquisition differences arise from the temporally incoherent noise, the temporal coherence of the received signal, , is related to the temporal SNR by [21]
| #4 |
While this coherence calculation approach works well in completely stationary environments, in typical in vivo ultrasound acquisitions, involuntary transducer or target motion occurs between acquisitions. As a result, is suppressed, overestimating the effect of electronic noise and thus underestimating the true SNR.
An alternative approach to calculating temporal SNR involves separately obtaining the noise power through the acquisition of noise frames. This can be done by acquiring frames of data in the absence of an acoustic transmit. By receiving and beamforming the signal as usual despite the lack of transmit, a representation of the background electronic noise is obtained [22]. Because the variance of a zero mean signal is equal to that signal’s power, the pixel-wise variance across multiple noise frame acquisitions results in a mapping of noise power across the imaging field of view. Given the power of the signal from the image acquisition () and the noise power calculated from the null-transmit acquisitions (), the temporal SNR can be calculated by
| #5 |
While a potential concern associated with using null-transmit acquisitions is that they may fail to capture all of the noise present during live acquisitions, testing in a stationary phantom environment shows the noise mapping approach produces similar SNR results to the temporal coherence method, especially around the relevant SNR range associated with the 28 dB noise perception target [22].
III. Methods
This study evaluated temporal SNR based adaptive intensity adjustment methods during in vivo fetal imaging with eleven pregnant volunteers. All in vivo imaging was performed with written informed consent from the volunteers following an approved Duke Health Institutional Review Board (IRB) protocol. Table I provides subject demographics, including trimester, ethnicity, race, and Body Mass Index (BMI). An expert sonographer with more than 25 years of imaging experience performed the scanning using a Siemens ACUSON Sequoia scanner and a 5C1 transducer (Siemens Medical Solutions USA, Inc.). The default imaging setting on this system employs a proprietary synthetic focusing scheme called InFocus, combining information from multiple deeply-focused transmits (9.7–10.5 cm depth in the study configuration) to create a fully-focused field of view [23]. Rather than use the synthetically combined data, only the SNR along the center line of each transmit was used for SNR calculation, making these results relevant for conventional focused imaging scenarios without synthetic focusing. Acquisitions were performed with pulse-inversion harmonic imaging at four different receive frequencies: 2.8 MHz, 3.2 MHz, 3.8 MHz, and 4.4 MHz. The system’s time-gain compensation was fixed in all acquisitions to the default setting, where all the slide adjustment controls are centered. A default gain offset of 0 dB was also maintained in all cases. Two acquisitions were performed at each frequency, resulting in eight total acquisitions per volunteer. Each acquisition took consisted of two unique pulse sequences that immediately followed one another.
Table I:
Volunteer Study Demographics
| Characteristic | Count |
|---|---|
| Trimester | Second (7) Third (4) |
| Ethnicity | Hispanic or Latino (1) Non-Hispanic (10) |
| Race | White (4) Black or African American (6) Not Disclosed (1) |
| BMI | 19–24 (1) 25–29 (2) 30–34 (2) 35+ (4) Not Reported (2) |
A. Initial MI Recommendation
The first portion of each acquisition swept acoustic output while SNR was monitored. Following the sweep, the MI matching the temporal noise perceptibility threshold was determined. Prior to each acquisition, a view of the fetal abdomen containing the fetal liver was found in each volunteer. A region of interest (ROI) box of 1.5 cm axial length and 5 lateral degrees was placed down the center of the field of view at a depth overlapping the abdominal target. The acoustic output sweep collected image data at nine acoustic output levels from the highest to lowest available transmit power settings (100% power to 0.2% power). Nine power levels were chosen based on laboratory testing showing this degree of sampling balanced sweep time considerations with the goal of well-sampling the acoustic power spectrum. With nine transmit powers, the sweep time was 13 seconds. The nine transmit powers were evenly distributed across the 32 output powers available on the system. For each transmit power setting the squared magnitude of the envelope-detected image frame was used as the overall signal power, (i.e. tissue echo + clutter + noise power). The isolated noise power, , was calculated from ten frames collected in a null-transmit configuration with settings matched to the imaging configuration. The variance across these ten frames equals the noise power, which was plugged into Eq. 5 with the overall signal power to yield the temporal SNR. Noise frames were reacquired with each volunteer and immediately prior to the two acquisitions at each frequency to ensure the calculated noise level matched the current imaging settings. The noise level was stable during the approximately 3-minutes of experiments at each frequency, meaning the noise frames did not need to be reacquired during the course of the experiments in a given configuration.
The temporal SNR levels reported throughout this text are in decibels, calculated from the Eq. 5 result by taking . This temporal SNR in decibels was compared to the MI output level and fit to a logarithmic function. A logarithmic fit was selected given that the computed SNR values have been logarithmically compressed, following their conversion to decibels. The MI corresponding to an estimated temporal SNR of 28 dB on the fit curve was used to recommend the MI output setting. With 32 unique transmit power levels accessible on the scanner, the lowest available MI exceeding that recommended level was automatically selected for imaging as the adaptive imaging portion started.
B. Adaptive MI Adjustment
Following the initial output adjustment, the second acquisition section immediately followed. During this section, automatic adjustment of the output level occurred during live imaging. Rather than sweeping acoustic output to find the level at 28 dB, the average temporal SNR in the ROI box was continuously monitored for a 20 second period. At any point, if the SNR fell below 28 dB, the transmit power increased to the next highest setting of the 32 available. Alternatively, if the SNR rose more than 10% higher than the 28 dB target, more than 30.8 dB, the transmit power decreased one step. This band of acceptable SNR levels was used to ensure the system did not change MI continuously in response to expected minor frame-to-frame SNR variability. When MI adjustments were not needed, SNR was measured at a 10.7 Hz rate. When MI adjustments occurred, that switch took on average 1.1 seconds, but live imaging continued throughout that period. This adjustment of acoustic output during live-imaging demonstrates an adaptive ALARA output configuration.
Each of the two acquisitions at a given frequency followed a slightly different protocol to explore adaptive adjustment under different scenarios. For the first acquisition, the sonographer held the probe fixed above the fetal liver target for the 20-second imaging period to evaluate the system stability in a stationary imaging case. In the second acquisition, the imaging view was swept back and forth between the fetal liver and fetal kidney for the duration of the 20-second adaptive update period. This procedure simulated a scanning scenario with the probe and imaging targets in near-constant motion. The ability of the adjustment scheme to maintain the target 28–30.8 dB quality level was assessed and compared between these two scenarios.
IV. Results
A. Initial MI Recommendation
A representative example of the data available from the acoustic power sweeps is shown in Fig. 1. The leftmost frame of this figure shows the B-mode image data for a 1.0 MI acquisition at 3.8 MHz frequency during the output sweep. At shallow depths, the bright layers correspond to the maternal abdominal wall. Beneath the abdominal wall lies the placenta, a region of relatively uniform echogenicity ranging from approximately 4 to 6 cm depth. Starting at around 7 cm depth, the circular cross-section of the fetal abdomen is seen, surrounded by darker regions of amniotic fluid. The red sector overlaid on the fetal abdomen corresponds to the region of interest, which was placed at 8 cm axial depth for this acquisition. The center frame of Fig. 1 shows the corresponding noise frame for the 1.0 MI level. The noise level increases axially, as gain is increasingly applied with depth to amplify attenuating signals. In the rightmost frame of Fig. 1, the full-field temporal SNR of the image can been seen, obtained by dividing the signal power calculated for each pixel of the B-mode image by the corresponding noise power in the noise frame. As expected, brighter regions of the B-mode with higher echo (signal) strength correspond to higher SNR.
Fig. 1:

Representative example of data obtained during an acoustic output sweep. This data corresponds to the 1.0 MI output level in a 3.8 MHz sweep. On the left, the B-mode view is seen. In the center is the noise frame. The SNR map on the far right is obtained by dividing the B-mode signal by the noise frame power. MI recommendations for imaging the fetal abdomen are based on the sector overlapping the target, shown here in red.
Fig. 1 provides information on the SNR at only a single acoustic output. Fig. 2 shows the median SNR measured in the ROI at each acoustic output in this sample 3.8 MHz acquisition. There is a clear trend of increased SNR with higher MI output. A logarithmic fit to the SNR vs MI curve is used to predict the MI at the 28 dB SNR threshold criteria, which was at 0.27 MI for this case. The adherence between the measured SNR values and the fit curve supports the selection of this fitting function. Following determination of this recommended output, the scanner switched to the acoustic power setting closest to that MI. For the 9 MI in the acoustic output sweep, the lowest MI meeting the 28 dB SNR threshold was 0.35. The B-mode, noise frame, and SNR map corresponding to the 0.35 MI acquisition are shown in Fig. 3. Five consecutive image frames were acquired at each power setting during the sweep. The average percent difference in SNR between each frame was 1.2%, while the average recommended MI variation from using the different sets of image frames was 1.1%.
Fig. 2:
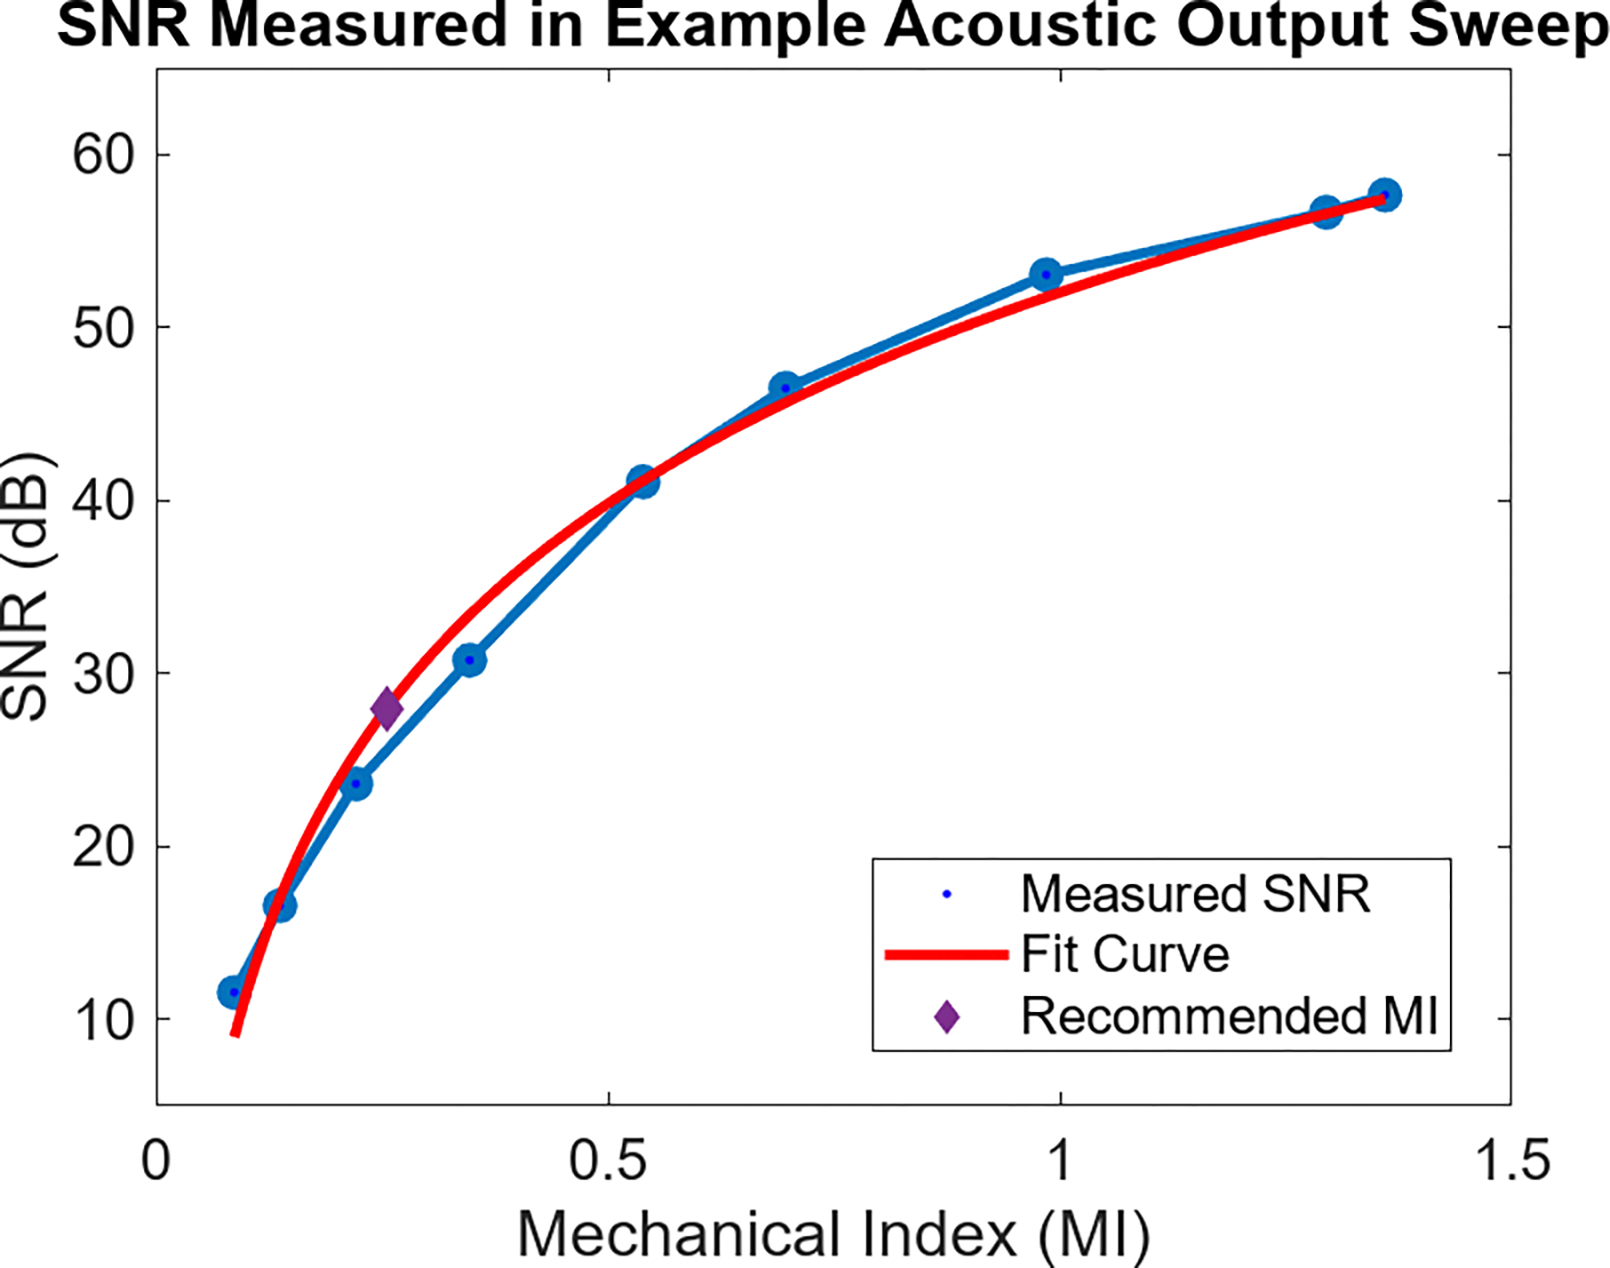
Median SNR in the ROI at each acoustic output for the sweep associated with Fig. 1. SNR increases monotonically with higher Mechanical Index output. A logarithmic curve is fit to the data to aid in predicting MI required to reach a given MI. The purple diamond point highlights the 0.26 MI needed to reach the 28 dB SNR target.
Fig. 3:

Data obtained from sweep acquisition minimally exceeding 28 dB SNR threshold. The recommended ALARA MI was 0.27, while this data corresponds to the 0.35 MI level. From left to right, the three plots correspond to the B-mode, noise frame, and SNR map.
Fig. 4 displays the MI recommended after following the demonstrated procedure for all acquisitions. Represented in the figure are the two measurements at each of the four different imaging frequencies in all eleven volunteers. The volunteer numbering was assigned after sorting by their average recommended MI. The solid line in the background shows the average recommended MI at each frequency, while the shaded region represents the standard deviation of the recommended MIs at each frequency level. A general trend of increasing recommended MI is observed with increasing imaging frequency. On average, the difference in MI between the two repeats in each volunteer at a given frequency is 14%. Across volunteers, the maximum recommended MI at each frequency is always more than 100% the minimum recommended MI, showing considerable inter-volunteer variability.
Fig. 4:
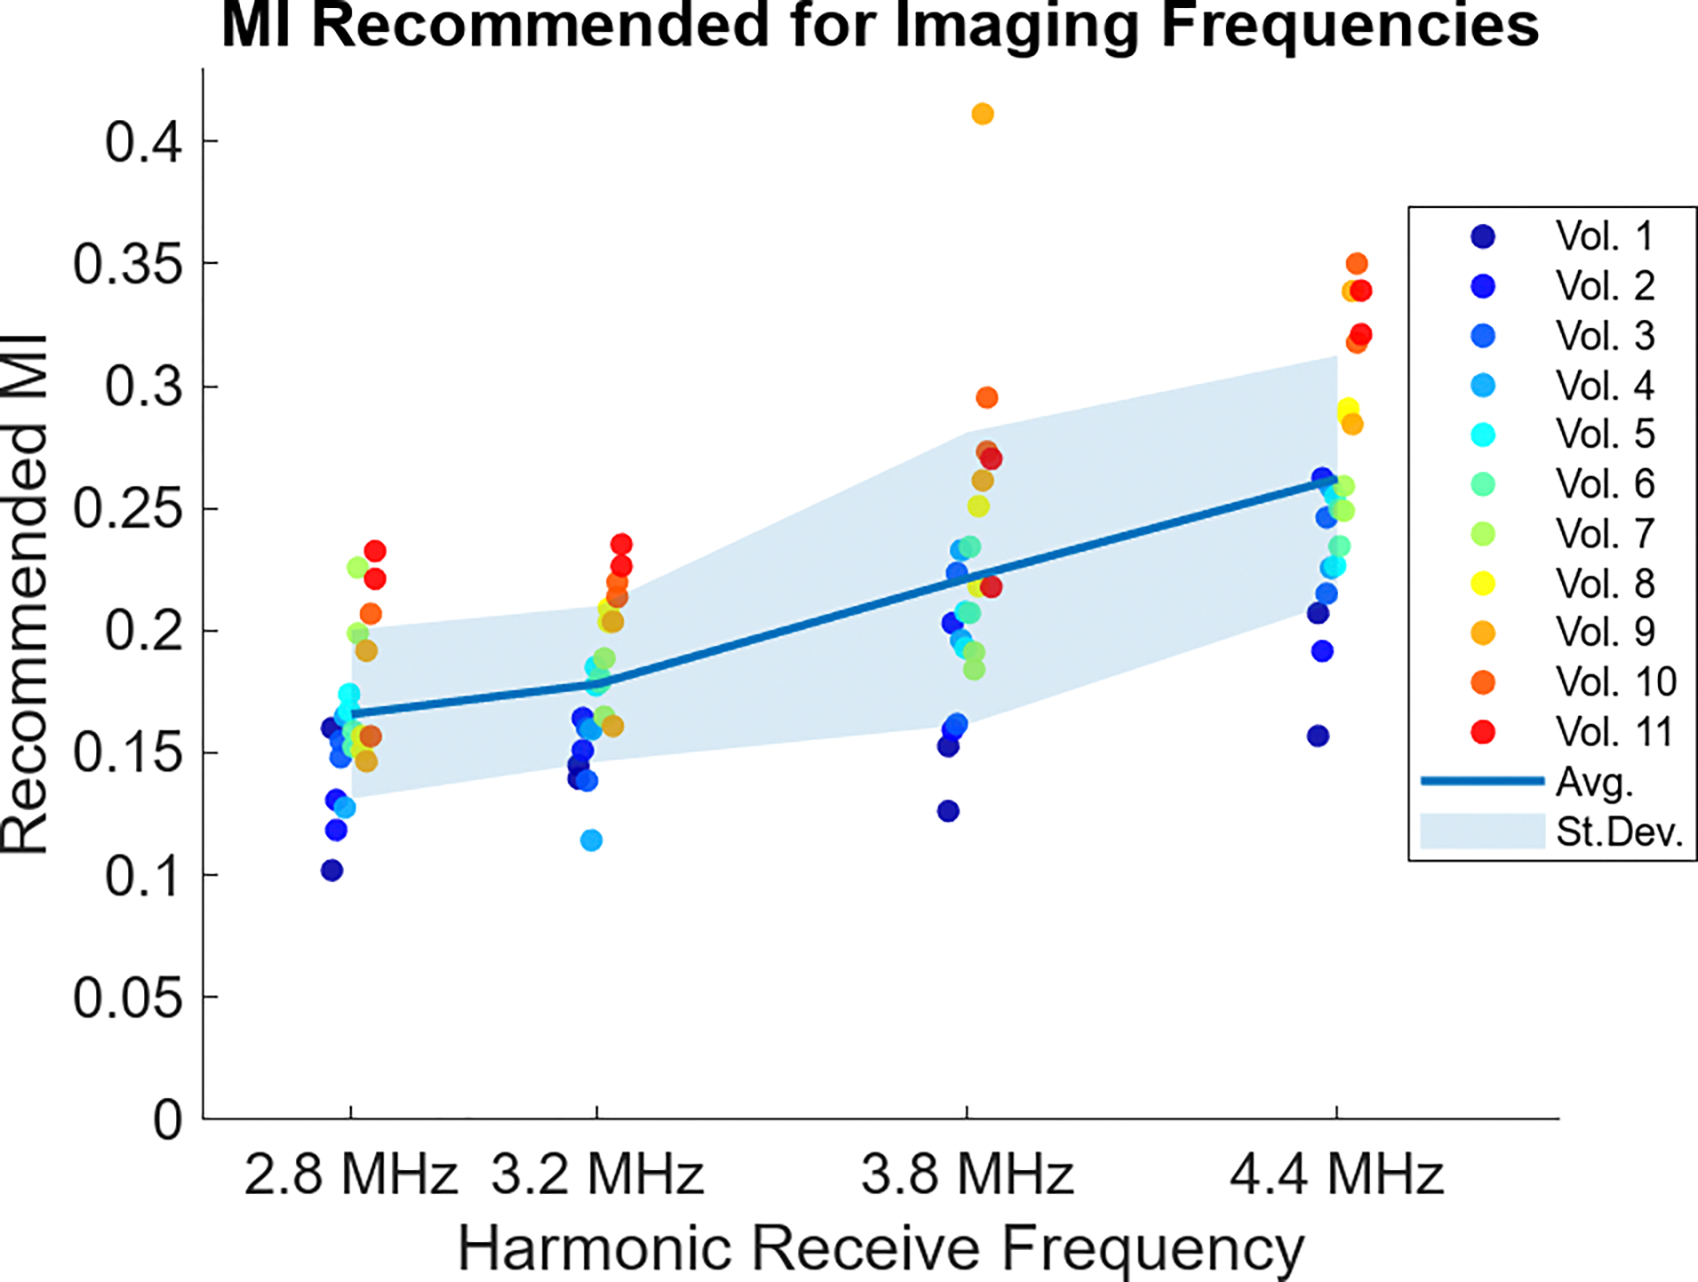
Recommended MI from the acoustic output sweeps in each volunteer. Two sweeps were done at each frequency with colored dots corresponding to each volunteer, after ordering by averaged recommended MI. The solid line across the plot represents the average MI recommended at each frequency, while the shaded region represents the standard deviation around that average.
The target structure remained at the same depth for each repeat acquisition in a given volunteer. In two volunteers, the fetal abdomen target was at 6 cm, for two others the depth was 8 cm, and in the remaining seven volunteers the fetal abdomen was at 7 cm depth. In Fig. 5, the recommended MIs are separately displayed for each target depth. For these and all following box plots, the lower and upper tail extents represent the range of the results, excluding outliers. The central box extends from the 25th to 75th percentile recommended MI, while the horizontal line marks the median recommended MI for each configuration. Increasing target depth is generally associated with higher MI recommendations, with the exception of the distributions for 3.8 MHz where the outlier example in the 7 cm depth set shifts the median of that distribution higher than that of the 8 cm depth acquisitions.
Fig. 5:
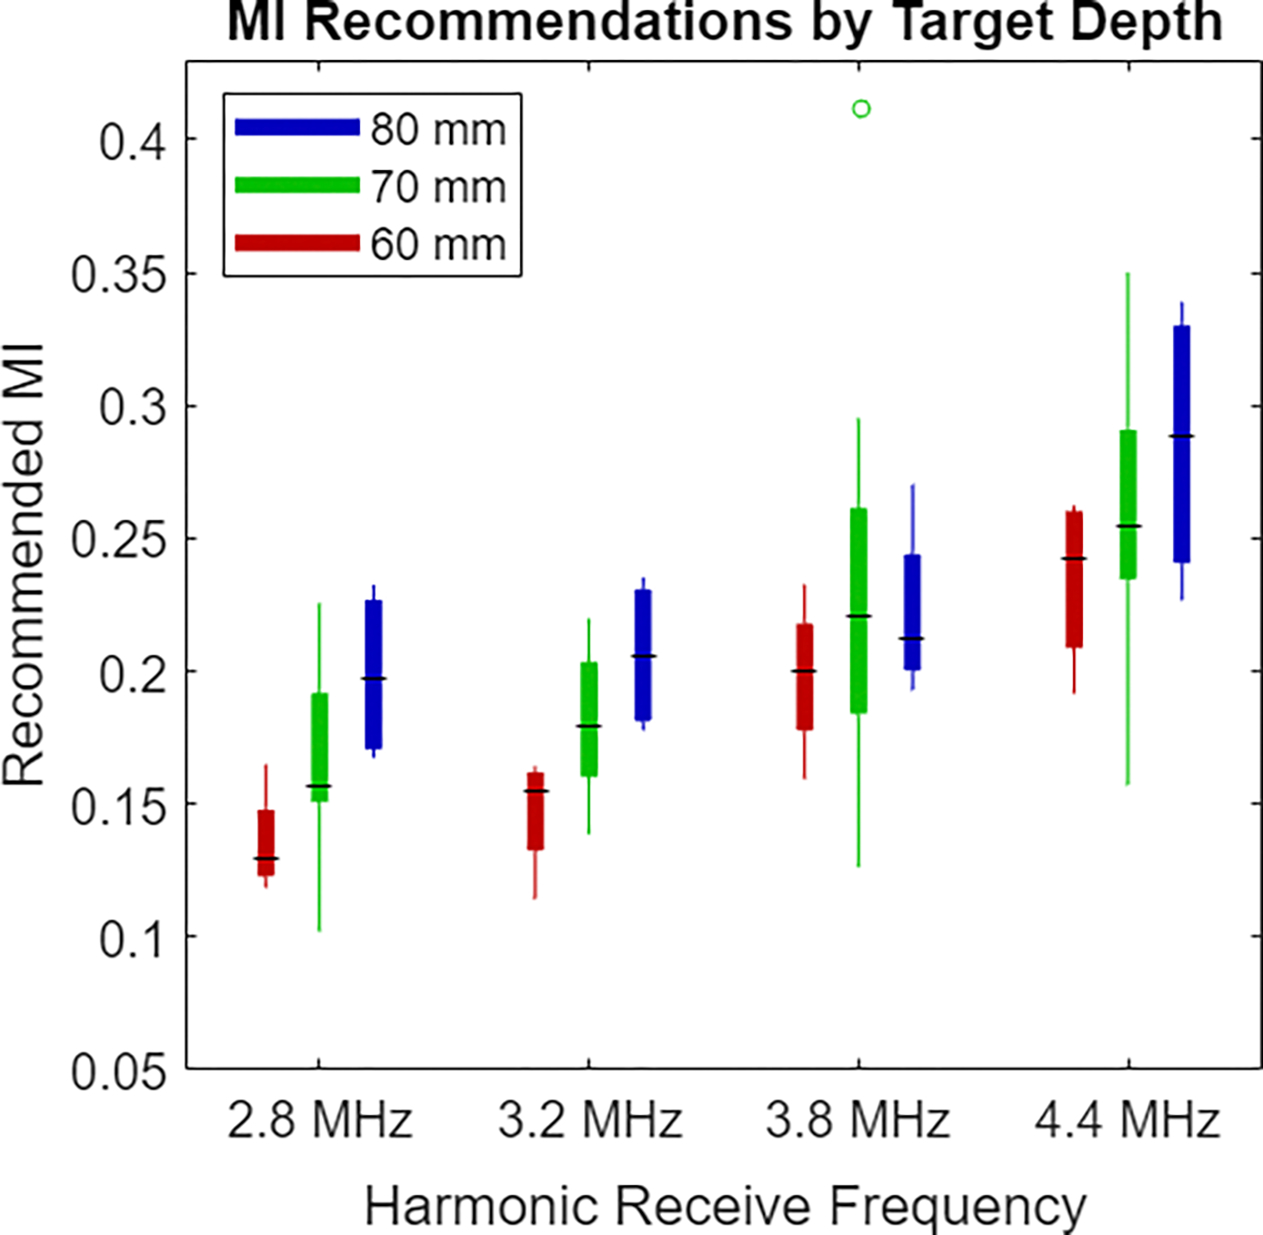
Boxplots of recommended MI values at the different target depths. The red bar at the left of each group corresponds to the 6 cm acquisition depth, the green bar in the center is for 7 cm acquisitions, and the blue bar at the right is for the 8 cm acquisitions. Acquisitions with deeper targets are generally associated with increased recommended MI.
During the live imaging portion of this study, the aim was to achieve the previously reported noise perception target of 28 dB. Retrospectively, the saved data were used to determine the MI required to achieve other SNR thresholds. In Fig. 6, the distribution of recommended MI is shown at 20 dB, 25 dB, 30 dB, and 35 dB levels, with the original 28 dB level displayed for comparison. Use of a higher SNR threshold shifts recommended MI higher, but these MI levels are still attainable in many standard imaging scenarios and below often-used default output on clinical systems. Using lower SNR thresholds than 28 dB results in potential further reduction of acoustic output.
Fig. 6:
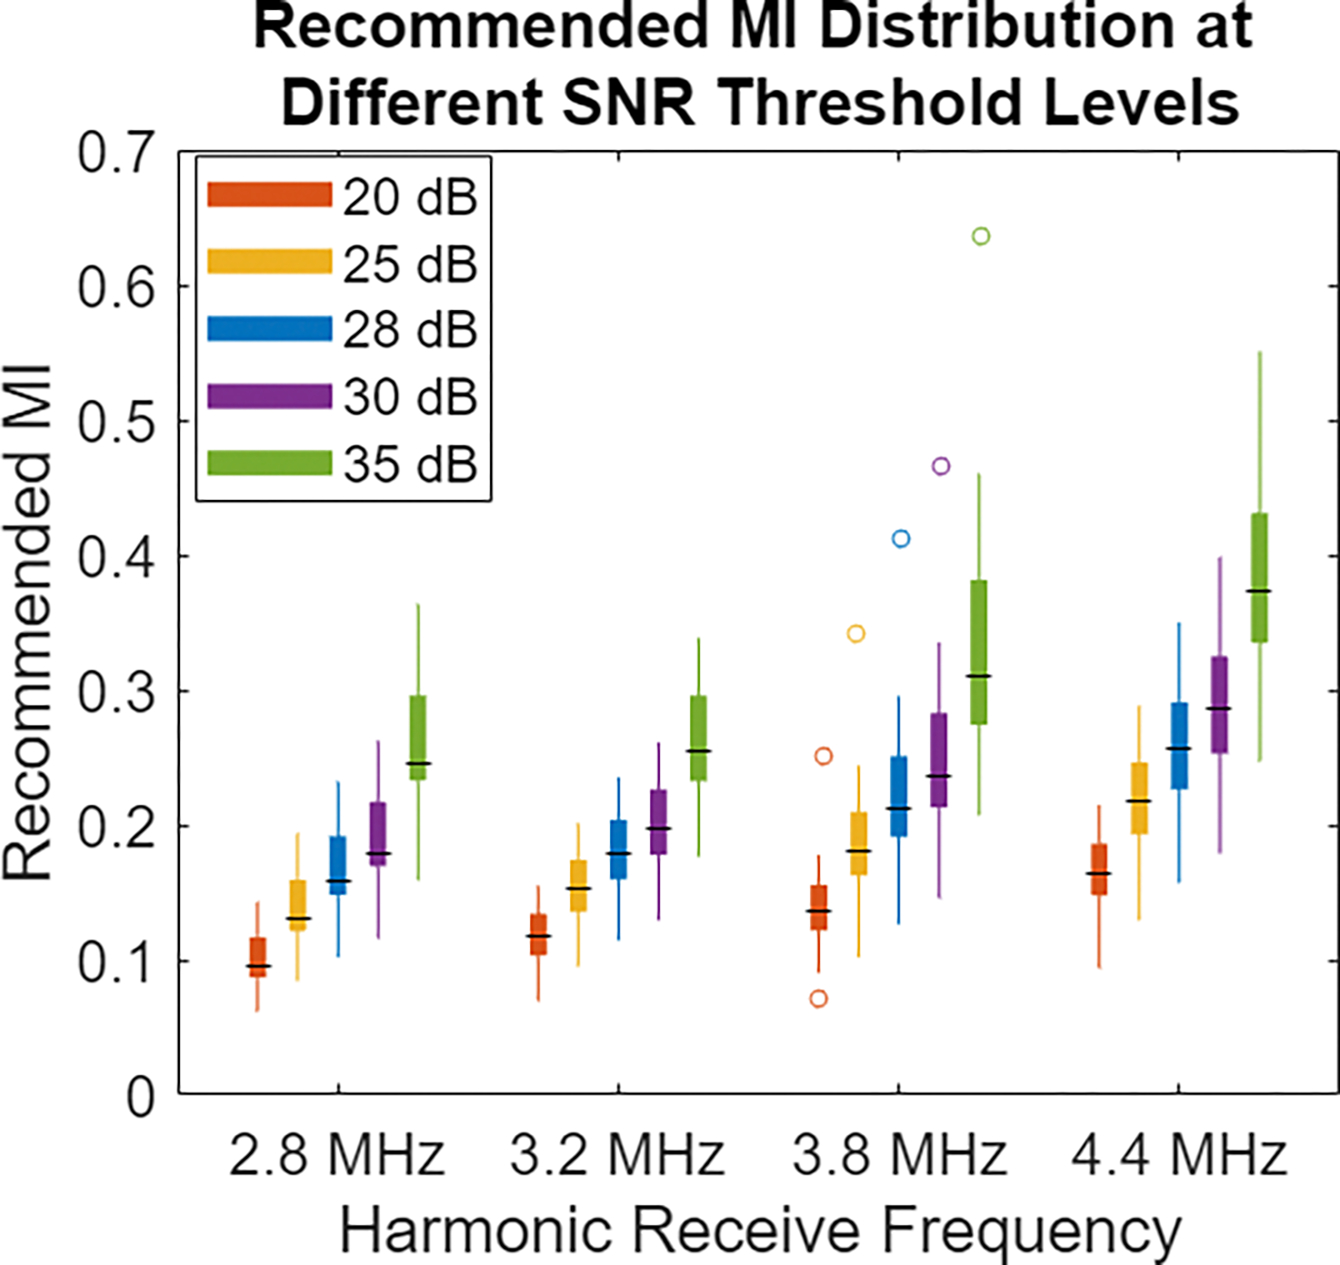
Boxplots of recommended MI values for different SNR threshold levels. The 28 dB SNR threshold of the previous examples is compared against the recommended MI if the target data quality level were 20 dB, 25 dB, 30 dB, or 35 dB. Higher SNR requirements demand increased acoustic output, while lower SNR thresholds provide opportunity for even further acoustic output decreases.
As the median SNR in the ROI was considered for initial MI recommendation, noise would be largely imperceptible across the region of interest. However, by definition of the median, 50% of the region would be below the target 28 dB SNR level, even if only slightly. In Fig. 7, the percent of the ROI needing to reach or exceed the SNR criteria of 28 dB is increased from the 50% (median) level to 75%, 90%, or 95%. Requiring more of the ROI to reach the perception threshold SNR necessitates higher MI, but increased confidence the image quality is at a level where noise is imperceptible.
Fig. 7:
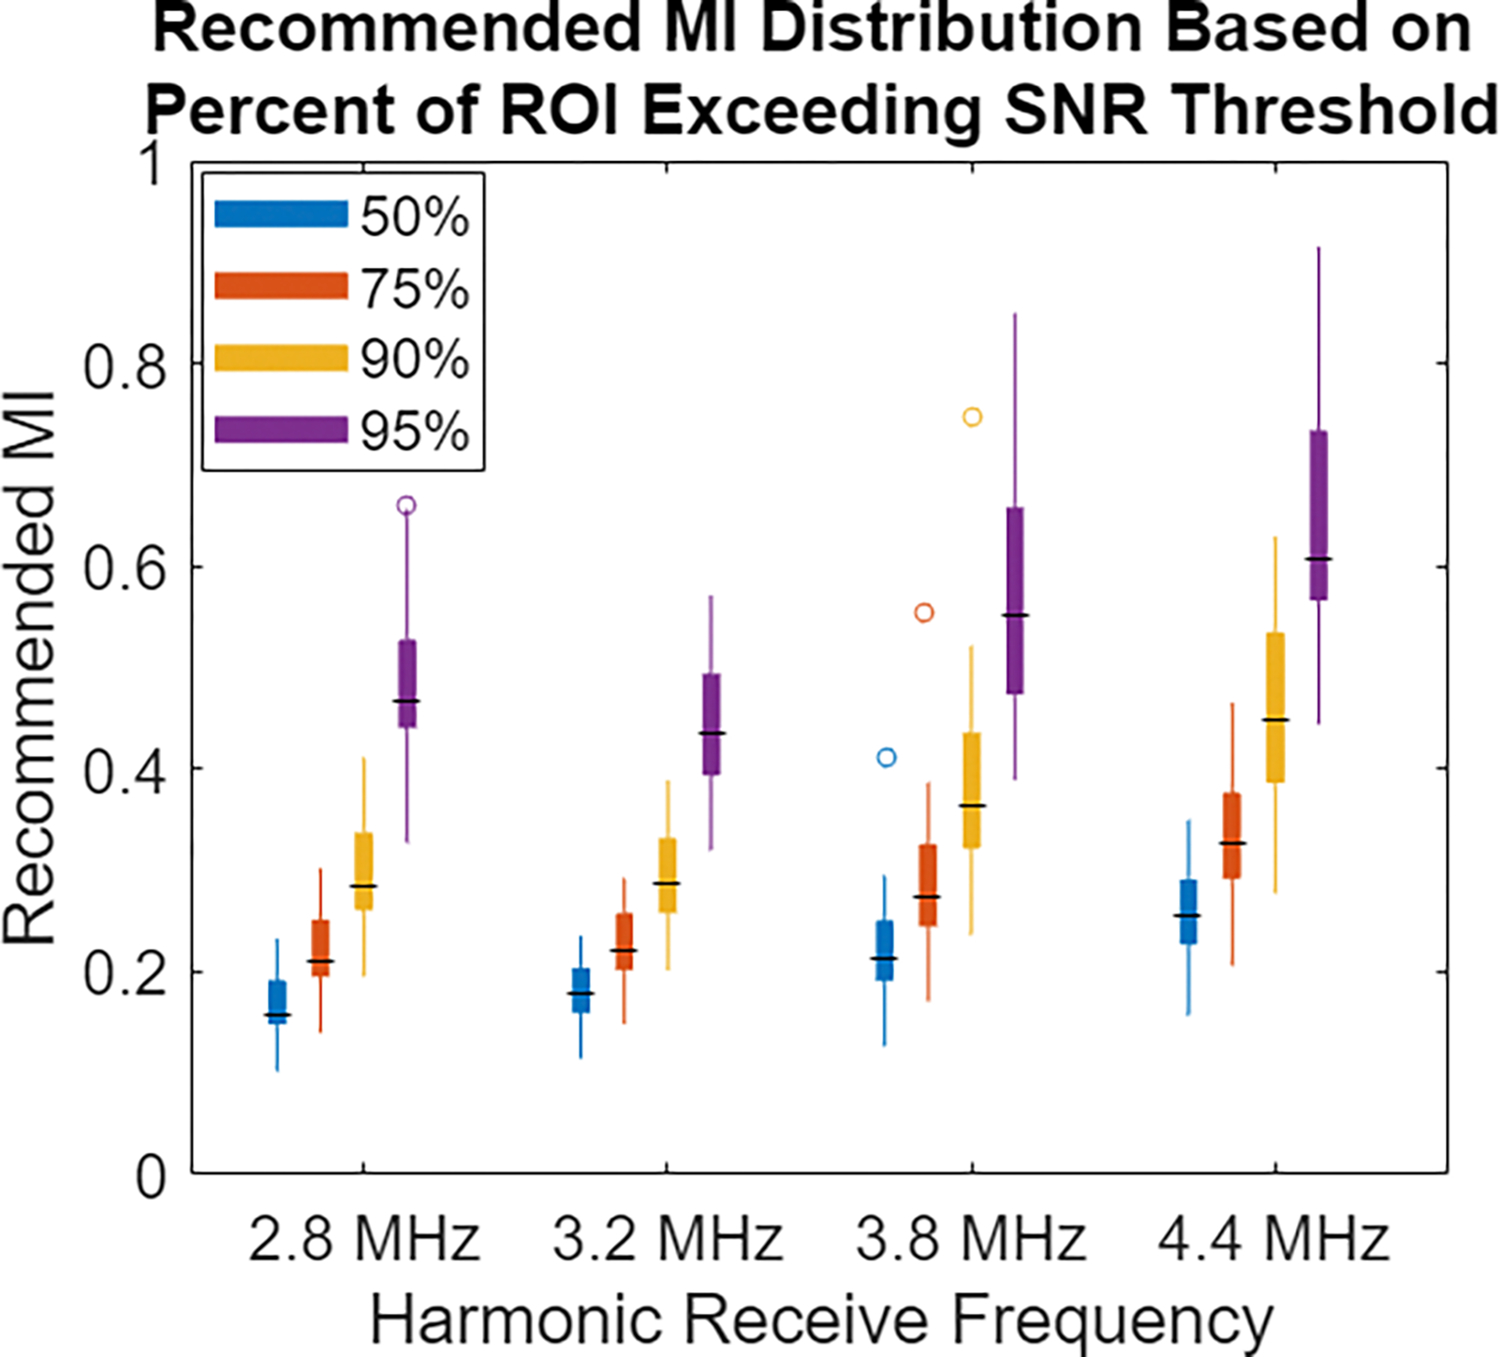
Distribution of MI required to reach varying levels of percent compliance with the SNR threshold in the ROI. The MI resulting from using the default 50% (median) SNR in the ROI is compared with using the 75%, 90%, and 95% coverage value. Requiring that more of the ROI exceeds the noise perception threshold leads to increased confidence high image quality is achieved, but it results in an increasing majority of the ROI being exposed more than necessary for noise-mitigation purposes.
B. Adaptive MI Adjustment
With the recommended MI chosen based on the median MI in the ROI, the adaptive adjustment of that MI proceeded for 20 seconds, switching to higher or lower MI as needed to maintain image quality in the 28–30.8 dB temporal SNR range. The sonographer was successfully able to locate targets, keep in them view, or switch between imaging targets as these adaptive adjustments were occurring. Fig. 8 shows examples of the SNR and MI from the 20-second period in one volunteer’s 4.4 MHz acquisitions. In the stationary probe case shown in the left column, the plots show only a limited number of MI updates were required. For much of the acquisition period, the SNR is within the target region and the MI does not need to update to maintain that SNR. For the moving probe example in the right column, SNR is more variable as the target in the region of interest changes. As a result, more MI updates occur, but these updates again stabilize the SNR, helping maintain the desired image quality level.
Fig. 8:
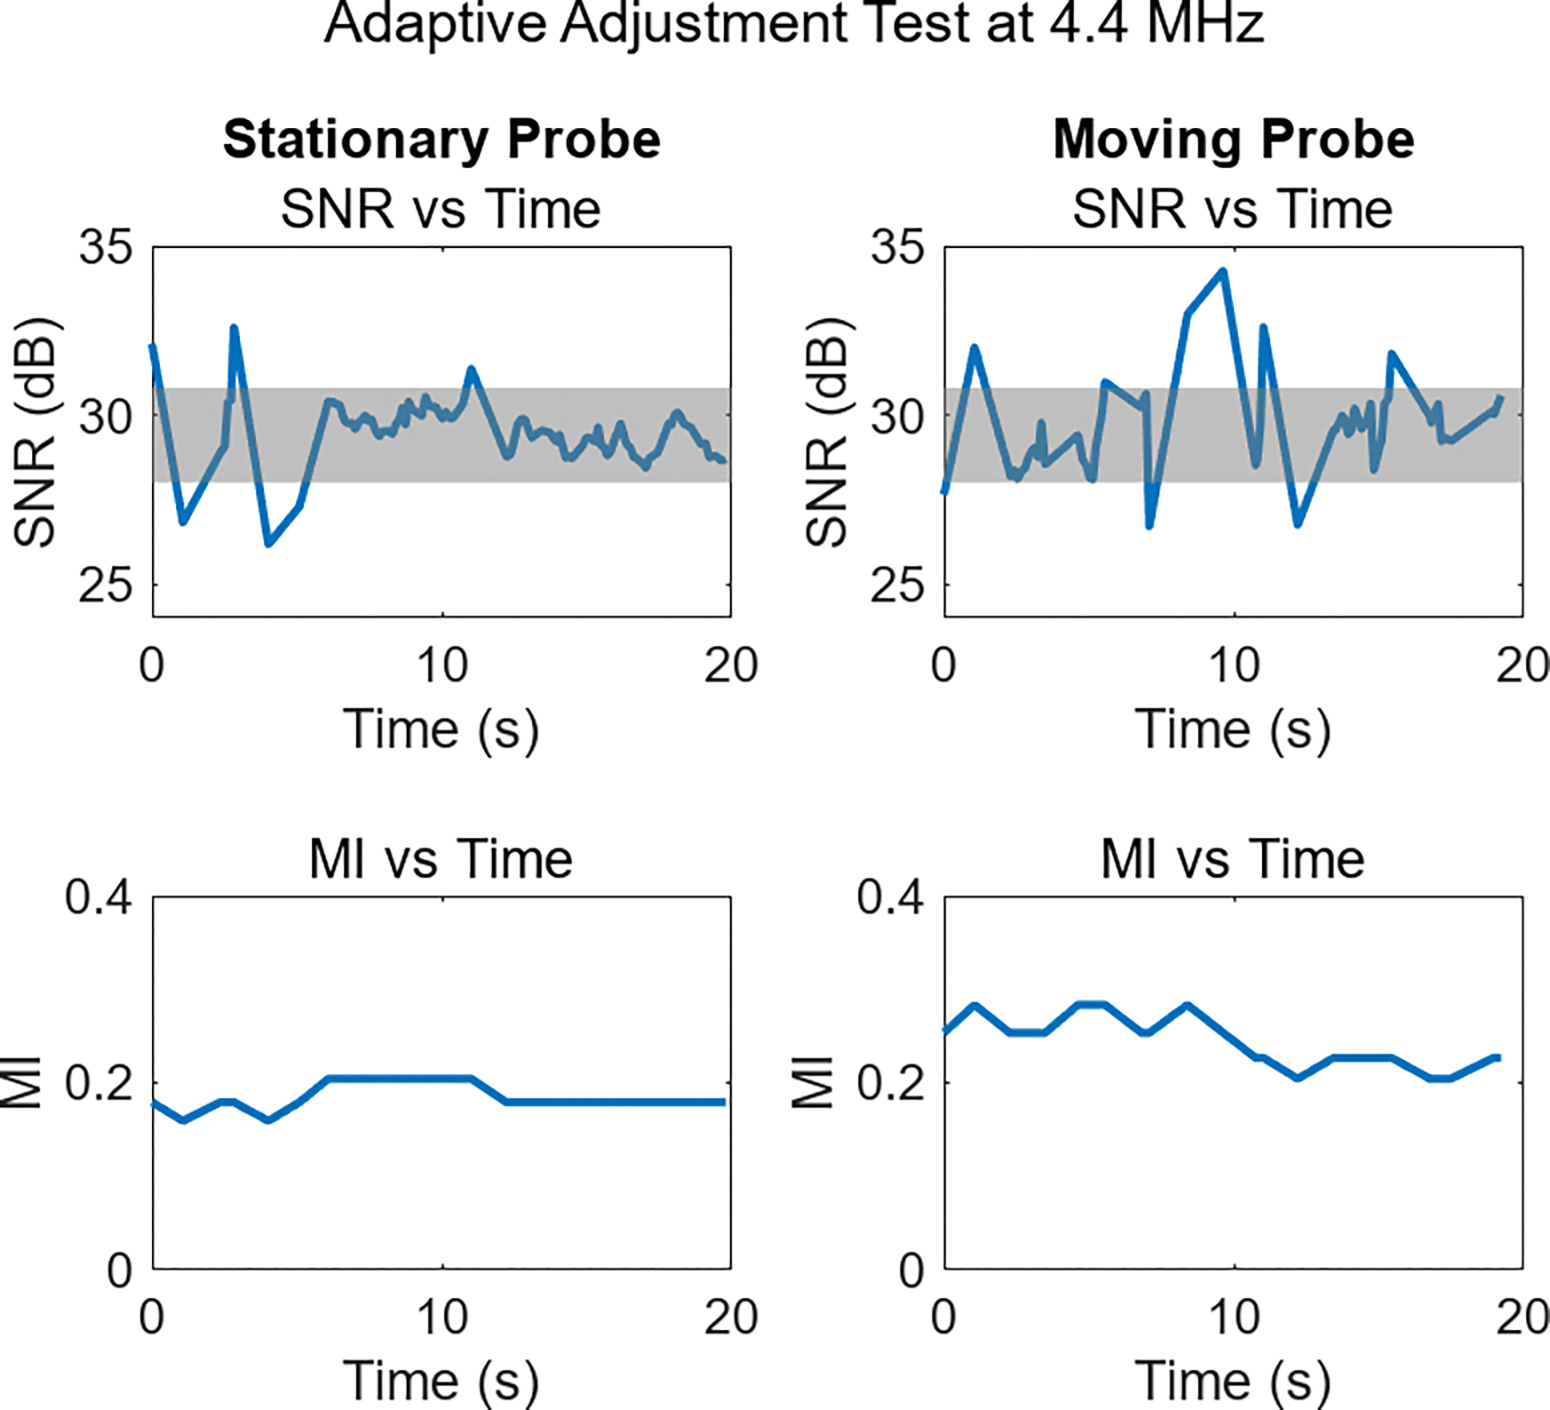
Example of adaptive adjustment during fetal imaging. In the SNR plots, the shaded gray region denotes the target SNR range. The left column displays the SNR and selected MI while the probe was held stationary, and the right column shows SNR during a period when the probe was in motion. Increased SNR variability occurs during periods of motion, but in all cases target SNR levels are observed, or MI adjusts to achieve them.
While Fig. 8 shows cases of successful adaptive performance, a noteworthy deviation from this pattern can be seen in Fig. 9. These 2.8 MHz acquisitions exhibit oscillating MI and erratic SNR profiles. To varying degrees, this behavior was seen throughout the study. The mechanism behind the oscillating MI is the constraint in this initial study of having only 32 acoustic output levels available on the clinical system. The change in data quality as MI settings switched to neighboring MI levels was on average 3.6 dB. With a SNR step-size this large, MI adjustments could completely overshoot the target SNR range, immediately triggering a secondary adjustment back to the original condition, which may lead to a repeat of this adjustment procedure.
Fig. 9:
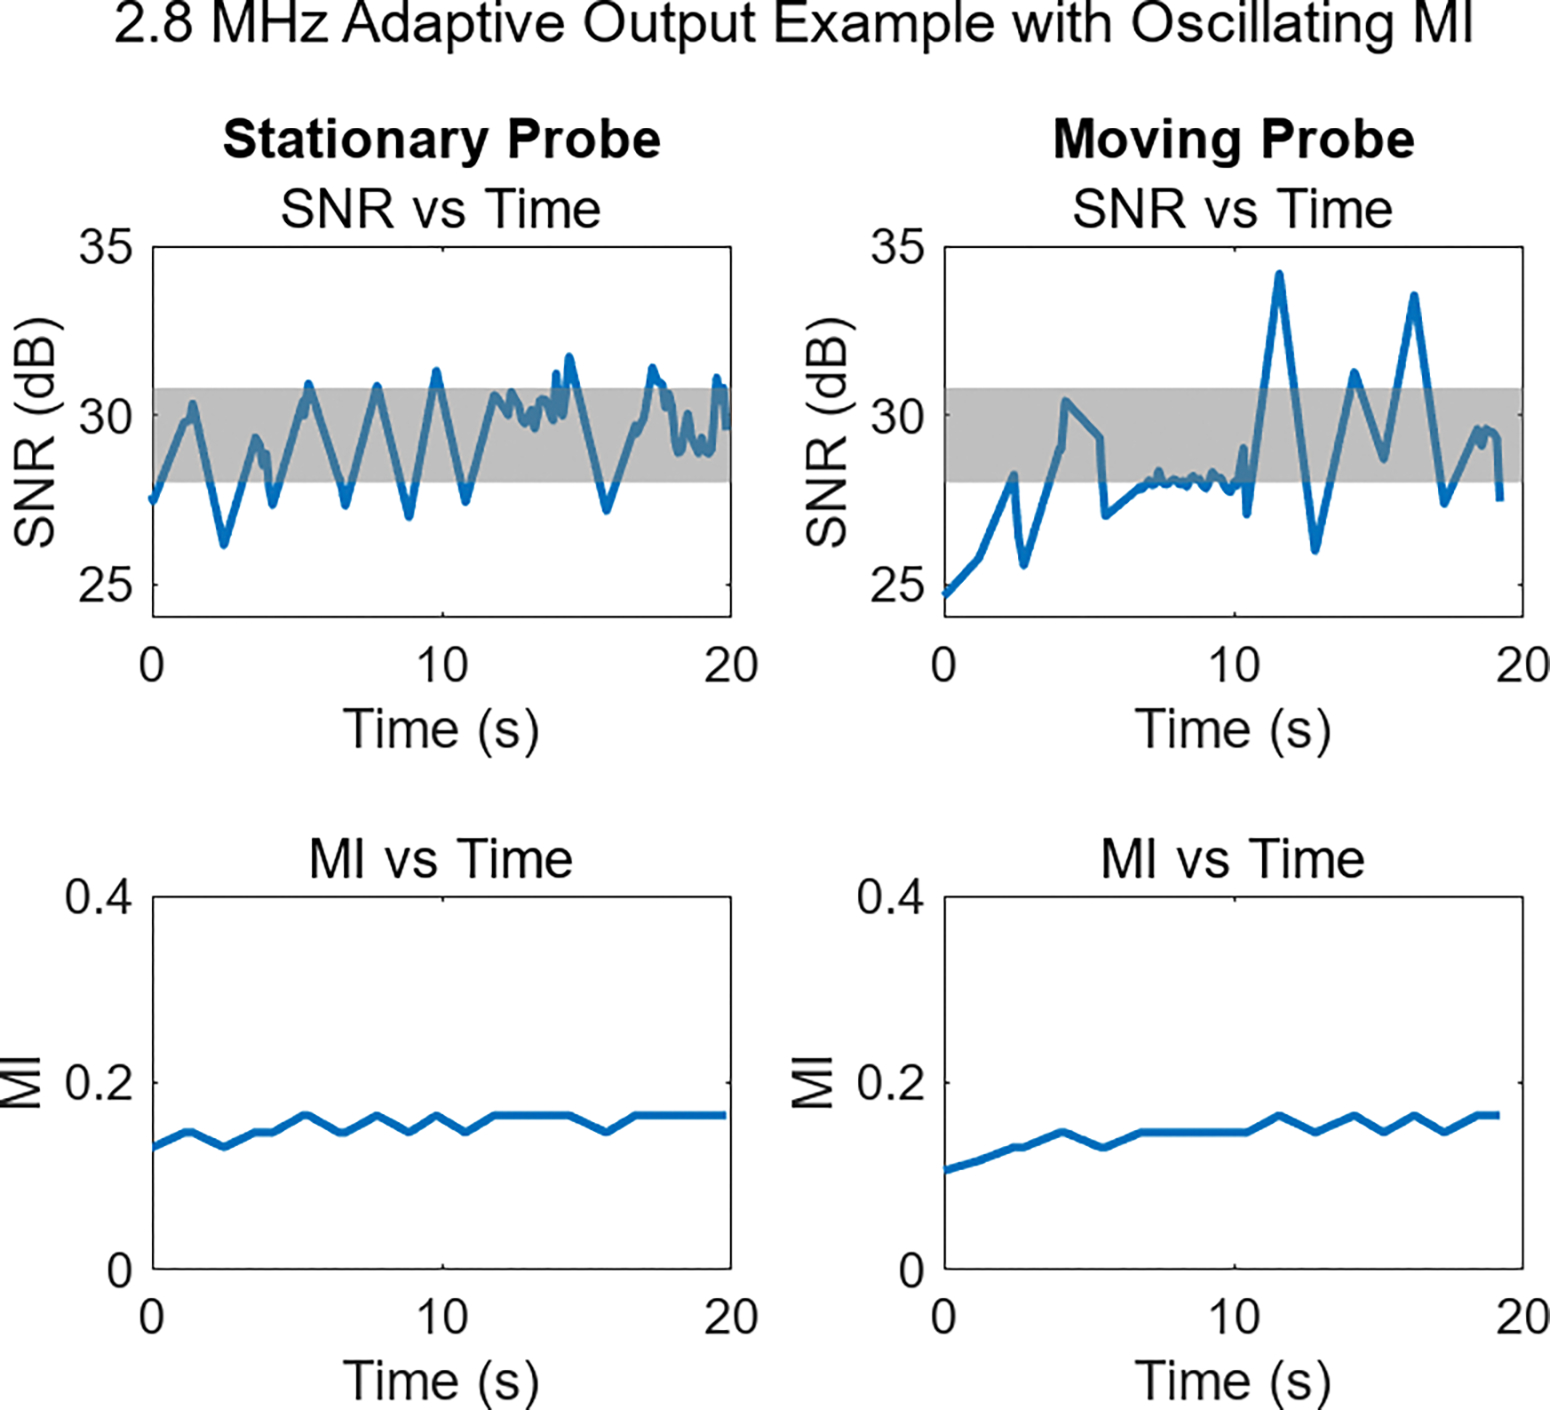
Adaptive output demonstration featuring oscillating SNR (top row) in both stationary and moving probe examples. These SNR changes result from the frequent MI updates (bottom row), occurring due to an overly coarse MI adjustment. Allowing for a smaller step size would improve the system’s ability to maintain target SNR levels.
A supplementary video file has been included to show the live B-mode imaging view for the four example imaging cases represented in Fig. 7 and 8. For these video examples, the ROI box is shown, along with the SNR and MI plots associated with imaging in that region. From the videos, it is evident that the MI changes are minimally noticeable, both in terms of brightness variation and in the delay imposed to live imaging. Especially in the deepest areas of the field-of-view there is some visible electronic noise, but this is a result of those regions not being included in the ROI box. If low-noise imaging in those regions were the goal, the ROI should be placed to overlap those structures to incorporate their image quality characteristics into the MI selection process.
Fig. 10 quantifies the performance of the adaptive adjustment scheme, comparing the conditions of the stationary probe with the moving transducer. In the left frame, outcomes of the SNR evaluations are shown. The bar plots show the proportion of the times SNR was checked where the SNR was under, over, or in the target range. For the stationary case, the SNR was measured in the target range 90% of the time, whereas in the moving transducer case that number dropped to 71%. It was approximately equally likely in both cases that SNR measurements outside the target range were higher or lower than those levels.
Fig. 10:
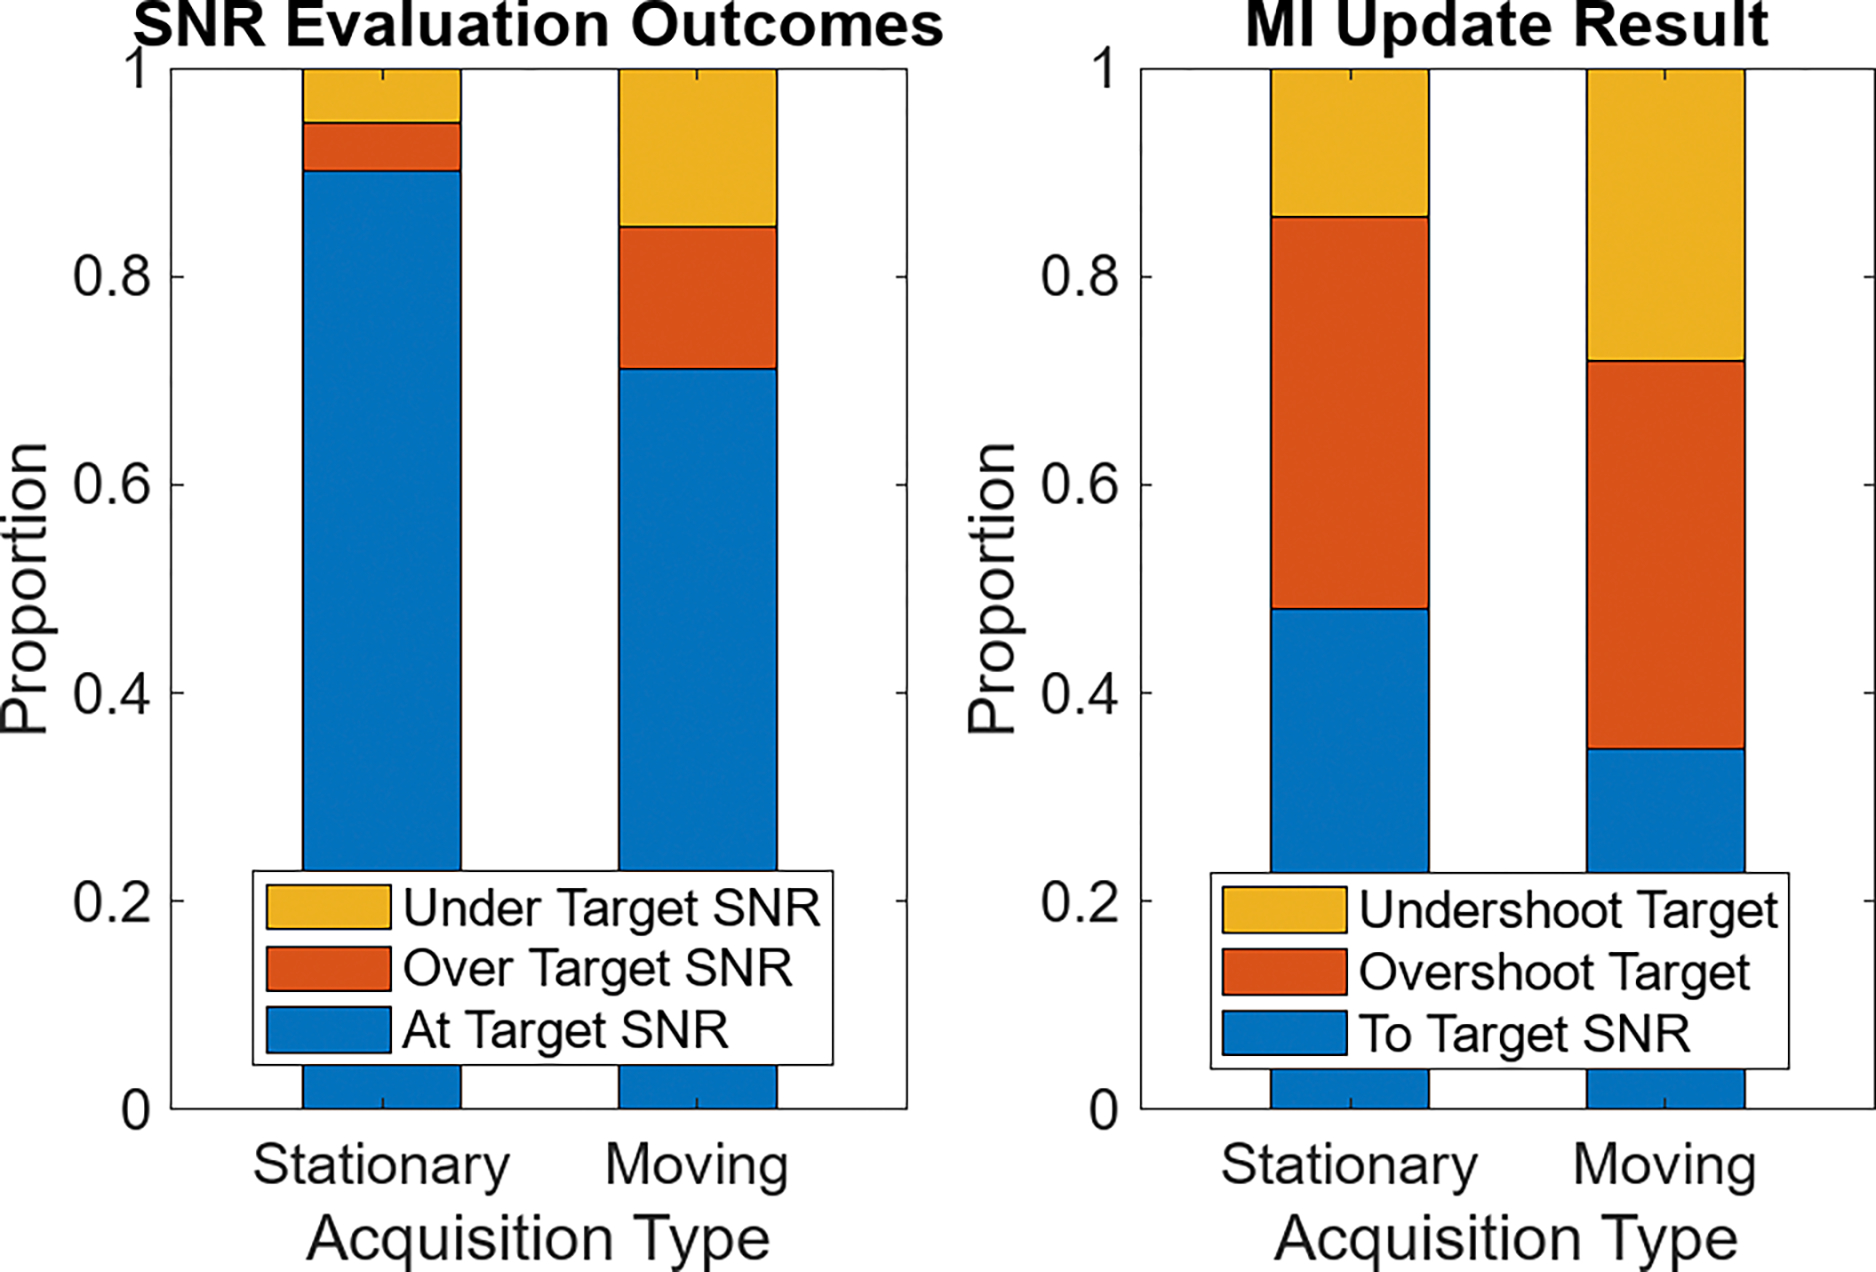
Bar plots of adaptive acoustic output adjustment performance, averaged across all volunteers and acquisitions. On the left, the instances where target SNR levels are observed compared to non-target SNR is shown in the stationary and moving cases. On the right, the proportion of possible outcomes associated with performing MI updates are shown for each of the two motion levels.
In the plot on the right of Fig. 10, the bars show the result of performing an MI update. These updates were triggered whenever a SNR evaluation outside the target range was observed. For the stationary case, 48% of MI updates resulted in the previously undesired SNR returning to target levels. In the moving condition, fewer MI updates (35%) brought the SNR back within the target range. For both the stationary and moving acquisition cases, the primary reason for not returning to the target SNR was because the adjustment overshot that target range. This is the same over-adjustment effect shown in Fig. 9, resulting from the large power adjustment step-size in the ultrasound system.
V. Discussion
A. Initial MI Recommendation
As Fig. 1 shows, the structures present in a given imaging view have significant echogenicity differences. Additionally, the background noise power varies with depth as a result of the default time-gain compensation setting used here that amplifies signals at depth to accommodate expected attenuation. As a result of the varied signal and noise power, SNR varies throughout the field of view. Given a fixed temporal noise perceptibly level, regions with SNR below the perception level are expected to have visible noise, while regions above that level still have noise, but at a level small enough that it is likely not perceived. The SNR is generally high throughout the field of view, even in the amniotic fluid surrounding the fetus where the tissue echo magnitude is expected to be small or nonexistent and clutter is the major source of temporally stable signal. The 20–30 dB SNR in the amniotic region suggests that relative even to the clutter echo magnitude, electronic noise is very low. This supports the claim that modern clinical systems have excellent noise mitigation measures, including shielding from electronic noise. While the analysis here was done with harmonic data, as that mode is now standard in clinical settings, an incidental observation is that the increased echo strength in fundamental imaging modes leads to even higher SNR levels.
If a target region being considered for adaptive MI selection is in a relatively low SNR region, a higher MI is required to achieve the perception threshold. The frequency used for imaging effects the SNR and the resulting MI, as shown in Fig. 4. One mechanism contributing to this behavior is that transducers are less sensitive to frequencies at the extremes of their bandwidth. While all of the transmit and receive frequencies were within the probe’s 1–5 MHz nominal frequency bandwidth, some dropoff in receive sensitivity would be expected at the higher end of this bandwidth. This could contribute to higher MIs being needed, especially at the 4.4 MHz frequency. However, we hypothesize the leading mechanism driving higher frequencies to require increased recommended MI in Fig. 4 is the greater signal attenuation at those higher frequencies. With higher frequency being associated with more attenuation, more acoustic output would likely be required to achieve equivalent SNR conditions to the SNR reached at lower power with lower frequencies. This same factor could explain why deeper targets are associated with higher recommended MI levels, as demonstrated in Fig. 5. At greater depths, the echo signal will be subject to more attenuation and higher noise power, so lower SNR is expected in those deeper regions. For these scans, with focal depths deeper than the target depths, the deeper targets benefit from the increased focal gain, likely suppressing the SNR losses typically seen at those depths. In a typical configuration with the focus set closer to the target depth, the depth dependence would likely be even more pronounced.
To test the hypothesis that frequency dependent attenuation is responsible for increasing the recommended MI at higher frequencies, the pressures associated with these MI were calculated. The expression in Equation 1 was used to calculate the peak rarefactional pressure for the recommended MI based on the transmit center frequency. In Fig. 11 the leftmost plot shows this peak pressure plotted against the harmonic receive frequency. Higher pressures are needed at the imaging depth with higher frequencies to achieve the 28 dB target SNR. What this does not account for is the loss of signal due to attenuation as echoes return to the transducer. In the center plot of Fig. 11, the peak rarefractional pressure has been converted to the estimated pressure of the echoes on receive at the transducer face, assuming an attenuation factor of 0.6 dB/cm/MHz [24]. The scale of the y-axis has been decreased by a factor of 10 to account for the lower pressures after attenuation, but the overall result is a much more even distribution of pressures, regardless of the frequency. This indicates the different attenuation at each frequency is responsible for the pressure and MI differences. Because the noise at each frequency is slightly different, the last subplot of Fig. 11 shows the peak rarefactional pressure and the receive pressures divided by their respective noise magnitude, normalized by the value at the lowest frequency. To reach 28 dB SNR, the pressure received at the transducer face relative to the noise magnitude is approximately equivalent in all cases, again showing consistent signal characteristics after adjusting for differences due to attenuation.
Fig. 11:
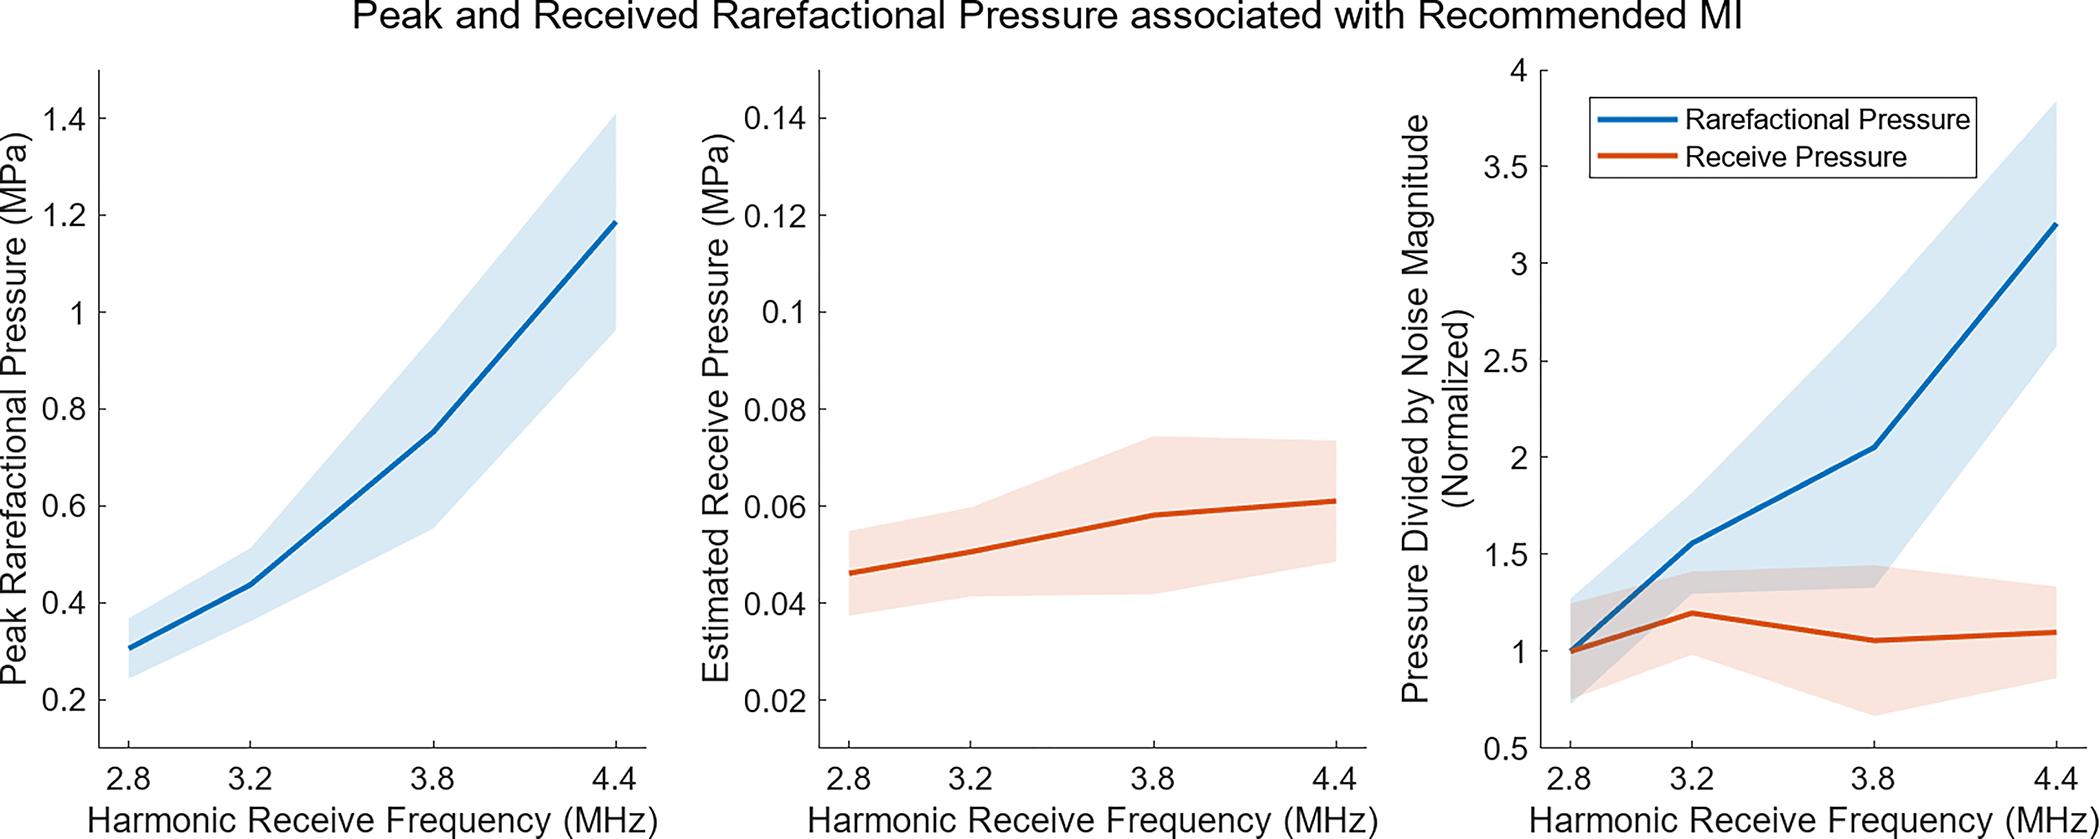
Analysis of pressures at the recommended MI, showing the average (solid line) and standard deviation (shaded region) across the 2 repeats in all 11 volunteers. On the left, the peak rarefactional pressure is calculated based on the equation for MI. In the center, the rarefractional pressure is shown after propagation back to the transducer, assuming an attenuation factor of 0.6 dB/cm/MHz. On the right, the result of dividing the pressures by the noise magnitude at each frequency is shown. Accounting for differences in attenuation when calculating receive pressure almost entirely eliminates and explains the frequency dependence associated with the recommended MI.
Given the spatially-varying MI required to reach the noise perception threshold SNR, properly delineating the target region is necessary to achieve the expected level of imaging performance. For the study demonstrated here, the ROI was laterally centered and positioned at the abdomen target depth. This left the sonographer responsible for positioning the probe so this box overlaid the target. This method is unrealistic for a clinical setting, as this manual intervention and the constraints it places on target locations would likely impair sonographers. An additional drawback of having the fixed ROI size and location is that the acoustic output is only optimized for the particular areas lying within the ROI box. For the particular example in Fig. 1, similar SNR are seen throughout the fetal tissue region, so generally good imaging can be expected across the fetus, but this is not necessarily true for all imaging targets or views. A more practical method for choosing a ROI would employ automatic selection of a complete tissue or target region, so the MI update would incorporate information from the entire region. An added benefit of this approach would be a tool more robust in the presence of motion, likely leading to less SNR variation and fewer required MI updates. Target ROI regions could be automatically selected by recognizing tissue regions, as in [25] using the speckle SNR and signal brightness. Alternatively, automated computer vision and segmentation approaches are becoming increasingly advanced and could possibly be used for structure identification and ROI selection [26].
With a relatively simple target and an experienced sonographer, measurements of SNR and recommended MI levels were largely consistent. If either of these factors changed, increased variability could occur. The average 1.1% variation in recommended MI when using different sets of consecutively collected frames translates to an average absolute MI shift of just 0.0021. The 14% average shift in recommended MI between repeat acquisitions done approximately 2 minutes apart is equivalent to an MI difference of 0.029. These minor changes in the recommended MI result from varying SNR levels between measurements. The random nature of noise and unavoidable target or transducer motion likely are the source of these SNR variations. Much larger variation is observed when comparing recommended MI levels across the volunteer sample set. With a difference of at least a factor of two between the lowest and highest MIs at each frequency, these data show failing to update the acoustic output between individuals would lead to cases with either sub-par imaging conditions or excess acoustic output that does contribute to observable noise reduction.
A significant advantage of this adaptive output selection approach is that it is highly customizable. While the default here was achieving median SNR in the region of interest of 28 dB SNR, Fig. 6 and Fig. 7 show that different SNR thresholds and different degrees of adherence to those thresholds can be used, with the only difference being a shift in the recommended MI distribution. Both these factors could be saved as global system variables a sonographer or clinic can modify on their systems until they are satisfied and confident in the results produced. As the figures show, even if a high SNR threshold were desired or near-complete adherence to that threshold in the ROI, the recommended MI levels are still much lower than levels typically encountered in clinical environments using typical default MI settings.
B. Adaptive MI Adjustment
During the 20-second adaptive imaging period, SNR varied considerably at various points. However, as the stationary imaging case shows in Fig. 8, periods of relatively stable SNR do occur. These stable SNR levels are associated with minimal variation in the recommended MI. However, as the stationary imaging environment is replaced with a moving condition, SNR varies considerably more. This would be expected, as movement results in different regions overlapping the SNR calculation box. As these different regions will vary in their echogenicity, the SNR measurement varies accordingly. However, even in the presence of such motion, Fig. 10 shows that most SNR evaluations were still within targeted imaging conditions. While this proportion of evaluation outcomes might not change with a system that performs MI updates more quickly, such a system would spend less time outside the target range. As indicated earlier, an automatic ROI selection scheme could also address in-plane motion, repositioning the SNR calculation box to overlap the same image target. Elevation motion could not be addressed in this way, but MI updates in the presence of elevation motion would allow the system to adjust to the new imaging view.
Improving the MI-selection method on the system could significantly improve the operational performance. When MI was changing during the adaptive process, slight brightness variation was observed as the power level switched to new levels. These brightness variations did not noticeably impair the sonographer or detract from their scanning and target-locating task. In a commercial tool, automatic brightness level adjustment to maintain consistent displayed echo magnitude or image histogram matching could reduce the visual impact of the MI adjustments. Further, a more targeted and flexible acoustic output adjustment approach could lead to fewer necessary MI adjustments. With finer steps of acoustic output, the system would be able to better target the desired SNR level without having the issue of overshooting. Given that in the target SNR region, each step in MI varies the SNR by 3.6 dB, taking acoustic power steps three times smaller would result in SNR adjustments on the order of 1 dB. With smaller steps, many of the “Overshoot Target” cases of Fig. 10 could be avoided, leading to fewer secondary adjustments and more time at the target SNR.
A downside of decreasing the MI adjustment step size would be an increase in undershooting of the target, where the adjustment isn’t large enough to reach the desired SNR. This could be fixed by switching to an adjustment scheme that uses prior information from a phantom sweep or previous updates to determine the expected SNR change for each step, and then takes multiple MI steps at once to reach the target. The proven Proportional-Integral-Derivative (PID) control approach could used to increase the system stability as the MI adjusts to the changing SNR conditions. Additional improvement in the MI adjustment process could come from incorporating the temporal history of the calculated SNR into the adjustment algorithm. Being less sensitive to minor fluctuations in SNR could ensure updates occur only when a new imaging view has been settled on. As a related consideration, during periods of highly variable SNR, likely associated with changing imaging views or scanning for new targets, the MI could be frozen to ensure it is not unnecessarily reacting to what are likely extremely temporary views.
The SNR calculated here followed a conventional focusing scheme, but alternative beamforming approaches are becoming increasingly common. The noise mapping temporal SNR method and noise perception adaptive output adjustment methods demonstrated here can still be applied in these alternative beamforming environments. As previously mentioned, typically the ACUSON Sequoia system employs synthetic focusing, combining information from multiple transmits to create a more fully-focused image. If the same steps for forming synthetically focused image frame are followed to create the null-transmit noise frame, the same Eq. 5 could be used to calculate the SNR. Alternative beamforming strategies based on plane wave or diverging wave transmissions could again use the noise frame approach to calculate SNR. For these unfocused imaging modes, MI is a less relevant output metric, as lower pressures are encountered. Instead, the TI metric could be recommended following the adaptive approach, as consideration of the temperature rise associated with the many transmissions needed for these approaches is likely more applicable. Despite TI not being the primary metric considered in this work due to the focused beam configuration, the lower recommended outputs seen in this study would also result in reduced TI for these imaging cases. Any beamforming method that is used will still result in speckle across the field of view. Therefore, regardless of the imaging configuration, the 28 dB SNR target is likely still relevant, as this threshold was based on the perceptibility of noise in an ultrasound field with a speckle background.
While the same imaging settings were used throughout the adaptive adjustment experiment, the SNR calculation and MI adjustment process could be modified to account for any mid-scan changes to the system settings. For example, if the time-gain compensation or gain offset were adjusted, these settings would affect the SNR. Triggering automatic acquisition of new noise frames with each parameter change would ensure relevant electronic noise levels are captured and used for the SNR calculation, resolving this potential concern.
Regardless of the beamforming method or acquisition settings, post-processing of the displayed image can also impact the SNR. For example, employing spatial smoothing or temporal averaging (often termed “Persistence”) would increase the SNR above the pre-processed level calculated here. The same processing could be applied to the noise map, for example by averaging the same number of noise frames, and the SNR could still be calculated. With regards to the adaptive output selection process, the level of noise reduction associated with the processing steps could be determined so a lower SNR than the 28 dB perception threshold could be targeted in the pre-processed data. Later in the data pipeline, the processing steps would elevate the displayed image data to the threshold level. Following the result in Fig. 6, this approach would effectively lower the MI recommended for imaging as less acoustic power would be needed to reach the lower SNR targets.
Many implementation choices related to the ROI selection scheme, update frequency, and the targeted noise parameters could be made. Given that the MI recommended by the adaptive process is always relatively low, 0.4 MI or less, one hypothetical takeaway is that ultrasound system manufacturers should simply decrease default output levels to that mark, and avoid the adaptive process altogether. While this is a reasonable consideration, it neglects to take into account the still-sizable MI decreases that can be further realized with adaptive adjustment, especially at low frequency. In addition, it assumes noise conditions would never get worse than those seen in this study. Environmental noise levels can vary, and more challenging imaging targets at greater depths or located behind highly echogenic structures would likely need higher MI than the test cases examined here. Having a system that can automatically recognize high noise levels and compensate by switching to higher MI, while still using low MI in less noisy cases hopefully encourages the implementation and use of these adaptive acoustic output strategies.
VI. Conclusions
Acoustic output adjustment and ALARA observance has become increasingly possible in modern ultrasound systems as noise levels improve. In this work, high temporal SNR imaging was demonstrated on a clinical system during fetal scanning. Furthermore, it was shown that relatively low MI output levels, often between 0.1–0.3 MI, reach the noise perceptibility threshold, the SNR where noise is low enough that it cannot be observed. By calculating the temporal SNR during live scanning and adjusting MI to reach the noise perception SNR, real-time acoustic output selection was performed, automatically enforcing the ALARA principle. By incorporating the minor discussed modifications to the method, this promising technique could see even further increased clinical and commercial viability. Altogether, this real-time acoustic output adjustment method is relatively straightforward to implement, results in improved ultrasound safety through lower MI, and adjusts those MI to maintain stable image quality levels while following ALARA guidance.
Supplementary Material
Funding and Acknowledgments:
This research was supported by the National Institute of Biomedical Imaging and Bioengineering through grants R01-EB017711 and R01-EB026574 and the National Science Foundation Graduate Research Fellowship Program through grant DGE 2139754. Any opinions, findings, and conclusions or recommendations expressed are those of the authors and do not necessarily reflect the views of the National Institutes of Health or the National Science Foundation.
This work involved human subjects in its research. Approval of all ethical and experimental procedures and protocols was granted by the Duke Health Institutional Review Board under Application No. Pro00038307.
The authors would like to thank Siemens Medical Solutions USA, Inc. for in-kind research support.
References
- 1.Harvey CJ, Pilcher JM, Eckersley RJ, Blomley MJK, and Cosgrove DO, “Advances in ultrasound,” Clin. Radiol, vol. 57, no. 3, pp. 157–177, Mar. 2002. [DOI] [PubMed] [Google Scholar]
- 2.Contreras Ortiz SH, Chiu T, and Fox MD, “Ultrasound image enhancement: A review,” Biomed. Signal Process. Control, vol. 7, no. 5, pp. 419–428, Sep. 2012. [Google Scholar]
- 3.Deng Y, Palmeri ML, Rouze NC, Trahey GE, Haystead CM, and Nightingale KR, “Quantifying image quality improvement using elevated acoustic output in B-mode harmonic imaging,” Ultrasound Med. Biol, vol. 43, no. 10, pp. 2416–2425, Oct. 2017. [DOI] [PMC free article] [PubMed] [Google Scholar]
- 4.Marketing Clearance of Diagnostic Ultrasound Systems and Transducers: Guidance for Industry and Food and Drug Administration Staff, U.S. Food Drug Admin., Rockville, MD, USA, 2023. [Google Scholar]
- 5.Medical Ultrasound Safety, 3rd ed., Amer. Inst. Ultrasound Med., Laurel, MD, USA, 2014. [Google Scholar]
- 6.Carstensen EL, “Acoustic cavitation and the safety of diagnostic ultrasound,” Ultrasound Med. Biol, vol. 13, no. 10, pp. 597–606, Oct. 1987. [DOI] [PubMed] [Google Scholar]
- 7.Apfel RE and Holland CK, “Gauging the likelihood of cavitation from short-pulse, low-duty cycle diagnostic ultrasound,” Ultrasound Med. Biol, vol. 17, no. 2, pp. 179–185, Jan. 1991. [DOI] [PubMed] [Google Scholar]
- 8.Hocevar Z, Rozman J, Paska AV, Frangez R, Vaupotic T, and Hudler P, “Gene expression profiling of rat fetuses exposed to 2-dimensional ultrasound,” J. Ultrasound Med, vol. 31, no. 6, pp. 923–932, Jun. 2012. [DOI] [PubMed] [Google Scholar]
- 9.Suresh R, Ramesh Rao T, Davis EM, Ovchinnikov N, and Rae AM, “Effect of diagnostic ultrasound during the fetal period on learning and memory in mice,” Ann. Anatomy-Anatomischer Anzeiger, vol. 190, no. 1, pp. 37–45, Feb. 2008. [DOI] [PubMed] [Google Scholar]
- 10.Schneider-Kolsky ME, Ayobi Z, Lombardo P, Brown D, Kedang B, and Gibbs ME, “Ultrasound exposure of the foetal chick brain: Effects on learning and memory,” Int. J. Develop. Neurosci, vol. 27, no. 7, pp. 677–683, Nov. 2009. [DOI] [PubMed] [Google Scholar]
- 11.Drukker L, Droste R, Chatelain P, Noble JA, and Papageorghiou AT, “Safety indices of ultrasound: Adherence to recommendations and awareness during routine obstetric ultrasound scanning,” Ultraschall der Medizin-Eur. J. Ultrasound, vol. 41, no. 2, pp. 138–145, Apr. 2020. [DOI] [PubMed] [Google Scholar]
- 12.Houston LE, Allsworth J, and Macones GA, “Ultrasound is safe. Right? Resident and maternal-fetal medicine fellow knowledge regarding obstetric ultrasound safety,” J. Ultrasound Med, vol. 30, no. 1, pp. 21–27, Jan. 2011. [DOI] [PubMed] [Google Scholar]
- 13.Long W, Bottenus N, and Trahey GE, “Lag-one coherence as a metric for ultrasonic image quality,” IEEE Trans. Ultrason., Ferroelectr., Freq. Control, vol. 65, no. 10, pp. 1768–1780, Oct. 2018. [DOI] [PMC free article] [PubMed] [Google Scholar]
- 14.Flint K, Bottenus N, Bradway D, McNally P, Ellestad S, and Trahey G, “An automated ALARA method for ultrasound: An obstetric ultrasound feasibility study,” J. Ultrasound Med, vol. 40, no. 9, pp. 1863–1877, Sep. 2021. [DOI] [PMC free article] [PubMed] [Google Scholar]
- 15.Trahey G, “Properties of acoustical speckle in the presence of phase aberration Part I: First order statistics,” Ultrason. Imag, vol. 10, no. 1, pp. 12–28, Jan. 1988. [DOI] [PubMed] [Google Scholar]
- 16.Lediju MA, Pihl MJ, Dahl JJ, and Trahey GE, “Quantitative assessment of the magnitude, impact and spatial extent of ultrasonic clutter,” Ultrason. Imag, vol. 30, no. 3, pp. 151–168, Jul. 2008. [DOI] [PMC free article] [PubMed] [Google Scholar]
- 17.Pinton GF, Trahey GE, and Dahl JJ, “Sources of image degradation in fundamental and harmonic ultrasound imaging using nonlinear, full wave simulations,” IEEE Trans. Ultrason., Ferroelectr., Freq. Control, vol. 58, no. 4, pp. 754–765, Apr. 2011. [DOI] [PMC free article] [PubMed] [Google Scholar]
- 18.Pettai R, Noise in Receiving Systems. Hoboken, NJ, USA: Wiley, 1984. [Google Scholar]
- 19.Huber MT, Flint KM, McNally PJ, Ellestad SC, and Trahey GE, “Human observer sensitivity to temporal noise during B-mode ultra sound scanning: Characterization and imaging implications,” Ultrason. Imag, vol. 46, no. 3, pp. 151–163, May 2024. [DOI] [PMC free article] [PubMed] [Google Scholar]
- 20.Vienneau EP, Ozgun KA, and Byram BC, “Spatiotemporal coherence to quantify sources of image degradation in ultrasonic imaging,” IEEE Trans. Ultrason., Ferroelectr., Freq. Control, vol. 69, no. 4, pp. 1337–1352, Apr. 2022. [DOI] [PMC free article] [PubMed] [Google Scholar]
- 21.Friemel BH, Bohs LN, Nightingale KR, and Trahey GE, “Speckle decorrelation due to two-dimensional flow gradients,” IEEE Trans. Ultrason., Ferroelectr., Freq. Control, vol. 45, no. 2, pp. 317–327, Mar. 1998, doi: 10.1109/58.660142. [DOI] [PubMed] [Google Scholar]
- 22.Huber M, Flint K, and Trahey G, “An adaptive acoustic output selection method feasible for implementation on existing clinical systems,” in Proc. IEEE Int. Ultrason. Symp. (IUS), Oct. 2022, pp. 1–4. [Google Scholar]
- 23.Loftman R, “In focus coherent technology,” Siemens Med. Solutions, Mountain View, CA, USA, Tech. Rep. 4374 0217, 2017. [Google Scholar]
- 24.Szabo TL, “Table B.1 properties of tissues,” in Diagnostic Ultrasound Imaging: Inside Out, 2nd ed. New York, NY, USA: Academic, 2014, p. 785. [Google Scholar]
- 25.Flint KM, Barré EC, Huber MT, McNally PJ, Ellestad SC, and Trahey GE, “An automated region-selection method for adaptive ALARA ultrasound imaging,” IEEE Trans. Ultrason., Ferroelectr., Freq. Control, vol. 69, no. 7, pp. 2257–2269, Jul. 2022. [DOI] [PMC free article] [PubMed] [Google Scholar]
- 26.Meiburger KM, Acharya UR, and Molinari F, “Automated localization and segmentation techniques for B-mode ultrasound images: A review,” Comput. Biol. Med, vol. 92, pp. 210–235, Jan. 2018. [DOI] [PubMed] [Google Scholar]
Associated Data
This section collects any data citations, data availability statements, or supplementary materials included in this article.


