

Abstract
The prevalence and relative disparities of mental health outcomes and well-being indicators are often inconsistent across studies of sexual minority men (SMM) due to selection biases in community-based surveys (nonprobability sample), as well as misclassification biases in population-based surveys where some SMM often conceal their sexual orientation identities. The present study estimated the prevalence of mental health related outcomes (depressive symptoms, mental health service use, anxiety) and well-being indicators (loneliness and self-rated mental health) among SMM, broken down by sexual orientation using the adjusted logistic propensity score (ALP) weighting. We applied the ALP to correct for selection biases in the 2019 Sex Now data (a community-based survey of SMMs in Canada) by reweighting it to the 2015-2018 Canadian Community Health Survey (a population survey from Statistics Canada). For all SMMs, the ALP-weighted prevalence of depressive symptoms was 15.96% (95% CI, 11.36%-23.83%), while for mental health service use, it was 32.13% (95% CI, 26.09%-41.20%). The ALP estimates lie in between the crude estimates from the two surveys. This method was successful in providing a more accurate estimate than relying on results from one survey alone. We recommend to the use of ALP on other minority populations under certain assumptions.
This article is part of a Special Collection on Mental Health.
Keywords: mental health, depressive symptoms, propensity scores, sexual orientation, LGBTQ+, measurement bias, selection bias, health services
Introduction
There have been inconsistent findings in the prevalence and relative disparities of mental health and well-being indicators among by sexual minority men (SMM; often also referred to as gay, bisexual, and other men who have sex with men [MSM]). Systematic reviews and population studies have shown that gay men were more likely to report a history of anxiety, mood disorders, and poorer self-rated mental health compared with heterosexual men; this prevalence was even higher for bisexual men.1-5 However, a few population studies have shown no significant differences in major depressive disorders (in the previous 12 months and in lifetime) between gay men and heterosexuals, while bisexuals consistently experienced poorer mental health compared with heterosexuals.6-8
Furthermore, there have been increasing concerns over a loneliness epidemic and worsening self-rated mental health (SRMH) over the past few years,9-11 particularly among marginalized groups such as SMMs.12-14 The prevalence of loneliness and self-rated mental health from population data among SMMs are lacking; these were often obtained from community surveys with a nonprobability sample and no heterosexual comparison. These well-being measures are separate from mental health15; SRMH might be an indicator of mental health and overall well-being, which is more than the mere absence of mental illness. Mental health also includes the ability to cope and adapt to life, maintain meaningful relationships, and a sense of purpose in life.15 Having poor well-being may not necessitate the need to seek mental health services.
Variability is also observed for mental health service utilization (MHSU) among SMMs.16 While there appear to be mixed patterns and magnitudes across studies, a recent systematic review concluded that SMMs are more likely to seek mental health services both in Canada and the United States compared with heterosexual men.3,16,17 This pattern has been considered paradoxical by some researchers,16 as these higher MHSU occurred in spite of historical barriers facing SMMs who may report negative health care experience, including forms of conversion therapy or other unaffirming care practices.18
These discrepancies and imprecise results are potentially attributed to the different types of data used to generate the mental health related estimates among SMMs. When using population-based data, misclassification bias might occur as some SMMs occasionally conceal their sexual minority identities in these surveys, owing to pervasive stigma. Although many recent population surveys have expanded the scope of sexual orientation beyond a single item identity-based question, some research still relies on an identity-based question alone.19 Even among SMMs who do endorse a sexual minority identity, community-based surveys have shown that up to 20% of gay men and 40% of bisexual men reported that they would choose to conceal their orientation in a government survey.20 On the other hand, relying on a community-based survey that was targeted towards SMMs may remedy these misclassification biases, but it introduces increased potential for selection or sampling bias due to the nonprobabilistic nature of the surveys. They are more likely to reach SMMs who are connected to other SMMs and may not represent the entire SMM population.21-23
To our knowledge, studies often only use one of these datasets, leading to the imprecise results in estimates. Other than a simple quantitative bias analysis, few studies have combined information from these two types of datasets to obtain a more informed estimate.
The goal of the present study is to provide a more accurate prevalence estimates of mental health and well-being indicators (including depressive symptoms, anxiety, self-rated mental health, loneliness, and mental health service use) among SMM by recalibrating a community-based SMM study sample using a population-based sample. This may generate further insight into the complex relationship between mental health, well-being, and service use among SMMs.
Methods
Data source
The present study is a secondary analysis of two sets of cross-sectional Canadian data. The first is the Canadian Community Health Survey (CCHS), an annual population health-related survey by Statistics Canada that employs a probability-based multistage sampling of Canadians across all provinces and territories. It represents about 97% of the Canadian population with a few exclusions (see the Statistics Canada website for more details).24 Participation was voluntary with multistage stratified sampling; participants were weighted by Statistics Canada based on the census to ensure representation of the Canadian population. For this analysis, we combined the CCHS 2015-2018 cycles to maximize sample size, which is a common practice with CCHS data.25 All adult men (18 years old or older) with a response on the sexual orientation questions and relevant covariates in this study were included in the analysis. For this analysis, we used the Public Use Microdata Files (PUMF) version of the CCHS, where the granularities of some variables were suppressed for confidentiality.26
The second dataset is the Sex Now data, a Canada-wide community-based survey for SMM from the Community Based Research Center (CBRC).27 Inclusion criteria required participants to: (1) identify as men or nonbinary, and (2) identify with a sexual minority identity OR have had sex with men in the past 5 years, regardless of their sexual identity. This analysis used the Sex Now 2019 data,27 where participants were all recruited online from social media sites, dating apps, porn websites, or existing networks of community agencies serving SMMs. Additional study information can be found in past publications.28 To make the data consistent with the CCHS, we included every Sex Now participants with relevant covariates who were aged 18 years old or older. This analysis received approval from the University of Toronto Research Ethics Board (#42771).
Measures
Sexual orientation
From 2015 to 2018, the CCHS elicited sexual orientation identities with the options of “heterosexual,” “homosexual (that is lesbian gay),” or “bisexual.” In the 2015/2016 CCHS cycle, the CCHS also asked a question about the gender of their sexual partner in the previous 12 months, which can be used to ascertain MSMs beyond just their sexual identities.19 Hence, we classified men from the CCHS as: (1) heterosexual (identified as heterosexual and have not had sex with men), (2) gay, (3) bisexual, (4) other MSMs (who reported sex with men but did not identify as gay or bisexual).
In Sex Now, respondents can select more than one sexual identity (see Supplementary Table S1 for details). There were only a few participants who selected both gay and bisexual (5%); to harmonize with the CCHS participants, we classified them in a way that prioritizes the least common categories among SMMs. Any men in Sex Now who identified as straight or heteroflexible, regardless of any other options selected, were analyzed as other MSMs. If they did not choose straight or heteroflexible, yet identified as bisexual, queer, or pansexual, they were analyzed as bisexual (plurisexual). Finally, those who chose gay only were analyzed as gay.
In Sex Now, participants were asked to rate how would they reveal their sexual orientation in a Statistics Canada survey on scale of 1 (very likely) to 4 (very unlikely); we dichotomized these where a score of 3 or 4 were classified as unwilling to disclose.
Outcomes
Depressive symptoms and anxiety were measured by the Patient Health Questionnaire (PHQ)-4 in the Sex Now questionnaire, a brief 4-item measurement that consists of 2 scales: 1) the PHQ-2, a measure of depressive symptoms, and 2) the Generalized Anxiety Disorder (GAD)-2, a measure of anxiety symptoms.29 A score of 3 or higher on the PHQ-2 was considered to indicate depressive symptoms; the same threshold was used for the GAD-2 to determine anxiety symptoms30,31; these measures have been validated among SMM.30 Anxiety was not available in the CCHS, but depressive symptoms was asked about using the PHQ-9, a longer version of the PHQ-4, with a score of 10 or higher used as the cutoff.30,32 Note that the depressive symptoms measure was not mandatory every year in the CCHS.
To assess MHSU, in Sex Now, participants were asked “In the PAST YEAR, which of the following resources have you gone to? (check all that apply)” The full list includes different types of health professionals and elders, which can be found in Supplementary Table S1. In CCHS, participants were asked “In the past 12 months, that is, from [date one year ago] to yesterday, have you seen or talked to a health professional about your emotional or mental health?” This question is asked annually in the CCHS.
In both CCHS and Sex Now, SRMH is measured by a single item self-assessment question, “In general, how would you say your mental health is?” with options of excellent, very good, good, fair, or poor. We dichotomized the outcome where those who responded as fair or poor SRMH were considered to have poor SRMH. This question is asked annually in the CCHS.
Loneliness was asked about only in the Sex Now survey, which came from the validated and shortened UCLA Loneliness Scale, which has 3 items, with a maximum score of 9.33,34 There is no established cutoff for loneliness. Hence, we classified those who scored higher than 6 points as lonely based on the data distribution; we also considered the average mean scores.
Statistics Canada provides carefully calibrated population weights in the CCHS to represent the sampling frame of the entire Canadian population; this includes weights for potential nonresponse biases. Bootstrap weights were also provided from Statistics Canada to calculate the variance.35 These weights were divided by the number of cycles included in CCHS analysis when combining multiple CCHS cycles, as recommended by Statistics Canada.25
Variables common in both surveys were used to recalibrate the data (Supplementary Table S1). This includes demographic variables (eg, age, rurality, ethnicity, employment), substance use (illicit drug use, alcohol use, cigarette use), health factors (eg, having a primary health care provider, employment), among others.
Statistical analysis
To reweight the community-based survey Sex Now to a population-based sample from the CCHS, we used the adjusted logistic propensity (ALP) method. The ALP weighting has been shown to successfully recalibrate volunteer-based cohorts to a more representative population survey in both theory and simulation studies (see previous publications for details).36,37 Using a weighted logistic regression, we calculated the probability of participating in the Sex Now survey compared with the CCHS using the full Sex Now data and SMM-identified sample in CCHS. Each Sex Now participant was given a weight of 1, while the CCHS participants were given their assigned Statistics Canada weights. The pseudoweight for the Sex Now participants was the sampling rate to the Sex Now, calculated as (1 − pi)/pi, where pi is the probability of the ith person responding to the Sex Now survey, calculated from the weighted logistic regression. Applying these pseudoweights recalibrated the Sex Now sample to have the same distribution of covariates as the CCHS sample, approximating the sample distribution that would have been obtained had the Sex Now sample followed rigorous multistage sampling of the CCHS survey.
The list of covariates initially entered into the model are all the variables common to both surveys (Table S1). We used a data-driven approach rather than a theory, model-based approach to identify the best sets of covariates that balanced the two surveys. The data-driven approach involved fitting multiple logistic regression models on different sets of potential covariates and comparing the distributions of the covariates between the final reweighted community sample with the population sample using standardized mean difference (SMD). We used SMDs ≤ 0.1 as the threshold for an acceptable balance between covariates.38 The list of covariates that gives the best balance between the covariates as measured by the SMDs was chosen as the final model to produce the ALP weights (see Appendix S1). Figure 1 summarizes the step-by-step iterative process of how the weights were determined in this analysis.
Figure 1.

Step-by-step illustration of reweighting a community-based sample of sexual minority men to a population-based sample using the adjusted logistic propensity method (ALP) and an iterative data-driven approach. Note: The data-driven approach of finding the most appropriate model is not part of the ALP method. This iterative process of examining the SMDs between two groups is a method commonly used when assessing balance between two groups with propensity score analyses. CCHS, Canadian Community Health Survey, SMD, standardized mean difference.
Our analyses stratified the results based on sexual identities, (gay, bisexuals, and other MSM), as they were known to have different disclosure rates.20 Gay men in Sex Now were calibrated to gay identifying men in the CCHS, all other SMMs from Sex Now were calibrated to the full subsample of SMMs identified from the CCHS. To calculate the variance and 95% CI, we combined the default bootstrap weights from CCHS and bootstrapped pseudoweights from the Sex Now data (see Appendix S1).35 All analyses were done using R 4.2.3 (see Appendix S2 or first author’s GitHub page, linked in the Data Availability statement). We used the package survey to calculate the ALP weights.39
Results
Participant characteristics in both surveys
There was a total of 1057 participants (weighted n = 360 687.4) reporting as SMM in the 2015-2018 CCHS cycles. Combined with 5630 participants in Sex Now, there were 6687 participants used to create the ALP weights (see Figure 2).
Figure 2.
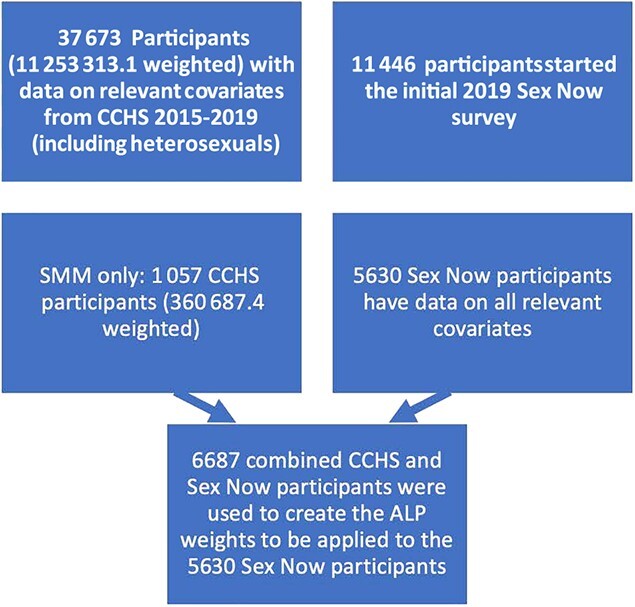
Flow diagram of study participants at different stages of the analysis. ALP, adjusted logistic propensity; CCHS, Canadian Community Health Survey; SMM, sexual minority men.
Using the data-driven approach described in the methods section, we tested multiple model variations to determine the final model that provides the best balance on all relevant covariates38 (SMDs ≤ 0.1; Table 1). The final model includes main effects of age groups, a quadratic age term, annual income, smoking status, education, illicit drug use (including marijuana), employment, alcohol use, province, rurality, ethnicity, existing mental health problems, immigration status, terms for interaction between age group and income, and age group and employment.
Table 1.
Demographic of adjusted logistic propensity–weighted Sex Now participants compared with unweighted sex now (2019) and survey-weighted Canadian Community Health Survey participantsa (2015-2018), Canada.
| All SMM b | No. (%) | |||
|---|---|---|---|---|
| Unweighted sex now (n = 5630) | Weighted CCHS (weighted n = 180343.7) | ALP-weighted sex now (weighted n = 194277.3) | SMD (CCHS vs ALP-weighted sex now) | |
| Age categories, meanc | 40-44 | 40-44 | 40-44 | 0.062 |
| 18-19 | 94 (1.7) | 5050.2 (2.8) | 1177.5 (0.6) | |
| 20-24 | 678 (12.0) | 22 745.5 (12.6) | 14 925.8 (7.7) | |
| 25-29 | 1037 (18.4) | 29016.7 (16.1) | 29 048.9 (15.0) | |
| 30-34 | 920 (16.3) | 17 668.0 (9.8) | 28 034.4 (14.4) | |
| 35-39 | 676 (12.0) | 12 815.9 (7.1) | 22 303.0 (11.5) | |
| 40-44 | 508 (9.0) | 13 681.0 (7.6) | 17 245.1 (8.9) | |
| 45-49 | 356 (6.3) | 13 830.1 (7.7) | 12 478.4 (6.4) | |
| 50-54 | 405 (7.2) | 18 070.5 (10.0) | 16 070.2 (8.3) | |
| 55-59 | 469 (8.3) | 17 182.8 (9.5) | 18 982.5 (9.8) | |
| 60-64 | 231 (4.1) | 12 461.5 (6.9) | 12334.4 (6.3) | |
| 65-69 | 145 (2.6) | 9102.8 (5.0) | 10 532.8 (5.4) | |
| 70-74 | 84 (1.5) | 4580.3 (2.5) | 8109.8 (4.2) | |
| 75-79 | 24 (0.4) | 1911.9 (1.1) | 2825.2 (1.5) | |
| ≥80 | 3 (0.1) | 2226.6 (1.2) | 209.3 (0.1) | |
| Residence rurality (% non–urban areas) | 1515 (26.9) | 27 868.8 (15.5) | 30 922.6 (15.9) | 0.013 |
| Ethnicity (% non-White) | 1102 (19.6) | 28 463.2 (15.8) | 26 425.9 (13.6) | 0.062 |
| Immigration | 0.039 | |||
| Canadian born | 4720 (83.8) | 150 320.6 (83.4) | 164 682.9 (84.8) | |
| < 10 years | 423 (7.5) | 13 007.6 (7.2) | 12 586.1 (6.5) | |
| ≥ 10 years | 487 (8.7) | 17 015.5 (9.4) | 17 008.4 (8.8) | |
| Existing mental health problems | 1496 (26.6) | 33 561.7 (18.6) | 34 301.3 (17.7) | 0.025 |
| Alcohol use (≥ 5 times in one occasion) | 3254 (57.8) | 114 138.2 (63.3) | 126 348.6 (65.0) | 0.036 |
| Tobacco use | 1334 (23.7) | 46 038.2 (25.5) | 51 009.7 (26.3) | 0.017 |
| Any illicit drugs | 3009 (53.4) | 48 325.3 (26.8) | 47 639.3 (24.5) | 0.052 |
| Have a primary care provider | 4461 (79.2) | 142 311.6 (78.9) | 154 083.3 (79.3) | 0.01 |
| Employment | 0.119 | |||
| Full time | 3390 (60.2) | 90 061.3 (49.9) | 100 836.1 (51.9) | |
| Part time, student, or self-employed | 1600 (28.4) | 43 026.5 (23.9) | 37 083.1 (19.1) | |
| Retired or unemployed | 640 (11.4) | 47 256.0 (26.2) | 56 358.1 (29.0) | |
| Income deciles (1-10 bases on national estimates) | 4.75 (3.07) | 5.69 (2.89) | 5.89 (3.22) | 0.065 |
| Education | 0.022 | |||
| Less than high school | 127 (2.3) | 9728.1 (5.4) | 11 275.6 (5.8) | |
| High school graduate | 938 (16.7) | 47 287.4 (26.2) | 49 633.2 (25.5) | |
| Postsecondary or higher | 4565 (81.1) | 123 328.2 (68.4) | 133 368.6 (68.6) | |
| Province | 0.036 | |||
| Atlantic Canada | 456 (8.1) | 9289.5 (5.2) | 10 624.9 (5.5) | |
| Central Canada | 2943 (52.3) | 127 747.8 (70.8) | 137 799.6 (70.9) | |
| Northern Canada and Territories | 30 (0.5) | 0.0 (0.0) | 0.0 (0.0) | |
| Prairies | 1198 (21.3) | 22 399.1 (12.4) | 25 225.4 (13.0) | |
| Western Canada | 1003 (17.8) | 20 907.3 (11.6) | 20 627.4 (10.6) | |
| Gay Men | Unweighted sex now (n = 3540) | Weighted CCHS (weighted n = 111549.9) | ALP-weighted sex now (weighted n = 113013.3) | SMD (CCHS vs ALP-weighted sex now) b |
| Age categories, meanc | 40-44 | 40-44 | 40-44 | 0.093 |
| 18-19 | 43 (1.2) | 1636.7 (1.5) | 460.1 (0.4) | |
| 20-24 | 348 (9.8) | 11 258.5 (10.1) | 5348.3 (4.7) | |
| 25-29 | 604 (17.1) | 19 612.1 (17.6) | 14 365.3 (12.7) | |
| 30-34 | 584 (16.5) | 9546.5 (8.6) | 16 689.6 (14.8) | |
| 35-39 | 448 (12.7) | 7697.1 (6.9) | 13 246.8 (11.7) | |
| 40-44 | 360 (10.2) | 8938.1 (8.0) | 11 089.5 (9.8) | |
| 45-49 | 241 (6.8) | 8185.8 (7.3) | 8135.3 (7.2) | |
| 50-54 | 264 (7.5) | 11 292.2 (10.1) | 9579.7 (8.5) | |
| 55-59 | 322 (9.1) | 13 191.7 (11.8) | 12 321.4 (10.9) | |
| 60-64 | 156 (4.4) | 8896.6 (8.0) | 7490.6 (6.6) | |
| 65-69 | 94 (2.7) | 6823.2 (6.1) | 6561.3 (5.8) | |
| 70-74 | 58 (1.6) | 3067.2 (2.7) | 5350.3 (4.7) | |
| 75-79 | 17 (0.5) | 1089.6 (1.0) | 2224.6 (2.0) | |
| ≥80 | 1 (0.0) | 314.5 (0.3) | 150.4 (0.1) | |
| Residence rurality (% non–urban areas) | 877 (24.8) | 15 227.1 (13.7) | 17 836.7 (15.8) | 0.06 |
| Ethnicity (% non-White) | 649 (18.3) | 16 823.7 (15.1) | 17 542.2 (15.5) | 0.012 |
| Immigration | 0.054 | |||
| Canadian born | 2937 (83.0) | 93 138.6 (83.5) | 92 572.9 (81.9) | |
| < 10 years | 282 (8.0) | 8806.9 (7.9) | 8955.9 (7.9) | |
| ≥ 10 years | 321 (9.1) | 9604.4 (8.6) | 11 484.4 (10.2) | |
| Existing mental health problems | 756 (21.4) | 19 474.7 (17.5) | 18 588.3 (16.4) | 0.027 |
| Alcohol use (≥ 5 times in one occasion) | 2008 (56.7) | 74 342.8 (66.6) | 70 763.6 (62.6) | 0.084 |
| Tobacco use | 766 (21.6) | 26 496.9 (23.8) | 27 283.9 (24.1) | 0.009 |
| Any illicit drugs | 1786 (50.5) | 27 639.7 (24.8) | 27 898.8 (24.7) | 0.002 |
| Have a primary care provider | 2817 (79.6) | 89 258.6 (80.0) | 92 035.4 (81.4) | 0.036 |
| Employment | 0.099 | |||
| Full time | 2236 (63.2) | 61 846.8 (55.4) | 59 985.6 (53.1) | |
| Part time, student, or self-employed | 897 (25.3) | 24 348.0 (21.8) | 22 577.9 (20.0) | |
| Retired or unemployed | 407 (11.5) | 25 355.0 (22.7) | 30 449.7 (26.9) | |
| Income deciles (1-10 bases on national estimates) | 5.06 (3.09) | 5.84 (2.93) | 5.88 (3.17) | 0.014 |
| Education | 0.073 | |||
| Less than high school | 53 (1.5) | 3876.6 (3.5) | 5490.5 (4.9) | |
| High school graduate | 502 (14.2) | 23 573.8 (21.1) | 22 562.5 (20.0) | |
| Postsecondary or higher | 2985 (84.3) | 84 099.5 (75.4) | 84 960.4 (75.2) | |
| Province | 0.047 | |||
| Atlantic Canada | 274 (7.7) | 5171.0 (4.6) | 5493.0 (4.9) | |
| Central Canada | 1962 (55.4) | 81 541.1 (73.1) | 80 561.5 (71.3) | |
| Northern Canada and Territories | 15 (0.4) | 0.0 (0.0) | 0.0 (0.0) | |
| Prairies | 670 (18.9) | 10995.1 (9.9) | 12 611.2 (11.2) | |
| Western Canada | 619 (17.5) | 13842.7 (12.4) | 14 347.6 (12.7) | |
Abbreviations: ALP, adjusted logistic propensity; CCHS, Canadian Community Health Survey; SMD, standardized mean difference; SMM, sexual minority men.
a The optimal model used to balance the covariates to obtain the above tables in all subgroups is as follows: Formula_fit = as.formula(“survey ~ age_grp + age_grp2 + income + smoke + education + illicit_drug + employ + smoke + alcohol + province + age_grp*income + age_grp*employ + rural + race + existing_mh + immigration”). More information can be found on the project GitHub page.
b As all bisexuals and other MSMs were standardized to all SMMs, we did not show the comparisons between bisexual men and other MSMs
c These categories were treated as a continuous variable in the ALP calculation to provide more power, but we presented the results per age category. The mean shown was calculated as the mean from the continuous age, which then converted to the age category it corresponds to. SMD calculation was based on the continuous version of this variable.
Prior to weighting, Sex Now participants tend to be younger, non-White, have higher mental health problems, have postsecondary education, use illicit drugs, and live in Western Canada/Prairies compared with SMM in CCHS. After the ALP weighting above, the covariates were all well-balanced for all SMMs and within different sexual orientation subgroups (SMDs ≤ 0.1; Table 1).
Prevalence of depressive symptoms, anxiety, and MHSU
The crude estimate of depressive symptoms prevalence for all SMMs from the unadjusted Sex Now data was 19.0% (95% CI, 18.01%-20.10%), while the CCHS crude prevalence was 9.12% (95% CI, 3.47%-18.81%).
After applying the ALP weights with the model above, the ALP-weighted prevalence of depressive symptoms from the Sex Now data for all SMMs was 15.96% (95% CI, 11.36%-23.83%). Looking at the stratified results, the ALP-weighted estimate for gay men was 14.78% (95% CI, 10.24%-24.00%); for bisexual men, it was 18.10% (95% CI, 11.54%-25.24%), and it was 18.39% for other MSMs (95% CI 7.23%-36.20%). These estimates often fall in between the CCHS and unadjusted Sex Now estimates.
Similarly, for MHSU, the overall ALP-weighted prevalence of MHSU for all SMMs was 32.13% (95% CI, 26.09%-41.20%). More specifically by subgroup: 30.58% for gay men (95% CI, 23.1%-39.8%), 33.79% for bisexual men (95% CI, 22.22%-41.14%) and 20.34% for other MSMs (95% CI, 11.80%-30.09%).
For anxiety, the ALP-weighted prevalence for all SMMs was 18.83% (95% CI, 13.68%-27.95%), this is lower than the unweighted Sex Now prevalence of 24.36% (95% CI, 23.21%-23.45%). The ALP-weighted prevalence for anxiety was 16.87% (95% CI, 10.58%-22.30%) among gay men; among bisexual men, it was 27.83% (95% CI, 18.60%-52.35%); finally among other MSMs, it was 21.12% (95% CI, 9.90%-39.42%) (see Figure 3A, 3B, and 3D).
Figure 3.

Prevalence and 95% confidence interval of numerous mental health and well-being indicators among sexual minority men using the different methods of estimations from the 2019 Sex Now data and the Canadian Community Health Survey (CCHS 2015-2018). A table version of this figure with more details on the exact numbers, exact sample sizes for each group and outcomes can be found in Table S2.
Prevalence of poor SRMH and loneliness
The crude estimate of poor SRMH for all SMMs from the unadjusted Sex Now data was 27.51% (95% CI, 26.39%-28.66%), while the CCHS crude prevalence was 12.06% (95% CI, 6.98%-19.41%). The ALP weighted prevalence for poor SRMH among all SMMs was 20.77% (95% CI, 14.96%-30.40%), among gay men, it was 18.17% (95% CI, 12.78%-26.94%), among bisexual men, 31.90% (95% CI 21.49%-53.29%), and among other MSMs 26.89% (95% CI, 12.31%-44.04%). The CCHS-weighted estimates for poor SRMH among other SMMs particularly had a wide confidence interval (13.78%; 95% CI, 0%-52.94%), likely due to the small number of participants in the CCHS in this category.
Estimates of loneliness among all SMMs from the unadjusted Sex Now was 51.43% (95% CI, 50.05%-52.78%), while the ALP adjusted was 48.45% (95% CI, 42.12%-55.24%. ALP adjusted prevalence of loneliness among all SMMs was 48.41% (95% CI, 42.47%-59.32%), among bisexual men was 47.85% (95% CI, 32.50%-55.59%), and among other MSMs, it was 45.39% (95% CI, 30.97%-60.26%) (see Figure 3C and 3E). The mean loneliness scores can be found in the Supplementary Table S2.
Discussion
In this study, we have attempted to quantify the prevalence of mental health and other well-being indicators among SMMs that addressed specific limitations of nonprobability based samples. We found that ALP-weighted prevalence tends to lie between the survey-weighted CCHS and Sex Now unadjusted estimates. Evidence from past studies demonstrated that nonprobability samples from a community-based survey tend to overreport, whereas population surveys tend to underreport problems faced in a community.20,23 Having the adjusted estimates in the middle of these two sources appears plausible, which was also shown in past studies consolidating two sources of mental health reports from administrative data.40
One caveat of this interpretation is that depressive symptoms and MHSU were measured differently between the CCHS and Sex Now. The PHQ-2 is a less specific measure of major depression compared with the PHQ-9,41 and it is likely that it overestimated men with depression. However, as a tool to identify depressive symptoms, PHQ-2 has performed just as well as PHQ-9.41-43 Hence, we believe differences between the surveys can still be attributed primarily to sampling differences. On the other hand, it is unknown how the difference in wording of MHSU questions contribute to the difference. It is likely that the Sex Now may also overestimate the true MHSU based on the question alone as it includes elders on top of other HCPs. Caution must be taken when comparing the MHSU rates between the surveys.
As shown in previous studies, bisexual men are more likely to use mental health services, have higher mental health challenges, and overall rated their well-being to be poorer.6-8 One notable finding is the prevalence of MHSU among the other MSM group, which has rarely received attention in the past. Previously, CCHS surveys were not able to identify this group as they only had a single item question on sexual identity. Since 2015, the question has been added, but to our knowledge, nobody had used the CCHS data to look at the other MSM group specifically as the CCHS tends to have very few men in this group, rendering the survey-weighted CCHS estimates for this category uninterpretable. Population estimates of other MSMs are rare; our ALP-weighted estimate is the first attempt of getting a closer estimate of mental health and well-being that considers other MSMs in a population survey.
There is a complex association between sexual minority identity, disclosure, and mental health.44 Disclosure to friends and family (informally known as “outness”) is known to improve mental health when individuals are supported by the environment, but outness also may exacerbate mental health when they are not supported44-47; someone may experience more stigma as people know their sexual minority status. Past meta-analysis on identity concealment and mental health has been inconclusive due to the heterogeneity across studies.44 As we include individuals who are potentially undisclosed SMMs in the CCHS, some of the prevalence estimates actually decreased compared with the survey-weighted CCHS prevalence. This may indicate that being undisclosed may in fact lower mental health problems in some cases as those individuals experienced less stigma.44-47 However, another competing hypothesis is that undisclosed individuals tend to underreport any health problems in surveys and tend to avoid seeking mental health care, as shown that other MSMs were the least likely to seek mental health care, while having mental health and well-being are comparable to gay men, but lower than bisexual men. Mental health–seeking behaviors between different groups of SMMs may need to be investigated further.
Our approach is mostly correcting for selection bias in the Sex Now data. We have not addressed the potential misclassification bias in the CCHS. The CCHS is likely to reach subsets of SMMs who would not connect with online gay spaces (eg, online gay dating apps or LGBTQ+ events) but misses subsets of SMMs who do not trust or feel compelled to participate in federal surveys. The present ALP method assumed that nondisclosure of true sexual orientation among men who have agreed to participate in a government survey is negligible and would have been taken into account through the nonresponse weights in the Statistics Canada provided weights.26,48 However, if this assumption is not valid, then recalibrating Sex Now to the CCHS as we have done here may still be inappropriate as the CCHS sample is not truly representative of all SMM. It is unknown as currently no studies to our knowledge have asked how likely it is for SMMs to participate in a government survey, although literature does suggest minority populations tend to be more distrustful of institutions and government surveys.49,50 Authors are currently working on ways to address both misclassification bias and selection bias in these surveys.
There were a few inherent assumptions made by the present analysis. First, the covariates that characterize the differences between the CCHS and Sex Now participants were identifiable. This means that there were no additional characteristics that distinguished the Sex Now and CCHS participants. Moreover, Statistics Canada nonresponse weights accounted for selection and volunteer bias in the CCHS survey. Finally, we also assumed that both Sex Now and CCHS are interchangeable when there were no misclassification biases. An SMM in CCHS might be just as likely to be selected into Sex Now had everyone been truthful (ie, no selection bias). These assumptions might be unrealistic and need to be kept in mind when interpreting these results.
Aside from the methodological assumptions, this analysis also has a few limitations. First is the use of CCHS open data, which does not have the granularity of the variables (eg, rurality or ethnicity). Second, there were differences in the questionnaires between the CCHS and Sex Now, as documented in Supplementary Table S1; hence there might be some biases in how the variables were combined to create the ALP-weights. Most notably, substance use in Sex Now was collected for the previous 6 months, whereas it was concerning the previous year in the CCHS. While we did not combine the surveys to calculate the prevalence of the outcomes, care must be taken when comparing ALP-weighted Sex Now prevalence and survey-weighted CCHS prevalence. On top of misclassification biases in sexual orientation, there might also be misclassification biases within these covariates themselves. It is likely that there might be more underreporting of drug use in a government survey such as the CCHS compared with Sex Now. Given that the Sex Now data also asked for a shorter time period for the drug use, these biases might cancel each other out.
There are a few advantages of the ALP method. One major advantage is in terms of participants’ privacy; it does not reclassify anyone’s reported sexual orientation as it only reweighted the overall population. This property might be desired when there are increasing privacy concerns in research, especially for minority populations. Secondly, the method is much more cost effective compared with a method of creating population estimates of SMMs from scratch, which are often infeasible due to the lack of sampling frame, or require an expensive and complex recruitment method such as respondent driven sampling (RDS).51 While RDS can be preferred over a nonprobability sample, it still requires respondents to be connected with at least 1 person from the community, which not the case for a survey such as the CCHS. Thirdly, we can easily incorporate multiple covariates in the adjustment, including interaction terms, which other methods may not be able to easily do.52-54 Finally, as shown here, one big strength of the ALP is the ability to estimate prevalence for variables only available in the Sex Now survey, such as loneliness, which is typically not captured in a population survey such as the CCHS.
Our study has illuminated a more informed estimate of mental health and well-being among SMMs. More research should be done to understand the causal mechanisms and predictors of MHSU among SMMs using these more informed estimates. We also encourage other researchers to start considering the ALP when working any other marginalized populations which might be difficult to reach, underrepresented, or misclassified in population surveys.
Supplementary Material
Acknowledgments
The authors wish to acknowledge Kuan Liu and Sarah Naz McLean for their inputs on the analysis and earlier drafts of the manuscript. Parts of this manuscript were presented at the Canadian Sociological Association 2023 meeting, on June 1, 2023, in Toronto, Ontario, Canada.
Contributor Information
Christoffer Dharma, Dalla Lana School of Public Health, University of Toronto, Toronto, Ontario M5T1P8, Canada.
Peter M Smith, Dalla Lana School of Public Health, University of Toronto, Toronto, Ontario M5T1P8, Canada; Institute for Work and Health, Toronto, Ontario M5G 1S5, Canada; School of Population Health and Preventive Medicine, Monash University, Melbourne, Victoria 3004, Australia.
Michael Escobar, Dalla Lana School of Public Health, University of Toronto, Toronto, Ontario M5T1P8, Canada.
Travis Salway, Centre for Gender and Sexual Health Equity, Vancouver, British Columbia V6Z 2K5, Canada; Faculty of Health Sciences, Simon Fraser University, Burnaby V5A 1S6, British Columbia V5A 1S6, Canada; British Columbia Centre for Disease Control, Vancouver, British Columbia V5Z 4R4, Canada.
Victoria Landsman, Dalla Lana School of Public Health, University of Toronto, Toronto, Ontario M5T1P8, Canada; Institute for Work and Health, Toronto, Ontario M5G 1S5, Canada.
Nathan J Lachowsky, Community-Based Research Centre, Vancouver, British Columbia V6Z 2H2, Canada; School of Public Health and Social Policy, Faculty of Human and Social Development, University of Victoria, Victoria, British Columbia V8W 2Y2, Canada; Institute for Aging and Lifelong Health, University of Victoria, Victoria, British Columbia V8N 5M8, Canada.
Dionne Gesink, Dalla Lana School of Public Health, University of Toronto, Toronto, Ontario M5T1P8, Canada.
Supplementary material
Supplementary material is available at American Journal of Epidemiology online.
Funding
C.D.’s work is funded by the Vanier Canada Graduate Scholarship.
Conflict of interest
The authors have no relevant conflict of interest to declare.
Data availability
The study used the Public Use Microdata File (PUMF) version of the Canadian Community Health Survey (CCHS) data, available through Statistics Canada’s Data Liberation Initiative, via the University of Toronto libraries. Anyone with institutional access to these data can receive access to these data freely. The Sex Now dataset is obtained from the Community Based Research Center (CBRC); data are not publicly available, but access can be granted by the CBRC. The full underlying dataset creation and analytic codes are available in the first author’s GitHub page.
References
- 1. Salway T, Ross LE, Fehr CP, et al. A systematic review and meta-analysis of disparities in the prevalence of suicide ideation and attempt among bisexual populations. Arch Sex Behav. 2019;48(1):89-111. 10.1007/s10508-018-1150-6 [DOI] [PubMed] [Google Scholar]
- 2. Salway T, Plöderl M, Liu J, et al. Effects of multiple forms of information bias on estimated prevalence of suicide attempts according to sexual orientation: an application of a Bayesian misclassification correction method to data from a systematic review. Am J Epidemiol. 2019;188(1):239-249. 10.1093/aje/kwy200 [DOI] [PubMed] [Google Scholar]
- 3. Tjepkema M. Health care use among gay, lesbian and bisexual Canadians. Health Rep. 2008;19(1):53-64. https://www150.statcan.gc.ca/n1/en/pub/82-003-x/2008001/article/10532-eng.pdf [PubMed] [Google Scholar]
- 4. Brennan DJ, Ross LE, Dobinson C, et al. Men’s sexual orientation and health in Canada. Can J Public Health. 2010;101(3):255-258. 10.1007/BF03404385 [DOI] [PMC free article] [PubMed] [Google Scholar]
- 5. Scott RL, Lasiuk GC, Norris CM. Depression in lesbian, gay, and bisexual members of the Canadian Armed Forces. LGBT Health. 2016;3(5):366-372. 10.1089/lgbt.2016.0050 [DOI] [PubMed] [Google Scholar]
- 6. Scott RL, Lasiuk G, Norris CM. Sexual orientation and depression in Canada. Can J Public Health. 2016;107(6):e545-e549. 10.17269/CJPH.107.5506 [DOI] [PMC free article] [PubMed] [Google Scholar]
- 7. Gilmour H. Sexual orientation and complete mental health. Health Rep. 2019;30(11):3-10. 10.25318/82-003-x201901100001-eng [DOI] [PubMed] [Google Scholar]
- 8. Veenstra G. Race, gender, class, and sexual orientation: intersecting axes of inequality and self-rated health in Canada. Int J Equity Health. 2011;10(1):3. 10.1186/1475-9276-10-3 [DOI] [PMC free article] [PubMed] [Google Scholar]
- 9. Bruce LD, Wu JS, Lustig SL, et al. Loneliness in the United States: a 2018 National Panel Survey of demographic, structural, cognitive, and behavioral characteristics. Am J Health Promot. 2019;33(8):1123-1133. 10.1177/0890117119856551 [DOI] [PMC free article] [PubMed] [Google Scholar]
- 10. Office of the U.S. Surgeon General . Our Epidemic of Loneliness and Isolation. The U.S. Surgeon General’s Advisory on the Healing Effects of Social Connection and Community. United States Public Health Service. 2023;1-82. [Google Scholar]
- 11. Holt-Lunstad J, Robles T, Sbarra DA. Advancing social connection as a public health priority in the United States. Am Psychol. 2017;72(6):517-530. 10.1037/amp0000103 [DOI] [PMC free article] [PubMed] [Google Scholar]
- 12. Marziali ME, Armstrong HL, Closson K, et al. Loneliness and self-rated physical health among gay, bisexual and other men who have sex with men in Vancouver, Canada. J Epidemiol Community Health. 2020;74(7):553-559. 10.1136/jech-2019-213566 [DOI] [PMC free article] [PubMed] [Google Scholar]
- 13. Jacmin-Park S, Rossi M, Dumont L, et al. Mental health and social support of sexual and gender diverse people from Québec, Canada during the COVID-19 crisis. LGBT Health. 2022;9(3):151-160. 10.1089/lgbt.2021.0255 [DOI] [PubMed] [Google Scholar]
- 14. Liu Y, Yang Y, Fu C, et al. Loneliness and depressive symptoms among men who have sex with men in China: a cross-sectional study. Front Psych. 2023;14:1179703. 10.3389/fpsyt.2023.1179703 [DOI] [PMC free article] [PubMed] [Google Scholar]
- 15. McAlpine DD, McCreedy E, Alang S. The meaning and predictive value of self-rated mental health among persons with a mental health problem. J Health Soc Behav. 2018;59(2):200-214. 10.1177/0022146518755485 [DOI] [PubMed] [Google Scholar]
- 16. Marbaniang I, Rose E, Moodie EEM, et al. Mental health services use and depressive symptom scores among gay and bisexual men in Canada. Soc Psychiatry Psychiatr Epidemiol 2022;57:2333-2343. 10.1007/s00127-022-02362-3 [DOI] [PMC free article] [PubMed] [Google Scholar]
- 17. Filice E, Meyer SB. Patterns, predictors, and outcomes of mental health service utilization among lesbians, gay men, and bisexuals: a scoping review. J Gay Lesbian Ment Health. 2018;22(2):162-195. 10.1080/19359705.2017.1418468 [DOI] [Google Scholar]
- 18. Salway T, Ferlatte O, Gesink D, et al. Prevalence of exposure to sexual orientation change efforts and associated sociodemographic characteristics and psychosocial health outcomes among Canadian sexual minority men. Can J Psychiatry. 2020;65(7):502-509. 10.1177/0706743720902629 [DOI] [PMC free article] [PubMed] [Google Scholar]
- 19. Dharma C, Bauer GR. Understanding sexual orientation and health in Canada: who are we capturing and who are we missing using the Statistics Canada sexual orientation question? Can J Public Health. 2017;108(1):e21-e26. 10.17269/CJPH.108.5848 [DOI] [PMC free article] [PubMed] [Google Scholar]
- 20. Hottes TS, Gesink D, Ferlatte O, et al. Concealment of sexual minority identities in interviewer-administered government surveys and its impact on estimates of suicide ideation among bisexual and gay men. J Bisex. 2016;16(4):427-453. 10.1080/15299716.2016.1225622 [DOI] [Google Scholar]
- 21. Grov C. HIV risk and substance use in men who have sex with men surveyed in bathhouses, bars/clubs, and on Craigslist.org: venue of recruitment matters. AIDS Behav. 2012;16(4):807-817. 10.1007/s10461-011-9999-6 [DOI] [PMC free article] [PubMed] [Google Scholar]
- 22. Grov C, Hirshfield S, Remien RH, et al. Exploring the venue’s role in risky sexual behavior among gay and bisexual men: an event-level analysis from a national online survey in the U.S. Arch Sex Behav. 2013;42(2):291-302. 10.1007/s10508-011-9854-x [DOI] [PMC free article] [PubMed] [Google Scholar]
- 23. Salway TJ, Morgan J, Ferlatte O, et al. A systematic review of characteristics of nonprobability community venue samples of sexual minority individuals and associated methods for assessing selection bias. LGBT Health. 2019;6(5):205-215. 10.1089/lgbt.2018.0241 [DOI] [PubMed] [Google Scholar]
- 24. Statistics Canada . Canadian Community Health Survey Annual Component (CCHS). Statistics Canada. Published January 2, 2020. https://www23.statcan.gc.ca/imdb/p2SV.pl?Function=getSurvey&SDDS=3226Accessed February 15, 2021. [Google Scholar]
- 25. Thomas S, Wannell B. Combining Cycles of the Canadian Community Health Survey. Statistics Canada; 2009. Statistics Canada; 2009. [PubMed] [Google Scholar]
- 26. Statistics Canada—Health Statistics Division . Canadian Community Health Survey (CCHS) 2003 User Guide for the Public Use Microdata File. Published online 2005. Accessed March 30, 2023. https://www.apheo.ca/data-cchs
- 27. Community-Based Research Center . Sex Now Survey. Community-Based Research Centre. Published 2020. Accessed February 16, 2021. https://www.cbrc.net/sex_now
- 28. Rutherford L, Stark A, Ablona A, et al. Health and well-being of trans and non-binary participants in a community-based survey of gay, bisexual, and queer men, and non-binary and two-Spirit people across Canada. PloS One. 2021;16(2):e0246525. 10.1371/journal.pone.0246525 [DOI] [PMC free article] [PubMed] [Google Scholar]
- 29. Löwe B, Wahl I, Rose M, et al. A 4-item measure of depression and anxiety: validation and standardization of the Patient Health Questionnaire-4 (PHQ-4) in the general population. J Affect Disord. 2010;122(1):86-95. 10.1016/j.jad.2009.06.019 [DOI] [PubMed] [Google Scholar]
- 30. Manea L, Gilbody S, McMillan D. Optimal cut-off score for diagnosing depression with the Patient Health Questionnaire (PHQ-9): a meta-analysis. CMAJ. 2012;184(3):E191-E196. 10.1503/cmaj.110829 [DOI] [PMC free article] [PubMed] [Google Scholar]
- 31. Hughes AJ, Dunn KM, Chaffee T, et al. Diagnostic and clinical utility of the GAD-2 for screening anxiety symptoms in individuals with multiple sclerosis. Arch Phys Med Rehabil. 2018;99(10):2045-2049. 10.1016/j.apmr.2018.05.029 [DOI] [PMC free article] [PubMed] [Google Scholar]
- 32. Kroenke K, Spitzer RL, Williams JBW. The PHQ-9. J Gen Intern Med. 2001;16(9):606-613. 10.1046/j.1525-1497.2001.016009606.x [DOI] [PMC free article] [PubMed] [Google Scholar]
- 33. Hughes ME, Waite LJ, Hawkley LC, et al. A short scale for measuring loneliness in large surveys. Res Aging. 2004;26(6):655-672. 10.1177/0164027504268574 [DOI] [PMC free article] [PubMed] [Google Scholar]
- 34. Hubach RD, Dodge B, Li MJ, et al. Loneliness, HIV-related stigma, and condom use among a predominantly rural sample of HIV-positive men who have sex with men (MSM). AIDS Educ Prev. 2015;27(1):72-83. 10.1521/aeap.2015.27.1.72 [DOI] [PubMed] [Google Scholar]
- 35. Gagné C, Roberts G, Keown LA. Weighted estimation and bootstrap variance estimation for analyzing survey data: How to implement in selected software. Published online 2015. Accessed April 6, 2024. https://www150.statcan.gc.ca/n1/pub/12-002-x/2014001/article/11901-eng.htm
- 36. Wang L, Graubard BI, Katki HA, et al. Efficient and robust propensity-score-based methods for population inference using epidemiologic cohorts. Int Statistical Rev. 2022;90(1):146-164. 10.1111/insr.12470 [DOI] [Google Scholar]
- 37. Wang L, Valliant R, Li Y. Adjusted logistic propensity weighting methods for population inference using nonprobability volunteer based cohort. Stat Med. 2021;40(24):5237-5250. 10.1002/sim.9122 [DOI] [PMC free article] [PubMed] [Google Scholar]
- 38. Austin PC. Balance diagnostics for comparing the distribution of baseline covariates between treatment groups in propensity-score matched samples. Stat Med 2009;28(25):3083-3107. 10.1002/sim.3697 [DOI] [PMC free article] [PubMed] [Google Scholar]
- 39. Lumley T. Survey: analysis of complex survey samples. Published online 2020. Accessed April 6, 2024. https://cran.r-project.org/web/packages/survey/survey.pdf
- 40. Edwards J, Pananos AD, Thind A, et al. A Bayesian approach to estimating the population prevalence of mood and anxiety disorders using multiple measures. Epidemiol Psychiatr Sci. 2021;30:e4. 10.1017/S2045796020001080 [DOI] [PMC free article] [PubMed] [Google Scholar]
- 41. Levis B, Sun Y, He C, et al. Accuracy of the PHQ-2 alone and in combination with the PHQ-9 for screening to detect major depression: systematic review and meta-analysis. JAMA. 2020;323(22):2290-2300. 10.1001/jama.2020.6504 [DOI] [PMC free article] [PubMed] [Google Scholar]
- 42. Maroufizadeh S, Omani-Samani R, Almasi-Hashiani A, et al. The reliability and validity of the Patient Health Questionnaire-9 (PHQ-9) and PHQ-2 in patients with infertility. Reprod Health. 2019;16:137. 10.1186/s12978-019-0802-x [DOI] [PMC free article] [PubMed] [Google Scholar]
- 43. Arroll B, Goodyear-Smith F, Crengle S, et al. Validation of PHQ-2 and PHQ-9 to screen for major depression in the primary care population. Ann Fam Med. 2010;8(4):348-353. 10.1370/afm.1139 [DOI] [PMC free article] [PubMed] [Google Scholar]
- 44. Pachankis JE, Mahon CP, Jackson SD, et al. Sexual orientation concealment and mental health: a conceptual and meta-analytic review. Psychol Bull. 2020;146(10):831-871. 10.1037/bul0000271 [DOI] [PMC free article] [PubMed] [Google Scholar]
- 45. Henderson ER, Egan JE, Haberlen SA, et al. Does social support predict depressive symptoms? A longitudinal study of midlife and older men who have sex with men from the multicenter AIDS cohort study. Ann LGBTQ Public Popul Health. 2021;2(2):142-160. 10.1891/lgbtq-2020-0042 [DOI] [PMC free article] [PubMed] [Google Scholar]
- 46. Zhang Y, Farina RE, Lawrence SE, et al. How social support and parent-child relationship quality relate to LGBTQ+ college students’ well-being during COVID-19. J Fam Psychol. 2022;36(5):653-660. 10.1037/fam0000981 [DOI] [PubMed] [Google Scholar]
- 47. Rosario M, Hunter J, Maguen S, et al. The coming-out process and its adaptational and health-related associations among gay, lesbian, and bisexual youths: stipulation and exploration of a model. Am J Community Psychol. 2001;29(1):133-160. 10.1023/A:1005205630978 [DOI] [PubMed] [Google Scholar]
- 48. Statistics Canada . Canadian Community Health Survey (CCHS) Annual Component—User Guide 2016 Microdata File. Statistics Canada; 2017. https://gsg.uottawa.ca/data/teaching/soc/cchs201516/CCHS_2015_2016_User_Guide.pdf [Google Scholar]
- 49. Community-Based Research Centre . Serious Legal Problems Faced by Lesbian, Gay, Bisexual, and Other Sexual-Minority People in Western Canada: A Qualitative Study. Department of Justice Canada; 2021. https://www.justice.gc.ca/eng/rp-pr/jr/lgbtq/docs/rsd_rr2021_lgb-people-in-western-canada-eng.pdf [Google Scholar]
- 50. Cottrell DB, Aaron-Brija L, Berkowitz E, et al. The complexity of trauma for LGBTQ+ people: considerations for acute and critical care. Crit Care Nurs Clin North Am. 2023;35(2):179-189. 10.1016/j.cnc.2023.02.010 [DOI] [PubMed] [Google Scholar]
- 51. Shaghaghi A, Bhopal RS, Sheikh A. Approaches to recruiting ‘hard-to-reach’ populations into research: a review of the literature. Health Promot Perspect. 2011;1(2):86-94. 10.5681/hpp.2011.009 [DOI] [PMC free article] [PubMed] [Google Scholar]
- 52. Levy NS, Palamar JJ, Mooney SJ, et al. What is the prevalence of drug use in the general population? Simulating underreported and unknown use for more accurate national estimates. Ann Epidemiol. 2022;68:45-53. 10.1016/j.annepidem.2021.12.013 [DOI] [PMC free article] [PubMed] [Google Scholar]
- 53. Greenland S, Kleinbaum DG. Correcting for misclassification in two-way tables and matched-pair studies. Int J Epidemiol. 1983;12(1):93-97. 10.1093/ije/12.1.93 [DOI] [PubMed] [Google Scholar]
- 54. Lash TL, Fox MP, Fink AK. Applying Quantitative Bias Analysis to Epidemiologic Data. Springer; 2009. [Google Scholar]
Associated Data
This section collects any data citations, data availability statements, or supplementary materials included in this article.
Supplementary Materials
Data Availability Statement
The study used the Public Use Microdata File (PUMF) version of the Canadian Community Health Survey (CCHS) data, available through Statistics Canada’s Data Liberation Initiative, via the University of Toronto libraries. Anyone with institutional access to these data can receive access to these data freely. The Sex Now dataset is obtained from the Community Based Research Center (CBRC); data are not publicly available, but access can be granted by the CBRC. The full underlying dataset creation and analytic codes are available in the first author’s GitHub page.