Abstract
van der Waals BiOCl semiconductors have gained significant attention due to their excellent photochemical catalysis, low-cost and non-toxicity. However, their intrinsic wide band gap limits visible light utilization. This study explores high-pressure band-gap engineering, a “chemical clean” method, to optimize BiOCl's electronic structure. Utilizing in situ high-pressure ultraviolet-visible (UV-vis) absorption spectra, Raman spectroscopy and XRD, we systematically investigate the effects of compression on band gap and crystal structure evolution of BiOCl. Our results demonstrate that pressure efficiently narrows the band gap from 3.44 eV to 2.81 eV within the pressure range of 0.4–44 GPa. The further Raman and XRD analyses reveal an isostructural phase transition, leading to a significant change in the compressibility of the lattice parameters and bonds from anisotropic to isotropic. These findings provide a potential pathway to tune the bandgap for enhancing the photocatalytic efficiency of BiOCl.
High-pressure efficiently narrows the band gap and changes the unit cell compressibility from anisotropic to isotropic in van der Waals BiOCl semiconductors.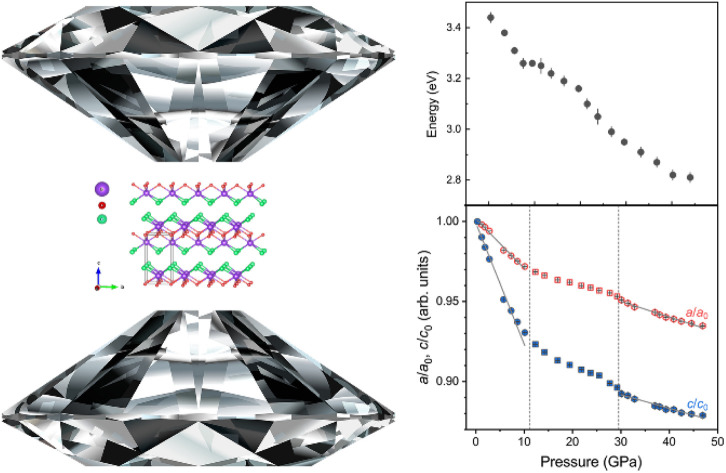
Introduction
The rapid socio-economic development has exacerbated issues related to resource scarcity and environmental pollution. Photocatalytic technology can convert solar energy into chemicals and fuels, while simultaneously degrading organic waste, providing a promising solution to address the energy crisis and environmental pollution.1–3 In recent years, two-dimensional (2D) layered van der Waals (vdW) semiconductors have garnered significant attention within the photocatalysis field due to their unique layered structures and size effects.4–6 The weak interlayer interactions present in vdW semiconductors facilitate highly tuneable electronic and band structures through various methods, including layer stacking, twisting, intercalation, and doping.7 Moreover, the extensive surface area of vdW materials provides numerous active sites and inhibits the recombination of electron–hole pairs, thereby enhancing quantum efficiency. However, to realize industrial applications, environmentally friendly, low-cost materials but with high photocatalytic activity remain the primary issue.
Bismuth oxide chloride (BiOCl), featured by its typical layered structure and composed of earth-abundant, non-toxic elements, has been widely considered as one promising photocatalysts.5,8,9 At ambient conditions, BiOCl belongs to the tetragonal space group P4/nmm (S.G. 129).10 It comprises of [Cl–Bi–O2–Bi–Cl] layers stacked along the c-axis, and interact through the weak van der Waals forces. Each layer is characterized by a mirror-symmetric decahedral structure (Bi atom coordinates with four O atoms and four Cl atoms). This distinctive layered structure leads to effective electron–hole pairs separation. However, BiOCl functions as an indirect p-type semiconductor with large bandgap (∼3.5 eV), limiting its absorption to ultraviolet light.11,12 Consequently, optimizing the band structure to enhance visible light utilization is crucial for improving photocatalytic efficiency. To address this, various of strategies have been employed to achieve ultimate photocatalytic performance, including doping,13,14 producing oxygen vacancies,15,16 controlling morphology,17,18 constructing semiconductor heterostructures19 and increasing van der Waals gaps (vdWg) exposure5etc. Furthermore, applying pressure can shrink lattice parameters, thereby enhancing atom interaction, providing a “chemical clean” approach for manipulating the crystal and band structure of photocatalysis. It has been reported that pressure can efficiently narrow the energy band-gap of ZnO, making it visible-light active.20 Errandonea reported that the band gap of PbCrO4 decreases significantly from 2.3 eV to 0.8 eV as pressure increases from 0 to 20 GPa.21 Xu et al. conducted theoretical calculation indicating that BiOI experiences dramatic in van der Waals interactions variation, leading to changes in its electronic structure under high-pressure.22 Regarding the band structure evolution of BiOCl under compression, there is only one computational results indicates that the bandgap of BiOCl increases with pressure first and then decreases, which is abnormal among the layered semiconductors.23
In this study, combining with absorption spectrum, in situ synchrotron XRD, Raman scattering experiments, we systematically investigate the bandgap, crystal structures, and anisotropic structural behavior of BiOCl nanosheets at pressures exceeding 40 GPa. Our findings reveal that pressure effectively modulates the energy bandgap of BiOCl nanosheets with the bandgap decreasing as pressure increasing. Raman and XRD spectra indicate that BiOCl nanosheets undergo an isotropic structural phase transition under high pressure. Further analysis of structural parameters, including lattice parameter compressibility and the evolution of chemical bonds and angles under compression, reveals a transition in unit cell compressibility from anisotropic to isotropic during the compression process.
Experimental methods
Sample synthesis and characterization
BiOCl nanosheets were synthesized via a solvothermal method. Specifically, 2 mmol Bi(NO3)3·5H2O and 2 mmol KCl were dissolved in 40 mL deionized water with vigorous stirring for 30 minutes. Subsequently, 1 mol per L NaOH was added to adjust the pH to 6.0. The resulting mixture was transferred to a stainless steel reaction vessel and heated at 160 °C for 24 hours. The product was then washed several times with ethanol and deionized water, followed by centrifugation. The resultant composite was dried at 60 °C for 24 hours to yield the final BiOCl nanosheets.
The chemical composition and morphology of the synthesized nanocrystal were analyzed using scanning electron microscopy (SEM, HITACHI, SU-70) equipped with energy-dispersive spectrometer (EDS). The crystalline structure and phase purity of the compound were examined by powder X-ray diffraction (XRD) using a laboratory X-ray diffractometer (Rigaku Nanopix WE) utilizing Mo Kα1 (λ = 0.7093 Å) radiation. The obtained XRD pattern was analyzed using the Rietveld method with the GSAS-II software package.24 To further elucidate the chemical composition and valence states of the materials, X-ray photoelectron spectroscopy (XPS, ESCALAB 250) spectra was performed.
High-pressure ultraviolet-visible (UV-vis) absorption spectra, Raman and XRD experiments
For the high-pressure optical absorption, XRD, and Raman experiments, symmetric cells equipped with 300 μm culet standard diamond anvils were used. Sample chambers with the size of ∼150 μm in diameter and ∼50 μm in thick were prepared by pre-indented T301 stainless steel gaskets. The sample was prepressed to a condense pellet with a thickness of ∼10 μm before loaded to the sample chamber. Silicon oil was loaded as the pressure transmission medium (PTM).25 While silicon oil is widely used, its non-hydrostatic behavior above 10 GPa may influence the accuracy of the structural measurements. For pressure marker, ruby spheres26 were employed in UV-Vis absorption and Raman measurements, while gold powder27 was used in XRD experiments.
High-pressure UV-vis absorption spectra were recorded utilizing a deuterium–halogen light source [Ocean Optics QE Pro spectrometer]. High-pressure Raman measurements were carried out using a micro-Raman spectrometer (HR Evolution) with an excitation wavelength of 532 nm. The spectrometer was equipped with a 50× microscope objective and the laser spot size was about 5 μm. The spectral resolution of the spectrometer was 1 cm−1. In situ high-pressure synchrotron XRD experiments were performed at the BL15U1 beamline of the Shanghai Synchrotron Radiation Facility (SSRF), China.28 The incident X-ray wavelength was 20 keV (0.6199 Å) with a focused beam size of 3 (horizontal) μm × 3 (vertical) μm at full width at half maximum (FWHM). Two-dimensional XRD patterns were captured using a Mar165-CCD detector and integrated by DIOPTAS.29 Subsequently, the 1D patterns were fitted using the Le-Bail method with GSAS-II software package24 to extract unit cell parameters. The pressure dependence of the unit-cell volumes was fitted with 2nd order Birch–Murnaghan equation of state (EoS)30 employing EosFit7 GUI software.31
Results and discussion
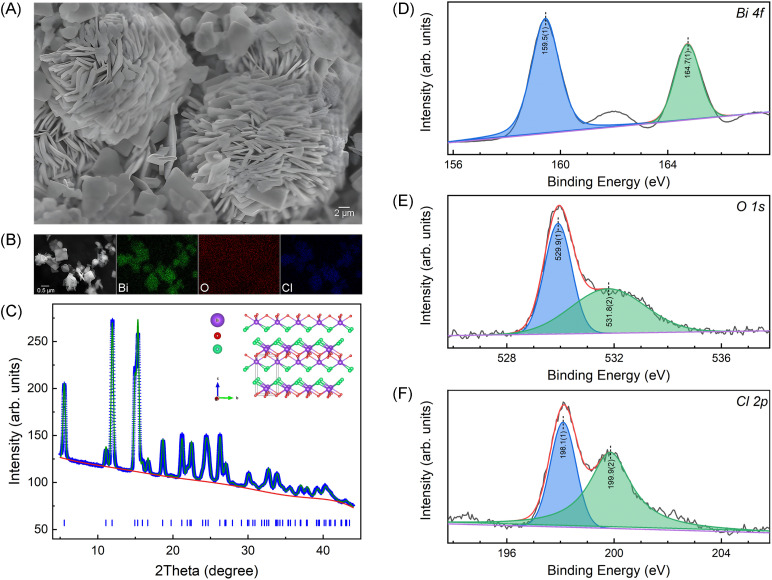
The quality of the synthesized BiOCl nanosheets was systematically characterized, as depicted in Fig. 1. The SEM image (Fig. 1(A)) shows nanoplates aggregated in flower morphology and EDS mapping (Fig. 1(B)) confirm a homogeneous elemental distribution of bismuth (Bi), oxygen (O), and chlorine (Cl) with no detectable impurities. Fig. 1(C) presents the powder XRD profile along with the Rietveld refinement results, and the insert illustrates the layered structure of BiOCl. The refinement result corroborates the layered tetragonal structure of BiOCl (space group P4/nmm) with lattice parameters of a = b = 3.88551(10) Å and c = 7.3489(3), confirming the as-synthesized BiOCl nanosheets of excellent quality and purity. Additionally, XPS spectra depicts the Bi, O, and Cl signals as presented in Fig. 1(D)–(F). The binding energies of the major peaks at 159.5 eV and 164.7 eV correspond to Bi 4f5/4 and 4f7/4 states, respectively, indicating the presence of Bi3+ state. The fitted O 1s peaks, located at 259.9 eV and 531.8 eV, are attributed to Bi–O bonds and O atoms in the vicinity of oxygen vacancies, respectively. The characteristic peaks with binding energies of 198.1 eV and 199.9 eV correspond to the Cl 2p3/2 and Cl 2p1/2 states, respectively.
Fig. 1. SEM image (A) and EDS mappings (B) of the synthesized BiOCl nanosheets. (C) 1D XRD pattern along with the Rietveld refinement result using the GSAS-II software package24 and the inserted shows the layered crystal structure of BiOCl. (D)–(F) are XPS spectra of Bi 4f, O 1s and Cl 2p, respectively.
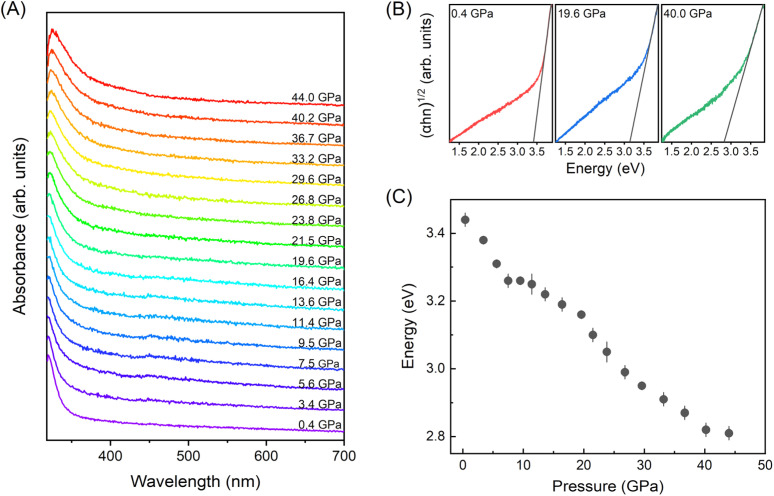
To investigate the optical bandgap evolution of BiOCl under high-pressure, in situ UV-vis absorption measurements (Fig. 2) were conducted. As illustrated in Fig. 2(A), the absorption spectra exhibit a bule shift with pressure increasing. Here, we applied the Tauc plot method32 to determine the energy bandgaps of BiOCl at varying pressures. It is important to note that the energy bandgaps determined by the Tauc plot method, although widely used, may underestimate the true values, as recently reported by Garg et al.33Fig. 2(C) presents the bandgap as a function of pressure. Notably, like many other van der Waals materials, the energy bandgap decreased from 3.44 to 2.81 eV (approximately 18%) within the pressure range of 0.4–44 GPa, which is different with the DFT calculation results in literature we mentioned above.23 Although, the bandgap hasn't shrunk to visible light sensitive within the compression range, it indicates a potential pathway for optimizing the bandgap of BiOCl.
Fig. 2. (A) High-pressure UV-vis absorption spectra of BiOCl nanosheets. (B) Plot of (αhν)1/2versus photon energy at the selected pressures of 1.3 GPa (left), 19.3 GPa (middle) and 39.7 GPa (right). The dash lines are shown to estimate the optical bandgap. (C) Pressure dependent bandgap. The error bars are estimated from the liner fitting error.
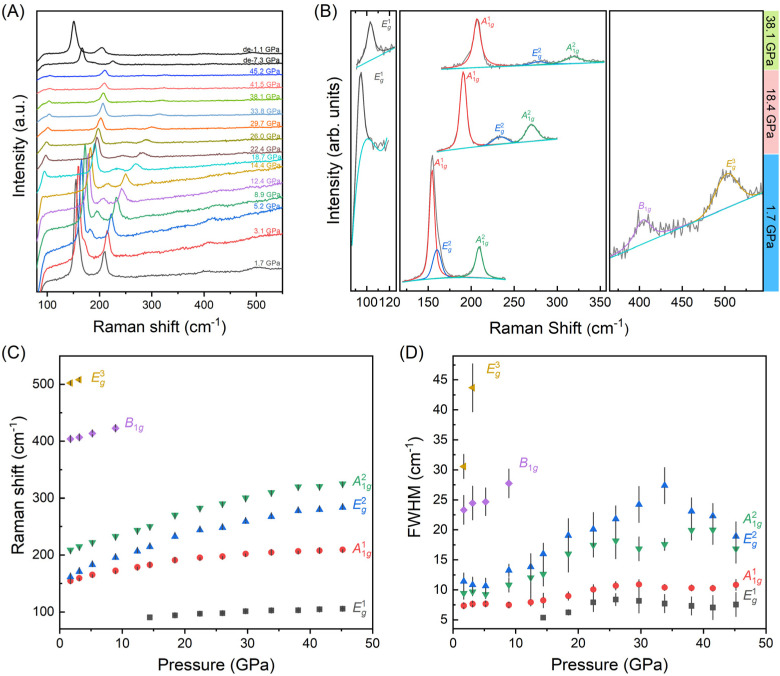
In order to gain a deeper understanding of the evolution of electronic properties in relationship to structure behavior of BiOCl under compression, in situ high-pressure Raman scattering measurements were performed. The point group of BiOCl is D4h (4/mmm), and the optical model for BiOCl is M = 2A1g (R) + 2A2u (I) + B1g (R) + 2Eu (I) + 3Eg (R), where R and I represent Raman and IR-active vibration modes, respectively.34 As shown in Fig. 3(A), all six vibration modes are observed across the studied pressure range up to 45.2 GPa. With pressure increasing, continuous red shifts of the Raman peaks are observed, and upon pressure release, the sample exhibits recovery. Fig. 3 (B) presents the profile fitting of the Raman peaks with the vibration modes indicated at the selected pressures of 1.7 GPa (bottom), 14.8 GPa (middle) and 38.1 GPa (top). Fig. 3(C) and (D) show the Raman shift and FWHM of these vibration peaks. No new vibration modes or peak splitting are observed, suggesting no phase transition occurs during the compression process (Table 1).
Fig. 3. (A) High-pressure Raman spectra of BiOCl nanosheets. All six Raman-active vibration modes are recorded. (B) Profile fitting of the Raman spectra peaks at the selected pressures of 1.7 GPa (bottom), 18.4 GPa (middle) and 38.1 GPa (top). (C) Raman shift of the vibration modes as a function of pressure, showing a monotonic increase with pressure with no evidence of phase transition. (D) The FWHM of the mode vibration under pressure.
Phonon frequencies varying with pressure.
| Pressure (GPa) | E1g (cm−1) | A11g (cm−1) | E2g (cm−1) | A21g (cm−1) | E1g (cm−1) | E3g (cm−1) |
|---|---|---|---|---|---|---|
| 1.7 | — | 154.6(1) | 161.5(10) | 209.0(1) | 404.1(8) | 502.1(6) |
| 3.1 | — | 159.5(1) | 170.9(2) | 214.9(1) | 407.0(8) | 508(2) |
| 5.2 | — | 165.4(1) | 182.6(2) | 222.4(1) | 414(2) | — |
| 8.9 | — | 172.3(1) | 195.4(4) | 232.9(1) | 423(2) | — |
| 12.4 | 178.5(1) | 206.6(6) | 243.3(3) | — | — | — |
| 14.4 | 90.4(2) | 182.5(1) | 216(1) | 250.2(4) | — | — |
| 18.4 | 94.1(1) | 190.9(1) | 233(3) | 270.3(5) | — | — |
| 22.4 | 97.0(4) | 195.3(1) | 243.9(8) | 282.7(4) | — | — |
| 26 | 98.0(3) | 197.4(1) | 248(1) | 290.5(5) | — | — |
| 29.7 | 101.4(2) | 202.0(1) | 259(2) | 300.5(4) | — | — |
| 33.8 | 102.7(1) | 204.7(1) | 267(2) | 309.9(8) | — | — |
| 38.1 | 103.2(2) | 206.7(1) | 278(1) | 320(1) | — | — |
| 41.5 | 104.7(2) | 207.8(1) | 280(1) | 320.5(9) | — | — |
| 45.2 | 105.7(3) | 209.4(1) | 284(1) | 325.2(9) | — | — |
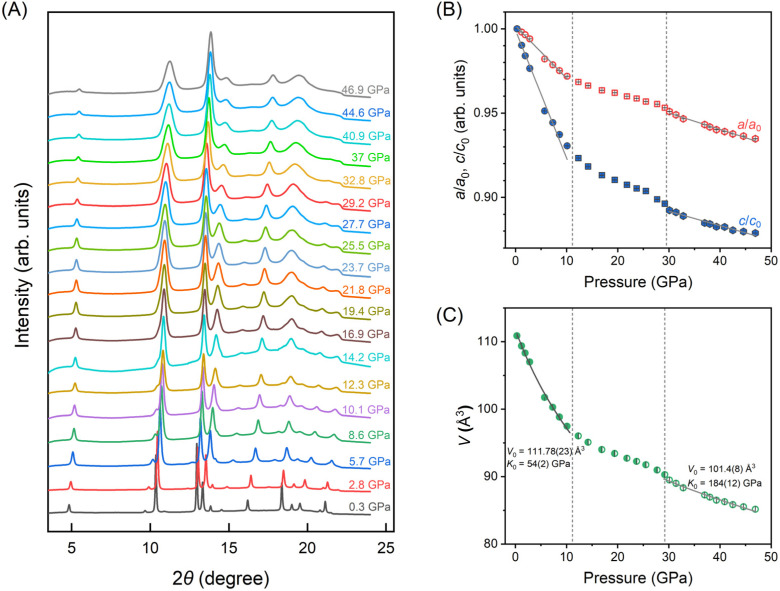
To further feature the structural evolution under compression, in situ synchrotron high-pressure XRD experiments were conducted. The pressure-dependent XRD patterns are depicted in Fig. 4(A) up to 46.9 GPa. As presented, the XRD spectra exhibit a consistent profile with diffraction peaks shifts towards higher angles during the compression process, indicating that the BiOCl material does not undergo a first-order structural phase transition. Based on the tetragonal cell structure P4/nmm (S.G. 129) confirmed with the ambient XRD data, all the high-pressure XRD patterns were fitted using the Le-Bail method with GSAS-II software package.24 We plot the compressibility of the lattice parameters a/a0 and c/c0 (a0 and c0 represent the lattice parameters of the unit cell at 0.3 GPa) for BiOCl nanosheets in Fig. 4(B). As previously mentioned, the weak coupling in van der Waals (vdW) materials results significant anisotropic behavior in vdW layered crystals like BiOCl. Giant anisotropic shrinkage of the in-plane direction (a-axis) and out-of-plane direction (c-axis) are noticed at the initial compression stage, where the compressibility of c-axis is approximately double than that of a-axis at the lower pressure range (0.3–10.1 GPa). Subsequently, a marked reduction in compressibility for both axes is observed, leading to a nearly equivalent compressibility of a/a0 and c/c0 beyond 30 GPa. Furthermore, the pressure dependence of volume is illustrated in Fig. 4(C). We apply the 2nd order Birch–Murnaghan equation of state (BM2-EoS) to fit the experimental results (gray solid line in Fig. 4(C)). We observe that the bulk modulus undergoes a discontinuity at high pressures with K0 changing from 54(2) GPa (in the lower pressure range) to 184(12) GPa (higher pressure range). These findings suggest that two contraction processes occur within high-pressure BiOCl structure, which is consistent with the characteristics of isostructural phase transition.35 Therefore, although no first-order structural phase transition was triggered by pressure, an isostructural phase transition leads to a significant enhancement of the lattice rigidity in BiOCl. For clarity, based on the variation in compressibility, we have divided the entire compression process into three stages as indicated by the gay dash line in Fig. 4: the low-pressure phase, crossover stage and high-pressure phase. Additionally, the pressure turning points in these three regions align closely with turning points in bad-gap changes, suggesting that the isostructural phase transition may induce the discontinuity in the evolution of band structure.
Fig. 4. (A) 1D Synchrotron XRD patterns of BiOCl nanosheets at different pressures. (B) Normalized compression ratio of a (red open symbols) and c (blue solid symbols) axis (a0 and c0 represent the lattice parameters of the unit cell at 0.3 GPa). The solid gray lines are guides to the eye. In the low-pressure phase, the compression of the unit cell is anisotropic with the compressibility of c almost twice that of the a; however, in the high-pressure phase, the compression of the unit cell is isotropic. (C) Experimental volume evolution with pressure. The determined equations of state (gray solid lines) by the 2nd order Birch–Murnagham equation of state (BM2-EoS). V0 and K0 correspond volume and bulk modulus at ambient condition, respectively. An isostructural phase transition was observed and associated with bulk modulus increased from 54(2) to 184(12) GPa.
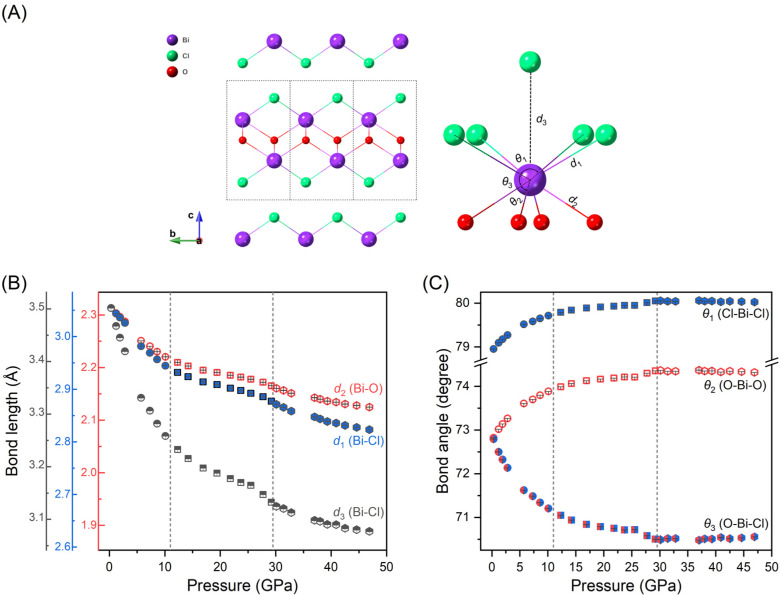
We also analyzed the bond lengths and bond angles evolution of BiOCl under compression, which are important parameters affecting the orbital coupling. Fig. 5(A) illustrates the layered structure of BiOCl with the analyzed bond lengths and angles indicated. The parameters d1 and d2 represent the intralayer bonds of Bi–Cl and Bi–O respectively; while d3 denotes an interlayer virtual Bi–Cl bond. Angles of θ1, θ2 and θ3 represent the intralayer bond angles of Cl–Bi–Cl, O–Bi–O and Cl–Bi–O, respectively. The bond lengths in dependence with pressure is depicted in Fig. 5(B). To compare the compressibility of different chemical bonds, we plotted the bond lengths using consistent relative values. As shown in Fig. 5(B), the bond lengths exhibit a similar discontinuous decrease to lattice parameters under high-pressure. We also notice that, while the two intralayer chemical bonds, Bi–Cl and Bi–O, exhibits only subtle difference, there is a significant variation compressibility observed for the interlayer virtual bond Bi–Cl at the initial compression. Fig. 5(C) displays the bond angles evolution of Cl–Bi–Cl, O–Bi–O and O–Bi–Cl under high-pressure. As pressure increases, the in-plan bond angles of Cl–Bi–Cl, O–Bi–O become broad while the out-of-plan band angle of O–Bi–Cl becomes narrow until exceeding 30 GPa, after which each angle remains almost constant. We also compared our results with previous study23 (as shown in Fig. 1S and 2S†) and observed deviations at high pressures, likely due to the pressure gradient within the sample chamber when pressures exceed 10 GPa.
Fig. 5. (A) Schematic illustrations of band angles and bond lengths of BiOCl. (B) Evolution of Bi–O and Bi–Cl bond lengths under compression. The relative values of the right and left axes are consistent. (C) Bond angles evolution of Cl–Bi–Cl, O–Bi–O and O–Bi–Cl, respectively. With pressure increasing, the in-plane bond angles of Cl–Bi–Cl and O–Bi–O increases, while the out-of-plane bond angle decreases.
Conclusions
In summary, this study investigates the structural and electronic properties of van der Waals BiOCl nanosheets under high-pressure conditions, demonstrating that pressure is an effective method for band-gap engineering in BiOCl. Our findings reveal a significant narrowing of the band gap, from 3.44 eV to 2.81 eV, as pressure increases from 0.4 to 44 GPa, enhancing the material's potential for visible light utilization to realize practical implications, though it does not yet reach the threshold for visible light sensitivity. Raman and X-ray diffraction analyses indicate that BiOCl undergoes an isostructural phase transition under compression, while the lattice parameters and chemical bonds compressibility shift from anisotropic to isotropic. Notably, the increased rigidity and modified bond angles suggest enhanced atomic interactions under high pressure. These insights not only improve our understanding of the fundamental properties of BiOCl nanosheets but also underscore the significance of high-pressure techniques in optimizing the photocatalytic performance to realize practical implications.
Data availability
The data that support the findings of this study are available from the corresponding authors upon reasonable request.
Author contributions
Y. Dan and M. Ye: data curation, methodology, validation, writing – review & editing. W. Dong: conceptualization, data curation, formal analysis, methodology, writing – original draft, writing: review & editing. Y. Yao, M. Lian and M. Du: writing – review & editing. S. Ma: conceptualization, methodology, validation, funding acquisition, investigation, writing – review (equal) & editing (equal). X. Li and T. Cui: project administration, resources, supervision, writing – review & editing.
Conflicts of interest
There are no conflicts to declare.
Supplementary Material
Acknowledgments
The authors acknowledge financial supports National Key Research and Development Program of China (No. 2023YFA1608902, No. 2020YFA0406101) and National Natural Science Foundation of China (No. 12204254), Program for Science and Technology Innovation Team in Zhejiang (2021R01004), Natural Science Foundation of Zhejiang Province, China (Grant No. LQ23A040005), the National Major Science Facility Synergetic Extreme Condition User Facility Achievement Transformation Platform Construction (2021FGWCXNLJSKJ01) and the Open Project of State Key Laboratory of Superhard Materials (Jilin University, 202311). The authors thank the BL15U1 at Shanghai Synchrotron Radiation Facility (SSRF).
Electronic supplementary information (ESI) available. See DOI: https://doi.org/10.1039/d4ra07692c
References
- Ma W. Wang H. Yu W. Wang X. Xu Z. Zong X. Li C. Angew Chem. Int. Ed. Engl. 2018;57:3473–3477. doi: 10.1002/anie.201713029. [DOI] [PubMed] [Google Scholar]
- Fang S. Rahaman M. Bharti J. Reisner E. Robert M. Ozin G. A. Hu Y. H. Nat. Rev. Methods Primers. 2023;3:61. [Google Scholar]
- Nishioka S. Osterloh F. E. Wang X. Mallouk T. E. Maeda K. Nat. Rev. Methods Primers. 2023;3:42. [Google Scholar]
- Kumar P. Laishram D. Sharma R. K. Vinu A. Hu J. Kibria M. G. Chem. Mater. 2021;33:9012–9092. [Google Scholar]
- Shi Y. Li J. Mao C. Liu S. Wang X. Liu X. Zhao S. Liu X. Huang Y. Zhang L. Nat. Commun. 2021;12:5923. doi: 10.1038/s41467-021-26219-6. [DOI] [PMC free article] [PubMed] [Google Scholar]
- Chen X. Pan W. Guo R. Hu X. Bi Z. Wang J. J. Mater. Chem. A. 2022;10:7604–7625. [Google Scholar]
- Duong D. L. Yun S. J. Lee Y. H. ACS Nano. 2017;11:11803–11830. doi: 10.1021/acsnano.7b07436. [DOI] [PubMed] [Google Scholar]
- Zhang K. Liu C. Huang F. Zheng C. Wang W. Appl. Catal., B. 2006;68:125–129. [Google Scholar]
- Lei Y. Wang G. Song S. Fan W. Zhang H. J. C. CrystEngComm. 2009;11:1857–1862. [Google Scholar]
- Keramidas K. G. Voutsas G. P. Rentzeperis P. I. Z. Kristallogr. – Cryst. Mater. 1993;205:35–40. [Google Scholar]
- Myung Y. Wu F. Banerjee S. Park J. Banerjee P. Chem. Commun. 2015;51:2629–2632. doi: 10.1039/c4cc09295c. [DOI] [PubMed] [Google Scholar]
- Lu J. Zhou W. Zhang X. Xiang G. J. Phys. Chem. Lett. 2020;11:1038–1044. doi: 10.1021/acs.jpclett.9b03575. [DOI] [PubMed] [Google Scholar]
- Zhang N. Li L. Shao Q. Zhu T. Huang X. Xiao X. ACS Appl. Energy Mater. 2019;2:8394–8398. [Google Scholar]
- Zulkiflee A. Khan M. M. Khan A. Khan M. Y. Dafalla H. D. M. Harunsani M. H. Heliyon. 2023;9:e21270. doi: 10.1016/j.heliyon.2023.e21270. [DOI] [PMC free article] [PubMed] [Google Scholar]
- Yang X. Habib H. Yang H. Rehman Z. U. Zhang Y. Xu X. Wang X. Zheng K. Hou J. ACS Sustain. Chem. Eng. 2024;12:11308–11318. [Google Scholar]
- Cui D. Wang L. Xu K. Ren L. Wang L. Yu Y. Du Y. Hao W. J. Mater. Chem. A. 2018;6:2193–2199. [Google Scholar]
- Kang L. Yu X. Zhao X. Ouyang Q. Di J. Xu M. Tian D. Gan W. Ang C. C. I. Ning S. Fu Q. Zhou J. Kutty R. G. Deng Y. Song P. Zeng Q. Pennycook S. J. Shen J. Yong K.-T. Liu Z. InfoMat. 2020;2:593–600. [Google Scholar]
- Tian J. Chen Z. Jing J. Feng C. Sun M. Li W. Mater. Lett. 2020;272:127860. [Google Scholar]
- Sun X. Shi L. Bai Q. Yin Z. Song H. Qu X. Appl. Surf. Sci. 2022;587:152633. [Google Scholar]
- Razavi-Khosroshahi H. Edalati K. Wu J. Nakashima Y. Arita M. Ikoma Y. Sadakiyo M. Inagaki Y. Staykov A. Yamauchi M. Horita Z. Fuji M. J. Mater. Chem. A. 2017;5:20298–20303. [Google Scholar]
- Errandonea D. Bandiello E. Segura A. Hamlin J. J. Maple M. B. Rodriguez-Hernandez P. Muñoz A. J. Alloys Compd. 2014;587:14–20. [Google Scholar]
- Xu Z. Li H. Hu S. Zhuang J. Du Y. Hao W. Phys. Status Solidi RRL. 2019;13:1800650. [Google Scholar]
- Zhao J. Xu L. Liu Y. Yu Z. Li C. Wang Y. Liu Z. J. Phys. Chem. C. 2015;119:27657–27665. [Google Scholar]
- Toby B. H. Von Dreele R. B. J. Appl. Crystallogr. 2013;46:544–549. [Google Scholar]
- Klotz S. Chervin J. C. Munsch P. Le Marchand G. J. Phys. D: Appl. Phys. 2009;42:075413. [Google Scholar]
- Mao H. K. Xu J. Bell P. M. J. Geophys. Res.: Solid Earth. 1986;91:4673–4676. [Google Scholar]
- Fei Y. Ricolleau A. Frank M. Mibe K. Shen G. Prakapenka V. Proc. Natl. Acad. Sci. U.S.A. 2007;104:9182–9186. doi: 10.1073/pnas.0609013104. [DOI] [PMC free article] [PubMed] [Google Scholar]
- Zhang L. Yan S. Jiang S. Nucl. Sci. Tech. 2015;26:060101. [Google Scholar]
- Prescher C. Prakapenka V. B. High Pressure Res. 2015;35:223–230. [Google Scholar]
- Birch F. Phys. Rev. 1947;71:809–824. [Google Scholar]
- Gonzalez-Platas J. Alvaro M. Nestola F. Angel R. J. Appl. Crystallogr. 2016;49:1377–1382. doi: 10.1107/S1600576721009092. [DOI] [PMC free article] [PubMed] [Google Scholar]
- Makuła P. Pacia M. Macyk W. J. Phys. Chem. Lett. 2018;9:6814–6817. doi: 10.1021/acs.jpclett.8b02892. [DOI] [PubMed] [Google Scholar]
- Garg A. B. Vie D. Rodriguez-Hernandez P. Muñoz A. Segura A. Errandonea D. J. Phys. Chem. Lett. 2023;14:1762–1768. doi: 10.1021/acs.jpclett.3c00020. [DOI] [PMC free article] [PubMed] [Google Scholar]
- Kroumova E. Aroyo M. Perez-Mato J. Kirov A. Capillas C. Ivantchev S. Phase Transitions. 2003;76:155–170. [Google Scholar]
- Liang A. Popescu C. Manjon F. J. Turnbull R. Bandiello E. Rodriguez-Hernandez P. Muñoz A. Yousef I. Hebboul Z. Errandonea D. J. Phys. Chem. C. 2021;125:17448–17461. [Google Scholar]
Associated Data
This section collects any data citations, data availability statements, or supplementary materials included in this article.
Supplementary Materials
Data Availability Statement
The data that support the findings of this study are available from the corresponding authors upon reasonable request.


