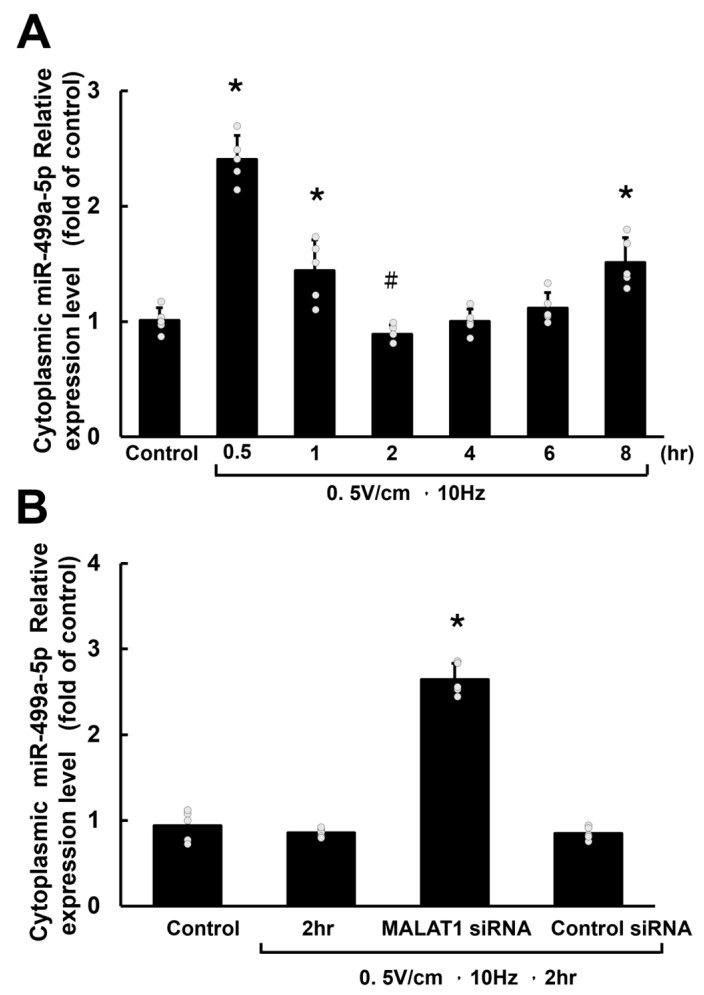
Figure 2.
Cytoplasmic miR-499-5p expression in HCF-aa under RES. (A) Time course of relative cytoplasmic miR-499a-5p expression levels in HCF-aa subjected to RES for 0.5 to 8 h. The control group was cultured for 8 h without RES. (B) Representative cytoplasmic miR-499a-5p expression under various experimental conditions in HCF-aa subjected to RES. Data represent mean ± SEM from three independent experiments (n = 5 per group). * p < 0.001 vs. control group; # p < 0.001 vs. RES group for 0.5 hours.

