Abstract
Background/Objectives: Artificial Intelligence (AI) in healthcare employs advanced algorithms to analyze complex and large-scale datasets, mimicking aspects of human cognition. By automating decision-making processes based on predefined thresholds, AI enhances the accuracy and reliability of healthcare data analysis, reducing the need for human intervention. Schizophrenia (SZ), a chronic mental health disorder affecting millions globally, is characterized by symptoms such as auditory hallucinations, paranoia, and disruptions in thought, behavior, and perception. The SZ symptoms can significantly impair daily functioning, underscoring the need for advanced diagnostic tools. Methods: This systematic review has been conducted following the PRISMA (Preferred Reporting Items for Systematic Reviews and Meta-Analyses) 2020 guidelines and examines peer-reviewed studies from the last decade (2015–2024) on AI applications in SZ detection as well as classification. The review protocol has been registered in the International Prospective Register of Systematic Reviews (PROSPERO) under registration number: CRD42024612364. Research has been sourced from multiple databases and screened using predefined inclusion criteria. The review evaluates the use of both Machine Learning (ML) and Deep Learning (DL) methods across multiple modalities, including Electroencephalography (EEG), Structural Magnetic Resonance Imaging (sMRI), and Functional Magnetic Resonance Imaging (fMRI). The key aspects reviewed include datasets, preprocessing techniques, and AI models. Results: The review identifies significant advancements in AI methods for SZ diagnosis, particularly in the efficacy of ML and DL models for feature extraction, classification, and multi-modal data integration. It highlights state-of-the-art AI techniques and synthesizes insights into their potential to improve diagnostic outcomes. Additionally, the analysis underscores common challenges, including dataset limitations, variability in preprocessing approaches, and the need for more interpretable models. Conclusions: This study provides a comprehensive evaluation of AI-based methods in SZ prognosis, emphasizing the strengths and limitations of current approaches. By identifying unresolved gaps, it offers valuable directions for future research in the application of AI for SZ detection and diagnosis.
Keywords: schizophrenia detection, machine learning, EEG signals, MRI scans, deep learning, artificial intelligence, systematic review
1. Introduction
Schizophrenia (SZ), being a psychiatric condition, is noted for its deficits and distortions in feelings, behavior, thought, communication, and cognitive functions [1,2,3,4]. It is a psychological condition which impacts approximately 20 million individuals globally. It involves aberrant brain growth, resulting in symptoms such as paranoia and hearing unusual voices [5,6]. Individuals with SZ are more prone to experiencing premature death compared to healthy individuals, owing to the high prevalence of medical conditions. SZ impacts both genders, although evidence shows that males might develop the condition at an earlier age. Experts are investigating genetics and modern tools to understand the brain’s structure [7,8,9,10].
A competent psychiatrist diagnoses SZ based on the signs and diagnostic assessments to understand the individual’s background and state of mind [11]. New antipsychotic medications have not improved recovery rates, indicating that their efficacy remains stable [12]. Neuroimaging can aid clinicians in early illness diagnosis [13]. Recent research has used neuroscience and neuroimaging approaches, along with ML and DL, to automate the diagnosis of SZ [14,15,16].
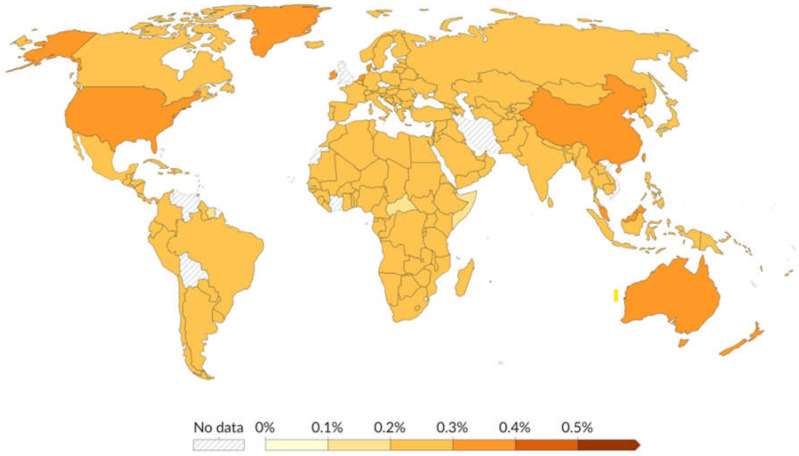
The world map in Figure 1 depicts the global burden of schizophrenia in 2021, highlighting the necessity for focused healthcare efforts in areas with greater prevalence rates [17]. The color gradient, which runs from bright yellow to dark orange, indicates the rising prevalence of schizophrenia, with deeper colors signifying higher rates. Many nations, including the majority of countries in Africa, South America, Europe, and Asia, have prevalence rates of 0.2% to 0.3%. Countries such as Australia, China, and the United States have a prevalence of 0.3% to 0.4%. India is tinted in mild orange, indicating a prevalence rate of 0.2% to 0.3%.
Figure 1.
The projected rate of schizophrenia among a population of 100 individuals, adjusted for age, in the year 2021 (taken from [17]).
There are two types of neuroimaging studies used for diagnosing SZ: structural and functional [18]. Neuroimaging can help detect and diagnose psychotic illnesses, which are caused by aberrant brain structure and function [19]. Neuroimaging of brain structure comprises structural magnetic resonance imaging (sMRI) and diffusion tensor imaging (DTI). The investigations examine brain tissues (gray matter (GM), white matter (WM), and cerebrospinal fluid (CSF)) to identify abnormalities. However, the imaging of brain activity comprises electroencephalography (EEG) [20], magnetoencephalography (MEG) [21], functional magnetic resonance imaging (fMRI) [22], and functional near-infrared spectroscopy (fNIRS) [23].
EEG signals can detect and record minute changes in electrical activity in the brain, revealing important information about brain function [24]. EEG is less costly than are other neuroimaging procedures such as MRI or positron emission tomography (PET). EEG is easily accessible and non-invasive. EEG has high temporal resolution, collecting brain activity in real time [1,4]. EEG is more practicable for clinical usage. EEG signals can be accessed from high-quality open databases. EEG data can be used to detect SZ automatically using ML techniques. EEG has the ability to reveal underlying neurophysiological abnormalities linked with SZ. However, interpreting EEG data is difficult due to its large dimensionality and the delicate nature of the disorder-related signal alterations [25,26,27].
An sMRI scan assesses the brain’s anatomical features by analyzing its structure and connectivity. sMRI scans can reveal brain injury and abnormalities. They analyze GM and WM volume, as well as brain structure size, integrity, and shape [28]. fMRI is another commonly utilized technique for diagnosing SZ. fMRI records variations in the flow of blood to identify the regions of the brain responsible for vital processes. This approach operates on the principle that active brain areas experience increased blood flow. [29]. SZ is primarily caused by structural and functional brain abnormalities according to research [30]. SZ is associated with larger ventricles caused by GM deficiency [31]. Research suggests that cortical thickness decreases throughout normal childhood brain development and continues to decrease throughout adolescence and age [32].
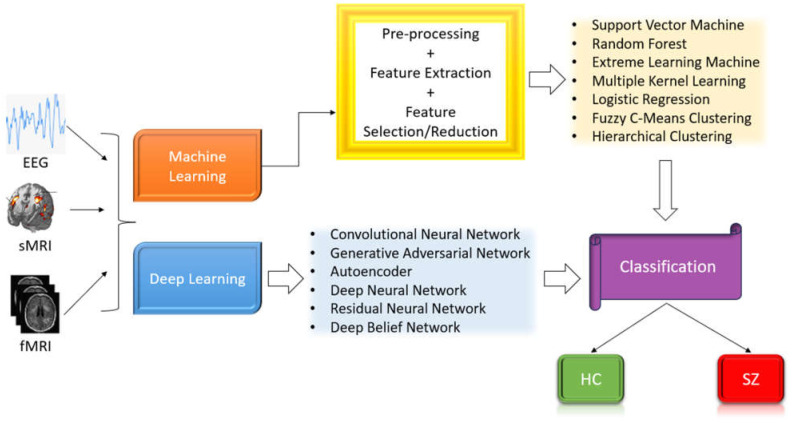
AI research focuses on creating intelligent machines capable of solving complex issues [33,34,35]. ML, a subset of AI, addresses prognosis, categorization, and modeling systems [36,37,38]. DL is a specific branch within the broader field of ML which collects information from big datasets, mimicking the human brain. During the last decade, high-performing classifiers were constructed for SZ diagnosis, with significant success [39]. DL models, particularly those based on convolutional neural networks (CNNs), are increasingly being used for extracting features and recognizing patterns of EEG data. These models have demonstrated outstanding ability to discover complicated patterns in huge datasets, making them ideal for biomedical applications [40,41,42]. Figure 2 illustrates the categorization of SZ and healthy controls (HC) utilizing ML and DL techniques applied to various imaging modalities.
Figure 2.
SZ diagnosis utilizing ML and DL techniques.
Motivation of the Present Survey
SZ is a complicated mental condition that necessitates interdisciplinary research involving neuroscience, psychology, psychiatry, and data science. This study’s goal was to synthesize findings from these several domains to provide a comprehensive picture of the advances in this sector. Over the past decade, there have been substantial technological developments and increased use of neuroimaging methods. This research helps us to understand how these advancements have helped to improve the diagnosis and classification of SZ. The survey aimed to assess various neuroimaging techniques (EEG, sMRI, and fMRI) in terms of efficacy, accuracy, and therapeutic applicability. This comparison can aid in finding the most successful approaches for various areas of SZ diagnosis. This work also identified gaps in current research and approaches by examining the existing literature. This can help to shape future research areas and increase the efficacy of SZ detection and categorization. Table 1 compares our survey study to other significant surveys on SZ diagnosis, including their limitations. We developed a new survey to address the research gaps identified in Table 1. The survey’s key contributions are noted below.
This survey includes all significant research papers published on SZ diagnosis between the year 2015 and 2024;
It provides an overview of SZ diagnostic methods, including ML and DL approaches;
It includes commonly utilized SZ datasets for both detection and classification purposes;
It also provides a critical overview of the existing approaches for SZ diagnosis;
The article concludes by analyzing future research opportunities in the topic.
Table 1.
A basic review of prior surveys on SZ diagnosis and the present survey.
| Work | Dataset Description | EEG Modality | MRI Modality | ML Techniques | DL Techniques | Detailed Critical Analysis | Drawbacks |
|---|---|---|---|---|---|---|---|
| Rahul et al. [43]—2024 | ✔ | ✔ | ✔ | Dataset description is absent. Does not cover MRI-based publications. Does not provide detailed critical review. |
|||
| Ranjan et al. [25]—2024 | ✔ | ✔ | ✔ | ✔ | Does not cover MRI-based publications. ML-based approaches are not discussed. |
||
| Voineskos et al. [44]—2024 | ✔ | ✔ | ✔ | Dataset description is absent. Does not cover EEG-based publications. DL-based approaches are not discussed. |
|||
| Jafari et al. [45]—2023 | ✔ | ✔ | ✔ | ✔ | ✔ | Does not cover MRI-based publications. | |
| Verma et al. [46]—2023 | ✔ | ✔ | ✔ | ✔ | ✔ | Dataset description is brief. Does not provide detailed critical review. |
|
| J.A. Cortes-Briones et al. [47]—2022 | ✔ | ✔ | ✔ | Dataset description is absent. ML-based approaches are not discussed. Does not provide detailed critical review. |
|||
| Sadeghi et al. [48]—2022 | ✔ | ✔ | ✔ | ✔ | Dataset description is absent. Does not cover EEG-based publications. |
||
| Barros et al. [49]—2021 | ✔ | ✔ | ✔ | ✔ | Dataset description is absent. Does not cover MRI-based publications. |
||
| Luján et al. [50]—2021 | ✔ | ✔ | Dataset description is absent. Does not cover MRI-based publications. DL-based approaches are not discussed. Does not provide detailed critical review. |
||||
| Lai et al. [51]—2021 | ✔ | ✔ | ✔ | Dataset description is absent. DL-based approaches are not discussed. Does not provide detailed critical review. |
|||
| Steardo Jr. et al. [52]—2020 | ✔ | ✔ | Dataset description is absent. Does not cover EEG-based publications. DL-based approaches are not discussed. Does not provide detailed critical review. |
||||
| de Filippis et al. [53]—2019 | ✔ | ✔ | Dataset description is absent. Does not cover EEG-based publications. DL-based approaches are not discussed. Does not provide detailed critical review. |
||||
| Proposed Survey—2024 |
✔ | ✔ | ✔ | ✔ | ✔ | ✔ | - |
The following portions of the paper are arranged as follows: Section 2 provides the statistical findings of our reviewed literature. Section 3 provides the publicly available datasets. Section 4 provides the state-of-the-art methods along with all major research publications between the year 2015 and 2024. Section 5 outlines a critical review of existing approaches. Section 6 concludes the paper and outlines the research prospects. Figure 3 illustrates our survey’s brief workflow.
Figure 3.
Flow chart of the proposed survey on the automatic detection of SZ.
2. Materials and Methods
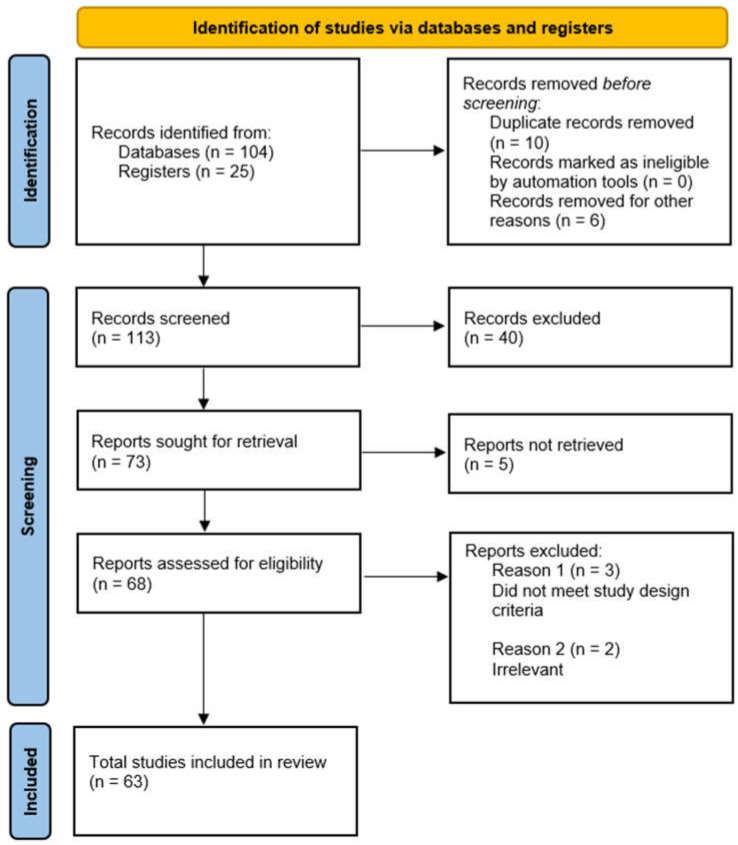
A systematic review of research papers was conducted using key terms such as “Schizophrenia”, “Artificial Intelligence”, “Machine Learning”, “Deep Learning”, “EEG”, “CWT”, “sMRI”, “fMRI”, and their variants. The literature was assessed for relevance before inclusion in the review. This systematic review was conducted in accordance with the PRISMA (Preferred Reporting Items for Systematic Reviews and Meta-Analyses) 2020 guidelines to ensure transparent and comprehensive reporting of the review process and findings. We used the PRISMA 2020 checklist [54] when writing our report, which is provided in the Supplementary Materials along with the manuscript. The review protocol was registered in the International Prospective Register of Systematic Reviews (PROSPERO) [55] under registration number: CRD42024612364. The flow diagram in Figure 4 illustrates the systematic screening process. A total of 129 records were initially identified from databases (104 records) and registers (25 records). Sixteen records were removed before screening. This included 10 duplicate records and 6 records removed for other reasons. After the initial removal, 113 records were screened for relevance to the review topic. Forty records were excluded based on predefined criteria at this screening stage. From the screened records, 73 reports were identified for further retrieval. Five reports could not be retrieved due to accessibility issues. Sixty-eight reports were evaluated in more detail for eligibility. Five reports were excluded at this stage, with the reasons being that these studies did not meet the required study design criteria (n = 3) and that these studies were deemed irrelevant to the research question (n = 2). After this process, a total of 63 studies met all criteria and were included in the final review.
Figure 4.
PRISMA 2020 flow diagram for selecting appropriate literature on the automatic detection of SZ.
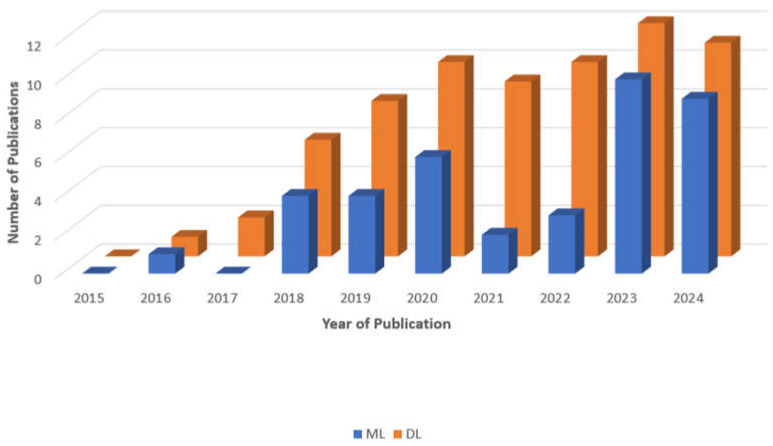
This study aimed to investigate AI strategies for SZ diagnosis utilizing EEG, sMRI, and fMRI. This survey will provide SZ scientists with information on the latest breakthroughs relevant to the diagnosis of SZ. Figure 5 displays the number of publications (both journals and conferences) on SZ diagnosis with ML or DL approaches published from 2015 to 2024. Out of 108 research publications (which may not be a comprehensive list), 39 were based on ML methods and 69 were based on DL models.
Figure 5.
A bar graph depicting the number of articles related to the diagnosis of SZ with ML and DL methodologies published during the past decade. This is a non-exhaustive list of publications.
3. Available Datasets
This section discusses the openly accessible datasets for SZ. The SZ dataset includes neuroimaging modalities used to detect the condition. EEG, sMRI, and fMRI are commonly utilized modalities for SZ research. Openly accessible datasets relevant to SZ diagnosis include COBRE [56], RepOD [57], NUSDAST [58], UCLA [59], SchizConnect [60], MCIC [61], MLSP2014 [62], MSU [63], and FBIRN [64], as described further. Table 2 provides a summary of all the freely available datasets used for SZ diagnosis.
Table 2.
Particulars of publicly accessible datasets for SZ diagnosis.
| Dataset | Publisher | Modality | Number of Samples | Sample Diversity | Data Collection Biases | Download Link |
|---|---|---|---|---|---|---|
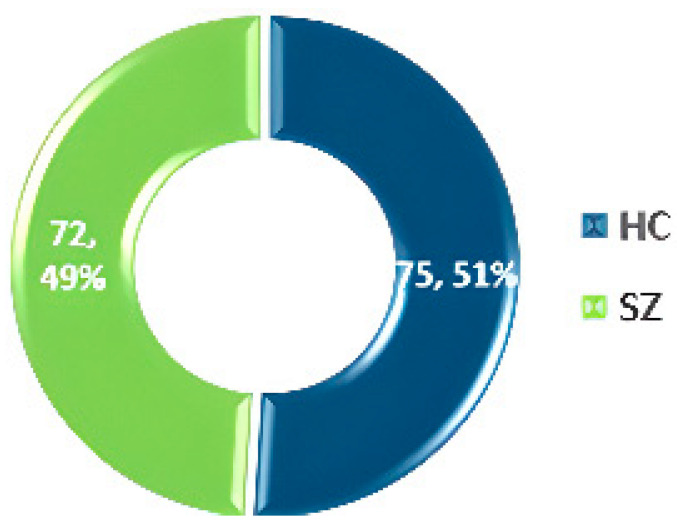
| COBRE [56]—2012 | Mind Research Network and the University of New Mexico | sMRI and fMRI | SZ = 72 HC = 75 |
Primarily U.S.-based, limited demographic diversity (age 18–65) | Demographic homogeneity, exclusion of comorbid conditions, institutional differences | http://fcon_1000.projects.nitrc.org/indi/retro/cobre.html (accessed on 20 July 2024) |
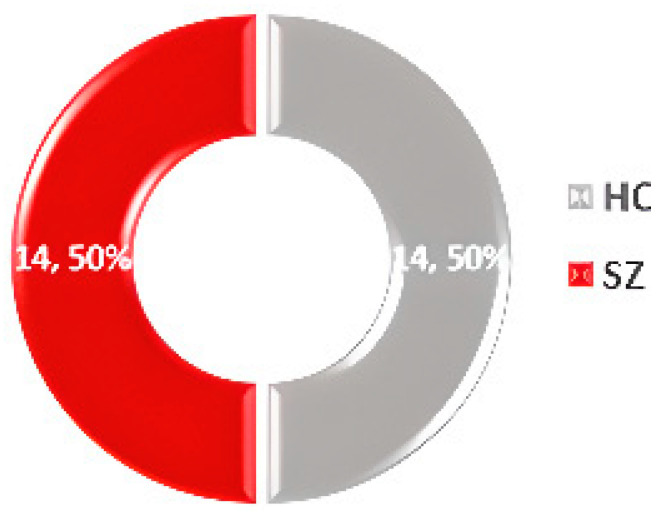
| RepOD [57]—2017 | Institute of Psychiatry and Neurology in Warsaw, Poland | EEG | SZ = 14 HC = 14 |
Focused on paranoid schizophrenia subtype | Exclusion of other psychiatric disorders | https://repod.icm.edu.pl/dataset.xhtml?persistentId=doi:10.18150/repod.0107441 (accessed on 15 September 2023) |
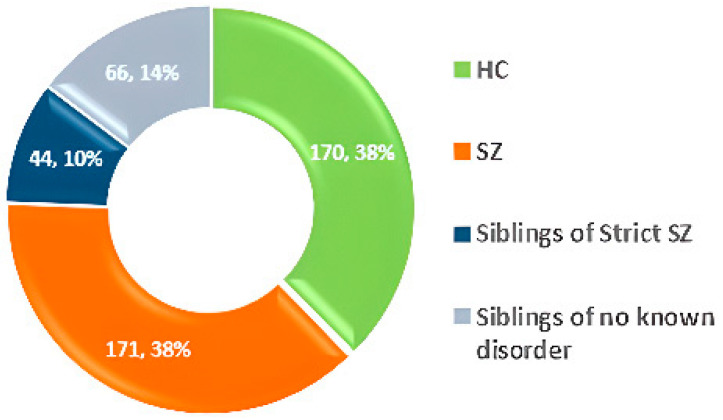
| NUSDAST [58]—2015 | National University of Singapore (NUS) | sMRI | SZ = 171 HC = 170 Strict SZ = 44 No disorder = 66 |
Mixed demographics | Potential institutional bias, overrepresentation of certain clinical subtypes | https://sites.wustl.edu/oasisbrains/central-xnat/ (accessed on 22 July 2024) |
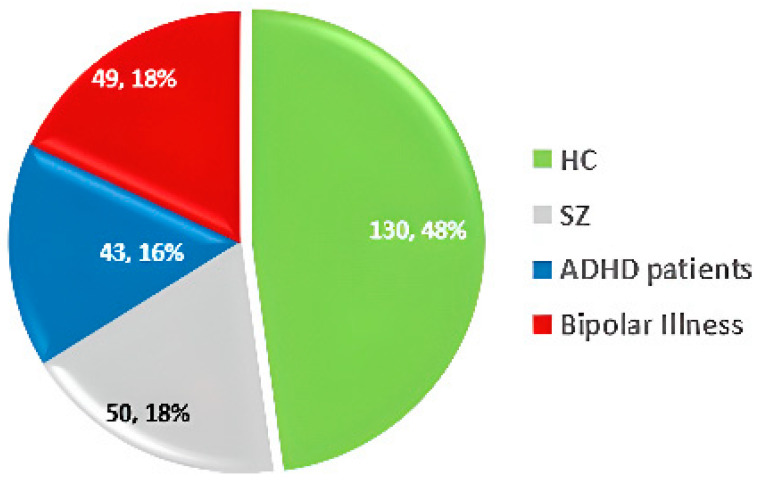
| UCLA [59]—2013 | OpenfMRI project | sMRI and fMRI and DWI | SZ = 50 HC = 130 Patients with ADHD = 43 Bipolar illness = 49 |
Diverse group covering SZ, bipolar disorder, ADHD, and HC | Possible overrepresentation of specific disorders (SZ, bipolar), lack of detailed demographic data. | https://openfmri.org/dataset/ds000030/ (accessed on 22 July 2024) |
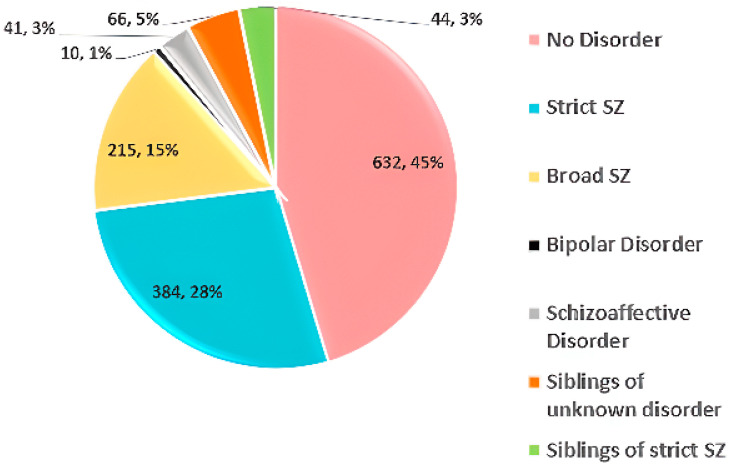
| SchizConnect [60]—2015 | SchizConnect consortium | sMRI and fMRI | No disorder = 632 Strict SZ = 384 Broad SZ = 215 Bipolar disorder = 10 Schizoaffective disorder = 41 Siblings of unknown disorder = 66 Siblings of strict SZ = 44 |
Diverse diagnostic groups, limited demographic details | Overrepresentation of certain diagnostic groups (strict SZ, broad SZ), potential selection bias from varied data sources | http://www.schizconnect.org/ (accessed on 22 July 2024) |
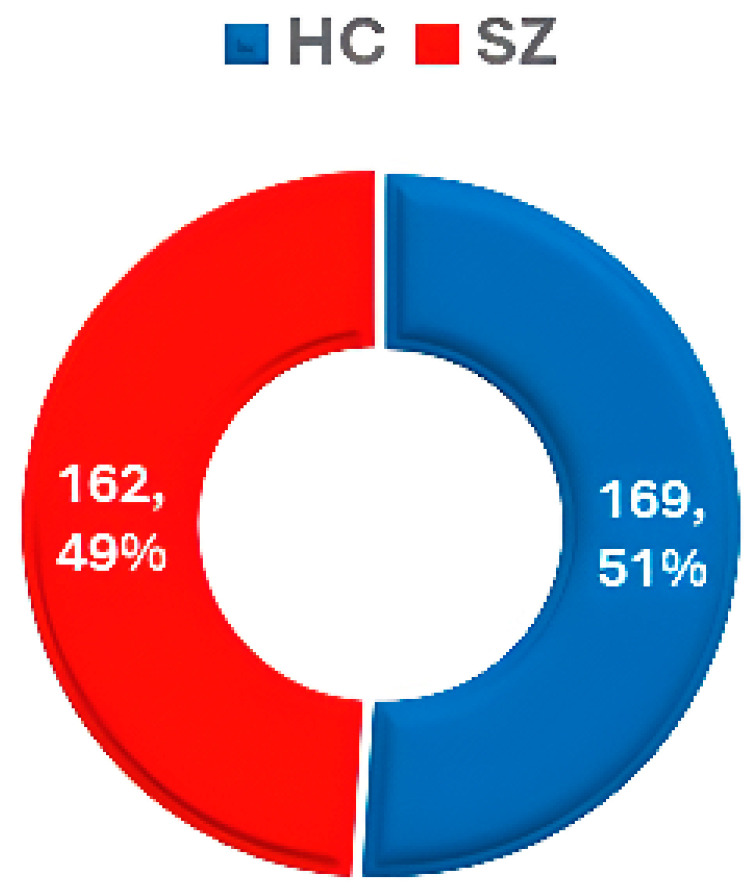
| MCIC [61]—2013 | Mind Research Network (MRN) | sMRI and fMRI and DWI | SZ = 162 HC = 169 |
Wide age range, limited to specific geographic and clinical settings | Potential bias due to geographic focus | https://www.nitrc.org/projects/mcic/ (accessed on 20 July 2024) |
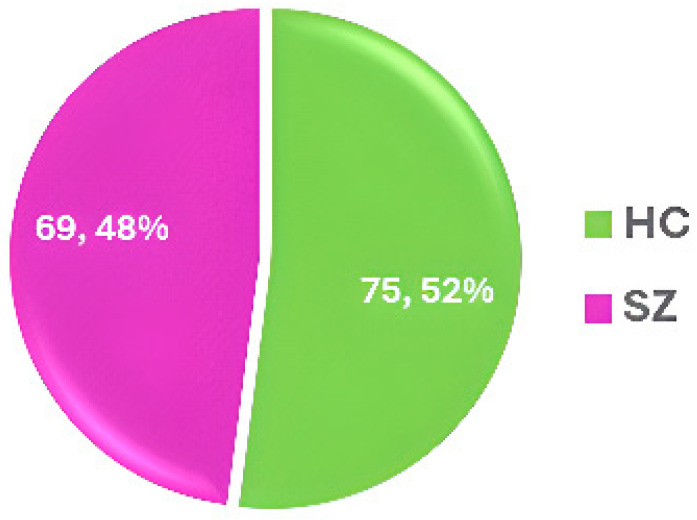
| MLSP2014 [62]—2014 | IEEE | sMRI and fMRI | SZ = 69 HC = 75 |
Limited demographic variation | Potential bias from focus on structural and functional brain features | https://www.kaggle.com/c/mlsp-2014-mri (accessed on 20 July 2024) |
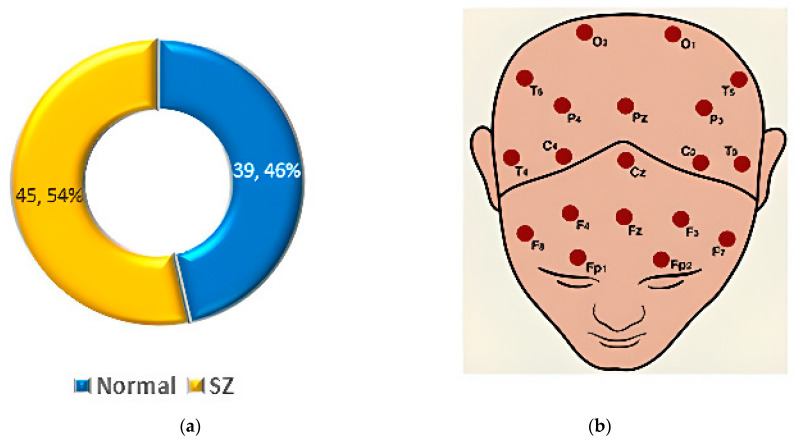
| MSU [63]—2017 | Lomonosov Moscow State University | EEG | SZ = 45 HC = 39 |
Specific to age group, limited broader representation | Age-specific focus (adolescents) | http://brain.bio.msu.ru/eeg_schizophrenia.htm (accessed on 15 September 2023) |
| Phase II of FBIRN [64]—2007 | FBIRN consortium | fMRI | SZ = 87 HC = 85 |
Moderate diversity, spanning ages 18–70 years, limited geographic representation | Potential overrepresentation of specific SZ subtypes, age-related bias | https://www.ncbi.nlm.nih.gov/pmc/articles/PMC4651841/ (accessed on 23 July 2024) |
| Phase III of FBIRN [64]—2007 | SZ = 176 HC = 186 |
Broader sample with similar age range (18–70 years), limited demographic diversity | Potential selection bias due to specific inclusion criteria |
3.1. COBRE
The Center for Biomedical Research Excellence (COBRE) [56] conducted fMRI on 147 volunteers, comprising 72 SZ patients and 75 HC aged 18–65. The dataset includes phenotypic details such as handedness, age, diagnosis, and gender. The dataset statistics are shown in Figure 6.
Figure 6.
Data statistics of the COBRE dataset [55].
3.2. RepOD
The Repository for Open Data (RepOD) [57] offers an EEG dataset from Olejarczyk and Jernajczyk’s study [65], containing data from 14 paranoid SZ patients and 14 HC, including 14 men and 14 women aged 18 or older. The data were collected using 19 EEG channels with a sampling frequency of 250 Hz. The dataset statistics are shown in Figure 7.
Figure 7.
Data statistics of the RepOD dataset [57].
3.3. NUSDAST
The Northwestern University Schizophrenia Data and Software Tool (NUSDAST) [58] includes MRI brain imaging data from over 450 participants, along with medical, hereditary, and psychological information. Dataset statistics are shown in Figure 8.
Figure 8.
Data statistics of the NUSDAST dataset [58].
3.4. UCLA
The UCLA dataset [59] includes sMRI, fMRI, and Diffusion-weighted imaging (DWI) data, along with phenotypic information. It comprises 50 SZ patients, 130 HC, 43 ADHD patients, and 49 individuals with bipolar disorder. Dataset statistics are shown in Figure 9.
Figure 9.
Data statistics of the UCLA dataset [59].
3.5. SchizConnect
SchizConnect [60] is a data repository combining brain imaging data relevant to schizophrenia from various sources. It includes 1392 subjects: 632 HC, 384 with strict SZ, 215 with broad SZ, 10 with bipolar disorder, 41 with schizoaffective disorder, 66 siblings with unknown disorders, and 44 siblings with strict SZ. Dataset statistics are shown in Figure 10.
Figure 10.
Data statistics of the SchizConnect dataset [60].
3.6. MCIC
The MCIC dataset [61] includes data from 162 SZ patients and 169 HC, along with demographic features such as sex and age group. Dataset statistics are shown in Figure 11.
Figure 11.
Data statistics of the MCIC dataset [61].
3.7. MLSP2014
The MLSP 2014 competition [62] used a dataset that includes structural morphometry and functional connectivity data from MRI scans of 69 SZ patients and 75 HCs. The dataset statistics are shown in Figure 12.
Figure 12.
Data statistics of the MLSP2014 dataset [62].
3.8. MSU
The dataset from M.V. Lomonosov Moscow State University (MSU) [63] includes EEG recordings from adolescents, divided into two groups: 39 HCs and 45 showing symptoms of SZ. The dataset statistics are shown in Figure 13a.
Figure 13.
(a) Data statistics of the MSU EEG dataset. (b) Topographical positions of channel numbers [63].
Each EEG file contains recordings from 16 channels, with EEG amplitudes (in µV) captured at a sampling rate of 128 Hz. Each file consists of 7680 samples per channel, corresponding to 1 min of data. The channels are T6, F3, O1, Pz, C4, T5, Cz, F8, P4, O2, P3, T3, F7, C3, T4, and F4, as shown in Figure 13b [63].
3.9. FBIRN
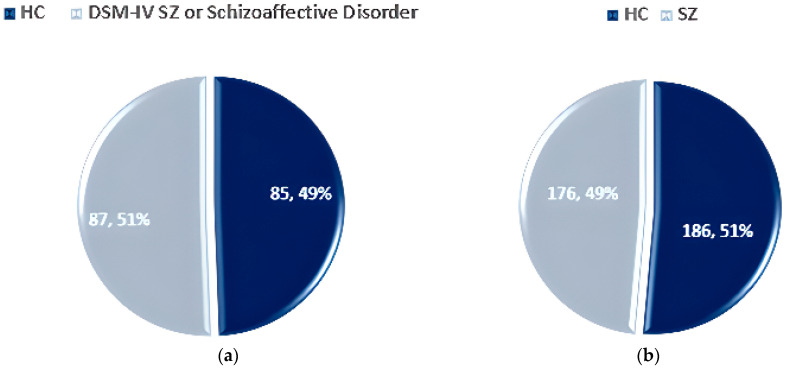
The FBIRN dataset [64] consists of three phases, with the 2nd and 3rd phases containing data on SZ individuals. Phase 2 includes 87 SZ patients and 85 HCs, aged 18–70 years. Phase 3 contains 176 SZ patients and 186 HCs. The dataset statistics for Phase II and Phase III are shown in Figure 14a and Figure 14b respectively.
Figure 14.
Data statistics of the FBIRN dataset: (a) Phase II and (b) Phase III [64].
4. Cutting-Edge Approaches and Results of SZ Diagnosis
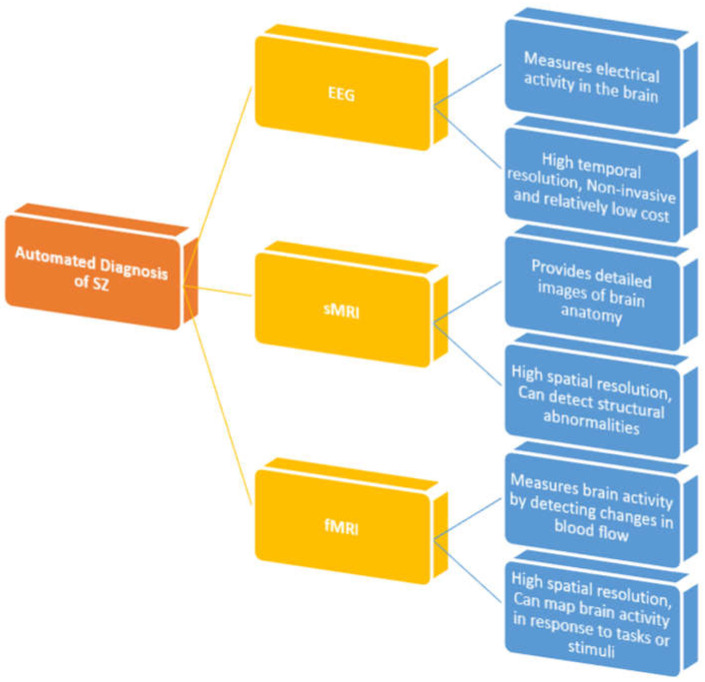
Several researches have employed AI to detect SZ utilizing EEG, sMRI, and fMRI modalities. Section 4.1, Section 4.2 and Section 4.3 cover the ML and DL approaches and the consequent outcomes of SZ diagnosis. Figure 15 shows the imaging techniques of the brain for automated SZ diagnosis.
Figure 15.
Taxonomy of neuroimaging modalities for SZ detection and classification.
4.1. EEG-Based Diagnosis of SZ
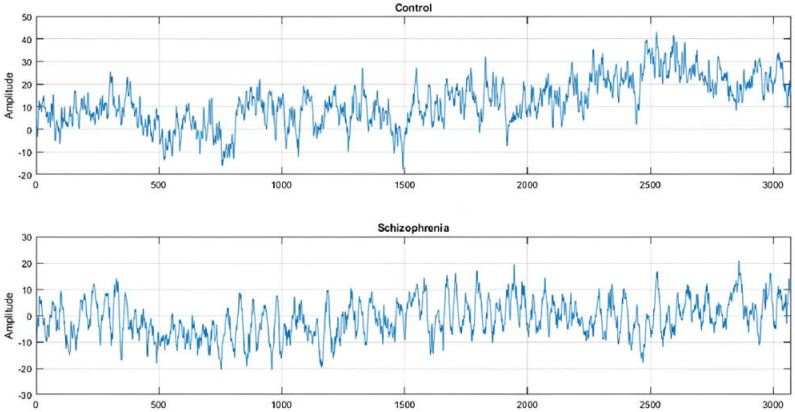
EEG signals have been shown to be effective in detecting SZ in clinical settings. EEG is a cost-effective and high-resolution diagnostic technique for a range of diseases [66]. CAD systems aid in the reliable diagnosis of SZ. ML approaches employing EEG signals have become increasingly popular for diagnosing mental diseases. Researchers have used DL models, such as CNN and LSTM, to improve SZ diagnosis. Figure 16 displays the EEG waveform obtained from the F7 electrode to distinguish between an SZ and HC individual [67]. The imbalance in wave amplitude is steady across the measurement. Lower amplitude signals are known to be aberrant or to indicate a psychotic condition.
Figure 16.
EEG signals of an HC and an SZ patient (obtained from [67]).
In recent years, there has been substantial research on detecting SZ using EEG signals. There are many datasets available publicly.
Using the Kaggle EEG dataset [68], Lei Zhang [69] developed an artificial neural network (ANN) design where EEG signals were recorded using event-related potential (ERP) corresponding to button press and audio tone playback. Five temporal features taken from EEG data, as well as two demographic features, were utilized to train and test the ANN. Following the wavelet transform of the ERP EEG signals for ANN classification, additional time–frequency features were recovered. The highest classification accuracy of more than 98.5% was achieved. These research findings indicate a significant potential for developing an accurate and subjective diagnosis tool for SZ based on EEG signals. Siuly et al. [70] investigated the use of deep residual networks (ResNet) to automatically detect SZ from EEG signals. The process included three major stages: the preprocessing of EEG signals using the average filtering approach to reduce noise, feature extraction where a deep ResNet was used to automatically extract important features from EEG recordings, and the classification of retrieved features via a Softmax layer. In addition, multiple ML approaches, including a support vector machine (SVM), were applied to the same feature set. Their proposed method achieved 99.23% accuracy with the SVM classifier, outperforming the ResNet classifier and other existing approaches. C. Barros [71] demonstrated a DL-based technique for automatically detecting SZ using EEG signals. This research highlights the effectiveness of DL approaches in exploring impaired auditory processing in SZ, with potential diagnostic implications.
Using the RepOD dataset [57], Buettner et al. [72] developed a rapid, high-performance classification approach for diagnosing SZ. The model primarily comprised three preprocessing steps: independent component analysis (ICA), spectral analysis utilizing Buettner et al.’s 99-frequency-band approach, and normalization. The random forest (RF) approach was employed for classification. The model could exclude SZ with 100% accuracy. This approach, when combined with a differential diagnosis system, can speed up, improve the accuracy, and reduce the cost of ICU treatments. Krishnan et al. [73] focused on multivariate empirical mode decomposition (MEMD) and entropy measures to detect SZ. The researchers employed MEMD to break down EEG signals into intrinsic mode functions (IMF) signals. Computing the signal’s entropy yielded the randomness measure for the IMF signal. Numerous ML classifiers were trained using a feature matrix obtained from the entropy values of the IMF signal. Among these, SVM with a radial basis function (SVM-RBF) achieved the highest accuracy and F1-score of 93% for the 95 features. It also produced an AUC of 0.9831. Shoeibi et al. [74] investigated the early identification of SZ using EEG signals and a one-dimensional transformer model. EEG signals were pre-processed by filtering, normalizing, and segmenting into time frames. Feature extraction entailed using a one-dimensional transformer architecture with various activation functions to extract features from pre-processed EEG signals. The Softmax classifier was used in the final stage. The proposed model had a maximum accuracy of 97.62% in diagnosing SZ, indicating its potential efficacy. Sara et al. [75] demonstrated a unique strategy where the EEG data were analyzed using the transfer entropy (TE) method to determine the effective connection matrix. The hybrid framework of pre-trained CNN-LSTM models outperformed the pre-trained CNN models. The EfficientNetB0-LSTM model yielded the highest average accuracy and F1-score via the 10-fold cross-validation procedure, at 99.90% and 99.93%, respectively.
Using a clinical dataset [76], Taylor et al. [77] conducted a study aimed at developing an objective, biologically based computational tool for diagnosing SZ using EEG. The subjects were exposed to three auditory oddball paradigms, which consisted of tonal sequences that varied from standard tones in 10% of the trials. The authors employed multivariate pattern analysis and identified the snapshots created using statistical parametric mapping (SPM) of the spatiotemporal EEG data, specifically ERPs recorded on the 2D surface of the scalp. For classification, they used SVM and Gaussian process classifiers (GPCs). The classification of individual patients and controls achieved an accuracy as high as 80.48% (p-value = 0.0326, adjusted for the false discovery rate). Receiver operating characteristic (ROC) analysis produced an area under the curve (AUC) of 0.87. Gaussian process regression analysis demonstrated that the mismatch negativity predicted GAF scores, with a correlation of 0.73, an R2 of 0.53, and a p-value of 0.0006. Chang et al. [78] examined functional connectivity in the brain during the mismatch negativity procedure in HC and SZ participants. The researchers used accurate low-resolution electromagnetic tomography to reconstruct cortical endogenous electrical activity from EEG recordings, and they established functionality of brain structures utilizing EEG. They retrieved graph theory properties of brain structures and classified FESZ, CSZ, and HC groups with an SVM. They also proposed a graph neural network (GNN) architecture that can learn directly from the brain structure. This study discovered that CSZ involves more damaged brain areas than does FESZ, with the auditory cortex being particularly harmed. This highlights the variety of SZ’s effects across different illness histories, as well as the relationship between the MMN and the auditory cortex. The GNN classifier trained on brain functional networks had an accuracy of 84.17%. This considerably outperformed an SVM classifier trained on graph-theoretic characteristics, which had a maximum accuracy of 69.17%. Febles [79] described a study that used ML to diagnose SZ. Using the multiple kernel Learning (MKL) classifier and the entire dataset, the study achieved an 83% classification accuracy. After the Boruta feature selection technique was applied, the classification accuracy increased to 86%. The auditory P300 paradigm’s latency and amplitude were the most important criteria in the classification.
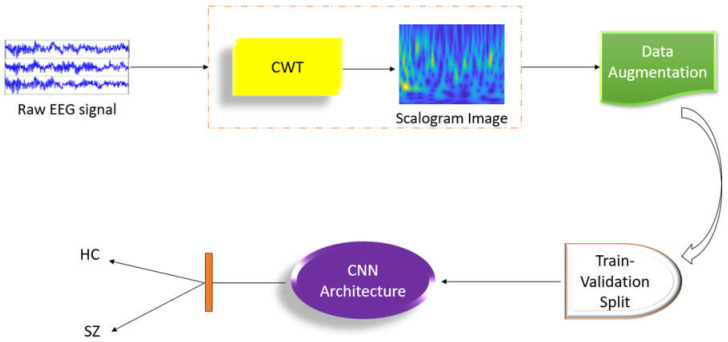
Using the dataset from the Mental Health Research Center [63] and the Institute of Psychiatry and Neurology in Warsaw [57], Aslan et al. [1] conducted a study that used DL techniques to diagnose SZ. The EEG signals were transformed to 2D using the continuous wavelet transform (CWT) technique for acquiring time-frequency characteristics. Unlike typical ML techniques, the network’s training features were automatically retrieved from EEG recordings. The research successfully classified SZ patients and healthy persons with 98% and 99.5% accuracy, respectively, using two separate datasets containing individuals of various ages. The interpretability of the results, as visualized using several methodologies, clearly indicated a relationship between spectral elements in HCs and SZ patients. The computer-aided diagnostic (CAD) approach for automatic SZ detection utilizing EEG signals is shown in Figure 17. Saadatinia et al. [80] developed an approach for automatic SZ diagnosis based on EEG brain recordings. Spectrograms were created from raw EEG signals. The original diagnosis was made using a convolutional neural network (CNN). The variational autoencoder-augmented dataset yielded a 3.0% increase in accuracy, reaching 99.0%. The authors also utilized the local interpretable model-agnostic explanations (LIME) algorithm to increase trust in the diagnostic process.
Figure 17.
Flowchart of the CAD approach for automatic SZ detection with EEG signals developed by Aslan et al. [1].
Using the MSU dataset [63], C. Phang et al. [81] completed a study that employed a deep neural network with deep belief network (DNN-DBN) architecture for SZ classification using EEG. Their approach attained a 95% classification accuracy in the theta and beta bands. Rajesh et al. [82] described a study that used symmetrically weighted local binary patterns (SLBPs) for SZ identification. The authors proposed an SLBP-based automated method for detecting SZ. The SLBP-based histogram characteristics were passed via a correlation-based feature selection technique. Finally, the feature vector produced was fed into a LogitBoost classifier to distinguish patients with SZ from HCs. The suggested approach attained an accuracy of 91.66%. Sobahi et al. [83] described a study that employed a unique approach for detecting SZ via EEG recordings. The authors proposed a novel signal-to-image mapping approach. The obtained rhythm signals from EEG recordings were encoded using the 1D local binary pattern (LBP). During the data augmentation step, extreme-learning-machine (ELM)-based autoencoders (AE) were used. Notable deep transfer learning methods were used to distinguish patients with SZ from HCs. Their proposed approach achieved a 97.7% accuracy.
Table 3 provides a table summarizing the study characteristics of the key research on employing EEG signals for SZ identification.
Table 3.
Study characteristics of notable research relevant to SZ diagnosis utilizing EEG (patients—with SZ).
| Work | Dataset | Number of Samples | Data Preparation | Software for Data Preparation | Feature Extraction Method | Approach | Result (%) |
|---|---|---|---|---|---|---|---|
| Lei Zhang [69]—2020 | Kaggle Basic Sensory Task data | Patients = 49, controls = 32 | Baseline selection, min–max normalization | - | Temporal, spatial, demographic & time–frequency features | Artificial neural network | Accuracy = 98.5 |
| Siuly et al. [70]—2023 | Patients = 49, controls = 32 | Average filtering | - | Deep ResNet | Softmax Layer and deep features with SVM | Accuracy = 99.23 | |
| Buettner et al. [72]—2019 | RepOD | Patients = 14, controls = 14 | ICA, normalization | - | Fourier transformation | Random Forest | Accuracy = 100 |
| Krishnan et al. [73]—2020 | Patients = 14, controls = 14 | - | - | Extraction using MEMD and entropy measures | SVM-RBF | Accuracy = 93, precision = 92, recall = 94 | |
| Shoeibi et al. [74]—2024 | Patients = 14, controls = 14 | Filtering, normalization, segmentation into time windows | - | 1D transformer architecture | Softmax classifier, 10-fold cross-validation | Accuracy = 97.62 | |
| Sara et al. [75]—2022 | RepOD-IBIB PAN | Patients = 14, controls = 14 | - | - | Connectivity matrix, TE | CNN-LSTM, 10-fold cross validation | Accuracy = 99.9 |
| Febles [79]—2022 | Clinical | Patients = 54, controls = 54 | Filtering, baseline correction, artifact rejection | - | Features related to peak-to-peak measurements and signal characteristics, Boruta algorithm | Multiple kernel learning | Accuracy = 86 |
| Aslan et al. [1]—2022 | Mental Health Research Center, Institute of Psychiatry & Neurology in Warsaw | Patients = 45 healthy = 39 Patients = 14, controls = 14 |
- | - | Time–frequency features | CNN | Accuracy = 98, precision = 98, recall = 98 Accuracy = 99.5, precision = 99, recall = 99 |
| Saadatinia et al. [80]—2024 | Patients = 45, controls = 39 Patients = 14, controls = 14 |
- | - | - | CNN, WGAN-GP and VAE | Accuracy = 99 | |
| C. Phang et al. [81]—2019 | MSU | Patients = 45, controls = 39 | - | - | DC-CN features | DNN-DBN | Accuracy = 95 |
| Rajesh et al. [82]—2021 | Patients = 45, controls = 39 | - | - | SLBP-based histogram features | LogitBoost Classifier | Accuracy = 91.66 | |
| Sobahi et al. [83]—2022 | Patients = 45, controls = 39 | - | - | Time–frequency features | ELM-based AE | Accuracy = 97.7 |
4.2. sMRI-Based Diagnosis of SZ
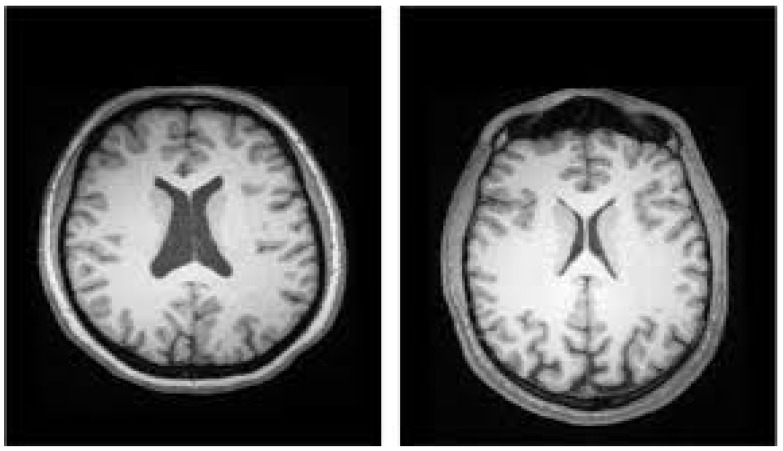
Several studies have used ML techniques to diagnose SZ utilizing sMRI modalities. Many researchers have used logistic regression (LR), RF, or SVM classifiers to classify data at the subject level [84]. Figure 18 depicts an sMRI scan for distinguishing between the ventricles of HCs and SZ participants [29].
Figure 18.
SZ diagnosis utilizing sMRI ((Left): enlarged ventricles indicate SZ. (Right): typical ventricles indicate a healthy condition) [29].
Using the COBRE dataset [56], Qureshi et al. [85] employed a combined weighted feature integration comprising neural networking of the brain as well as morphological characteristics extracted from MRI data, which was then analyzed using an extreme learning machine (ELM). This technique attained a maximum accuracy of 99.29%. In 2018, M. Latha et al. [86] conducted a study on structural biomarkers in the SZ brain using T1-weighted MRI data from the COBRE database. For segmentation, they used a neighborhood-clustering-based level set technique, and texture analysis was performed using Laws texture features. The approach revealed significant differences in geometric features between normal and SZ brains with texture features. Ramkiran et al. [87] investigated resting-state anticorrelated networks in SZ. To choose largely anticorrelated networks, the method entailed generating functional connectivity matrices and then applying the anticorrelation after mean of antilog (AMA) method. The study discovered anomalies in anticorrelated networks connecting subcortical and cortical locations. Chen et al. [88] used sMRI data from SZ patients and normal controls (NCs) to distinguish between the two groups. The method employed a ML framework with a coarse-to-fine feature selection methodology that included two-sample t-tests, recursive feature elimination (RFE), and SVM for classification. The framework focused on GM and WM properties and achieved a classification accuracy of more than 85%, allowing for individual diagnosis and correlating with earlier biomarker research. This procedure can potentially be used for other disorders as well. Guo et al. [89] investigated the application of ML to SZ categorization based on brain morphology. Morphological data from 26 hippocampal and 20 amygdaloid subregions were retrieved from T1 sMRI scans. For feature selection, the sequential backward elimination (SBE) approach was utilized, and classification was performed utilizing a linear SVM classifier. The SBE-SVM model’s classification accuracy was 81.75%, with a sensitivity of 84.21% and a specificity of 81.16%. The area under the curve (AUC) was 0.82411. The study shows how ML algorithms can be used to classify SZ based on subcortical morphological traits. Tanveer et al. [90] employed ML to improve the diagnosis of SZ. Several categorization techniques were tested, including SVM, RF, kernel ridge regression, and randomized neural networks. The t-Test, ROC, Wilcoxon, Entropy, Bhattacharyya, MRMR, and NCA were all used to select features. This study emphasizes the significance of classification algorithms in SZ diagnosis.
Using the NUSDAST dataset [58], Talpalaru et al. [91] examined SZ subgroups using ML. Clinical subgroups were identified by hierarchical clustering, and three ML models (LR, SVM, RF) were utilized for predicting subgroup membership based on cortical thickness estimates in 78 regions of interest. The RF model fared the best, with an AUC of 0.81 for the high-symptom-burden group and 0.78 for the moderate-symptom-burden group, outperforming the baseline comparison AUC of 0.75. Pinaya et al. [92] proposed a method that uses DL to identify aberrant brain areas in neuropsychiatric illnesses. A deep autoencoder, or artificial neural network, was used to quantify overall and regional neuroanatomical aberrations in individuals with SZ and autism spectrum disorder utilizing two independent datasets (n = 263). The model accurately distinguished between diseases and controls, producing discrete values of neuroanatomical deviation for each disease (p < 0.005), consistent with previous neuroimaging research. This work demonstrated the utility of deep autoencoders for detecting neuroanatomical abnormalities in neuropsychiatric populations.
Using a clinical dataset [76], Zarogianni et al. [93] investigated the use of a variety of data types to improve the prediction of SZ in high-risk patients. An SVM classifier with recursive feature elimination (RFE) was utilized in a nested cross-validation strategy to find relevant predictors and increase diagnostic accuracy. Rather than utilizing each measure alone, the model combined schizotypal measurements, a declarative memory test, and MRI data and achieved a classification accuracy of 94%. J. Liu et al. [94] proposed a strategy for classifying SZ using a variety of imaging techniques. The authors created a multi-modal, multi-atlas feature representation, and multi-kernel learning method (MMM). They retrieved eight feature sets from the MRI data using four brain atlases and four markers, followed by a two-step feature selection procedure. For SZ and HC categorization, the MMM technique achieved an accuracy of 91.28%, a sensitivity of 90.85%, a specificity of 92.17%, and an AUC of 0.9485. A.V. Nimkar et al. [95] sought to improve the prediction of SZ diagnosis by ML approaches. ML approaches were used to obtain the highest binary classification accuracy for predicting SZ. Nguyen H. et al. [96] addressed the issue of variability in multi-site neuroimaging data. Their study focused on T1-weighted brain pictures obtained from various locations. The authors employed generative adversarial networks (GANs) to alter photos from one site to match those from another, with the goal of reducing site-specific differences while retaining gender or clinical-diagnosis-relevant information. The usefulness of GANs in normalizing image sets to a common scanner set was tested, and the model was shown to perform effectively, with less information loss than that of contemporaneous techniques. This strategy enabled the pooling of neuroimaging data from various sites, increasing research sensitivity and statistical power without requiring thorough knowledge of the origins of bias. Srinivasagopalan et al. [97] reported on a DL approach for diagnosing SZ. The National Institute of Health [76] contributed the secondary dataset used in the study. The researchers compared classic ML methods such as LR, SVMs, and RFs against a DL model with three hidden layers. The DL model demonstrated better accuracy in diagnosing SZ, indicating that it could be a substantial development in the field.
Using the B-SNIP dataset [98], Rokham et al. [99] employed a multi-label data purification strategy with T1 sMRI data from 1493 people to detect label noise in the diagnoses of mood and psychotic disorders. The method comprised numerous classifications with an SVM and relabeling based on MRI data, and it was very accurate in identifying label noise.
Using the SchizConnect dataset [60], Oh et al. [100] used a DL algorithm to assess sMRI data to diagnose SZ. The model performed well, with an AUC of 0.96 showing that it is useful in detecting SZ. Junhao et al. [101] used DL and 3D structural brain MRI data to detect SZ. Their model was trained and tested on three open datasets using conventional T1-weighted MRI scans, yielding an AUC of 0.987, suggesting nearly flawless accuracy in differentiating SZ patients from HCs. Using the NAMIC dataset [102], Manohar et al. [103] proposed a method for detecting SZ using MR brain scans, which attained an accuracy of 90% and an AUC of 0.9, suggesting its efficacy in discriminating between SZ and healthy individuals. Figure 19 displays the visuals of this dataset [104]. Latha et al. [105] used a metaheuristic algorithm and a radiomics technique to study neuroanatomical structures in SZ and schizoaffective disorder.
Figure 19.
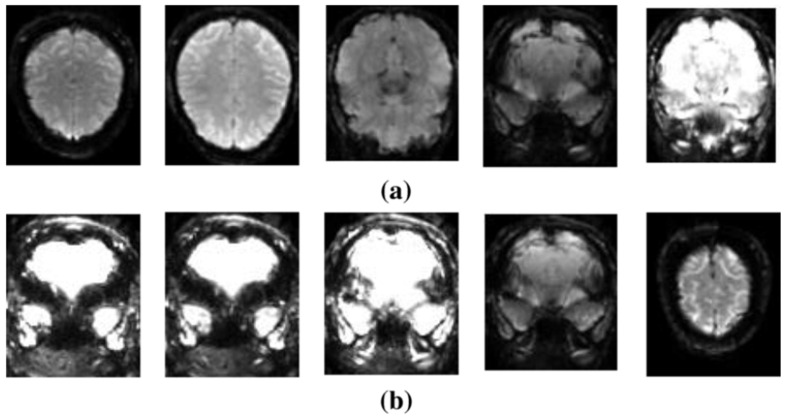
Snapshots of various categories within the NAMIC dataset: (a) HCs and (b) patients with SZ [104].
Using a multi-site dataset, Weiqi et al. [106] examined the brain age gap (BAG) as a possible indicator of SZ utilizing sMRI data from eight sites. They used support vector regression (SVR) to estimate age based on gray-matter volume and discovered that patients had much higher BAG than did controls, indicating its potential as a biomarker for SZ. Using a multisite dataset comprising COBRE [56], NMorphCH [60], and NUSDAST [58], Pierrefeu et al. [107] investigated the application of ML with structured sparsity to predict SZ in an interpretable and stable manner. They created a model that is both interpretable and replicable across sites.
Using the dataset from the Institute of Mental health (IMH), Singapore [108], Chilla et al. [109] used ensemble ML algorithms and a wide range of neuroanatomical markers to distinguish between SZ patients and HCs. The study’s classification accuracies ranged from 83 to 87%, with sensitivities and specificities of 90–98% and 65–70%, respectively. Using a multisite dataset from NUSDAST [58] and IMH [108], M. Hu et al. [110] used 3D convolutional neural networks (CNNs) to classify SZ and controls using brain MRI. The CNNs outperformed classic handcrafted feature-based ML algorithms in terms of accuracy, highlighting their promise for individual psychiatric diagnosis.
Table 4 provides a table summarizing the study characteristics of the key research on the sMRI prediction of SZ.
Table 4.
Study characteristics of notable research relevant to SZ diagnosis utilizing sMRI (patients—patients with SZ).
| Work | Dataset | Number of Samples | Data Preparation | Software for Data Preparation | Feature Extraction Method | Approach | Result (%) |
|---|---|---|---|---|---|---|---|
| Qureshi et al. [85]—2017 | COBRE | Patients = 72, controls = 72 | Data segmentation, group independent component analysis (GICA) | FreeSurfer, Analysis of Functional NeuroImages (AFNI), FMRIB Software Library (FSL) https://fsl.fmrib.ox.ac.uk (accessed on 10 September 2024). | Shape characteristics | ELM, nested 10-by-10-fold cross-validation | Accuracy = 99.29 |
| Chen et al. [88]—2020 | Patients = 34, controls = 34 | Data segmentation | Statistical parametric mapping | GM and WM features | SVM, leave-one-out cross-validation (LOOCV) | Accuracy = 85 | |
| Tanveer et al. [90]—2022 | Patients = 72, controls = 74 | Smoothing, resampling | Computational Anatomy Toolbox (CAT12) | GM, WM and integrated GM & WM features, Wilcoxon Method | Neural network, 10-fold cross-validation | Accuracy = 86.71 | |
| Liu et al. [94]—2018 | Clinical | Patients = 62, controls = 33 | - | Functional magnetic resonance imaging of the brain (FMRIB) | Cortical GM volume, cortical thickness, fractional anisotropy | SVM, 6-fold cross-validation | Accuracy = 91.28 |
| A V Nimkar et al. [95]—2018 | - | Normalization | – | Features from multiple modalities, Boruta algorithm | SVM | Accuracy = 94.12 | |
| Nguyen et al. [96]—2018 | Patients = 171, controls = 142 | Data segmentation | Statistical parametric mapping | GANs | 10-fold cross-validation | Accuracy = 99.3 | |
| Srinivasgopalan et al. [97]—2019 | Patients = 69, controls = 75 | ICA | - | deep CNN | Sigmoid | Accuracy = 94.44 | |
| Rokham et al. [99]—2020 | B-SNIP | BPD = 176 patients = 374, controls = 362 | Data segmentation | SPM | Brain image voxels, analysis of variance (ANOVA) | SVM | Accuracy = 89 |
| Junhao et al. [101]—2022 | SchizConnect | Patients = 450, controls = 437 | skull striping, brain-and-head affine registration | Brain extraction tool | Hierarchical spatial features | 3D-CNN | Accuracy = 92.1 |
| Manohar et al. [103]—2018 | NAMIC | Twenty groups | Data segmentation | - | Multi-objective BPSO | Fuzzy SVM | Accuracy = 90 |
| Latha et al. [105]—2021 | NAMIC and SchizConnect | Patients = 81, controls = 82 | Data segmentation | - | BPSO | 3-fold cross-validation | Accuracy = 90.09 |
| Kadry et al. [111]—2021 | Working Memory Dataset | 99 subjects | - | - | Features selected by the slime module algorithm (SMA) VGG-16 |
SVM-cubic, 10-fold cross-validation | Accuracy = 94.33 |
| Weiqi et al. [106]—2021 | 3 datasets from local institute, 5 datasets from SchizConnect |
Patients = 501, controls = 512 | Bias-field correction, segmentation, normalization, resampling, smoothing | SPM12, CAT12 | Demographic features | SVR, 5-fold cross-validation | Accuracy = 95 |
| Chilla et al. [109]—2022 | Institute of Mental Health (IMH), Singapore | Patients = 158, controls = 76 | Segmentation, cortical surface reconstruction, cortical parcellation | FreeSurfer | Cortical thickness, cortical surface area, and mean curvature | Ensemble of SVM, nuSVM, and LR 3-fold cross-validation |
Accuracy = 87 |
4.3. fMRI-Based Diagnosis of SZ
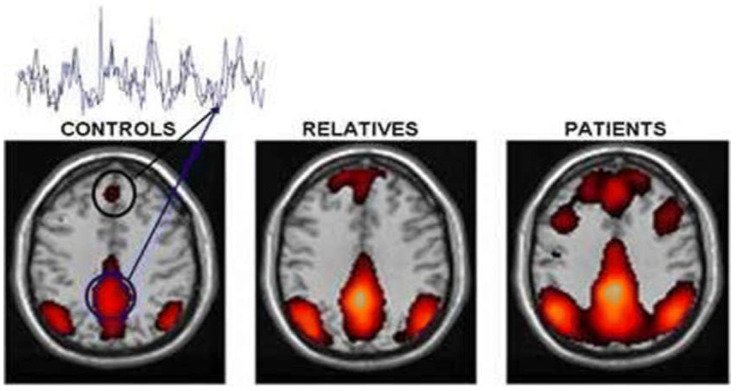
Early detection of brain disorders relies heavily on functional network changes. Studies have employed ML on fMRI scans to detect SZ caused by brain abnormalities [84]. In Figure 20, the default brain network is changed in SZ compared to HC [29].
Figure 20.
SZ diagnosis utilizing fMRI [29].
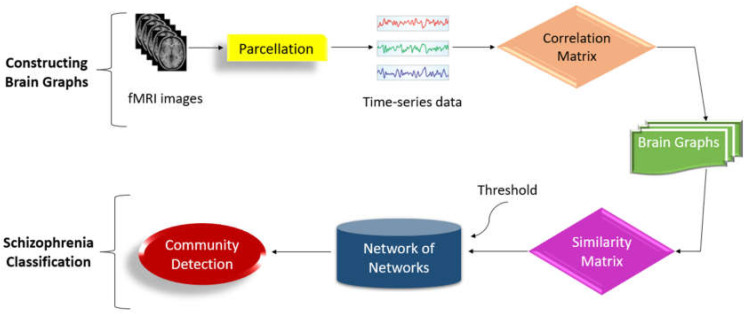
Using the COBRE dataset [56], Qureshi et al. [13] proposed a methodology for distinguishing SZ patients from HCs using resting-state fMRI data. To extract and evaluate features from fMRI data, the authors used 3D-CNN in conjunction with ICA. The proposed technique had a ten-fold cross-validated classification accuracy of 98.09% and an AUC of 0.99821. Xiang et al. [112] proposed a method for detecting SZ utilizing graph with multiple view measurements regarding the functionality of brain structures. The authors presented an enhanced SZ identification method based on graphs with multiple view measurements of brain structures. Using the Brainnetome atlas, they created distinct functional connection networks for each patient. Multi-view graph measurements were then calculated using feature representations. Sparse group lasso was used to choose discriminative features by taking into account correlations between measures within the same brain area. A SVM classifier was utilized to identify SZ. The proposed method achieved an accuracy of 93.10% for SZ detection using the LOOCV scheme. Ghanbari et al. [113] created a DL system which integrates a 3D convolutional neural network (CNN) with a long short-term memory (LSTM). They pre-processed the fMRI images, identified functional connectivity elements, and used those to generate activity maps. These maps were then employed as inputs for the 3D CNN-LSTM model, which classified the images into healthy and schizophrenic groups. The model scored a 92.32% classification accuracy. Nallusamy et al. [114] developed a technique to distinguish between SZ patients and healthy participants using fMRI data. The fMRI scans underwent preprocessing to reduce noise. The automated anatomical labelling atlas was used to divide the human brain into 116 distinct areas. A region connection matrix was created using the fMRI data. The connectivity matrix yielded a weighted undirected graph. The graph similarity algorithm calculated the similarity between each graph or subject. A weighted network was established, with each graph representing a node and the edges made with the top k similarity scores. A community detection method was used to distinguish between SZ and normal people. Figure 21 shows the block diagram of the system. This approach comprises two phases: brain graph building from fMRI and SZ categorization.
Figure 21.
Architecture diagram of the study proposed by Nallusamy et al. [114].
Using the FBIRN dataset [64], Juneja et al. [115] focused on using fMRI data for computer-aided SZ diagnosis. The work employed two balanced datasets (D1 and D2) from the FBIRN multisite dataset [64], which include fMRI data from age-matched healthy volunteers and SZ patients undertaking an auditory oddball task. D1 and D2 were collected with 1.5 T as well as 3 T scanners, respectively. Voxels from three-dimensional spatial maps were segmented into anatomical brain regions. After the selection of a smaller collection of discriminative characteristics, the features were then fed into a SVM classifier, and performance was measured utilizing LOOCV. Their approach had a classification accuracy of 95.6% for D1 and 96.0% for D2. Chatterjee et al. [116] employed fMRI data collected during an auditory oddball task from both SZ patients and HCs. The authors proposed a three-stage feature selection model: the general linear model (GLM) was used to determine initial features, statistical hypothesis testing was used to improve the feature set, and a limited collection of approximately fifty discriminative features was selected, the selected features were then utilized to classify fMRI data from healthy controls and SZ patients. The proposed technique had a high classification accuracy of 99.5%.
Using the clinical dataset [76], Liu et al. [117] investigated aberrant brain functionality as a possible indicator of SZ utilizing ReHo and SVM analysis. This approach was used to assess neuronal activity synchronization in local brain areas. Support vector machine, an ML technology, was used to categorize patients and controls based on their brain activity patterns. The SVM model achieved 89.87% classification accuracy. Wang et al. [118] investigated the role of regional homogeneity (ReHo) as an imaging biomarker for adolescent-onset SZ. The study analyzed resting-state fMRI data from teenagers with SZ and HCs. To assess local brain activity synchronization, the scientists analyzed the fMRI data using ReHo. They used an SVM to classify SZ patients and HCs based on ReHo values. The study found that ReHo could efficiently distinguish between adolescent-onset SZ patients and HCs, indicating its potential as an imaging biomarker. Zhu et al. [119] proposed a method for detecting SZ using positive distinctive functionality of brain structures relevant to fMRI data. The authors presented a unique approach which identified changes in brain functional connectivity between SZ patients and HCs. For SZ classification, the suggested technique achieved 100% sensitivity, 90.48% specificity, and 95.56% overall accuracy. Salvador et al. [120] investigated MRI-based SZ diagnosis using multimodal brain image integration. The task-based fMRI activation levels, amplitude of low-frequency fluctuations, and weighted global brain connectivity were obtained from a single MRI session. They investigated multimodal techniques such as post-classification integration, two-step sequential integration, and voxel-level integration via one-dimensional CNNs (1D-CNNs). The lasso on the two-back task maps had a maximum unimodal classifier accuracy of 84%. Qiu et al. [121] investigated the classification of SZ patients and HCs by integrating ICA and CNNs. ICA obtained the relevant components of fMRI, which were later refined by CNNs to develop hierarchical diagnostic features and classify participants. The proposed method attained an average accuracy of 91.32% for subject-level classification using majority voting and 98.75% in the auditory cortex for slice-level classification. Niu et al. [122] investigated the use of sample augmentation to improve the classification of SZ patients and HCs from fMRI data. The authors integrated ICA and CNNs. They used sample augmentation techniques to improve the training process by creating new data samples from the existing dataset. The proposed method had an average classification accuracy of 91.32% for subject-level classification using majority voting.
Yang et al. [123] explored modern neuroimaging techniques to investigate functional connectivity patterns in the brain. They employed statistical and computational tools to discover connection deficits associated with SZ. The study found substantial results on the widespread nature of connectivity deficits in SZ. Using the CCNMD dataset [124], Y. Bae et al. [125] used ML to evaluate fMRI data and distinguish between SZ patients and HCs. The study used global and local network connectivity metrics and produced a high prediction accuracy of 92.1% with SVM. Lei et al. [126] utilized ML and multimodal neuroimaging for identifying SZ on an individual basis. The study achieved a classification accuracy of 90.83%.
Using the MCIC [61] and a genes dataset, Alam et al. [127] proposed a kernel machine method for detecting higher-order interactions in multimodal datasets, which was specifically applied to SZ. The authors created a semiparametric technique using a replicating kernel Hilbert space. This method was developed using a typical mixed-effects linear model. The strategy centered on recognizing interactions between many modalities (e.g., brain imaging and genetic data) in order to uncover complicated links with SZ. The suggested method outperformed established methods in finding higher-order interactions, indicating its potential for better understanding the multidimensional nature of SZ. Using the same dataset, Li et al. [128] offered a unique method for combining imaging and genomics data using deep principal correlated autoencoders. The study used imaging data (such as MRI) and genomics data from multiple sources to investigate the integration of these modalities. The authors proposed the deep principal correlated autoencoder (DPCAE) model. This model took advantage of principal component analysis (PCA) and autoencoders to capture the associated characteristics of imaging and genomics data. The DPCAE model was intended to improve the representation and integration of multimodal data. The proposed technique showed better performance in merging imaging and genomics data.
Table 5 provides a table summarizing the study characteristics of key research on the use of fMRI to predict SZ.
Table 5.
Study characteristics of notable research relevant to SZ diagnosis using fMRI (patients—patients with SZ).
| Work | Dataset | Number of Samples | Data Preparation | Software for Data Preparation | Feature Extraction Method | Approach | Result (%) |
|---|---|---|---|---|---|---|---|
| Qureshi, et al. [13]—2019 | COBRE | Patients = 72, controls = 72 | Independent component analysis | FMRIB Software Library | Three-dimensional–convolutional neural network | 10-fold cross-validation | Accuracy = 98.09, recall = 97.49 |
| Ghanbari et al. [113]—2023 | Patients = 72, controls = 74 | Motion correction, spatial normalization, smoothing | SPM12 | Functional connectivity features, activity maps, statistical methods | 3D-CNN, LSTM network | Accuracy = 92.32 | |
| P. Jain et al. [129]—2021 | UCLA COBRE | Patients = 71, controls = 73 | Slice-time correction, realignment, co-registration, normalization, smoothing | SPM12 | FC map features, two-sampled paired t-test | 2- step ridge Classifier, LOOCV | Accuracy = 85.26 |
| A. Juneja et al. [115]—2018 | FBIRN | Patients = 34, controls = 34 Patients = 25, controls = 25 |
GSICA and GLM | GIFT and SVM | Filter-cum-wrapper method | SVM | Accuracy = 96 |
| I. Chatterjee et al. [116]—2018 | Patients = 55, controls = 55 | - | SPM | 3-stage algorithm | Linear support vector machine | Accuracy = 99.5 | |
| Chatterjee et al. [130]—2020 | Patients = 55, controls = 55 | - | SPM | Voxel values T-rest, GLM, NSGA-II | SVM | Accuracy = 95.45 | |
| S. Wang et al. [118]—2018 | Clinical | Patients = 48, controls = 31 | - | REST | Regional homogeneity measures | Support vector machines | Accuracy = 90.14 |
| Q. Zhu et al. [119]—2018 | Patients = 24, controls = 21 | - | Statistical parametric mapping | Features of brain connectivity, KDA | Neural Networks | Accuracy = 95.56 | |
| P. Liu et al. [131]—2019 | Patients = 28, controls = 28 | Group ICA | Representational state transfer (REST) | Nodes of FCN, PCA | SVM, LOOCV | Accuracy = 92.86 | |
| Yang et al. [123]—2017 | Multiple sites | Patients = 446, controls = 451 | - | Statistical parametric mapping | Sparsity parameter | 10-fold cross-validation | Accuracy = 86 |
| Y. Bae et al. [125]—2018 | CCNMD | Patients = 21, controls = 54 | - | Statistical parametric mapping | Parameters of functional connectivity | 10-fold cross-validation | Accuracy = 92.1, precision = 94, recall = 92 |
| Lei et al. [126]—2020 | Five datasets | Patients = 295, controls = 452 | Data segmentation | DPARSF | Volume of gray and white matter, covariance matrix, fuzzy C-means (FCM) clustering, ReHo | SVM, 10-fold cross-validation | Accuracy = 90.83 |
| Alam et al. [127]—2018 | Genes dataset of MCIC | Patients = 79, controls = 103 75 genes |
- | Statistical parametric mapping | epigenetics features, kernel-Based multi-view discriminative and high-order information (KMDHOI) | SVM, 2-fold cross-validation | Accuracy = 89.68 |
| G. Li et al. [128]—2020 | MCIC | Patients = 81, controls = 103 | Data augmentation and data segmentation | Statistical parametric mapping | DPCAE | 5-fold correlated AE | Accuracy = 93.8 |
5. Critical Analysis and Discussion
This section presents a critical review of the papers surveyed in the report. After a detailed debate, we identified significant difficulties that require further attention from researchers for the better diagnosis of SZ. Some of these concerns are outlined below:
EEG signals are adulterated by various inputs, such as eye blinks, muscle movements, and electrical noise, which can obscure the true neural signals, hindering the ability to examine the data accurately. For ensuring the reliability of EEG investigations, it is critical to develop standardized and effective methods for artifact removal. Techniques such as ICA and ML-based approaches are currently being investigated, although a consensus on best practices is still required.
EEG is noted for its excellent temporal resolution, which can capture cerebral activity in milliseconds. However, its spatial resolution is limited, creating challenges in identifying the specific site of brain function. Combining EEG with other imaging modalities, such as fMRI, which has excellent spatial resolution, can provide a more complete picture of brain activity. However, combining various modalities necessitates complicated algorithms and approaches that are still being developed.
EEG data preprocessing steps include filtering, artifact removal, and normalization. There is no commonly approved preprocessing pathway, resulting in diversity in study outcomes. Developing uniform preprocessing techniques would improve the reliability and comparability of EEG research.
The ability of DL algorithms to evaluate EEG data for SZ detection has been demonstrated. However, these models require substantial training datasets, which are not always available. Furthermore, DL models are sometimes viewed as “black boxes,” creating challenges in understanding the predictions. Creating interpretable models and tackling data shortage issues are critical concerns.
SZ is linked to modest structural abnormalities in the brain, such as variations in gray-matter volume and cortical thickness. These modifications might vary greatly between individuals, making it difficult to create models that accurately capture these differences. More complex models can be built using advanced ML techniques and larger datasets.
Most sMRI investigations are cross-sectional, capturing brain structure at a single point in time. Longitudinal studies that track structural changes over time are required to better understand the course of SZ. These investigations can shed light on how brain structure changes over time and aid in the identification of early illness biomarkers.
Combining sMRI with functional data from fMRI or EEG can help provide a more complete picture of SZ. However, effective integration strategies are still being developed. Multimodal techniques can assist in establishing the link between anatomical abnormalities and functional problems in SZ.
fMRI has high spatial resolution, allowing researchers to identify the location of brain activity. On the other hand, its temporal precision being restricted, it measures fluctuations in the activity of the brain over seconds instead of milliseconds. Improving the temporal resolution of fMRI and better combining it with EEG can provide a more thorough picture of brain function.
There is ongoing disagreement concerning whether task-based or resting-state fMRI is more effective in diagnosing SZ. Task-based fMRI requires participants to execute specific tasks, whereas resting-state fMRI monitors brain activity at rest. Each methodology has merits and demerits; hence, additional studies are required in order to establish the most efficient method for detecting SZ.
fMRI data are complicated and multidimensional, necessitating modern computer approaches for analysis. Meaningful patterns can be extracted from fMRI data using methods such as ML and network analysis. However, more robust and interpretable models are needed to provide unambiguous insights into brain activity in SZ.
Combining data from EEG, sMRI, and fMRI can provide a more complete picture of brain function and anatomy. However, successful multimodal integration techniques are still in their infancy. Developing algorithms that can seamlessly combine data from several modalities is an important field of research.
There is a dearth of consistent processes for data collection, preparation, and analysis among investigations. This diversity makes it difficult to compare data and draw broad conclusions. Standardized methods would improve the repeatability and comparability of study results.
Many advanced models, particularly those based on DL, are difficult to comprehend. Developing models that provide precise insights into the underlying brain pathways is critical for comprehending SZ. Interpretable models can aid in the identification of biomarkers and a better knowledge of disease pathology.
Large, high-quality datasets are required to train robust models. More open-access datasets are required, as are collaborative data-sharing efforts. Initiatives such as data-sharing platforms and consortia can help to overcome data scarcity and facilitate the creation of more accurate models.
AI algorithms, particularly deep learning models, often face overfitting issues when applied to small datasets, which is common in schizophrenia research due to challenges in acquiring large-scale EEG or neuroimaging data. Techniques such as data augmentation, transfer learning, and regularization can mitigate this problem, but their effectiveness depends on the specific dataset and application.
Despite promising advancements, deploying AI systems in clinical environments presents several practical challenges. These include integrating AI solutions into existing workflows, ensuring data privacy and security, and meeting stringent regulatory requirements. Rigorous validation, pilot testing in clinical settings, and collaboration with healthcare professionals are critical to overcoming these obstacles and ensuring the reliability of AI systems for schizophrenia detection.
These points highlight some of the important areas where additional study and development is needed to better the diagnosis and understanding of SZ using EEG, sMRI, and fMRI. Table 6 highlights the highest classification accuracies achieved by the corresponding datasets notable for SZ diagnosis.
Table 6.
Highest classification accuracies attained on the respective datasets that are relevant for SZ diagnosis.
| Work | Dataset | Modality | AI Technique | Highest Classification Accuracy (%) |
|---|---|---|---|---|
| Buettner et al. [72]—2019 | RepOD | EEG | RF, 10-fold cross-validation | 100 |
| Siuly et al. [70]—2023 | Kaggle Basic Sensory Task data | EEG | Deep ResNets, Softmax layer and deep features with SVM | 99.23 |
| Sobahi et al. [83]—2022 | MSU | EEG | ELM-based AE | 97.7 |
| Qureshi et al. [85]—2017 | COBRE | sMRI, fMRI | ELM | 99.29 |
| Nguyen et al. [96]—2018 | Clinical | sMRI | SVM, 10-fold cross-validation | 99.3 |
| Chatterjee et al. [116]—2018 | FBIRN | fMRI | Linear SVM | 99.5 |
6. Conclusions and Future Scope
AI developments have opened up new potential for detecting mental diseases such as SZ. SZ, being a brain dysfunction, involves hallucinations, aberrant speech, and cognitive, thinking, and behavioral impairments. This study examined AI methods such as feature reduction, selection, ML, and DL for diagnosing SZ automatically. We reviewed previous studies on utilizing ML and DL to diagnose SZ and promote healthy behavior. Recent studies have demonstrated high accuracy in prediction tests, sparking interest in AI techniques.
The paper discusses three key modalities used to detect SZ: EEG, sMRI, and fMRI. Recent studies have emphasized the use of MRI data for SZ categorization above EEG data due to its ability in providing critical analysis of the functionality of the brain and promoting accurate diagnosis. While sMRI is commonly used to classify patients into SZ and HC groups, resting-state fMRI is increasingly being used by researchers.
Researchers can use public datasets to improve diagnoses with ML and DL models. Medical datasets and AI approaches can enhance the prognosis for chronic illnesses such as SZ. DL demands massive quantities of data for complex tasks. However, due to limited datasets, ML is more commonly used for automated SZ diagnosis. While ML can be utilized with limited datasets, DL algorithms with autonomous feature selection can help doctors understand disease causes more effectively. DL can predict initial onset of SZ as well as identify a significant treatment option. Our examined research stresses the importance of using a balanced and context-specific strategy. AI has the potential to improve SZ diagnosis, but it requires interdisciplinary collaboration and ethical considerations for its implementation in mental health.
Future research could benefit from incorporating generative models to enhance schizophrenia detection and classification. Techniques such as generative adversarial networks (GANs) and variational autoencoders (VAEs) may be used to generate synthetic EEG or neuroimaging data, helping to overcome the challenge of limited datasets in psychiatric studies. By supplementing real data with high-quality synthetic samples, these models can strengthen the performance of classification algorithms and improve their ability to generalize. Furthermore, they can identify intricate patterns in brain activity, offering valuable insights into the neural mechanisms underlying schizophrenia. Investigating the use of generative models has the potential to not only boost diagnostic accuracy but also introduce innovative analytical methods and simulations, advancing our understanding of this complex disorder.
Supplementary Materials
The following supporting information can be downloaded at: https://www.mdpi.com/article/10.3390/diagnostics14232698/s1, Table S1: PRISMA 2020 Checklist. Reference [54] is cited in Supplementary Materials.
Author Contributions
Conceptualization, A.S. and P.K.S.; formal analysis, A.S.; investigation, P.K.S.; data curation, A.S; writing—original draft preparation, A.S.; writing—review and editing, P.K.S., S.P. and Z.W.G.; visualization, A.S. and P.K.S.; supervision, P.K.S., S.P. and Z.W.G.; funding acquisition, S.P. All authors have read and agreed to the published version of the manuscript.
Institutional Review Board Statement
Not applicable.
Informed Consent Statement
Not applicable.
Data Availability Statement
No new data were created or analyzed in this study.
Conflicts of Interest
The authors declare no conflicts of interest.
Funding Statement
This work was supported by the National Research Foundation of Korea (NRF) grant funded by the Korean government (MSIT) (NRF-2022R1G1A1012554).
Footnotes
Disclaimer/Publisher’s Note: The statements, opinions and data contained in all publications are solely those of the individual author(s) and contributor(s) and not of MDPI and/or the editor(s). MDPI and/or the editor(s) disclaim responsibility for any injury to people or property resulting from any ideas, methods, instructions or products referred to in the content.
References
- 1.Aslan Z., Akin M. A deep learning approach in automated detection of schizophrenia using scalogram images of EEG signals. Phys. Eng. Sci. Med. 2022;45:83–96. doi: 10.1007/s13246-021-01083-2. [DOI] [PubMed] [Google Scholar]
- 2.Dabiri M., Dehghani Firouzabadi F., Yang K., Barker P.B., Lee R.R., Yousem D.M. Neuroimaging in schizophrenia: A review article. Front. Neurosci. 2022;16:1042814. doi: 10.3389/fnins.2022.1042814. [DOI] [PMC free article] [PubMed] [Google Scholar]
- 3.Luvsannyam E., Jain M.S., Pormento M.K., Siddiqui H., Balagtas A.R., Emuze B.O., Poprawski T. Neurobiology of schizophrenia: A comprehensive review. Cureus. 2022;14:e23959. doi: 10.7759/cureus.23959. [DOI] [PMC free article] [PubMed] [Google Scholar]
- 4.Teixeira F.L., Costa M.R.E., Abreu J.P., Cabral M., Soares S.P., Teixeira J.P. A narrative review of speech and EEG features for Schizophrenia detection: Progress and challenges. Bioengineering. 2023;10:493. doi: 10.3390/bioengineering10040493. [DOI] [PMC free article] [PubMed] [Google Scholar]
- 5.Schizophrenia. [(accessed on 10 September 2023)]; Available online: https://www.nimh.nih.gov/health/statistics/schizophrenia.
- 6.Schizophrenia. [(accessed on 10 September 2023)]. Available online: https://www.who.int/news-room/fact-sheets/detail/schizophrenia.
- 7.Van Essen D.C., Ugurbil K., Auerbach E., Barch D., Behrens T.E., Bucholz R., Chang A., Chen L., Corbetta M., Curtiss S.W., et al. The Human Connectome Project: A data acquisition perspective. Neuroimage. 2012;62:2222–2231. doi: 10.1016/j.neuroimage.2012.02.018. [DOI] [PMC free article] [PubMed] [Google Scholar]
- 8.Thompson P.M., Cannon T.D., Narr K.L., Van Erp T., Poutanen V.P., Huttunen M., Lönnqvist J., Standertskjöld-Nordenstam C.G., Kaprio J., Khaledy M., et al. Genetic influences on brain structure. Nat. Neurosci. 2001;4:1253–1258. doi: 10.1038/nn758. [DOI] [PubMed] [Google Scholar]
- 9.Grasby K.L., Jahanshad N., Painter J.N., Colodro-Conde L., Bralten J., Hibar D.P., Lind P.A., Pizzagalli F., Ching C.R., McMahon M.A., et al. The genetic architecture of the human cerebral cortex. Science. 2020;367:eaay6690. doi: 10.1126/science.aay6690. [DOI] [PMC free article] [PubMed] [Google Scholar]
- 10.Elliott L.T., Sharp K., Alfaro-Almagro F., Shi S., Miller K.L., Douaud G., Marchini J., Smith S.M. Genome-wide association studies of brain imaging phenotypes in UK Biobank. Nature. 2018;562:210–216. doi: 10.1038/s41586-018-0571-7. [DOI] [PMC free article] [PubMed] [Google Scholar]
- 11.Spitzer R.L. Diagnostic and Statistical Manual of Mental Disorders. 3rd ed. American Psychiatric Association; Washington, DC, USA: 1980. [Google Scholar]
- 12.Jääskeläinen E., Juola P., Hirvonen N., McGrath J.J., Saha S., Isohanni M., Veijola J., Miettunen J. A systematic review and meta-analysis of recovery in schizophrenia. Schizophr. Bull. 2013;39:1296–1306. doi: 10.1093/schbul/sbs130. [DOI] [PMC free article] [PubMed] [Google Scholar]
- 13.Qureshi M.N., Oh J., Lee B. 3D-CNN based discrimination of schizophrenia using resting-state fMRI. Artif. Intell. Med. 2019;98:10–17. doi: 10.1016/j.artmed.2019.06.003. [DOI] [PubMed] [Google Scholar]
- 14.Medalia A., Saperstein A.M., Hansen M.C., Lee S. Personalised treatment for cognitive dysfunction in individuals with schizophrenia spectrum disorders. Neuropsychol. Rehabil. 2018;28:602–613. doi: 10.1080/09602011.2016.1189341. [DOI] [PMC free article] [PubMed] [Google Scholar]
- 15.Sharma G., Joshi A.M. SzHNN: A novel and scalable deep convolution hybrid neural network framework for schizophrenia detection using multichannel EEG. IEEE Trans. Instrum. Meas. 2022;71:1–9. doi: 10.1109/TIM.2022.3212040. [DOI] [Google Scholar]
- 16.Sun J., Cao R., Zhou M., Hussain W., Wang B., Xue J., Xiang J. A hybrid deep neural network for classification of schizophrenia using EEG Data. Sci. Rep. 2021;11:4706. doi: 10.1038/s41598-021-83350-6. [DOI] [PMC free article] [PubMed] [Google Scholar]
- 17.Schizophrenia Prevalence. 2021. [(accessed on 10 September 2023)]. Available online: https://ourworldindata.org/grapher/schizophrenia-prevalence.
- 18.Aine C.J., Bockholt H.J., Bustillo J.R., Cañive J.M., Caprihan A., Gasparovic C., Hanlon F.M., Houck J.M., Jung R.E., Lauriello J., et al. Multimodal neuroimaging in schizophrenia: Description and dissemination. Neuroinformatics. 2017;15:343–364. doi: 10.1007/s12021-017-9338-9. [DOI] [PMC free article] [PubMed] [Google Scholar]
- 19.Andreou C., Borgwardt S. Structural and functional imaging markers for susceptibility to psychosis. Mol. Psychiatry. 2020;25:2773–2785. doi: 10.1038/s41380-020-0679-7. [DOI] [PMC free article] [PubMed] [Google Scholar]
- 20.Oh S.L., Vicnesh J., Ciaccio E.J., Yuvaraj R., Acharya U.R. Deep convolutional neural network model for automated diagnosis of schizophrenia using EEG signals. Appl. Sci. 2019;9:2870. doi: 10.3390/app9142870. [DOI] [Google Scholar]
- 21.Fernández A., López-Ibor M.I., Turrero A., Santos J.M., Morón M.D., Hornero R., Gómez C., Méndez M.A., Ortiz T., López-Ibor J.J. Lempel–Ziv complexity in schizophrenia: A MEG study. Clin. Neurophysiol. 2011;122:2227–2235. doi: 10.1016/j.clinph.2011.04.011. [DOI] [PubMed] [Google Scholar]
- 22.Yang H., Liu J., Sui J., Pearlson G., Calhoun V.D. A hybrid machine learning method for fusing fMRI and genetic data: Combining both improves classification of schizophrenia. Front. Hum. Neurosci. 2010;4:192. doi: 10.3389/fnhum.2010.00192. [DOI] [PMC free article] [PubMed] [Google Scholar]
- 23.Dadgostar M., Setarehdan S.K., Shahzadi S., Akin A. Classification of schizophrenia using SVM via fNIRS. Biomed. Eng. Appl. Basis Commun. 2018;30:1850008. doi: 10.4015/S1016237218500084. [DOI] [Google Scholar]
- 24.EEG Test (Electroencephalogram): Purpose, Procedure, and Risks. [(accessed on 12 September 2023)]. Available online: https://www.simplypsychology.org/what-is-an-eeg.html.
- 25.Ranjan R., Sahana B.C., Bhandari A.K. Deep learning models for diagnosis of schizophrenia using EEG signals: Emerging trends, challenges, and prospects. Arch. Comput. Methods Eng. 2024;31:2345–2384. doi: 10.1007/s11831-023-10047-6. [DOI] [Google Scholar]
- 26.Shoeibi A., Sadeghi D., Moridian P., Ghassemi N., Heras J., Alizadehsani R., Khadem A., Kong Y., Nahavandi S., Zhang Y.D., et al. Automatic diagnosis of schizophrenia in EEG signals using CNN-LSTM models. Front. Neuroinform. 2021;15:777977. doi: 10.3389/fninf.2021.777977. [DOI] [PMC free article] [PubMed] [Google Scholar]
- 27.Shameedha Begum B., Faruk Hossain M., Jose J., Krishnapriya B. EEG-Based Identification of Schizophrenia Using Deep Learning Techniques; Proceedings of the International Conference on Computation Intelligence and Network Systems 2023; Tokyo, Japan. 25–27 November 2023; Cham, Switzerland: Springer Nature; 2023. pp. 26–37. [Google Scholar]
- 28.Yuh E. Youmans and Winn Neurological Surgery. Elsevier; Amsterdam, The Netherlands: 2017. Structural imaging of traumatic brain injury; p. 344. [Google Scholar]
- 29.Tyagi A., Singh V.P., Gore M.M. Towards artificial intelligence in mental health: A comprehensive survey on the detection of schizophrenia. Multimed. Tools Appl. 2023;82:20343–20405. doi: 10.1007/s11042-022-13809-9. [DOI] [Google Scholar]
- 30.Baker J.T., Holmes A.J., Masters G.A., Yeo B.T., Krienen F., Buckner R.L., Öngür D. Disruption of cortical association networks in schizophrenia and psychotic bipolar disorder. JAMA Psychiatry. 2014;71:109–118. doi: 10.1001/jamapsychiatry.2013.3469. [DOI] [PMC free article] [PubMed] [Google Scholar]
- 31.Gaser C., Nenadic I., Buchsbaum B.R., Hazlett E.A., Buchsbaum M.S. Ventricular enlargement in schizophrenia related to volume reduction of the thalamus, striatum, and superior temporal cortex. Am. J. Psychiatry. 2004;161:154–156. doi: 10.1176/appi.ajp.161.1.154. [DOI] [PubMed] [Google Scholar]
- 32.Lemaitre H., Goldman A.L., Sambataro F., Verchinski B.A., Meyer-Lindenberg A., Weinberger D.R., Mattay V.S. Normal age-related brain morphometric changes: Nonuniformity across cortical thickness, surface area and gray matter volume? Neurobiol. Aging. 2012;33:617.e1–e9. doi: 10.1016/j.neurobiolaging.2010.07.013. [DOI] [PMC free article] [PubMed] [Google Scholar]
- 33.McCarthy J. The little thoughts of thinking machines. Psychol. Today. 1983;17:46–49. [Google Scholar]
- 34.Mandal M., Singh P.K., Ijaz M.F., Shafi J., Sarkar R. A tri-stage wrapper-filter feature selection framework for disease classification. Sensors. 2021;21:5571. doi: 10.3390/s21165571. [DOI] [PMC free article] [PubMed] [Google Scholar]
- 35.Chattopadhyay S., Singh P.K., Ijaz M.F., Kim S., Sarkar R. SnapEnsemFS: A snapshot ensembling-based deep feature selection model for colorectal cancer histological analysis. Sci. Rep. 2023;13:9937. doi: 10.1038/s41598-023-36921-8. [DOI] [PMC free article] [PubMed] [Google Scholar]
- 36.Sahoo K.K., Ghosh R., Mallik S., Roy A., Singh P.K., Zhao Z. Wrapper-based deep feature optimization for activity recognition in the wearable sensor networks of healthcare systems. Sci. Rep. 2023;13:965. doi: 10.1038/s41598-022-27192-w. [DOI] [PMC free article] [PubMed] [Google Scholar]
- 37.Marik A., Chattopadhyay S., Singh P.K. A hybrid deep feature selection framework for emotion recognition from human speeches. Multimed. Tools Appl. 2023;82:11461–11487. doi: 10.1007/s11042-022-14052-y. [DOI] [Google Scholar]
- 38.Bhattacharya D., Sharma D., Kim W., Ijaz M.F., Singh P.K. Ensem-HAR: An ensemble deep learning model for smartphone sensor-based human activity recognition for measurement of elderly health monitoring. Biosensors. 2022;12:393. doi: 10.3390/bios12060393. [DOI] [PMC free article] [PubMed] [Google Scholar]
- 39.Yoon J.H., Tamir D., Minzenberg M.J., Ragland J.D., Ursu S., Carter C.S. Multivariate pattern analysis of functional magnetic resonance imaging data reveals deficits in distributed representations in schizophrenia. Biol. Psychiatry. 2008;64:1035–1041. doi: 10.1016/j.biopsych.2008.07.025. [DOI] [PMC free article] [PubMed] [Google Scholar]
- 40.Zemouri R., Zerhouni N., Racoceanu D. Deep learning in the biomedical applications: Recent and future status. Appl. Sci. 2019;9:1526. doi: 10.3390/app9081526. [DOI] [Google Scholar]
- 41.Rakhmatulin I., Dao M.S., Nassibi A., Mandic D. Exploring convolutional neural network architectures for EEG feature extraction. Sensors. 2024;24:877. doi: 10.3390/s24030877. [DOI] [PMC free article] [PubMed] [Google Scholar]
- 42.Kunekar P., Gupta M.K., Gaur P. Detection of epileptic seizure in EEG signals using machine learning and deep learning techniques. J. Eng. Appl. Sci. 2024;71:21. doi: 10.1186/s44147-023-00353-y. [DOI] [Google Scholar]
- 43.Rahul J., Sharma D., Sharma L.D., Nanda U., Sarkar A.K. A systematic review of EEG based automated schizophrenia classification through machine learning and deep learning. Front. Hum. Neurosci. 2024;18:1347082. doi: 10.3389/fnhum.2024.1347082. [DOI] [PMC free article] [PubMed] [Google Scholar]
- 44.Voineskos A.N., Hawco C., Neufeld N.H., Turner J.A., Ameis S.H., Anticevic A., Buchanan R.W., Cadenhead K., Dazzan P., Dickie E.W., et al. Functional magnetic resonance imaging in schizophrenia: Current evidence, methodological advances, limitations and future directions. World Psychiatry. 2024;23:26–51. doi: 10.1002/wps.21159. [DOI] [PMC free article] [PubMed] [Google Scholar]
- 45.Jafari M., Sadeghi D., Shoeibi A., Alinejad-Rokny H., Beheshti A., García D.L., Chen Z., Acharya U.R., Gorriz J.M. Empowering precision medicine: AI-driven schizophrenia diagnosis via EEG signals: A comprehensive review from 2002–2023. Appl. Intell. 2024;54:35–79. doi: 10.1007/s10489-023-05155-6. [DOI] [Google Scholar]
- 46.Verma S., Goel T., Tanveer M., Ding W., Sharma R., Murugan R. Machine learning techniques for the Schizophrenia diagnosis: A comprehensive review and future research directions. J. Ambient Intell. Humaniz. Comput. 2023;14:4795–4807. doi: 10.1007/s12652-023-04536-6. [DOI] [Google Scholar]
- 47.Cortes-Briones J.A., Tapia-Rivas N.I., D’Souza D.C., Estevez P.A. Going deep into schizophrenia with artificial intelligence. Schizophr. Res. 2022;245:122–140. doi: 10.1016/j.schres.2021.05.018. [DOI] [PubMed] [Google Scholar]
- 48.Sadeghi D., Shoeibi A., Ghassemi N., Moridian P., Khadem A., Alizadehsani R., Teshnehlab M., Gorriz J.M., Khozeimeh F., Zhang Y.D., et al. An overview of artificial intelligence techniques for diagnosis of Schizophrenia based on magnetic resonance imaging modalities: Methods, challenges, and future works. Comput. Biol. Med. 2022;146:105554. doi: 10.1016/j.compbiomed.2022.105554. [DOI] [PubMed] [Google Scholar]
- 49.Barros C., Silva C.A., Pinheiro A.P. Advanced EEG-based learning approaches to predict schizophrenia: Promises and pitfalls. Artif. Intell. Med. 2021;114:102039. doi: 10.1016/j.artmed.2021.102039. [DOI] [PubMed] [Google Scholar]
- 50.Luján M.Á., Jimeno M.V., Mateo Sotos J., Ricarte J.J., Borja A.L. A survey on eeg signal processing techniques and machine learning: Applications to the neurofeedback of autobiographical memory deficits in schizophrenia. Electronics. 2021;10:3037. doi: 10.3390/electronics10233037. [DOI] [Google Scholar]
- 51.Lai J.W., Ang C.K., Acharya U.R., Cheong K.H. Schizophrenia: A survey of artificial intelligence techniques applied to detection and classification. Int. J. Environ. Res. Public Health. 2021;18:6099. doi: 10.3390/ijerph18116099. [DOI] [PMC free article] [PubMed] [Google Scholar]
- 52.Steardo Jr L., Carbone E.A., De Filippis R., Pisanu C., Segura-Garcia C., Squassina A., De Fazio P., Steardo L. Application of support vector machine on fMRI data as biomarkers in schizophrenia diagnosis: A systematic review. Front. Psychiatry. 2020;11:588. doi: 10.3389/fpsyt.2020.00588. [DOI] [PMC free article] [PubMed] [Google Scholar]
- 53.De Filippis R., Carbone E.A., Gaetano R., Bruni A., Pugliese V., Segura-Garcia C., De Fazio P. Machine learning techniques in a structural and functional MRI diagnostic approach in schizophrenia: A systematic review. Neuropsychiatr. Dis. Treat. 2019;15:1605–1627. doi: 10.2147/NDT.S202418. [DOI] [PMC free article] [PubMed] [Google Scholar]
- 54.Page M.J., McKenzie J.E., Bossuyt P.M., Boutron I., Hoffmann T.C., Mulrow C.D., Shamseer L., Tetzlaff J.M., Akl E.A., Brennan S.E., et al. The PRISMA 2020 statement: An updated guideline for reporting systematic reviews. BMJ. 2021;372:n71. doi: 10.1136/bmj.n71. [DOI] [PMC free article] [PubMed] [Google Scholar]
- 55.International Prospective Register of Systematic Reviews (PROSPERO) [(accessed on 15 October 2024)]. Available online: https://www.crd.york.ac.uk/prospero/
- 56.The Mind Research Network for Neurodiagnostic Discovery, C.O.B.R.E. [(accessed on 20 July 2024)]. Available online: http://fcon_1000.projects.nitrc.org/indi/retro/cobre.html.
- 57.EEG in schizophrenia. [(accessed on 15 September 2023)]. Available online: https://repod.icm.edu.pl/dataset.xhtml?persistentId=doi:10.18150/repod.0107441.
- 58.Wang L., Kogan A., Cobia D., Alpert K., Kolasny A., Miller M.I., Marcus D. Northwestern University schizophrenia data and software tool (NUSDAST) Front. Neuroinform. 2013;7:25. doi: 10.3389/fninf.2013.00025. [DOI] [PMC free article] [PubMed] [Google Scholar]
- 59.Bilder R., Poldrack R., Cannon T., London E., Freimer N., Congdon E., Karlsgodt K., Sabb F. UCLA Consortium for Neuropsychiatric Phenomics LA5c Study. OpenNeuro; Stanford, CA, USA: 2020. ds000030. [Google Scholar]
- 60.SchizConnect Schizconnect Dataset. 2022. [(accessed on 22 July 2024)]. Available online: http://schizconnect.org/
- 61.Gollub R.L., Shoemaker J.M., King M.D., White T., Ehrlich S., Sponheim S.R., Clark V.P., Turner J.A., Mueller B.A., Magnotta V., et al. The MCIC collection: A shared repository of multi-modal, multi-site brain image data from a clinical investigation of schizophrenia. Neuroinformatics. 2013;11:367–388. doi: 10.1007/s12021-013-9184-3. [DOI] [PMC free article] [PubMed] [Google Scholar]
- 62.Kaggle MLSP 2014 Dataset. 2014. [(accessed on 20 July 2024)]. Available online: https://www.kaggle.com/c/mlsp-2014-mri/data.
- 63.Gorbachevskaya N.N., Borisov S.V. EEG of Healthy Adolescents And adolescents with Symptoms of Schizophrenia. [(accessed on 15 September 2023)]. Available online: http://brain.bio.msu.ru/eeg_schizophrenia.htm.
- 64.Potkin S.G., Turner J.A., Brown G.G., McCarthy G., Greve D.N., Glover G.H., Manoach D.S., Belger A., Diaz M., Wible C.G., et al. Working memory and DLPFC inefficiency in schizophrenia: The FBIRN study. Schizophr. Bull. 2009;35:19–31. doi: 10.1093/schbul/sbn162. [DOI] [PMC free article] [PubMed] [Google Scholar]
- 65.Olejarczyk E., Jernajczyk W. Graph-based analysis of brain connectivity in schizophrenia. PloS ONE. 2017;12:e0188629. doi: 10.1371/journal.pone.0188629. [DOI] [PMC free article] [PubMed] [Google Scholar]
- 66.Shim M., Hwang H.J., Kim D.W., Lee S.H., Im C.H. Machine-learning-based diagnosis of schizophrenia using combined sensor-level and source-level EEG features. Schizophr. Res. 2016;176:314–319. doi: 10.1016/j.schres.2016.05.007. [DOI] [PubMed] [Google Scholar]
- 67.Khare S.K., Bajaj V., Siuly S., Sinha G.R. Modelling and Analysis of Active Biopotential Signals in Healthcare. Volume 1. IOP Publishing; Bristol, UK: 2020. Classification of schizophrenia patients through empirical wavelet transformation using electroencephalogram signals.1p [Google Scholar]
- 68.EEG Data from Basic Sensory Task in Schizophrenia. [(accessed on 15 September 2023)]. Available online: https://www.kaggle.com/datasets/broach/button-tone-sz.
- 69.Zhang L. EEG signals feature extraction and artificial neural networks classification for the diagnosis of schizophrenia; Proceedings of the 2020 IEEE 19th International Conference on Cognitive Informatics & Cognitive Computing (ICCI* CC); Beijing, China. 26–28 September 2020; Piscataway, NJ, USA: IEEE; 2020. pp. 68–75. [Google Scholar]
- 70.Siuly S., Guo Y., Alcin O.F., Li Y., Wen P., Wang H. Exploring deep residual network based features for automatic schizophrenia detection from EEG. Phys. Eng. Sci. Med. 2023;46:561–574. doi: 10.1007/s13246-023-01225-8. [DOI] [PMC free article] [PubMed] [Google Scholar]
- 71.Barros C., Roach B., Ford J.M., Pinheiro A.P., Silva C.A. From sound perception to automatic detection of schizophrenia: An EEG-based deep learning approach. Front. Psychiatry. 2022;12:813460. doi: 10.3389/fpsyt.2021.813460. [DOI] [PMC free article] [PubMed] [Google Scholar]
- 72.Buettner R., Hirschmiller M., Schlosser K., Rössle M., Fernandes M., Timm I.J. High-performance exclusion of schizophrenia using a novel machine learning method on EEG data; Proceedings of the 2019 IEEE International Conference on E-Health Networking, Application & Services (HealthCom); Bogota, Colombia. 14–16 October 2019; Piscataway, NJ, USA: IEEE; 2019. 6p. [Google Scholar]
- 73.Krishnan P.T., Raj A.N., Balasubramanian P., Chen Y. Schizophrenia detection using MultivariateEmpirical Mode Decomposition and entropy measures from multichannel EEG signal. Biocybern. Biomed. Eng. 2020;40:1124–1139. doi: 10.1016/j.bbe.2020.05.008. [DOI] [Google Scholar]
- 74.Shoeibi A., Jafari M., Sadeghi D., Alizadehsani R., Alinejad-Rokny H., Beheshti A., Gorriz J.M. Early Diagnosis of Schizophrenia in EEG Signals Using One Dimensional Transformer Model; Proceedings of the International Work-Conference on the Interplay Between Natural and Artificial Computation; Olhao, Portugal. 31 May–3 June 2024; Cham, Switzerland: Springer Nature; 2024. pp. 139–149. [Google Scholar]
- 75.Bagherzadeh S., Shahabi M.S., Shalbaf A. Detection of schizophrenia using hybrid of deep learning and brain effective connectivity image from electroencephalogram signal. Comput. Biol. Med. 2022;146:105570. doi: 10.1016/j.compbiomed.2022.105570. [DOI] [PubMed] [Google Scholar]
- 76.NIMH Repository & Genomics Resource. [(accessed on 25 December 2023)]. Available online: https://www.nimhgenetics.org/download-tool/SZ.
- 77.Taylor J.A., Matthews N., Michie P.T., Rosa M.J., Garrido M.I. Auditory prediction errors as individual biomarkers of schizophrenia. NeuroImage Clin. 2017;15:264–273. doi: 10.1016/j.nicl.2017.04.027. [DOI] [PMC free article] [PubMed] [Google Scholar]
- 78.Chang Q., Li C., Tian Q., Bo Q., Zhang J., Xiong Y., Wang C. Classification of first-episode schizophrenia, chronic schizophrenia and healthy control based on brain network of mismatch negativity by graph neural network. IEEE Trans. Neural Syst. Rehabil. Eng. 2021;29:1784–1794. doi: 10.1109/TNSRE.2021.3105669. [DOI] [PubMed] [Google Scholar]
- 79.Santos Febles E., Ontivero Ortega M., Valdés Sosa M., Sahli H. Machine learning techniques for the diagnosis of schizophrenia based on event-related potentials. Front. Neuroinform. 2022;16:893788. doi: 10.3389/fninf.2022.893788. [DOI] [PMC free article] [PubMed] [Google Scholar]
- 80.Saadatinia M., Salimi-Badr A. An explainable deep learning-based method for schizophrenia diagnosis using generative data-augmentation. IEEE Access. 2024;12:98379–98392. doi: 10.1109/ACCESS.2024.3428847. [DOI] [Google Scholar]
- 81.Phang C.R., Ting C.M., Samdin S.B., Ombao H. Classification of EEG-based effective brain connectivity in schizophrenia using deep neural networks; Proceedings of the 2019 9th International IEEE/EMBS Conference on Neural Engineering (NER); San Francisco, CA, USA. 20–23 March 2019; Piscataway, NJ, USA: IEEE; 2019. pp. 401–406. [Google Scholar]
- 82.Rajesh K.N., Kumar T.S. Schizophrenia Detection in Adolescents from EEG Signals using Symmetrically weighted Local Binary Patterns; Proceedings of the 2021 43rd Annual International Conference of the IEEE Engineering in Medicine & Biology Society (EMBC); Guadalajara, Mexico. 26–30 July 2021; Piscataway, NJ, USA: IEEE; 2021. pp. 963–966. [DOI] [PubMed] [Google Scholar]
- 83.Sobahi N., Ari B., Cakar H., Alcin O.F., Sengur A. A new signal to image mapping procedure and convolutional neural networks for efficient schizophrenia detection in EEG recordings. IEEE Sens. J. 2022;22:7913–7919. doi: 10.1109/JSEN.2022.3151465. [DOI] [Google Scholar]
- 84.Arbabshirani M.R., Plis S., Sui J., Calhoun V.D. Single subject prediction of brain disorders in neuroimaging: Promises and pitfalls. Neuroimage. 2017;145:137–165. doi: 10.1016/j.neuroimage.2016.02.079. [DOI] [PMC free article] [PubMed] [Google Scholar]
- 85.Qureshi M.N., Oh J., Cho D., Jo H.J., Lee B. Multimodal discrimination of schizophrenia using hybrid weighted feature concatenation of brain functional connectivity and anatomical features with an extreme learning machine. Front. Neuroinform. 2017;11:59. doi: 10.3389/fninf.2017.00059. [DOI] [PMC free article] [PubMed] [Google Scholar]
- 86.Latha M., Kavitha G. Segmentation and texture analysis of structural biomarkers using neighborhood-clustering-based level set in MRI of the schizophrenic brain. Magn. Reson. Mater. Phys. Biol. Med. 2018;31:483–499. doi: 10.1007/s10334-018-0674-z. [DOI] [PubMed] [Google Scholar]
- 87.Ramkiran S., Sharma A., Rao N.P. Resting-state anticorrelated networks in Schizophrenia. Psychiatry Res. Neuroimaging. 2019;284:1–8. doi: 10.1016/j.pscychresns.2018.12.013. [DOI] [PubMed] [Google Scholar]
- 88.Chen Z., Yan T., Wang E., Jiang H., Tang Y., Yu X., Zhang J., Liu C. Detecting abnormal brain regions in schizophrenia using structural MRI via machine learning. Comput. Intell. Neurosci. 2020;2020:6405930. doi: 10.1155/2020/6405930. [DOI] [PMC free article] [PubMed] [Google Scholar]
- 89.Guo Y., Qiu J., Lu W. Support vector machine-based schizophrenia classification using morphological information from amygdaloid and hippocampal subregions. Brain Sci. 2020;10:562. doi: 10.3390/brainsci10080562. [DOI] [PMC free article] [PubMed] [Google Scholar]
- 90.Tanveer M., Jangir J., Ganaie M.A., Beheshti I., Tabish M., Chhabra N. Diagnosis of schizophrenia: A comprehensive evaluation. IEEE J. Biomed. Health Inform. 2022;27:1185–1192. doi: 10.1109/JBHI.2022.3168357. [DOI] [PubMed] [Google Scholar]
- 91.Talpalaru A., Bhagwat N., Devenyi G.A., Lepage M., Chakravarty M.M. Identifying schizophrenia subgroups using clustering and supervised learning. Schizophr. Res. 2019;214:51–59. doi: 10.1016/j.schres.2019.05.044. [DOI] [PubMed] [Google Scholar]
- 92.Pinaya W.H., Mechelli A., Sato J.R. Using deep autoencoders to identify abnormal brain structural patterns in neuropsychiatric disorders: A large-scale multi-sample study. Hum. Brain Mapp. 2019;40:944–954. doi: 10.1002/hbm.24423. [DOI] [PMC free article] [PubMed] [Google Scholar]
- 93.Zarogianni E., Storkey A.J., Johnstone E.C., Owens D.G., Lawrie S.M. Improved individualized prediction of schizophrenia in subjects at familial high risk, based on neuroanatomical data, schizotypal and neurocognitive features. Schizophr. Res. 2017;181:6–12. doi: 10.1016/j.schres.2016.08.027. [DOI] [PubMed] [Google Scholar]
- 94.Liu J., Wang X., Zhang X., Pan Y., Wang X., Wang J. MMM: Classification of schizophrenia using multi-modality multi-atlas feature representation and multi-kernel learning. Multimed. Tools Appl. 2018;77:29651–29667. doi: 10.1007/s11042-017-5470-7. [DOI] [Google Scholar]
- 95.Nimkar A.V., Kubal D.R. Optimization of schizophrenia diagnosis prediction using machine learning techniques; Proceedings of the 2018 4th International Conference on Computer and Information Sciences (ICCOINS); Kuala Lumpur, Malaysia. 13–14 August 2018; Piscataway, NJ, USA: IEEE; 2018. 6p. [Google Scholar]
- 96.Nguyen H., Morris R.W., Harris A.W., Korgoankar M.S., Ramos F. Correcting differences in multi-site neuroimaging data using Generative Adversarial Networks. arXiv. 20181803.09375 [Google Scholar]
- 97.Srinivasagopalan S., Barry J., Gurupur V., Thankachan S. A deep learning approach for diagnosing schizophrenic patients. J. Exp. Theor. Artif. Intell. 2019;31:803–816. doi: 10.1080/0952813X.2018.1563636. [DOI] [Google Scholar]
- 98.B-Snip—Nationwide Bi-Polar and Schizophrenia Study. [(accessed on 20 July 2024)]. Available online: https://b-snip.org/
- 99.Rokham H., Pearlson G., Abrol A., Falakshahi H., Plis S., Calhoun V.D. Addressing inaccurate nosology in mental health: A multilabel data cleansing approach for detecting label noise from structural magnetic resonance imaging data in mood and psychosis disorders. Biol. Psychiatry Cogn. Neurosci. Neuroimaging. 2020;5:819–832. doi: 10.1016/j.bpsc.2020.05.008. [DOI] [PMC free article] [PubMed] [Google Scholar]
- 100.Oh J., Oh B.L., Lee K.U., Chae J.H., Yun K. Identifying schizophrenia using structural MRI with a deep learning algorithm. Front. Psychiatry. 2020;11:16. doi: 10.3389/fpsyt.2020.00016. [DOI] [PMC free article] [PubMed] [Google Scholar]
- 101.Zhang J., Rao V.M., Tian Y., Yang Y., Acosta N., Wan Z., Lee P.Y., Zhang C., Kegeles L.S., Small S.A., et al. Detecting schizophrenia with 3D structural brain MRI using deep learning. Sci. Rep. 2023;13:14433. doi: 10.1038/s41598-023-41359-z. [DOI] [PMC free article] [PubMed] [Google Scholar]
- 102.Downloads—NAMIC Wiki. [(accessed on 20 July 2024)]. Available online: https://www.na-mic.org/wiki/Downloads.
- 103.Manohar L., Ganesan K. Diagnosis of schizophrenia disorder in MR brain images using multi-objective BPSO based feature selection with fuzzy SVM. J. Med. Biol. Eng. 2018;38:917–932. doi: 10.1007/s40846-017-0355-9. [DOI] [Google Scholar]
- 104.Sartipi S., Kalbkhani H., Shayesteh M.G. Diagnosis of schizophrenia from R-fMRI data using Ripplet transform and OLPP. Multimed. Tools Appl. 2020;79:23401–23423. doi: 10.1007/s11042-020-09122-y. [DOI] [Google Scholar]
- 105.Latha M., Kavitha G. Combined metaheuristic algorithm and radiomics strategy for the analysis of neuroanatomical structures in schizophrenia and schizoaffective disorders. IRBM. 2021;42:353–368. doi: 10.1016/j.irbm.2020.10.006. [DOI] [Google Scholar]
- 106.Man W., Ding H., Chai C., An X., Liu F., Qin W., Yu C. Brain age gap as a potential biomarker for schizophrenia: A multi-site structural MRI study; Proceedings of the 2021 43rd Annual International Conference of the IEEE Engineering in Medicine & Biology Society (EMBC); Guadalajara, Mexico. 26–30 July 2021; Piscataway, NJ, USA: IEEE; 2021. pp. 4060–4063. [DOI] [PubMed] [Google Scholar]
- 107.De Pierrefeu A., Löfstedt T., Laidi C., Hadj-Selem F., Leboyer M., Ciuciu P., Houenou J., Duchesnay E. Interpretable and stable prediction of schizophrenia on a large multisite dataset using machine learning with structured sparsity; Proceedings of the 2018 International Workshop on Pattern Recognition in Neuroimaging (PRNI); Singapore. 12–14 June 2018; Piscataway, NJ, USA: IEEE; 2018. 4p. [Google Scholar]
- 108.Schizophrenia—Institute of Mental Health. [(accessed on 22 July 2024)]. Available online: https://www.imh.com.sg/Mental-Health-Resources/Conditions-and-Challenges/Pages/Schizophrenia.aspx.
- 109.Chilla G.S., Yeow L.Y., Chew Q.H., Sim K., Prakash K.B. Machine learning classification of schizophrenia patients and healthy controls using diverse neuroanatomical markers and Ensemble methods. Sci. Rep. 2022;12:2755. doi: 10.1038/s41598-022-06651-4. [DOI] [PMC free article] [PubMed] [Google Scholar]
- 110.Hu M., Sim K., Zhou J.H., Jiang X., Guan C. Brain MRI-based 3D convolutional neural networks for classification of schizophrenia and controls; Proceedings of the 2020 42nd Annual International Conference of the IEEE Engineering in Medicine & Biology Society (EMBC); Montreal, QC, Canada. 20–24 July 2020; Piscataway, NJ, USA: IEEE; 2020. pp. 1742–1745. [DOI] [PubMed] [Google Scholar]
- 111.Kadry S., Taniar D., Damaševičius R., Rajinikanth V. Automated detection of schizophrenia from brain MRI slices using optimized deep-features; Proceedings of the 2021 Seventh International Conference on Bio Signals, Images, and Instrumentation (ICBSII); Chennai, India. 25–27 March 2021; Piscataway, NJ, USA: IEEE; 2021. 5p. [Google Scholar]
- 112.Xiang Y., Wang J., Tan G., Wu F.X., Liu J. Schizophrenia identification using multi-view graph measures of functional brain networks. Front. Bioeng. Biotechnol. 2020;7:479. doi: 10.3389/fbioe.2019.00479. [DOI] [PMC free article] [PubMed] [Google Scholar]
- 113.Ghanbari M., Pilevar A.H., Bathaeian N. Diagnosis of schizophrenia using brain resting-state fMRI with activity maps based on deep learning. Signal Image Video Process. 2023;17:267–275. doi: 10.1007/s11760-022-02229-9. [DOI] [Google Scholar]
- 114.Nallusamy K., Easwarakumar K.S. Classifying schizophrenic and controls from fMRI data using graph theoretic framework and community detection. Netw. Model. Anal. Health Inform. Bioinform. 2023;12:19. doi: 10.1007/s13721-023-00415-4. [DOI] [Google Scholar]
- 115.Juneja A., Rana B., Agrawal R.K. fMRI based computer aided diagnosis of schizophrenia using fuzzy kernel feature extraction and hybrid feature selection. Multimed. Tools Appl. 2018;77:3963–3989. doi: 10.1007/s11042-017-4404-8. [DOI] [Google Scholar]
- 116.Chatterjee I., Agarwal M., Rana B., Lakhyani N., Kumar N. Bi-objective approach for computer-aided diagnosis of schizophrenia patients using fMRI data. Multimed. Tools Appl. 2018;77:26991–27015. doi: 10.1007/s11042-018-5901-0. [DOI] [Google Scholar]
- 117.Liu Y., Zhang Y., Lv L., Wu R., Zhao J., Guo W. Abnormal neural activity as a potential biomarker for drug-naive first-episode adolescent-onset schizophrenia with coherence regional homogeneity and support vector machine analyses. Schizophr. Res. 2018;192:408–415. doi: 10.1016/j.schres.2017.04.028. [DOI] [PubMed] [Google Scholar]
- 118.Wang S., Zhang Y., Lv L., Wu R., Fan X., Zhao J., Guo W. Abnormal regional homogeneity as a potential imaging biomarker for adolescent-onset schizophrenia: A resting-state fMRI study and support vector machine analysis. Schizophr. Res. 2018;192:179–184. doi: 10.1016/j.schres.2017.05.038. [DOI] [PubMed] [Google Scholar]
- 119.Zhu Q., Huang J., Xu X. Non-negative discriminative brain functional connectivity for identifying schizophrenia on resting-state fMRI. Biomed. Eng. Online. 2018;17:1–5. doi: 10.1186/s12938-018-0464-x. [DOI] [PMC free article] [PubMed] [Google Scholar]
- 120.Salvador R., Canales-Rodríguez E., Guerrero-Pedraza A., Sarró S., Tordesillas-Gutiérrez D., Maristany T., Crespo-Facorro B., McKenna P., Pomarol-Clotet E. Multimodal integration of brain images for MRI-based diagnosis in schizophrenia. Front. Neurosci. 2019;13:1203. doi: 10.3389/fnins.2019.01203. [DOI] [PMC free article] [PubMed] [Google Scholar]
- 121.Qiu Y., Lin Q.H., Kuang L.D., Zhao W.D., Gong X.F., Cong F., Calhoun V.D. Classification of schizophrenia patients and healthy controls using ICA of complex-valued fMRI data and convolutional neural networks; Proceedings of the Advances in Neural Networks–ISNN 2019: 16th International Symposium on Neural Networks, ISNN 2019; Moscow, Russia. 10–12 July 2019; Berlin/Heidelberg, Germany: Springer International Publishing; 2019. pp. 540–547. Proceedings, Part II. [Google Scholar]
- 122.Niu Y.W., Lin Q.H., Qiu Y., Kuang L.D., Calhoun V.D. Sample augmentation for classification of schizophrenia patients and healthy controls using ica of fmri data and convolutional neural networks; Proceedings of the 2019 Tenth International Conference on Intelligent Control and Information Processing (ICICIP); Marrakesh, Morocco. 14–19 December 2019; Piscataway, NJ, USA: IEEE; 2019. pp. 297–302. [Google Scholar]
- 123.Yang Y., Cui Y., Xu K., Liu B., Song M., Chen J., Wang H., Chen Y., Guo H., Li P., et al. Distributed functional connectivity impairment in schizophrenia: A multi-site study; Proceedings of the 2nd IET International Conference on Biomedical Image and Signal Processing (ICBISP 2017); Wuhan, China. 13–14 May 2017; Piscataway, NJ, USA: IEEE; 2017. 6p. [Google Scholar]
- 124.Conte Center for the Neuroscience of Mental Disorder (CCNMD) [(accessed on 22 July 2024)]; Available online: https://www.ncbi.nlm.nih.gov/pmc/articles/PMC5873464/
- 125.Bae Y., Kumarasamy K., Ali I.M., Korfiatis P., Akkus Z., Erickson B.J. Differences between schizophrenic and normal subjects using network properties from fMRI. J. Digit. Imaging. 2018;31:252–261. doi: 10.1007/s10278-017-0020-4. [DOI] [PMC free article] [PubMed] [Google Scholar]
- 126.Lei D., Pinaya W.H., Young J., Van Amelsvoort T., Marcelis M., Donohoe G., Mothersill D.O., Corvin A., Vieira S., Huang X., et al. Integrating machining learning and multimodal neuroimaging to detect schizophrenia at the level of the individual. Hum. Brain Mapp. 2020;41:1119–1135. doi: 10.1002/hbm.24863. [DOI] [PMC free article] [PubMed] [Google Scholar]
- 127.Alam M.A., Lin H.Y., Deng H.W., Calhoun V.D., Wang Y.P. A kernel machine method for detecting higher order interactions in multimodal datasets: Application to schizophrenia. J. Neurosci. Methods. 2018;309:161–174. doi: 10.1016/j.jneumeth.2018.08.027. [DOI] [PMC free article] [PubMed] [Google Scholar]
- 128.Li G., Wang C., Han D.P., Zhang Y.P., Peng P., Calhoun V.D., Wang Y.P. Deep principal correlated auto-encoders with application to imaging and genomics data integration. IEEE Access. 2020;8:20093–20107. doi: 10.1109/ACCESS.2020.2968634. [DOI] [Google Scholar]
- 129.Jain P., Sao A.K., Minhas A.S. Analyzing the effect of resolution of network nodes on the resting state functional connectivity maps of schizophrenic human brains; Proceedings of the 2021 43rd Annual International Conference of the IEEE Engineering in Medicine & Biology Society (EMBC); Guadalajara, Mexico. 26–30 July 2021; Piscataway, NJ, USA: IEEE; 2021. pp. 6695–6698. [DOI] [PubMed] [Google Scholar]
- 130.Chatterjee I., Kumar V., Rana B., Agarwal M., Kumar N. Impact of ageing on the brain regions of the schizophrenia patients: An fMRI study using evolutionary approach. Multimed. Tools Appl. 2020;79:24757–24779. doi: 10.1007/s11042-020-09183-z. [DOI] [Google Scholar]
- 131.Liu P., Mei X., Fei S. A compound classification model for schizophrenia based on brain fmri and network modelling; Proceedings of the 2019 Chinese control conference (CCC); Guanzhou, China. 27–30 July 2019; Piscataway, NJ, USA: IEEE; 2019. pp. 7694–7697. [Google Scholar]
Associated Data
This section collects any data citations, data availability statements, or supplementary materials included in this article.
Supplementary Materials
Data Availability Statement
No new data were created or analyzed in this study.


