Abstract
It has been demonstrated that cancer cells that have survived cancer treatment may be more malignant than the original cancer cells. These cells are considered the main cause of metastasis in prognosis. A Nanog-overexpressing colon-26 (Nanog+colon26) was generated to obtain such a malignant cancer cell model, which was confirmed by enhancement of metastatic potential by in vivo tests using mice. Extracellular vesicles (EVs) secreted from Nanog+colon26 cells (Nanog+colon26EVs) were administered to mice three times per week for three weeks. Subsequently, Nanog+colon26 cells were administered, and metastatic colonies were analyzed two weeks later. The results demonstrated that the administration of EVs suppressed metastasis. Nanog+colon26EVs enhanced phagocytic activity and M1 marker CD80 of a macrophage cell line J774.1. These suggested the enforcement of tumor-suppressive properties of macrophages and their contribution to the in vivo suppression of metastasis. Small RNA sequencing was conducted to identify Nanog-dependent miRNAs that exhibited significant changes (Fc ≥ 1.5 or Fc ≤ 1/1.5; p < 0.05) in Nanog+colon26EVs relative to colon26EVs. Nine miRNAs (up-regulated: four, down-regulated: five) were identified, and 623 genes were predicted to be their target genes. Of the 623 genes identified, nine genes were predicted to be highly relevant to macrophage functions such as phagocytosis.
Keywords: colon-26, Nanog, metastasis, macrophage, phagocytosis
1. Introduction
While anticancer drugs and radiation treatments are effective in killing cancer cells, some cells are able to evade these treatments. It can be postulated that those cells should have acquired high resistance to drugs [1,2,3] and radiation [4,5] and thus be regarded as malignant cancer cells. It is believed that these cells are the primary causes of recurrence and metastasis and present a significant challenge in cancer treatment. Therefore, a malignant cancer cell model is thought to be necessary for the development of therapeutic methods.
Cancer stem cells (CSCs) have been implicated in cancer malignant transformation [6,7,8]. CSCs are a small subpopulation of cancer cells that are drug-resistant and support tumor recurrence and distant metastasis [9,10,11]. However, CSCs have different definitions and properties depending on the type of cancer, and it has been difficult to obtain stable cells with stable performance that can be used for metastasis inhibition studies. Therefore, we focused on the anaplastic property, one of the characteristics of CSCs, and intended to develop a malignant cancer cell line by lowering the differentiation level.
Nanog was selected as an inducer of an anaplastic state. Based on previous studies on the anaplastic state of mouse embryonic stem cells, Nanog was thought to be the best compared to other factors such as Oct3/4, Sox2, and Cdx2. Positive correlations between the expression level of Nanog and malignancy were observed in 14 types of cancer, including breast cancer, colon cancer, embryonic carcinoma, liver cancer, and skin cancer (melanoma) [12,13,14]. We selected murine melanoma as the first target cancer, because several melanoma cell lines with different metastatic potential (B16BL6, B16F10, and B16F1) had been established, and stable cell lines were available. In addition, these cells tend to metastasize to the liver and lungs, and metastatic colonies are expected to be easy to count and analyze as black masses. Nanog-overexpressing melanoma enhanced metastatic potential [15]. We thought it enough to use those cell lines for our experimental purpose, although the resistance to anticancer drugs was not necessarily enhanced.
The next issue to consider is using EVs to prevent the metastasis of malignant cancer cells. Formerly, cancer cell-derived EVs were introduced into immune cells such as dendritic cells, and then these dendritic cells demonstrated cancer immunotherapy [16,17,18]. EVs were incorporated into bone marrow-derived dendritic cells in vitro, and the dendritic cells demonstrated excellent therapeutic effects [16]. The introduction of cells into the body, however, carries the risk of side effects. By contrast, the introduction of cell-free EVs does not have such a risk. The cell-free EVs method was adopted in recent therapies for COVID-19 [19,20]. EVs are small in size and are thought to be incorporated not only into immune cells but also into a significantly larger number of normal cells. Therefore, if EVs with properties that activate normal cells and increase their resistance to foreign cell invasion are introduced, the entire cells in the whole body will be able to exert strong resistance to cancer metastasis. The EVs method, which maintains immune function while reducing the risk of side effects, is expected to reduce the dosage of anticancer drugs and alleviate their side effects when used in combination with conventional anticancer drug treatments. Therefore, vaccines utilizing EVs derived from cancer cells have recently garnered significant interest [21,22,23].
Since EVs comprise a multitude of components [24,25], it is important to evaluate their performance. For example, it has been observed that EVs contain components with tumor-suppressing effects, such as interleukin-12 (IL-12) [26], and components with tumor-promoting effects, such as Tgf-β [27]. In fact, overexpression of IL-12 and knockdown of Tgf-β showed antitumor effects [28]. Components that contribute to tumor suppression in one cancer, such as miR-205 [29], may have tumor-promoting effects in another cancer. Therefore, it is necessary to establish a method to accurately evaluate the performance of EVs according to differences in cancer type and disease progression stage.
Initially, EVs were prepared from Nanog-overexpressing melanoma. The EVs were expected to promote metastasis. If as expected, we would have analyzed the influence of Nanog to find clues to inhibit it. Contrary to our expectations, however, the EVs showed metastasis-suppressing effects [30], suggesting that Nanog+F10EVs are an autologous vaccine candidate that suppresses the metastasis of Nanog+F10. We also obtained results suggesting that immune cells, particularly macrophages, are involved in the metastasis-suppressing effect [30,31]. Therefore, we decided to investigate whether this phenomenon could be seen in other cancers.
Mouse colon cancer was selected as the second target. The reason for its selection was simply that, according to future predictions by the Global Cancer Observatory, Cancer Tomorrow [32], colon and/or rectal cancer has the highest morbidity and mortality rates of all cancers. Colorectal cancer is prone to metastasis to the liver and lungs, and colon cancer, in particular, has a high tendency to metastasize to the liver [33]. It is believed that suppressing liver metastasis will improve mortality. Depending on the stage of cancer progression, surgery, chemotherapy, radiation therapy, or a combination of these is performed. Regarding immunotherapy, clinical trial results have shown that the immune checkpoint inhibitor pembrolizumab is effective in mismatch repair–deficient stage IV colon cancer [34]. However, the effectiveness of other immunotherapies has not been proven. There is also a large problem of side effects.
On the other hand, regarding the involvement of Nanog in colorectal cancer, for example, it has been reported that the expression of stem cell markers, including Nanog, was reduced when furin, which is involved in calcium transport, was inhibited in colorectal cancer [35]. Conversely, it is presumed that an increase in the expression level of Nanog enhances the stemness of cancer cells and increases their malignancy. In the case of colorectal cancer, it has been reported that overexpression of Nanog increases the expression level of dormancy via the transcription factors p21 and p27 [36]. An increase in the dormancy state means an increase in resistance to anticancer drugs.
Based on the above considerations, this study aims to investigate whether overexpression of Nanog increases the malignancy of colon26 cells and whether EVs derived from Nanog-overexpressing colon cancer cells can suppress cancer metastasis, and to analyze the involvement of immune cells, especially macrophages, in the mechanism.
2. Results
2.1. Properties of Nanog-Overexpressing Colon-26 (Nanog+colon26) Cells
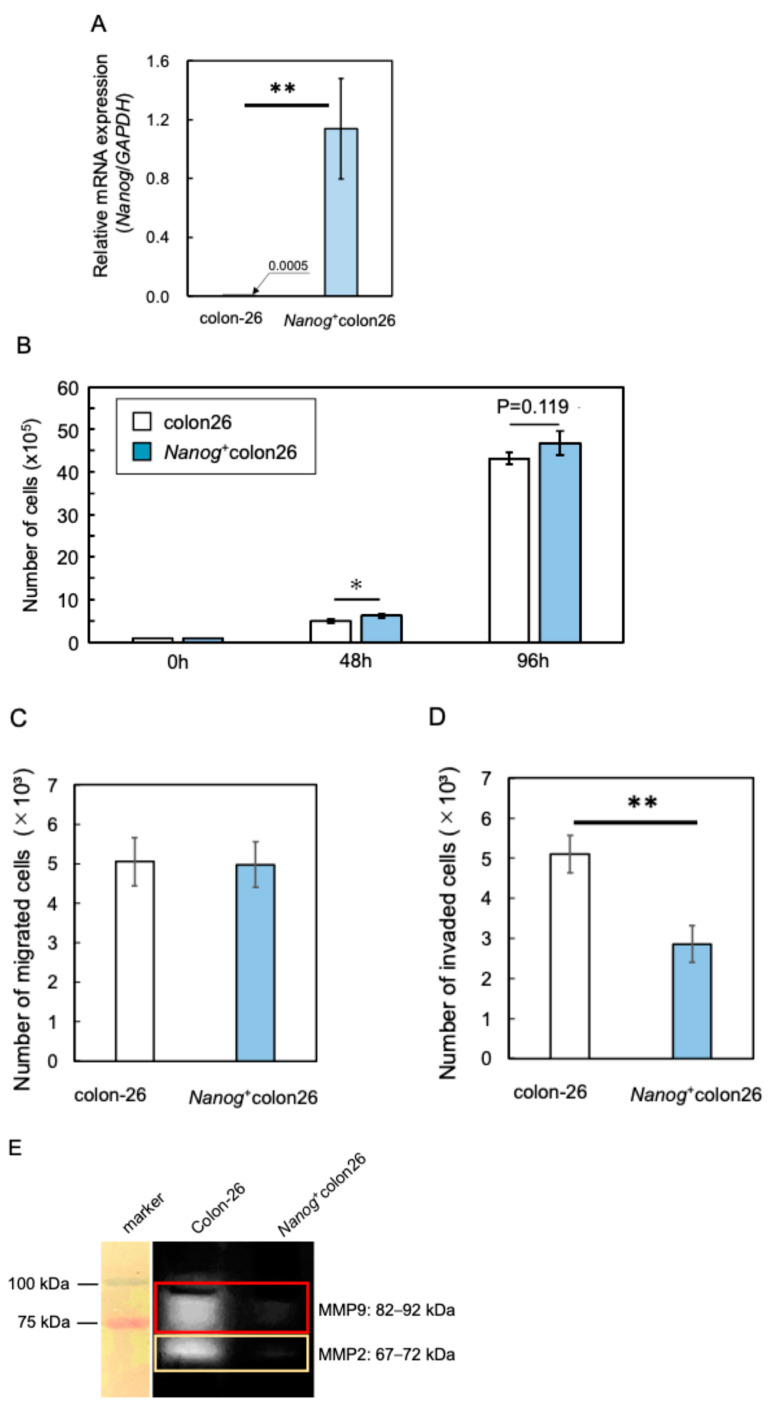
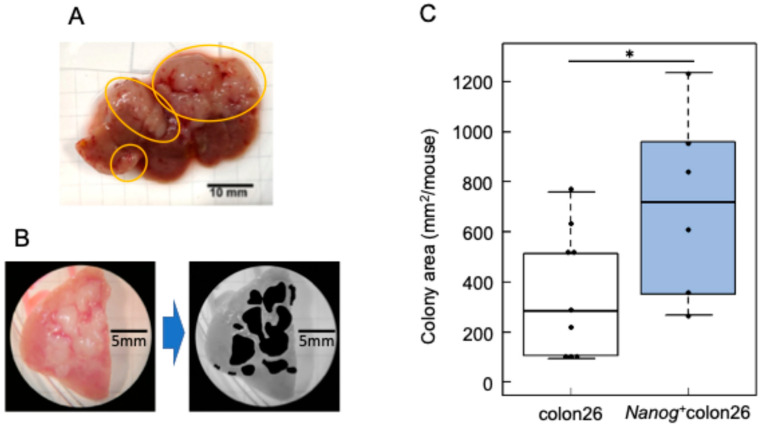
A Nanog overexpression vector was introduced into colon-26 cells to generate a Nanog+colon26 cell line. The introduction of Nanog was confirmed by qPCR (Figure 1A). The Nanog+colon26 cells were tested for metastasis-related in vitro properties. As compared to colon-26, the proliferation rate was higher as expected (Figure 1B). However, the migration activity was unchanged (Figure 1C), and the invasion activity was lower, as determined by TranswellTM assay (Figure 1D). In addition, matrix metalloproteinases such as MMP2 and MMP9 were less active, suggesting low activity of invasion by the degradation of cell stroma (Figure 1E). In contrast, metastasis to the liver was extremely prominent. White, flat colonies were formed (Figure 2A), and the area of these colonies was added up per mouse to determine the quantity of metastasis (Figure 2B). The metastatic potential of Nanog+colon26 was significantly higher than that of colon-26 (Figure 2C). In the case of colon-26, Nanog overexpression also enhanced the metastatic potential. However, unlike melanoma, in vitro properties of Nanog+colon26 cells were not so significantly more malignant than colon-26.
Figure 1.
Properties of Nanog⁺colon26 cells. (A) Relative expression of mRNA of Nanog; mean ± SD for n = 3. (B) Proliferation activity; mean ± SD for n = 3. (C) Migration activity; mean ± SD for n = 3. (D) Invasion activity; mean ± SD for n = 3. (E) Matrix metalloproteinase activity; mean ± SD for n = 3. **: p < 0.01; *: p < 0.05.
Figure 2.
Metastatic properties of Nanog⁺colon26 cells. (A) Colon cancer colonies metastasize to the liver. Colony: circled by yellow lines. (B) Quantification of metastasis by adding up the area of colonies by using ImageJ. (C) Colony area per mouse. colon-26: n = 7; Nanog+colon26: n = 6; *: p < 0.05.
2.2. Metastasis Suppression Effect of Nanog+colon26EVs
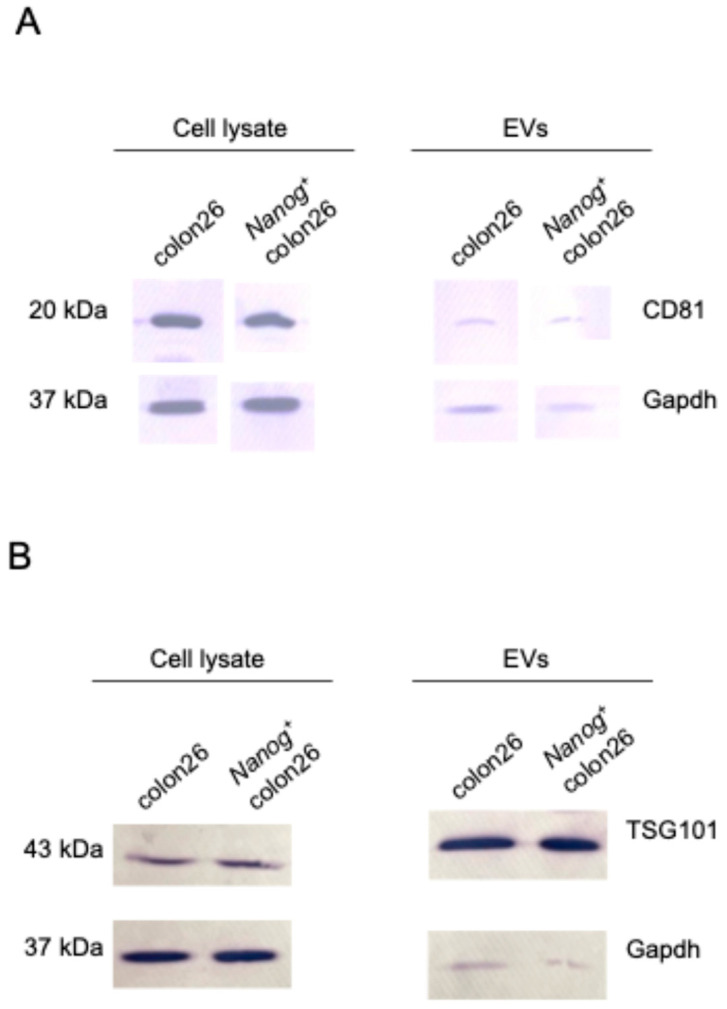
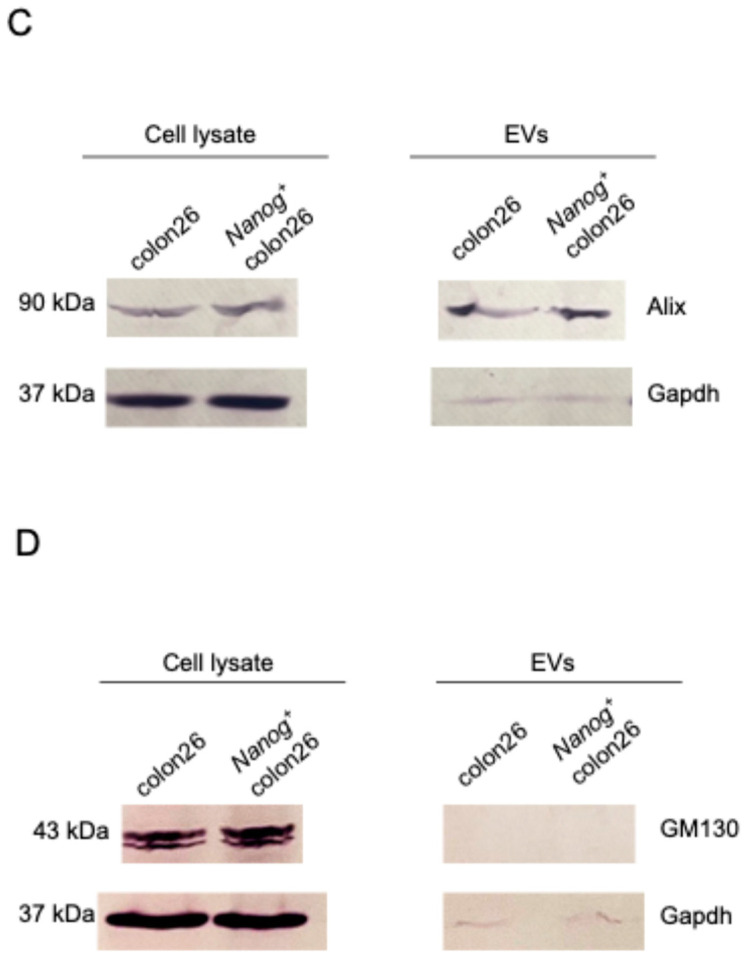
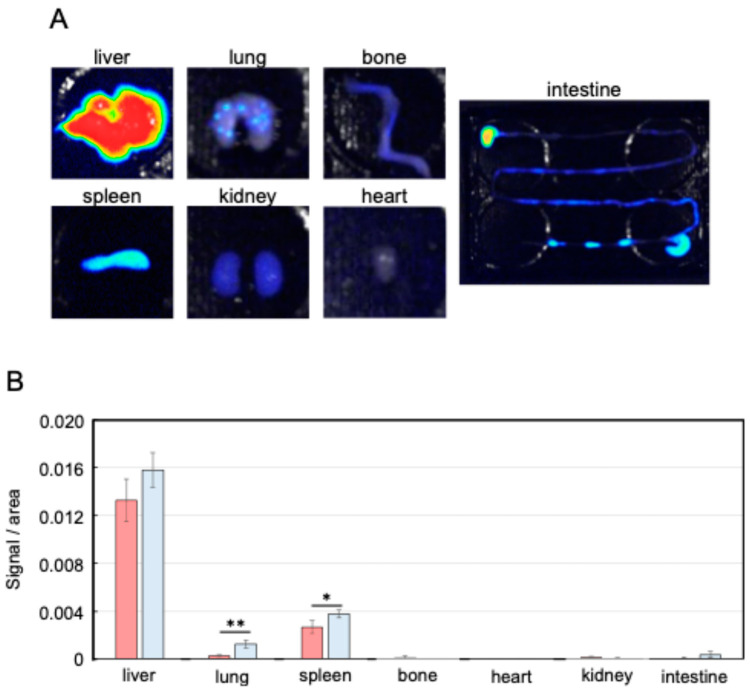
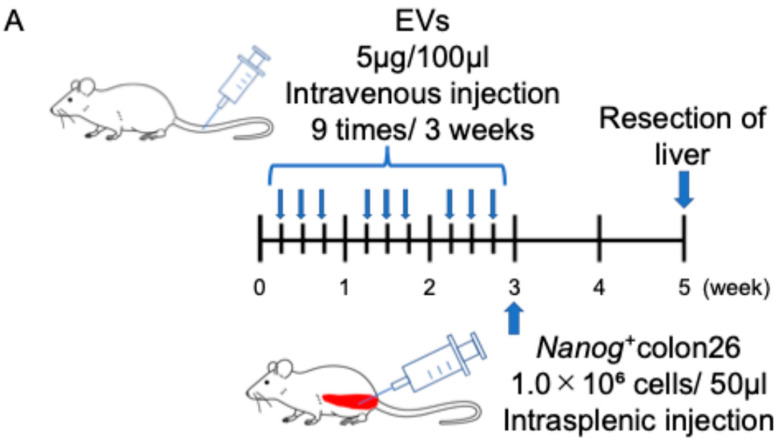
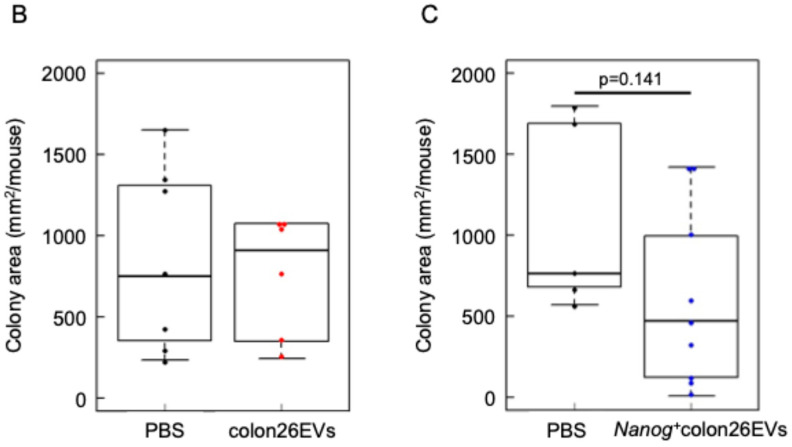
EVs isolated from Nanog+colon26 cells and colon-26 cells were confirmed by Western blotting using EVs markers such as CD81, TSG101, and Alix (Figure 3). Moreover, the absence of a negative marker, GM130, was also confirmed. Next, the circulation of EVs in the body was examined by injecting NIR815-labeled EVs (100 µL of 50 µg/mL) from the tail vein. Three hours after the injection, organs were excised for fluorescent image analysis. The liver showed the highest uptake of EVs among the seven organs (Figure 4A). In the lung and spleen, the uptake of Nanog+colon26EVs was higher than that of colon26EVs (Figure 4B). In the liver, the amount of Nanog+colon26EVs taken up tended to be greater than that of colon26EVs, although the difference was not statistically significant. Then, the effect of Nanog+colon26EVs on the metastasis of colon cells to the liver was investigated. Nanog+colon26EVs or colon26EVs were administered nine times via the tail vein at 100 µL (50 µg/mL) (Figure 5A). Nanog+colon26 cells were then injected into the spleen, and 2 weeks later, the mice were euthanized by cervical dislocation, and the livers were removed. The livers were cut into lobes and photographed. The area of tumors in the images was added up per mouse. Mice treated with colon26EVs exhibited reduced metastasis compared to those treated with PBS (Figure 5B,C). It is noteworthy that two of the mice treated with PBS died within two weeks of the injection of Nanog⁺colon26 cells, but all mice treated with Nanog⁺colon26EVs survived for two weeks.
Figure 3.
Western blotting performed to confirm the presence of Nanog+colon26EVs markers: (A) CD81, (B) TSG101, (C) Alix, and the absence of a negative marker, (D) GM130. Gapdh: loading control.
Figure 4.
Distribution of EVs in the body. (A) Fluorescent images of NIR815-labeled Nanog+colon26EVs accumulated in each organ. (B) Accumulation of Nanog+colon26EVs (■) and colon26EVs (■) in each organ; mean ± SD for n = 3; ** p < 0.01; * p < 0.05.
Figure 5.
Effects of Nanog+colon26EVs on liver metastasis. (A) Timeline of EV and cell administrations. (B) Effect of colon26EVs; number of mice PBS: n = 7; colon26EVs: n = 6. (C) Effect of Nanog+colon26EVs; number of mice PBS n = 5 (2 of 7 mice died within 2 weeks after the injection of Nanog+colon26 cells); Nanog+colon26EVs: n = 9.
2.3. Effects of Nanog+colon26EVs on Macrophage Phagocytic Function
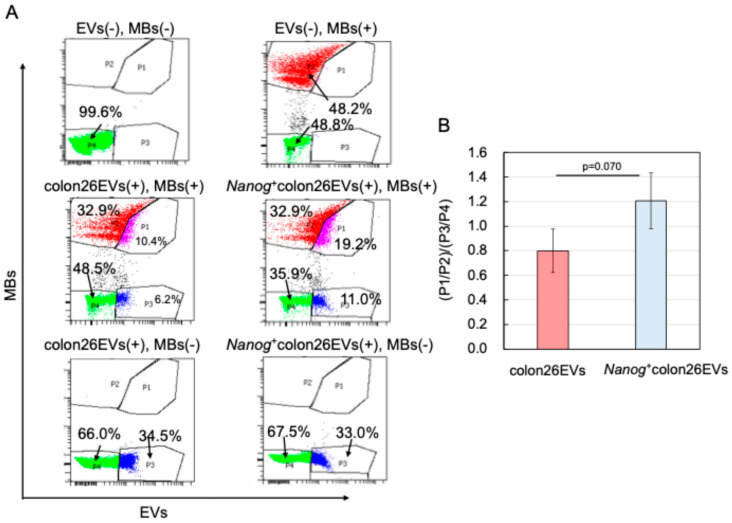
Since the metastasis-suppressive effect was obtained when EVs were used as a vaccine, it was predicted that the target cells involved were immune cells. Since the involvement of macrophages has already been reported in the suppressive effect of Nanog+F10EVs on the liver metastasis of melanoma Nanog+F10 [30], we assumed that macrophages would also be involved in the case of Nanog+colon26EVs. Specifically, we focused on the phagocytic function playing a role in the elimination of unnecessary cells, including cancer cells. In the liver, EVs are primarily taken up by Kupffer cells [37], suggesting that they are likely involved in phagocytic activity. In vitro tests were performed to examine the phagocytic activity using fluorescent microbeads (MBs) as a phagocytosed model. EVs (Nanog+colon26EVs or colon26EVs) were labeled with the fluorescent dye PKH26 and used together with commercially available MBs labeled with FITC (FITC-MBs). J774.1 cells that had taken up PKH26-EVs and/or FITC-MBs were detected in the PE channel and the FITC channel, respectively, of a flow cytometer (FACSAriaII, BD Bioscience).
As shown in Figure 6A, a flow cytogram for a cell sample containing neither PKH26-EVs nor FITC-MBs was obtained as a double-negative control. A flow cytogram for a cell sample containing FITC-MBs alone was obtained as a PKH26-EVs negative control. From these controls, we set the P2 and P4 gates so that the fractional number of cells within the P1 and P3 gates was 0%. Figure 6 shows results obtained with cell samples containing both PKH26-EVs and FITC-MBs.
Figure 6.
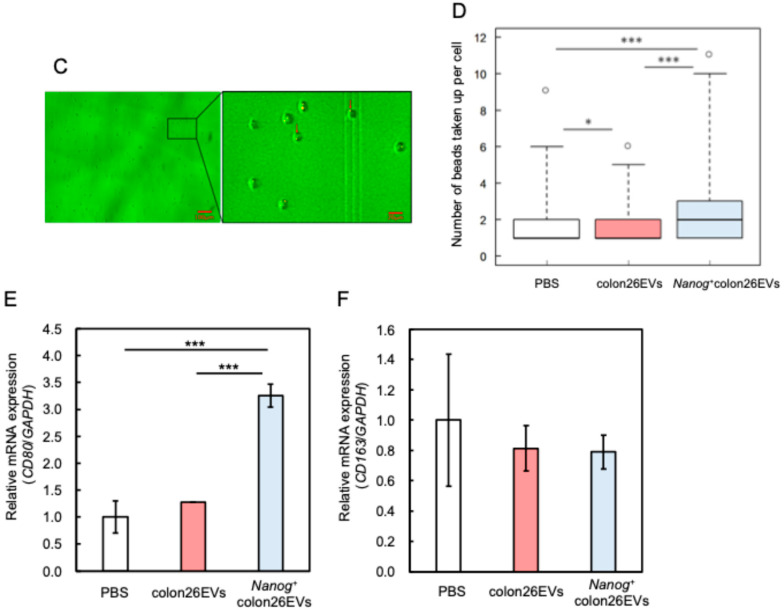
Effects of EVs on phagocytic activity of J774.1 cells. (A) Flow cytograms of J774.1 cells containing PKH26-EVs and/or FITC-MBs. PKH26, Ex: 551 nm, Em: 567 nm; FITC, Ex: 498 nm, Em: 517 nm. Plot colors: violet in P1, red in P2, blue in P3, green in P4. (B) Phagocytic activity, mean ± SD for n = 3. (C) Uptake of MBs by J774.1 single cells analyzed by fluorescent microscopy. Red arrows indicate MBs. (D) Number of MBs taken up per cell. °: outliers. PBS: n = 377, mean = 1.81, median = 1. colon26EVs: n = 367, mean = 1.65, median = 1. Nanog+colon26EVs: n = 420, mean = 2.19, median = 2. *: p < 0.05; ***: p < 0.001. (E) Expression of macrophage marker (CD80) determined by qPCR; mean ± SD for n = 3. ***: p < 0.001. (F) Expression of macrophage marker (CD163) determined by qPCR; mean ± SD for n = 3.
If cells that have taken up EVs have a greater tendency to take up MBs, it is expected that P1/P2 will be larger. However, a large P1/P2 ratio may also simply indicate that EVs themselves are more likely to be taken up by cells. Therefore, it is necessary to offset such an effect specific to EVs. This effect may be estimated from flow cytograms of MB negative controls. If EVs themselves are likely to be taken up by cells, it is expected that P3/P4 will be large. Therefore, we defined the effect on phagocytic activity as the net effect of EVs on the MBs uptake that may be given by [P1/P2] [in (colon26EVs(+), MBs(+)), (Nanog+colon26EVs(+), MBs(+))]/[P3/P4] [in (colon26EVs(+), MBs(−)), (Nanog+colon26EVs(+), MBs(−))]. The effect of Nanog+colon26EVs was greater than that of colon26EVs (Figure 6B).
Furthermore, the number of MBs taken up by single cells was quantified using fluorescent microscopy. After confirming the positions of J774.1 cells by a bright field image (Figure 6C), the numbers of MBs taken up into each cell were counted in the fluorescent images (Figure 6C). Compared to the control condition where PBS was added to the cell suspension, the number of MBs taken up into the cells decreased when colon26EVs were added instead of PBS, while it increased when Nanog+colon26EVs were added (Figure 6D).
2.4. Effects on Macrophage Polarization
It was previously reported that CD80-positive M1 macrophages exhibited higher phagocytic activity compared to M2 macrophages [38]. Therefore, we investigated the effect of EVs on macrophage polarization. The results demonstrated that the expression of CD80 (a marker of M1 type) was higher in Nanog+colon26EVs than in colon26EVs (Figure 6E), whereas the expression of CD163 (a marker of M2 type) was at the same level (Figure 6F). This suggests that Nanog+colon26EVs promoted the polarization of J774.1 cells toward the M1 phenotype and consequently contributed to the enhancement of phagocytic activity.
2.5. Expression of miRNAs and Their Target Genes in EVs
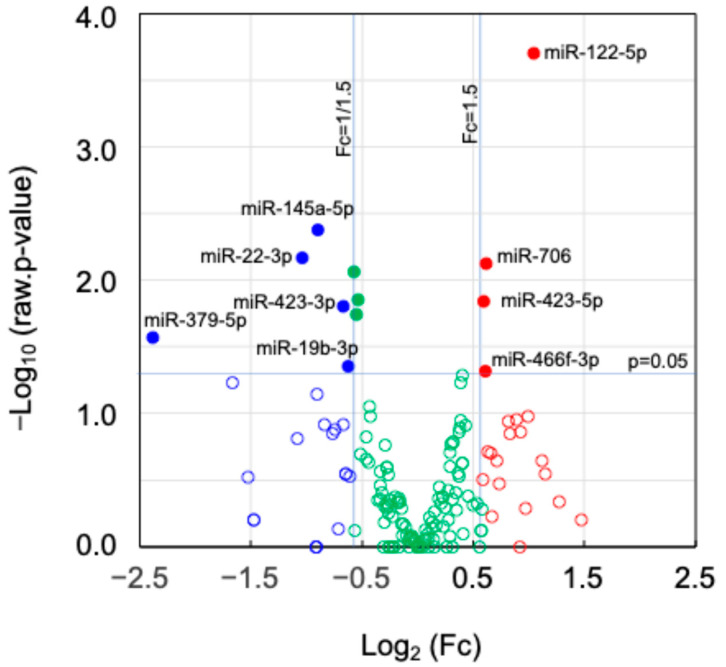
Small RNA sequencing was conducted to find Nanog-dependent miRNAs that were significantly changed (Fc ≥ 1.5 or Fc ≤ 1/1.5; p < 0.05) in Nanog+colon26EVs as compared to colon26EVs. Nine miRNAs (up-regulated: four, down-regulated: five) were found (Figure 7), and their target genes were surveyed using TargetScanMouse8.0. Under the condition that the cumulative weighted context score was equal to or lower than −0.40, 623 genes were predicted (Table 1).
Figure 7.
A volcano plot of miRNAs. Fold change (Fc) and p-value in statistical significance; (●) Fc ≥ 1.5 and p < 0.05, (●) Fc ≤ 1/1.5 and p < 0.05, (●) 1/1.5 < Fc < 1.5 and p < 0.05, (○) Fc ≥ 1.5 and p ≥ 0.05, (○) Fc ≤ 1/1.5 and p ≥ 0.05, (○) 1/1.5 < Fc < 1.5 and p ≥ 0.05, where Log2(1.5) = 0.585, Log2(1/1.5) = −0.585, −Log10(0.05) = 1.301.
Table 1.
Number of up-regulated and down-regulated miRNAs in Nanog+colon26EVs. Total number of predicted target genes with high efficiency, and number of genes among them predicted as top 30 genes with highest association.
| miRNA | Log2(Fc) | Number of Target Genes | |||
|---|---|---|---|---|---|
|
p < 0.05 CWCS ≤ −0.40 |
Targeted by Each miRNA Among Top30 Genes | ||||
|
Nanog+colon26EVs/ colon26EVs |
miR-122-5p | 1.04 | 29 | 321 | 2 |
| miR-706 | 0.62 | 62 | 3 | ||
| miR-466f-3p | 0.61 | 146 | 6 | ||
| miR-423-5p | 0.59 | 84 | 2 | ||
| miR-379-5p | −2.38 | 7 | 302 | 0 | |
| miR-22-3p | −1.04 | 103 | 8 | ||
| miR-145a-5p | −0.89 | 48 | 4 | ||
| miR-423-3p | −0.67 | 8 | 1 | ||
| miR-19b-3p | −0.62 | 136 | 4 | ||
| Sum | 623 | 30 | |||
Following the prediction of 623 genes that corresponded to respective proteins, the network of those functional proteins was analyzed using STRING ver.3.10.1 and the association levels between those proteins were analyzed using cytoHubba to predict 30 genes/proteins with the highest level of association (Table 2).
Table 2.
Top 30 genes with highest association level predicted by STRING and cytoHubba. miRNAs shown in red and blue are those up-regulated and down-regulated, respectively. Predicted effects are described for top 10 genes. Arrow notations indicate up- or no-regulation (→up/no) and down-regulation (→down) of target genes.
| Rank | Gene | miRNA | Predicted Effects | Rank | Gene | miRNA | Rank | Gene | miRNA |
| 1 | Actb | miR-145a-5p | cell motility and contraction→up/no | 11 | Csf1r | miR-22-3p | 21 | Mecp2 | miR-22-3p |
| 2 | Ins1 | miR-466f-3p | blood glucose decrease→down | 12 | Sirt1 | miR-22-3p | 22 | Mlxipl | miR-706 |
| 3 | Fgf17 | miR-423-5p | normal brain development→down | 13 | H3f3b | miR-22-3p | 23 | Socs1 | miR-19b-3p |
| 4 | Fgf16 | miR-466f-3p | normal heart development→down | 14 | Angpt2 | miR-145a-5p | 24 | Hnrnph2 | miR-145a-5p |
| 5 | Grb2 | miR-466f-3p | linking of cell growth factor receptor and Ras signaling→down→growth inhibition | 15 | Cdkn1b | miR-706 | 25 | Pkm | miR-122-5p |
| 6 | Ngf | miR-423-5p | normal nerve growth→down | 16 | Ppara | miR-22-3p | 26 | Prkcd | miR-466f-3p |
| 7 | Erbb3 | miR-22-3p | development of various organs and myeloid cell differentiation→up/no | 17 | Slc2a4 | miR-466f-3p | 27 | Arrb1 | miR-22-3p |
| 8 | Fgfr2 | miR-423-3p | cell proliferation, differentiation, migration, apoptosis→up/no | 18 | Mycn | miR-19b-3p | 28 | Sgk1 | miR-19b-3p |
| 9 | Kitl | miR-466f-3p | cell survival, proliferation, stem cell maintenance→down | 19 | Ccnd2 | miR-19b-3p | 29 | Hnrnpf | miR-706 |
| 10 | Esr1 | miR-22-3p | cellular proliferation and differentiation→up/no | 20 | G6pc3 | miR-122-5p | 30 | Actg1 | miR-145a-5p |
2.6. Factors Involved in the Activation of the Immune System
Genes presumed to be closely involved in the activation of the immune system, macrophages, and phagocytic activity were searched for among 623 target genes listed in Table 1. The search was conducted in three steps. The initial step involved the selection of individual genes predicted to be most affected by Nanog overexpression. Specifically, the top 30 genes with the highest level of association were predicted by functional association analysis using STRING, followed by association level analysis using cytoHubba. Next, enrichment analysis was conducted to investigate the possibility that multiple gene groups may be involved in a specific pathway as a cluster and to predict dominant genes among them. The third step involved searching for genes that included the keywords “macrophage” and “phagocytosis” in their functional annotation among the 623 target genes.
2.6.1. Results of the First Search
The top 30 genes predicted to be most associated with Nanog overexpression are shown in Table 2. The predicted effects of the top 10 genes are also listed. The top first gene, Actb, is an actin-related gene and is associated with cell motility and contraction. The predicted effect of the up-regulation of Actb is the increase in cell motility. Our in vitro tests of migration and invasion, however, did not seem to reflect the possible effect of Actb. The top second gene, Ins1, encodes insulin, a hormone that contributes to the maintenance of blood glucose levels at a proper condition. Partial suppression of Ins1 might cause moderate hyperglycemia and contribute to metastasis suppression, as suggested by [39,40]. The top third, fourth, and sixth genes are factors promoting normal growth of brain, heart, and nerve cells, respectively. The contribution of these factors to the immune system, if any, might be minimal because they are relevant to specific organs different from the immune system. Conversely, the top 5th and 7th~10th genes are involved in the proliferation of various cells that may include immune system cells. Therefore, increased expression of these genes is desirable for increased immune system activity. The top fifth (Grb2) and top ninth (Kitl) genes, however, are down-regulated by up-regulated miR-466f-3p. Therefore, it would be effective to increase the expression of Grb2 and Kitl at the genetic level in addition to increasing the expression of miR-466f-3p.
In conclusion, the predicted genes related to immune system activation by the first search are Ins1, Erbb3, Fgfr2, and Esr1.
2.6.2. Results of the Second Search
Pathway enrichment analysis was conducted on a group of 623 target genes. Ten pathways in KEGG pathways and two pathways in WikiPathways were predicted to be enriched (Table 3). Two key words, “focal adhesion” and/or “PI3K-Akt(-mTOR) signaling” were found in common in the description of two of the KEGG pathways and two of the WikiPathways. Among these four pathways, WP2841 was the only one that contained both keywords in the description. Therefore, this pathway was thought to be most closely associated with Nanog-dependent genes. The number of genes included in WP2841 was 316, of which 24 genes were included in the 623 target genes (Table 4). Furthermore, 11 of the 24 genes were included in the top 30 of Table 2. In addition, seven of the top ten genes in Table 4 were identical to seven of the top ten genes in Table 2.
Table 3.
Pathways predicted to be enriched in 623 target genes/proteins.
| Pathway | Description | Count in Network |
Strength | |
|---|---|---|---|---|
| KE | mmu04010 | MAPK signaling pathway | 20 of 287 | 0.40 |
| mmu04014 | Ras signaling pathway | 17 of 225 | 0.44 | |
| mmu04015 | Rap1 signaling pathway | 18 of 208 | 0.50 | |
| mmu04068 | FoxO signaling pathway | 15 of 129 | 0.63 | |
| mmu04151 | PI3K-Akt signaling pathway | 23 of 353 | 0.38 | |
| mmu04152 | AMPK signaling pathway | 11 of 124 | 0.51 | |
| mmu04510 | Focal adhesion | 17 of 225 | 0.45 | |
| mmu04930 | Type II diabetes mellitus | 7 of 48 | 0.73 | |
| mmu04931 | Insulin resistance | 10 of 109 | 0.52 | |
| mmu04960 | Aldosterone-regulated sodium reabsorption | 6 of 38 | 0.76 | |
| WK | WP2841 | Focal adhesion: PI3K-Akt-mTOR signaling pathway | 24 of 316 | 0.44 |
| WP85 | Focal adhesion | 15 of 185 | 0.47 | |
Focal adhesion is a common keyword in three pathways (bold in the pathway column), and PI3K-Akt(-mTOR) is a common keyword in two pathways (bold). Among four pathways, WP2841 contains these two keywords (bold in the description column).
Table 4.
Genes included in the 316 genes that make up pathway WP2841 among the 623 target genes listed in Table 1. Genes shown in bold are included in the top 30 (Table 2). miRNAs shown in red and blue are those that are up-regulated and down-regulated, respectively.
| Rank | Name | Score | miRNA | Rank | Name | Score | miRNA | Rank | Name | Score | miRNA |
|---|---|---|---|---|---|---|---|---|---|---|---|
| 1 | Ins1 | 1500 | miR-466f-3p | 9 | Angpt2 | 48 | miR-145a-5p | 15 | Rab14 | 2 | miR-466f-3p |
| 2 | Fgf17 | 1490 | miR-423-5p | 10 | Pik3cd | 6 | miR-22-3p | 15 | Efna3 | 2 | miR-423-5p |
| 3 | Fgf16 | 1488 | miR-466f-3p | 11 | Slc2a4 | 5 | miR-466f-3p | 15 | Pfkfb2 | 2 | miR-466f-3p |
| 4 | Grb2 | 1450 | miR-466f-3p | 11 | Pdpk1 | 5 | miR-466f-3p | 15 | Fgf12 | 2 | miR-706 |
| 5 | Kitl | 1440 | miR-466f-3p | 13 | Cdkn1b | 4 | miR-706 | 21 | Gys1 | 1 | miR-122-5p |
| 5 | Ngf | 1440 | miR-423-5p | 13 | Pdgfd | 4 | miR-145a-5p | 21 | Ppp2r5e | 1 | miR-19b-3p |
| 7 | Fgfr2 | 751 | miR-423-3p | 15 | Ddit4 | 2 | miR-423-5p | 21 | Itgb8 | 1 | miR-145a-5p |
| 8 | Csf1r | 749 | miR-22-3p | 15 | Rab10 | 2 | miR-706 | 21 | Thbs3 | 1 | miR-423-5p |
Other than these seven genes in Table 4, Csf1r and Pik3cd were of interest because of their relevance to the immune system. Csf1r is a macrophage colony-stimulating factor 1 receptor, which is up-regulated and is predicted to contribute to immune system activation. Pik3cd is an isoform of the common keyword PI3K, which mediates immune responses. Although its target is not macrophages, Pik3cd is involved in the development, proliferation, and migration of B cells.
In conclusion, the newly predicted genes related to immune system activation by the second search were Csf1r and Pik3cd.
2.6.3. Results of the Third Search
Nine genes were selected and listed in Table 5. Maf1, Ocln, and Ifi204 are related to macrophage differentiation, adhesion, and expansion. However, these genes are down-regulated by up-regulated miR-122-5p or miR-466f-3p. Therefore, their effects are thought to be suppressive to the immune system. With regard to phagocytosis, Il15ra is also down-regulated by miR-466f-3p, and therefore, its effect was thought to be suppressive to phagocytic activity.
Table 5.
Genes relevant to the functions of macrophages and phagocytosis. miRNAs shown in red and blue are those that are up-regulated and down-regulated, respectively. Arrow notations indicate the up/no-regulation (→up/no) and down-regulation (→down) of target genes.
| Keyword | Gene | miRNA | Predicted Effects |
|---|---|---|---|
| Macrophage | Maf1 | miR-122-5p | Required for monocytic, macrophage, osteoclast, and islet beta cell differentiation.→down |
| Pkm | miR-122-5p | Promotes in a STAT1-dependent manner, the expression of the immune checkpoint protein PD-L1 in ARNTL/BMAL1-deficient macrophages, consequently suppresses immune activity.→down | |
| Ocln | miR-122-5p | Regulation of the tight junction and macrophage adhesion and spreading →down | |
| Ifi204 | miR-466f-3p | Inhibits cell growth and may be involved in macrophage differentiation.→down | |
| Il31 | miR-22-3p | May function in skin immunity, enhances myeloid progenitor cell survival in vitro, and induces amyloid A protein expression in macrophages.→up/no | |
| Csf1r | miR-22-3p | Regulation of survival, proliferation and differentiation of macrophages and monocytes and plays an important role in innate immunity and in inflammatory processes.→up/no | |
| Pdgfd | miR-145a-5p | Plays an important role in wound healing and Induces macrophage recruitment.→up/no | |
| Phagocytosis | Il15ra | miR-466f-3p | Required for IL15-induced phagocytosis in neutrophils→down |
| Gulp1 | miR-19b-3p | Required for efficient phagocytosis of apoptotic cells.→up/no |
Genes in bold are high priority for further analysis in the next research phase.
On the other hand, Il31, Csf1r, and Pdgfd are predicted to be involved in the proliferation and differentiation of macrophages. Among them, Il31 is specific to skin immunity. Gulp1 is predicted to have a promoting effect on phagocytosis. The effects of these four genes are predicted to be promotive to the immune system because these genes are up/no-regulated by down-regulated miR-22-3p, miR-145a-5p, and miR-19b-3p.
A special remark should be made regarding Pkm. Pkm is included in the top 30 of Table 2 and its role includes the promotion of the immune checkpoint ligand PD-L1 in a STAT1 (signal transducer and activator of transcription 1)-dependent manner in macrophages lacking circadian genes, thus acting as a brake on the immune system [41]. Here, Pkm is down-regulated by miR-122-5p, and therefore, PD-L1 was suppressed and, consequently, immune activity was thought to be enhanced.
In conclusion, the newly predicted genes related to immune system activation by the third search were Pdgfd, Gulp1, and Pkm (Csf1r was already selected by the second search).
3. Material and Methods
3.1. Cell Culture
The mouse colon-26 cell line was obtained from RIKEN BRC and cultured in RPMI-1640 (Gibco, Thermo Fisher Scientific, Tokyo, Japan) containing 10% FBS and 1% penicillin–streptomycin at 37 °C under 5% CO2. When the cells reached 70–80% confluence, the medium was removed from the dish, and the cells were washed twice with PBS. Subsequently, 400 μL of a solution containing 0.25 (w/v) % trypsin and 1 mM EDTA was added to the dish. Following incubation at 37 °C under 5% CO2 for 5 min, the cells were detached from the dish for subculture. Mouse macrophage J774.1 was obtained from RIKEN BRC. J774.1 cells were cultured in accordance with the methodology previously described for mouse melanoma cells [25].
3.2. Animals
This study was conducted in accordance with the ALLIVE guidelines. The BALB/c male mice were sourced from Kiwa Laboratory Animal Research Center (Wakayama, Japan). The mice were used in the experiments following a one-week period of acclimation. The breeding room was maintained under SPF conditions with a 12 h light–dark cycle. The mice were provided with solid food (MF, Oriental Yeast Co., Ltd., Tokyo, Japan).
3.3. Generation of a Nanog-Overexpressing Colon Cancer Cell Line
A cell line overexpressing Nanog designated Nanog⁺colon26 was generated by introducing the pCAG-Nanog-IRES-puroR-EGFP vector into the colon-26 cells. The vector solution (4 µg/250 µL RPMI-1640) and Lipofectamine 2000 (Thermo Fisher Scientific) solution (5 µL/250 µL RPMI-1640) were combined and incubated at room temperature for 20 min. The mixture was added to the colon-26 culture medium and incubated at 37 °C and 5% CO2 for 3 h. The medium was then replaced with fresh RPMI-1640 medium, and the cells were cultured for 48 h. The Nanog+colon26 cells were then selected by culturing them in a puromycin-containing RPMI-1640 medium for 2 weeks.
3.4. Proliferation Activity
Cells were cultured in dishes (6 cmϕ). The initial cell density was 1 × 10⁵ cells/dish. Replacing the medium with fresh medium at 48 h, the culture was continued for another 48 h. Cells were collected at 48 h and 98 h by trypsin/EDTA treatment, and the number of cells was determined.
3.5. Migration Activity
The migration activity of colon cells was analyzed using a Transwell® 24-well plate (Corning, Corning, NY, USA). Cells were serum-starved for 24 h before use. A cell suspension (1.0 × 10⁵ cells/mL, 0.5 mL) prepared in RPMI was added to the upper Transwell insert, and 0.75 mL of RPMI medium supplemented with 10% FBS was added to the lower well and incubated for 22 h. The membrane was fixed in 100% methanol for 2 min, stained with hematoxylin for 2 min, stained with eosin for 2 min, and photographed.
3.6. Invasion Activity
The invasion activity of colon cells was analyzed by culture on MatrigelTMMatrix Basement Membrane (BD Biosciences, Tokyo, Japan) that was coated on a porous membrane of a Transwell® 24-well plate. The number of cells that passed through the Matrigel and porous membrane for 22 h was analyzed in the same manner as above (Section 3.5).
3.7. Gelatine Zymography for Matrix Metalloproteinase (MMP) Activity
Protein samples for zymography were prepared from colon cells after the cells were incubated in the RPMI medium (pH 5.5) for 3 h at 25 °C to maintain enzymatic activity. A sample solution containing 10 μg protein was separated by SDS-PAGE. After SDS-PAGE, the gel was washed with a washing buffer (pH 7.5) containing 0.05 M Tris-HCl, 2.5 v/v% TritonX-100, 5 mM CaCl2, 1 μM ZnCl2, and 0.016% NaN3, for 30 min. The gel was stained with CBB and decolorized with a methanol–acetic acid solution. Band images were quantified using ImageJ software (Version 1.54k).
3.8. Quantification of Colon Metastasis to Liver
To quantify the liver metastasis, colon-26 cells or Nanog+colon26 cells (1.0 × 10⁶ cells/50 µL PBS) were injected into the spleen of 8~9-week-old mice. Two weeks following the injection of cells, the mice were euthanized by cervical dislocation, and the livers were removed (Figure 2A). The livers were sectioned into lobes and photographed. The tumors in the images were made black using the Image J software, and the surface area of the tumors was calculated (Figure 2B).
3.9. Preparation of EVs
EV-depleted FBS was prepared from FBS by centrifugation at 100,000× g at 4 °C for a total of 80 min. The cells were cultured in RPMI-1640 medium for 48 h, after which the medium was removed, and the cells were washed with PBS. Following a 72 h incubation period in EV-depleted medium (RPMI-1640, 10% EV-depleted FBS, 1% penicillin–streptomycin), the culture supernatant was subjected to centrifugation at 2000× g at 4 °C for 20 min. Subsequently, the supernatant was centrifuged at 10,000× g at 4 °C for 40 min, after which the resulting supernatant was centrifuged again at 120,000× g at 4 °C for 80 min. The precipitate was suspended in 10 mL of phosphate-buffered saline (PBS) and filtered through a 0.22 µm pore-size filter. The filtrate was divided into two fractions in a volume ratio of 1:9. The larger fraction was then centrifuged again at 120,000× g at 4 °C for 80 min, after which the precipitate was suspended in PBS. The resulting solution contained mainly exosomes and some portion of larger particles, and therefore, we called this an EV solution. The remaining fraction was combined with 50 µL of RIPA buffer (25 mM Tris-HCl, 150 mM NaCl, 1% NP-40, 1% sodium deoxycholate, 0.1% SDS, pH 7.6; Thermo Fisher Scientific) and employed as a protein sample for the BCA (bicinchoninic acid) assay (Pierce® BCA TM Protein Assay kit, Thermo Fisher Scientific). The mode diameter and mean diameter of EVs were approximately 90 nm and 130 nm, respectively. The presence of exosomes was confirmed by the detection of marker proteins for exosomes, CD81, TSG101, and Alix, by Western blot analysis. The absence of contamination of cellular components was checked by the absence of GM130.
3.10. Western Analysis of EVs Markers, Negative Marker, and Gapdh
A protein sample of cells was prepared as follows: Following the rinsing of 70–80% confluent cells with PBS, a RIPA buffer was added to the culture dish. The culture dish was then placed on ice for a period of 15 min. Subsequently, the cells were detached from the culture dish with a cell scraper and collected in a 1.5 mL microtube. The cell suspension was subjected to sonication on ice and centrifugation at 20,000× g at 4 °C for 15 min. The supernatant was collected as a protein sample of the cells. A protein solution of EVs was prepared as follows: The pellet of EVs obtained as the precipitate of ultracentrifugation was suspended in a RIPA buffer and allowed to stand on ice for 15 min. The protein concentration was determined by BCA assay. A protein solution was prepared by mixing a 1/6 volume of a 0.375 M Tris-HCl (pH 6.8) buffer solution containing 93 μg/mL DTT, 0.12 g/mL SDS, 0.6 mL/mL glycerol, and 0.6 mL/mL bromophenol blue. Subsequently, the solution was heated to 95 °C for 5 min and applied to SDS-PAGE at 150 V. Blotting onto a PVDF membrane was conducted at 100 V for 3 h at 4 °C. Subsequently, the PVDF membrane was immersed in a TBS-T solution (Tris-buffered saline (25 mM Tris, pH 7.4, 150 mM NaCl) containing 1 (v/v) % Tween 20) containing 5 (w/v) % skim milk at 25 °C for 30 min. Subsequently, the PVDF membrane was incubated in a 5% skim milk TBS-T solution containing primary antibody at 25 °C for 3 h. The primary antibodies used were mouse anti-mouse Gapdh (1:1000, sc-32233; Santa Cruz Biotechnology, Dallas, TX, USA), mouse anti-mouse CD81 (1:500, sc-166029; Santa Cruz Biotechnology, Dallas, TX, USA), mouse anti-mouse TSG101 (1:500, sc-7964; Santa Cruz Biotechnology, Dallas, TX, USA), mouse anti-mouse Alix (1:500, sc-53538; Santa Cruz Biotechnology, Dallas, TX, USA), and mouse anti-mouse GM130 (#610822; BD Bioscience), respectively. Following three washes with TBS-T, the membrane was incubated in TBS-T containing a secondary antibody (anti-mouse immunoglobulin conjugated to alkaline phosphatase, Promega, Madison, WI, USA) at 25 °C for 1 h. Membranes were washed three times with TBS-T and then incubated with Western Blue Stabilized Substrate (Promega) for alkaline phosphatase at 25 °C.
3.11. Analysis of the Transfer of EVs to Various Organs in Mice
EVs were stained with CellVueTM NIR815 (Invitrogen, Thermo Fisher Scientific) and introduced into mice by tail vein injection at a dose of 5 µg per 100 µL of PBS. The mice were euthanized at 3 h and various organs were extracted for imaging analysis with the Pearl Trilogy imaging system (LI-COR) at 800 nm. The integrated fluorescence intensity of the entire organ was divided by the organ area (signal/area) in order to estimate the density of EVs accumulated in each organ.
3.12. In Vivo Test of the Effects of EVs on Metastasis
The introduction of EVs into mice was conducted via tail vein injection at a dose of 5 µg/100 µL PBS, administered three times per week for a period of three weeks (Figure 2C). Subsequently, Nanog⁺colon26 cells (1.0 × 10⁶ cells/50 µL PBS) were injected into the spleen of the mice. Two weeks later, the mice were euthanized by cervical dislocation, and the livers were removed. The quantification of colon metastasis was conducted according to the method described above (Section 3.8).
3.13. Phagocytic Activity Test
The phagocytic activity of J774.1 cells was estimated by means of a microbeads (MBs) uptake test. EVs were stained with a fluorescent dye, PKH26 (Ex: 551 nm, Em: 567 nm, DOJINDO). FITC-labeled microbeads (FITC-MBs) (Ex: 441 nm, Em: 486 nm, Sigma, Kanagawa, Japan) were incubated at 37 °C for 1 h in RPMI medium containing 10% heat-inactivated FBS for opsonization. J774.1 cells were incubated in RPMI medium with or without FITC-MBs and/or PKH26-EVs for a period of 2 h. Following this incubation period, the J774.1 cells were collected for flow cytometry analysis using the FACSAriaII (BD Bioscience). Phagocytic activity was also analyzed at the single-cell level by fluorescent microscopy. In this case, EVs were used without fluorescent labeling. The cell suspension was then placed in a hemocytometer, and bright field and fluorescent images were taken with a fluorescent microscope. The bright field and fluorescent images were merged using ImageJ to determine the percentage of cells that had taken up MBs and the number of MBs taken up by each individual cell. Three wells were prepared for PBS, colon26EVs, and Nanog+colon26EVs groups and 200 to 300 cells were placed in each well.
3.14. Analysis of miRNAs and Their Target Genes
The differential expression analysis of miRNAs expressed in Nanog+colon26EVs and colon26EVs was outsourced to Macrogen Japan (Tokyo, Japan). The magnitude of variation (fold change, Fc) and the statistical significance (p-value) of the respective miRNA components were obtained.
3.15. Statistical Analysis
Each test sample was subjected to two or three analyses, with the average of the two or three results recorded as the value for one test sample. The results are presented as the mean and standard deviation (SD) for the number of samples (n). The results of the metastatic colony analyses are presented in box plots. Outliers depicted in box plots were identified through the application of a Smirnoff–Grubbs test, which determined that they exhibited a probability of greater than 0.05. The statistical significance between two specific data groups was analyzed by a two-tailed Student’s t-test. The statistical significance of the results is indicated by a p-value or by the use of asterisks; ***: p < 0.001; **: p < 0.01; *: p < 0.05.
4. Discussion
This study consists of two propositions. First, do cancer cells become more malignant due to Nanog? Second, do EVs obtained from Nanog overexpressing cancer cells suppress cancer metastasis? In Nanog+colon26 cells, the answer to the first proposition was not necessarily yes. In other words, the properties of the cells in vitro did not show any results indicating high malignancy as cancer cells, except for an increased proliferation rate. However, the metastatic ability in vivo was enhanced, suggesting a more malignant property in cancer cells. The answer to the second proposition was yes. We thought that the essential effect of Nanog was to enhance the undifferentiated state of cells rather than to make cells more malignant. iPS cells are highly undifferentiated cells. That EVs derived from iPS cells showed a high metastasis suppression effect supports this idea [31].
Regarding the action mechanism of EVs, we focused on the involvement of macrophages. Phagocytosis activity tests showed that the activity of Nanog+colon26EVs was higher than that of colon26EVs. Furthermore, it was estimated that the antitumor ability of macrophages was enhanced by the enhanced expression of the M1 marker CD80. Then, we conducted small RNA sequencing to predict miRNAs and target genes involved in macrophage activation. As a result, nine candidate genes were predicted (Table 6). Based on these results, we plan to conduct the following experiments. The first is control at the miRNA level, which is an increase in miR-122-5p and/or miR-466f-3p. Pkm and Ins1 are down-regulated by miR-122-5p and miR-466f-3p, respectively. A further increase in miR-122-5p and/or miR-466f-3p will increase the Pkm- and Ins1-dependent suppression effects. On the other hand, the other seven genes in Table 6 are regulated by miR-22-3p, miR-145a-5p, miR-423-3p, or miR-19b-3p. Metastasis suppressing effects obtained via these four miRNAs and seven target genes may be enhanced by further reducing miRNAs expression levels or by increasing the expression levels of seven target genes. We plan to prioritize experiments starting with genes that are thought to be more closely related to macrophages, i.e., Pdgfd, Gulp1, and Csf1r. Next is Pik3cd, which is related to B-cell activation, followed by Erbb3, Fgfr2, and Esr1, which are related to cell proliferation and differentiation of immune system cells.
Table 6.
Predicted genes contributing to promoting and activating macrophages and the immune system. Up-regulated and down-regulated miRNAs in Nanog+colon26 are indicated in red and blue, respectively.
| miRNAs | Genes | Most Relevant Keyword |
|---|---|---|
| miR-122-5p | Pkm | Immune checkpoint |
| miR-466f-3p | Ins1 | Pre-diabetes condition |
| miR-22-3p | Erbb3 | Cell growth and differentiation |
| Esr1 | ||
| Csf1r | ||
| Pik3cd | B-cell | |
| miR-145a-5p | Pdgfd | Macrophage |
| miR-423-3p | Fgfr2 | Cell growth and differentiation |
| miR-19b-3p | Gulp1 | Phagocyte |
At present, it is still difficult to discuss commonalities and characteristics between types of cancer. The limitation of this research is that the molecular mechanism of the role of Nanog is still largely unknown. It is important to focus on specific cancers and analyze their signaling pathways even if the clarified pathways may be fragmentary. Furthermore, it is more important to consider the issues of side effects. We have not yet gained any knowledge about these issues. Unless these problems are resolved, we will not be able to overcome our limitations. However, the findings of this study certainly support our research in a promising direction.
5. Conclusions
Nanog overexpression enhanced the metastatic potential of colon-26 cells, though in vitro properties of Nanog+colon26 were not so malignant as expected. Nanog+colon26EVs were effective for the suppression of metastasis of Nanog+colon26 to the liver. The involvement of macrophages in the suppressive effects was demonstrated. The up-regulation of two miRNAs and seven genes and the down-regulation of four miRNAs and two genes were predicted to be effective for the suppressive effects.
Acknowledgments
We thank Setsuko Hashimoto for stimulating discussion about cancer vaccine technologies.
Author Contributions
M.S. designed the studies, analyzed the results, and wrote the manuscript. T.H. conducted the experiments and data analysis. H.M. conducted miRNA data analysis. N.K. conducted the experiments. All authors have read and agreed to the published version of the manuscript.
Institutional Review Board Statement
All animal experimental procedures were conducted according to the guidelines of the “Guide for the Care and Use of the Laboratory Animals” of the Tokyo University of Agriculture and Technology, Japan, and approved by the Institutional Animal Care and Use Committee of Tokyo University of Agriculture and Technology (IACUC No. R04-74, R05-76).
Informed Consent Statement
Written informed consent was obtained from all subjects involved in the study.
Data Availability Statement
The datasets generated and/or analyzed during the current study are available from the corresponding author on reasonable request.
Conflicts of Interest
The authors declare no conflict of interest.
Funding Statement
This study was supported by a special fund donated to TUAT and JSPS KAKENHI, Grant Number JP24K09432.
Footnotes
Disclaimer/Publisher’s Note: The statements, opinions and data contained in all publications are solely those of the individual author(s) and contributor(s) and not of MDPI and/or the editor(s). MDPI and/or the editor(s) disclaim responsibility for any injury to people or property resulting from any ideas, methods, instructions or products referred to in the content.
References
- 1.Kajiyama H., Shibata K., Terauchi M., Yamashita M., Ino K., Nawa A., Kikkawa F. Chemoresistance to paclitaxel induces epithelial-mesenchymal transition and enhances metastatic potential for epithelial ovarian carcinoma cells. Int. J. Oncol. 2007;31:277–283. doi: 10.3892/ijo.31.2.277. [DOI] [PubMed] [Google Scholar]
- 2.Wattanawongdon W., Hahnvajanawong C., Namwat N., Kanchanawat S., Boonmars T., Jearanaikoon P., Leelayuwat C., Techasen A., Seubwai W. Establishment and characterization of gemcitabine-resistant human cholangiocarcinoma cell lines with multidrug resistance and enhanced invasiveness. Int. J. Oncol. 2015;47:398–410. doi: 10.3892/ijo.2015.3019. [DOI] [PubMed] [Google Scholar]
- 3.Cao W., Wei W., Zhan Z., Xie D., Xie Y., Xiao Q. Regulation of drug resistance and metastasis of gastric cancer cells via the microRNA647-ANK2 axis. Int. J. Mol. Med. 2018;41:1958–1966. doi: 10.3892/ijmm.2018.3381. [DOI] [PMC free article] [PubMed] [Google Scholar]
- 4.Speers C., Zhao S., Liu M., Bartelink H., Pierce L.J., Feng F.Y. Development and validation of a novel radiosensitivity signature in human breast cancer. Clin. Cancer Res. 2015;21:3667–3677. doi: 10.1158/1078-0432.CCR-14-2898. [DOI] [PubMed] [Google Scholar]
- 5.Carlos-Reyes A., Muñiz-Lino M.A., Romero-Garcia S., López-Camarillo C., Hernández-de la Cruz O.N. Biological adaptations of tumor cells to radiation therapy. Front. Oncol. 2021;11:718636. doi: 10.3389/fonc.2021.718636. [DOI] [PMC free article] [PubMed] [Google Scholar]
- 6.Zitvogel L., Regnault A., Lozier A., Wolfers J., Flament C., Tenza D., Ricciardi-Castagnoli P., Raposo G., Amigorena S. Eradication of established murine tumors using a novel cell-free vaccine: Dendritic cell-derived exosomes. Nat. Med. 1998;4:594–600. doi: 10.1038/nm0598-594. [DOI] [PubMed] [Google Scholar]
- 7.Sun H.R., Wang S., Yan S.C., Zhang Y., Nelson P.J., Jia H.L., Qin L.X., Dong Q.Z. Therapeutic Strategies Targeting Cancer Stem Cells and Their Microenvironment. Front. Oncol. 2019;9:1104. doi: 10.3389/fonc.2019.01104. [DOI] [PMC free article] [PubMed] [Google Scholar]
- 8.Kuşoğlu A., Avcı Ç.B. Cancer Stem Cells: A Brief Review of Current Status. Gene. 2019;681:80–85. doi: 10.1016/j.gene.2018.09.052. [DOI] [PubMed] [Google Scholar]
- 9.Lin C.C., Liao T.T., Yang M.H. Immune Adaptation of Colorectal Cancer Stem Cells and Their Interaction with the Tumor Microenvironment. Front. Oncol. 2020;10:588542. doi: 10.3389/fonc.2020.588542. [DOI] [PMC free article] [PubMed] [Google Scholar]
- 10.Zalewski A., Snook A.E., Waldman S.A. Stem Cells as Therapeutic Targets in Colorectal Cancer. Pers. Med. 2021;18:171–183. doi: 10.2217/pme-2020-0099. [DOI] [PMC free article] [PubMed] [Google Scholar]
- 11.Du L., Cheng Q., Zheng H., Liu J., Liu L., Chen Q. Targeting Stemness of Cancer Stem Cells to Fight Colorectal Cancers. Semin. Cancer Biol. 2022;82:150–161. doi: 10.1016/j.semcancer.2021.02.012. [DOI] [PubMed] [Google Scholar]
- 12.Chen C.L., Kumar D.B.U., Punj V., Xu J., Sher L., Tahara S.M., Hess S., Machida K. NANOG metabolically reprograms tumor-initiating stem-like cells through tumorigenic changes in oxidative phosphorylation and fatty acid metabolism. Cell Metab. 2016;23:206–219. doi: 10.1016/j.cmet.2015.12.004. [DOI] [PMC free article] [PubMed] [Google Scholar]
- 13.Gawlik-Rzemieniewska N., Bednarek I. The role of NANOG transcriptional factor in the development of malignant phenotype of cancer cells. Cancer Biol. Ther. 2016;17:1–10. doi: 10.1080/15384047.2015.1121348. [DOI] [PMC free article] [PubMed] [Google Scholar]
- 14.Saito M. Novel roles of Nanog in cancer cells and their extracellular vesicles. Cells. 2022;11:3881. doi: 10.3390/cells11233881. [DOI] [PMC free article] [PubMed] [Google Scholar]
- 15.Saito M., Kishi R., Sasai T., Hatakenaka T., Matsuki N., Minagawa S. Effect of Nanog overexpression on the metastatic potential of a mouse melanoma cell line B16-BL6. Mol. Cell. Biochem. 2021;476:2651–2661. doi: 10.1007/s11010-021-04110-8. [DOI] [PMC free article] [PubMed] [Google Scholar]
- 16.Wolfers J., Lozier A., Raposo G., Regnault A., Théry C., Masurier C., Flament C., Pouzieux S., Faure F., Tursz T., et al. Tumor-derived exosomes are a source of shared tumor rejection antigens for CTL cross-priming. Nat. Med. 2001;7:297–303. doi: 10.1038/85438. [DOI] [PubMed] [Google Scholar]
- 17.Rao Q., Zuo B., Lu Z., Gao X., You A., Wu C., Du Z., Yin H. Tumor-derived exosomes elicit tumor suppression in murine hepatocellular carcinoma models and humans in vitro. Hepatology. 2016;64:456–472. doi: 10.1002/hep.28549. [DOI] [PubMed] [Google Scholar]
- 18.Xu Z., Zeng S., Gong Z., Yan Y. Exosome-based immunotherapy: A promising approach for cancer treatment. Mol. Cancer. 2020;19:160. doi: 10.1186/s12943-020-01278-3. [DOI] [PMC free article] [PubMed] [Google Scholar]
- 19.Khalaj K., Figueira R.L., Antounians L., Lauriti G., Zani A. Systematic review of extracellular vesicle-based treatments for lung injury: Are EVs a potential therapy for COVID-19? J. Extracell. Vesicles. 2020;9:1795365. doi: 10.1080/20013078.2020.1795365. [DOI] [PMC free article] [PubMed] [Google Scholar]
- 20.Jamalkhah M., Asaadi Y., Azangou-Khyavy M., Khanali J., Soleimani M., Kiani J., Arefian E. MSC-derived exosomes carrying a cocktail of exogenous interfering RNAs an unprecedented therapy in era of COVID-19 outbreak. J. Transl. Med. 2021;19:164. doi: 10.1186/s12967-021-02840-3. [DOI] [PMC free article] [PubMed] [Google Scholar]
- 21.Gurung S., Perocheau D., Touramanidou L., Baruteau J. The exosome journey: From biogenesis to uptake and intracellular signaling. Cell Commun. Signal. 2021;19:47. doi: 10.1186/s12964-021-00730-1. [DOI] [PMC free article] [PubMed] [Google Scholar]
- 22.Mitchell M.I., Ma J., Carter C.L., Loudig O. Circulating exosome cargoes contain functionally diverse cancer biomarkers: From biogenesis and function to purification and potential translational utility. Cancers. 2022;14:3350. doi: 10.3390/cancers14143350. [DOI] [PMC free article] [PubMed] [Google Scholar]
- 23.Kar R., Dhar R., Mukherjee S., Nag S., Gorai S., Mukerjee N., Mukherjee R., Vatsa R., Jadhav M.C., Ghosh A., et al. Exosome-based smart drug delivery tool for cancer theranostics. [(accessed on 4 October 2024)];ACS Biomater. Sci. Eng. 2023 9:577–594. doi: 10.1021/acsbiomaterials.2c01329. Available online: https://pubs.acs.org/doi/10.1021/acsbiomaterials.2c01329#. [DOI] [PMC free article] [PubMed] [Google Scholar]
- 24.Karn V., Ahmed S., Tsai L.-W., Dubey R., Ojha S., Singh H.N., Kumar M., Gupta P.K., Sadhu S., Jha N.K., et al. Extracellular vesicle-based therapy for COVID-19: Promises, challenges and future prospects. Biomedicines. 2021;9:1373. doi: 10.3390/biomedicines9101373. [DOI] [PMC free article] [PubMed] [Google Scholar]
- 25.Vecchio F.D., Martinez-Rodriguez V., Schukking M., Cocks A., Broseghini E., Fabbri M. Professional killers: The role of extracellular vesicles in the reciprocal interactions between natural killer, CD8+ cytotoxic T-cells and tumour cells. J. Extracell. Vesicles. 2021;10:e12075. doi: 10.1002/jev2.12075. [DOI] [PMC free article] [PubMed] [Google Scholar]
- 26.Lasek W., Zagożdżon R., Jakobisiak M. Interleukin 12: Still a promising candidate for tumor immunotherapy? Cancer Immunol. Immunother. 2014;63:419–435. doi: 10.1007/s00262-014-1523-1. [DOI] [PMC free article] [PubMed] [Google Scholar]
- 27.Principe D.R., Doll J.A., Bauer J., Jung B., Munshi H.G., Bartholin L., Pasche B., Lee C., Grippo P.J. TGF-β: Duality of function between tumor prevention and carcinogenesis. J. Natl. Cancer Inst. 2014;106:djt369. doi: 10.1093/jnci/djt369. [DOI] [PMC free article] [PubMed] [Google Scholar]
- 28.Rossowska J., Anger N., Wegierek K., Szczygieł A., Mierzejewska J., Milczarek M., Szermer-Olearnik B., Pajtasz-Piasecka E. Antitumor potential of extracellular vesicles released by genetically modified murine colon carcinoma cells with overexpression of interleukin-12 and shRNA for TGF-b1. Front. Immunol. 2019;10:211. doi: 10.3389/fimmu.2019.00211. [DOI] [PMC free article] [PubMed] [Google Scholar]
- 29.Chauhan N., Dhasmana A., Jaggi M., Chauhan S.C., Yallapu M.M. miR-205: A potential biomedicine for cancer therapy. Cells. 2020;9:1957. doi: 10.3390/cells9091957. [DOI] [PMC free article] [PubMed] [Google Scholar]
- 30.Hatakenaka T., Matsuki N., Minagawa S., May C.K.S., Saito M. Anti-metastatic function of extracellular vesicles derived from Nanog-overexpressing melanoma. Curr. Oncol. 2022;29:1029–1046. doi: 10.3390/curroncol29020088. [DOI] [PMC free article] [PubMed] [Google Scholar]
- 31.Khoo C.S.M., Henmi T., Saito M. Comparative study of metastasis suppression effects of extracellular vesicles derived from anaplastic cell lines, Nanog-overexpressing melanoma, and induced pluripotent stem cells. Int. J. Mol. Sci. 2023;24:17206. doi: 10.3390/ijms242417206. [DOI] [PMC free article] [PubMed] [Google Scholar]
- 32.Global Cancer Observatory. Cancer Tomorrow WHO International Agency for Research on Cancer. 2024. [(accessed on 4 October 2024)]. Available online: https://gco.iarc.fr/en.
- 33.Arlt F., Stein U. Colon cancer metastasis: MACC1 and Met as metastatic pacemakers. Int. J. Biochem. Cell Biol. 2009;41:2356–2359. doi: 10.1016/j.biocel.2009.08.001. [DOI] [PubMed] [Google Scholar]
- 34.Merck, Sharp. Dohme LLC Study of Pembrolizumab (MK-3475) vs Standard Therapy in Participants with Microsatellite Instability-High (MSI-H) or Mismatch Repair Deficient (dMMR) Stage IV Colorectal Carcinoma (MK-3475-177/KEYNOTE-177) [(accessed on 4 October 2024)];Clinical Trials gov. ID NCT02563002. 2024 Available online: https://clinicaltrials.gov/study/NCT02563002.
- 35.Descarpentrie J., Araúzo-Bravo M.J., He Z., François A., González Á., Garcia-Gallastegi P., Badiola I., Evrard S., Pernot S., Creemers J.W.M., et al. Role of furin in colon cancer stem cells malignant phenotype and expression of LGR5 and NANOG in KRAS and BRAF-mutated colon tumors. Cancers. 2022;14:1195. doi: 10.3390/cancers14051195. [DOI] [PMC free article] [PubMed] [Google Scholar]
- 36.Zhang M., Peng R., Wang H., Yang Z., Zhang H., Zhang Y., Wang M., Wang H., Lin J., Zhao Q., et al. Nanog mediated by FAO/ACLY signaling induces cellular dormancy in colorectal cancer cells. Cell Death Dis. 2022;13:159. doi: 10.1038/s41419-022-04606-1. [DOI] [PMC free article] [PubMed] [Google Scholar]
- 37.Hoshino A., Costa-Silva B., Shen T.L., Rodrigues G., Hashimoto A., Mark M.T., Molina H., Kohsaka S., Giannatale A.D., Ceder S., et al. Tumour exosome integrins determine organotropic metastasis. Nature. 2015;527:329–335. doi: 10.1038/nature15756. [DOI] [PMC free article] [PubMed] [Google Scholar]
- 38.Tarique A.A., Logan J., Thomas E., Holt P., Sly P.D., Fantino E. Phenotypic, functional, and plasticity features of classical and alternatively activated human macrophages. Am. J. Respir. Cell Mol. Biol. 2015;53:676–688. doi: 10.1165/rcmb.2015-0012OC. [DOI] [PubMed] [Google Scholar]
- 39.Xiang W., Shi R., Zhang D., Kang X., Zhang L., Yuan J., Zhang X., Miao H. Dietary fats suppress the peritoneal seeding of colorectal cancer cells through the TLR4/Cxcl10 axis in adipose tissue macrophages. Signal Transduct. Targeted Ther. 2020;5:239. doi: 10.1038/s41392-020-00327-z. [DOI] [PMC free article] [PubMed] [Google Scholar]
- 40.Khoo C.S.M., Hatakenaka T., Matsuki N., Minagawa S., Asami K., Henmi T., Morimoto A., Saito M. Moderate hyperglycemia suppresses melanoma metastasis to the liver. Exp. Anim. 2023;72:183–192. doi: 10.1538/expanim.22-0078. [DOI] [PMC free article] [PubMed] [Google Scholar]
- 41.Deng W., Zhu S., Zeng L., Liu J., Kang R., Yang M., Cao L., Wang H., Billiar T.R., Jiang J., et al. The circadian clock controls immune checkpoint pathway in sepsis. Cell Rep. 2018;24:366–378. doi: 10.1016/j.celrep.2018.06.026. [DOI] [PMC free article] [PubMed] [Google Scholar]
Associated Data
This section collects any data citations, data availability statements, or supplementary materials included in this article.
Data Availability Statement
The datasets generated and/or analyzed during the current study are available from the corresponding author on reasonable request.


