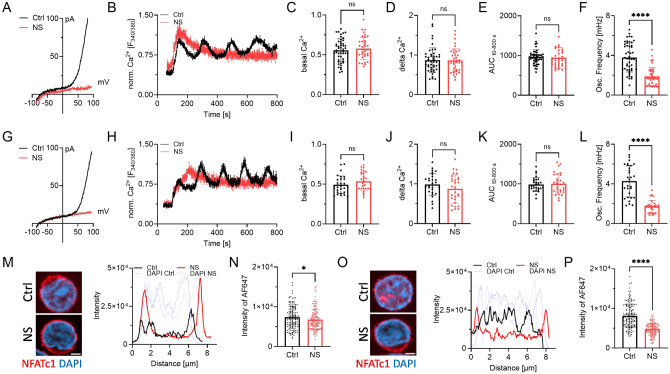
Figure 3: TRPM7 inhibition alters Ca2+ signaling and NFAT translocation in primary human CD4 T lymphocyte.
A) TRPM7 I/V relationship of naïve CD4 T cells during whole-cell patch clamp with Mg2+-free intracellular solution. Cells treated with DMSO as solvent control (Ctrl, black) or cells treated with 30 μM NS8593 (NS, red). B) Representative trace of naïve CD4 T cells Fura-2 based imaging of cytosolic Ca2+ concentrations following anti-CD3/CD28 stimulation. Antibodies bound to microscopy chamber bottom with cells sinking down in saline containing 2 mM Ca2+ during running measurement, coming to rest in focus plane with contact to stimulation antibodies. Cells treated with DMSO as solvent control (Ctrl, black) or treated with 30 μM NS8593 (NS, red). Respective quantification of Ca2+ imaging experiments of naïve CD4 T cells for C) basal, D) delta Ca2+, E) AUC and F) oscillation frequency, n=29-30 cells. G) TRPM7 I/V relationship of conventional CD4 T cells during whole-cell patch clamp with Mg2+-free intracellular solution. Cells treated with DMSO as solvent control (Ctrl, black) or cells treated with 30 μM NS8593 (NS, red), n(Ctrl)=5, n(NS)=5. H) Representative trace of conventional CD4 T cells Fura-2 based imaging of cytosolic Ca2+ concentrations following anti-CD3/CD28 stimulation. Antibodies bound to microscopy chamber bottom with cells sinking down in saline containing 2 mM Ca2+ during running measurement, coming to rest in focus plane with contact to stimulation antibodies. Cells treated with DMSO as solvent control (Ctrl, black) or treated with 30 μM NS8593 (NS, red). Respective quantification of Ca2+ imaging experiments of conventional CD4 T cells for I) basal, J) delta Ca2+, K) AUC and L) oscillation frequency, n=39-48 cells. M) Representative immune-fluorescent images of NFATc1 localization (NFATc1 in red, DAPI in blue) and intensity profile of subcellular NFATc1 distribution (Ctrl in black, NS in red, respective DAPI in blue) of naïve CD4 T cells treated with DMSO as solvent control and TRPM7 inhibited cells upon 30 min stimulation with anti-CD3/CD28, scale bar = 2 μm. N) Quantification of nuclear NFATc1 levels upon stimulation of cells treated with DMSO as solvent (Ctrl, black) or in presence of 30 μM NS8593 (NS, red) cells, n(Ctrl)=149; n(NS)=144. O) Representative immune-fluorescent images of NFATc1 localization (NFATc1 in red, DAPI in blue) and intensity profile of subcellular NFATc1 distribution (Ctrl in black, NS in red, respective DAPI in blue) of conventional CD4 T cells of Ctrl and TRPM7-inhibited cells upon 30 min stimulation with anti-CD3/CD28, scale bar = 2 μm. NFATc1 in red, DAPI in blue. P) Quantification of nuclear NFATc1 levels upon stimulation and treatment with DMSO as solvent control (Ctrl, black) or in presence of 30 μM NS8593 (NS, red) cells, n(Ctrl)=155; n(NS)=132. Statistics: Student´s t test (C-F, I-L, N, P). * P<0.05; **** P<0.0001 and n.s.—not significant. Data are mean ± SD.

