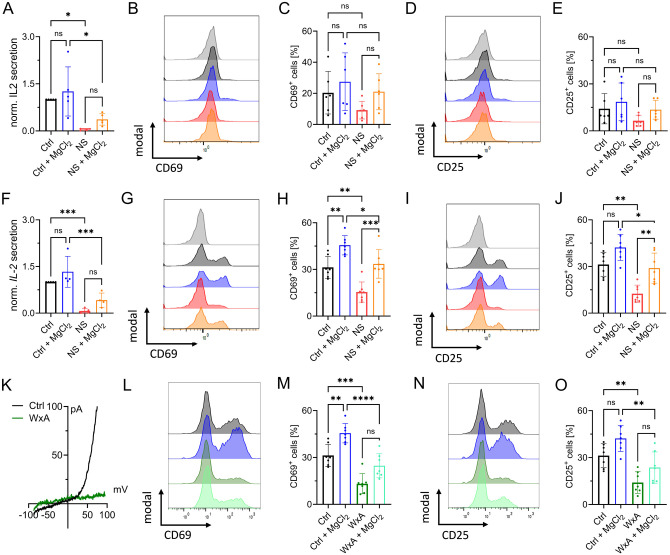
Figure 4: TRPM7 inhibition affects activation of primary human CD4 T cells.
A) IL-2 quantification of supernatant of naïve CD4 T cells 48 h after anti-CD3/CD28 stimulation, n=4-5. Histograms and quantification of upregulated activation markers CD69 (B-C) and CD25 (D-E) in naïve CD4 T lymphocytes 48 h after stimulation. Cells treated either with DMSO as solvent control (Ctrl, black) or with 30 μM NS8593 (NS, red), both with and without supplementation with 6 mM MgCl2. F) IL-2 quantification of supernatant of conventional CD4 T cells 48 h after anti-CD3/CD28 stimulation or cells treated with DMSO as solvent control (Ctrl, black) or with 30 μM NS8593 (NS, red), both with and without supplementation with 6 mM MgCl2, n=4-5. Histograms and quantification of upregulated activation markers CD69 (G-H) and CD25 (I-J) in conventional CD4 T lymphocytes 48 h after stimulation. Cells treated either with DMSO as solvent control (Ctrl, black) or 30 μM NS8593 (NS, red), both with and without supplementation with 6 mM MgCl2. K) TRPM7 I/V relationship of conventional CD4 T cells during whole-cell patch clamp with Mg2+-free intracellular solution. Cells treated with EtOH as solvent control (Ctrl, black) or cells treated with 10 μM waixenicinA (WxA, green). Histograms and quantification of upregulated activation markers CD69 (L-M) and CD25 (N-O) in conventional CD4 T lymphocytes 48 h after stimulation. Cells treated either with EtOH as solvent control (Ctrl, black) or 10 μM waixenicinA (WxA, green), both with and without supplementation of 6 mM MgCl2, n=7. Statistics: One-way ANOVA (A, C, E, F, H, J, M, O). * P<0.05; ** P<0.005; *** P<0.0005; **** p<0.0001 and n.s.—not significant. Data are mean ± SD.

