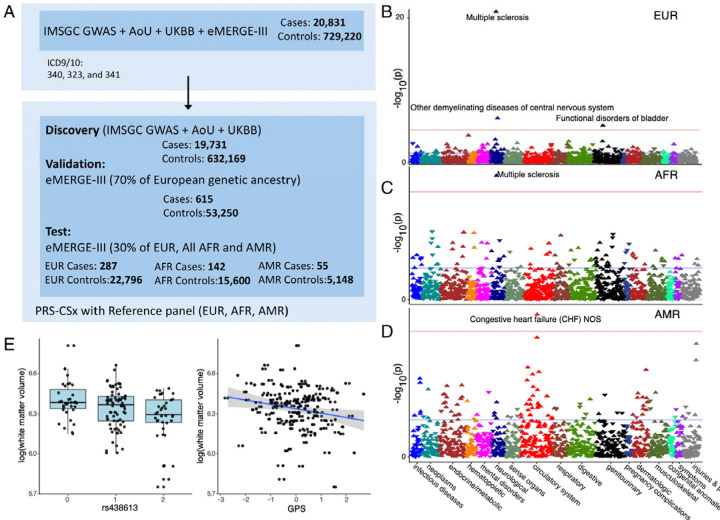
Fig. 4. Workflow for the analaysi of MS GPS.
(A) The MS GPS was developed using GWAS summary statistics from the IMSGC, All of Us (AoU), and UK Biobank (UKBB). Optimization was performed using 70% of European ancestry participants from eMERGE-III. GPS performance was validated in the remaining 30% of eMERGE-III participants of EUR and all AMR and AFR.
(B, C, D) PheWAS results are shown for European (N = 23,121), African-American (N = 15,863), and Latino (N = 5,224) participants. The analysis includes combined data from eMERGE participants with both genotype and phenotype information. Logistic regression was used, adjusting for age, sex, batch, and ancestry. Effect estimates and two-sided P-values were reported. Red horizontal lines indicate the phenome-wide significance threshold, adjusted for multiple testing (P = 2.8 × 10 ). The Y-axis represents −log10(P-value), and the X-axis displays system-based phecode groupings. Upward-pointing triangles indicate increased odds for a given phecode, while downward-pointing triangles indicate reduced risk.
(E) Boxplot diagram depicts the genetic effect of rs438613 with a significant association with white matter volume. The scatter plot displays the pattern of MS GPS in relation to white matter volumes.

