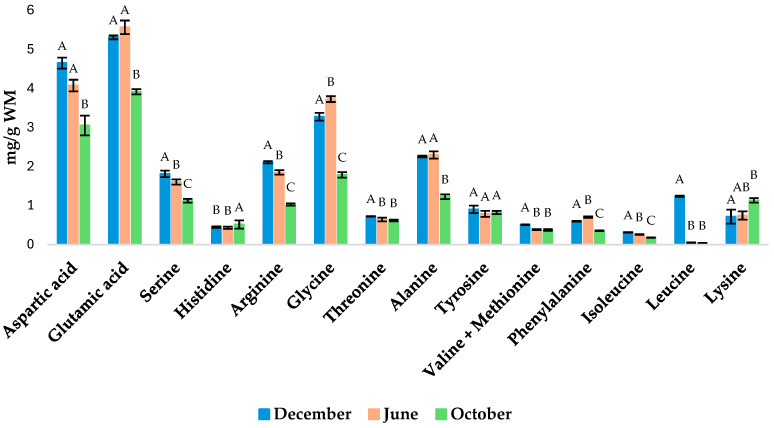
Figure 2.
Results regarding the seasonal quantitative determination of total amino acids in Ostrea edulis. The results are expressed as means (n = 3) ± SD. Results from ANOVA show significant differences between the means. Means that share a common letter (A, B, C) are not significantly different from each other (Tukey’s test, p < 0.05).

