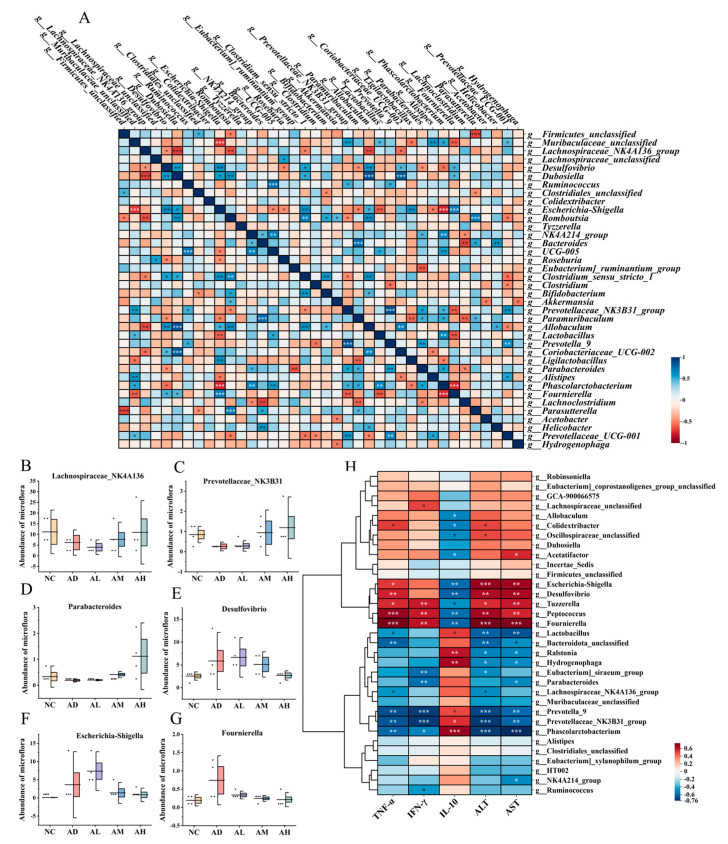
Figure 4.
BC99 elevated the levels of beneficial bacteria while reducing the levels of pathogenic bacteria. (A) Analysis of flora interaction, (B) Lachnospiraceae_NK4A136 abundance, (C) Prevotellaceae_NK3B31 abundance, (D) Parabacteroides abundance, (E) Desulfovibrio abundance, (F) Escherichia-Shigella abundance, (G) Fournierella abundance, (H) correlation analysis of intestinal flora with inflammation and physiological indexes. In (A,H), “*, **, ***” represented significance, * p < 0.05, ** p < 0.01, *** p < 0.001. In (B–G), “*” represented the distribution of sample points.

