Abstract
Differences in charge state distributions of hairpin versus linear strands of oligonucleotides are analyzed using electrospray ionization mass spectrometry (ESI-MS) in the negative ion detection mode. It is observed that the linear structures show lower charge state distribution than the hairpin strands of the same composition. The concentration of ammonium acetate and the cone voltage are major factors that cause the shift of the negative ions in the charge states. The ESI data presented here are supported by UV spectra of strands acquired at 260 nm wavelength in aqueous ammonium acetate solution. We will show that the strands that demonstrate a higher charge state distribution in the gas phase also have a higher melting temperature in solution.
INTRODUCTION
Electrospray ionization mass spectrometry (ESI-MS) has proven to be a powerful technique for the analysis of nucleic acids because ESI-MS produces intact molecular ions directly from the solution phase. As a result, the determinations of the accurate molecular mass, sequence and chemical mutations of oligonucleotides have been made (1–3). In addition, ESI has also been used as a useful tool for the detection of DNA duplexes, triplexes and other specific non-covalent complexes of nucleic acids with ligands (4–8). However, until now no one has reported the use of mass spectrometry to determine a structure within a single oligonucleotide chain.
ESI produces multiply charged ions for macromolecules. Therefore, a typical ESI mass spectrum will contain a distribution of m/z peaks based on the number of charges that a molecule can accommodate. The produced mass spectrum has been referred to as a charged envelope or a charge state distribution. Shifts in multiple charge state distributions for macromolecules during ESI analysis have already been used to determine the conformations of proteins. Loo et al. (9) first reported that the charged envelope shifted to a higher value during the reduction of disulfide-containing proteins, reflecting the denaturation of the protein ion. In a similar manner, Chowdhury et al. (10) observed that bovine cytochrome c showed a higher charge state distribution when it was denatured by acid and a lower charge state distribution when it was in the native conformation. Therefore, they proposed that the charge state shift was reflecting the conformation of the protein in solution. Konermann et al. (11–14) extensively utilized this technique. They studied the equilibrium unfolding of the protein and developed a time-resolved electrospray ionization mass spectrometric technique to observe the kinetic reactions and transient intermediates of proteins in the refolding and unfolding process.
To perform a similar study using oligonucleotides, the four kinds of interactions stabilizing DNA double helixes have to be considered (15–17): (i) electrostatic interactions, (ii) hydrogen bonding, (iii) van der Waals forces and (iv) the hydrophobic effect. The electrostatic interactions occur among the negatively charged phosphates of the DNA backbone and the counter ions in solution, which help to reduce the repulsion of the negative charges. The hydrogen bonding produces Watson–Crick base pairing, with GC base pairing being more stable than AT base pairs. Van der Waals forces and the hydrophobic effect stabilize base stacking and are sequence dependent.
Previous studies (18) have shown that solution compositions, potential gas phase reactions and instrumental parameters affect the charged envelope of the gas phase ions. Cheng et al. (19,20) observed that both organic acids and bases shifted the charge state distributions of negative oligonucleotide ions to lower values. The shifts induced by acids were attributed to the protonation of negative oligonucleotide ions, whereas the base-induced shifts were considered as a result of the gas phase proton transfer from the conjugate acid to the oligonucleotide base. Wang et al. (21) studied the effect of the analyte concentrations on the charge state distributions using analyte species originally present in the salt form. They found a shift of the charge state to lower m/z values with increasing analyte concentrations. Ashton et al. (22) observed that the charge states of ions shift toward lower values with continuous increase in the cone voltage.
Consequently, our protocols have been designed to eliminate the effect of instrumental and solution conditions thereby focusing on how DNA secondary structure affects the charge state distributions of oligonucleotide ions. For this study, six 16mer strands were designed in two sets (Table 1). The oligonucleotides in each set have the same base composition but different sequences. The hairpin sequences contain complementary 5′ and 3′ ends with the central four thymines forming the connecting loop. The linear sequences of the set were rearranged such that strand interactions were minimized. By analyzing these strands, the effects of conformation, GC composition and sequence on the charge state distributions of the negative oligonucleotide ions can be observed. The goal of this research is to develop a method to investigate the secondary structure within a single oligonucleotide chain using ESI-MS. The results acquired from ESI-MS are compared with the data acquired from UV spectrophotometry.
Table 1.
Synthetic oligonucleotide strands
| Set | Sequence | Expected conformation | Name | Number of complimentary bonds (GC) |
|---|---|---|---|---|
| 1 | 5′-CTCAGATTTTTCTGAG-3′ | Hairpin | 1HP | 3 |
| 1 | 5′-CTCAGTCTTAGGTATT-3′ | Linear | 1L | 0 |
| 2 | 5′-GGACTGTTTTCAGTCC-3′ | Hairpin | 2HPa | 4 |
| 2 | 5′-GCGAACTTTTGTTCGC-3′ | Hairpin | 2HPb | 4 |
| 2 | 5′-TCCAGTTGCGTATTCG-3′ | Linear | 2L | 0 |
| 2 | 5′-GCGAACTTTGTCTGCT-3′ | Linear/weak hairpin | 2MHP | 3 |
MATERIALS AND METHODS
Materials
The sequences of DNA oligos were designed and analyzed for potential conformations using the SEQUIN (23) and the mfold algorithm (http://www.bioinfo.rpi.edu/applications/mfold/). All commercially obtained oligonucleotide strands (Midland Certified Reagent Co., Midland, TX) were dissolved in deionized water and stored as 400–500 μM stock solutions. A 100 μl aliquot of the stock solution was purified by using SpinDialyzer Turbo dialyzer with regenerated cellulose membranes of molecular weight cutoff 1 kDa (Harvard Bioscience, Holliston, MA) in a 20 mM NH4OAc buffer solution. The 11T (11monothymine) DNA strand was selected as an internal standard for monitoring the reproducibility of analysis. For ESI-MS analysis, the solution was diluted to 20 μM using 20/80 (v/v) methanol/aqueous 10 mM ammonium acetate solution. For the UV analysis, the stock solution was diluted to 5 μM using an aqueous 10 mM ammonium acetate solution.
Mass spectrometry
All mass spectra were acquired on a Micromass Trio 2000 mass spectrometer (Micromass, Beverly, MA) with an external power supply (Finnigan Mat, Boston, MA) in the negative ion mode (3.0–4.0 kV). A 0.1 mm ID, untreated fused silica capillary (Supelco, Bellefonte, PA) pulled at its tip was used for spraying the liquid samples. In the present study, we also removed the counter electrode from the original source region to allow the probe to get closer to the sample orifice thereby producing smaller droplets and decreasing the lifetime of droplets. This reflects the work of Mirza et al. (24) that studied the denaturation probability of a protein during droplet evaporation process and indicated that decreasing droplet size and lifetime improved reliability of the conformational information obtained by ESI-MS.
Samples were infused into the source region at a rate of 4 μl/min. The flow rates of the nebulizing sheath gas and bath gas were 2 and 200 l/h, respectively. The source temperature was set at 150°C. The lenses 2 and 3 were optimized to produce maximum DNA signals. Each spectrum was obtained by averaging together 20 scan taken over a 400–2000 m/z range. The resultant spectra were integrated using the Mass Lynx 2.3 software. All experiments were performed in triplicate.
UV spectra determination
The UV experiments were conducted on a CARY 100 Bio UV-visible spectrophotometer with a CARY dual cell Peltier accessory (Varian, Walnut Creek, CA). The absorbance of each strand was measured at 260 nm with an increase of the temperature from 20 to 95°C using 2°C increments and a holding time of 1 min. The melting temperatures were determined using an absorbance-temperature derivative curve.
RESULTS
Preliminary studies were conducted to ensure our ability to detect nucleic acid pairing, such as that seen in the stem of a hairpin. Our ESI-MS instrument detected intense peaks for a double-stranded DNA formed from two complementary oligonucleotide strands at cone voltage 30 V. Following up we studied the charge state distributions of the single-stranded oligonucleotide ions with the hairpin and linear conformation at various solution and instrument conditions.
Effect of ammonium acetate concentration
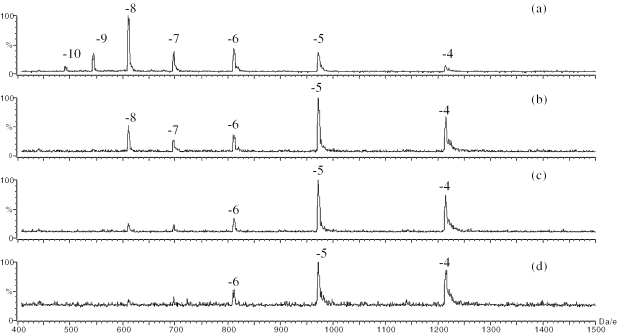
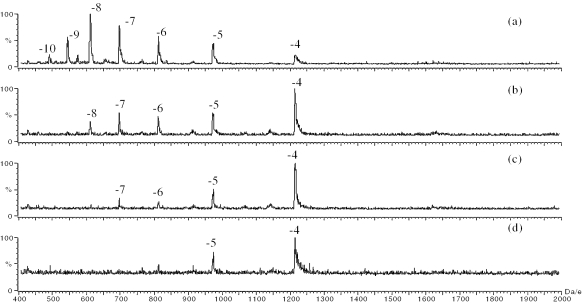
In order to determine the possible effects of counter ions and electrolyte concentrations on the charge state distributions of the negative oligonucleotide ions, the purified DNA strands of the hairpin 2HPb and linear 2L were analyzed at four different concentrations (1–20 mM) of ammonium acetate. The ammonium acetate maintained the solution pH at 6.8. It was observed when the ammonium acetate concentration was 1 mM, the most intense peaks for both strands were the peaks with a charge of −8 (Figures 1a and 2a). The charge states distributed from −10 to −4, with no obvious differences in the charge state distributions between the hairpin and linear strands. When the amount of ammonium acetate was increased to 5 mM, the charge state distributions of the negative oligonucleotide ions shifted to lower values for both the hairpin and the linear strands (Figures 1b and 2b). The hairpin 2HPb demonstrated the most intense peak at −5, whereas the linear 2L demonstrated the most intense peak at −4. At 10 mM ammonium acetate, the charge states further shifted to lower values, and the peaks with charge of −5 and −4 dominate the mass spectra (Figures 1c and 2c). The most intense peak for linear strand was −4 and the most intense peak for hairpin strand was −5. When the concentration of the ammonium acetate was increased to 20 mM, no further change in the charge state distributions was observed, but the signal intensities decreased (Figures 1d and 2d). The spectra showed that the concentration of the ammonium acetate influenced the charge state distributions of the hairpin and linear conformational DNA strands.
Figure 1.
ESI mass spectra of the hairpin 2HPb analyzed at an ammonium concentration of (a) 1 mM, (b) 5 mM, (c) 10 mM and (d) 20 mM.
Figure 2.
ESI mass spectra of the linear 2L analyzed at an ammonium concentration of (a) 1 mM, (b) 5 mM, (c) 10 mM and (d) 20 mM.
Effect of the DNA concentrations
The hairpin 2HPb and linear 2L were analyzed at four different strand concentrations ranging from 10 to 40 μM to determine possible effects of the strand concentrations on the charge state distributions. It was observed that there were no concentration dependencies in the charge state distributions among the 2HPb hairpins or 2L linears (spectra not shown): shifting was not observed when the concentrations were altered. In this concentration range, the hairpin 2HPb demonstrated the most intense peaks with a charge of −5, and the linear 2L demonstrated the most intense peaks with a charge of −4. At 20 μM strand concentrations, both hairpin and linear strands produced the highest intensity peaks. The intensities of the peaks decreased with the increase of the strand concentrations. The solutions were prepared based on the strand concentrations calculated from UV absorbance values at a 260 nm wavelength after the strands were purified.
Effect of cone voltage
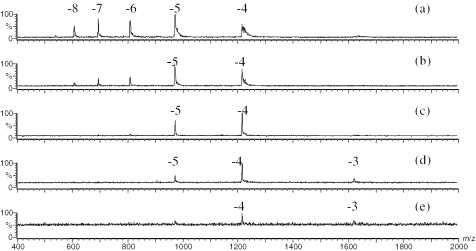
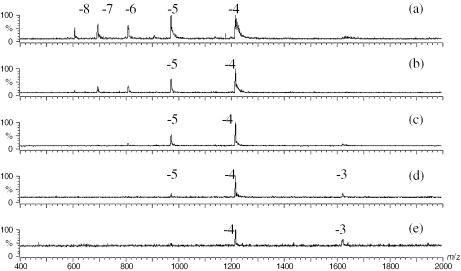
The strength of the electric field between the orifice and skimmer region was an important instrumental factor because ions produced in the ESI source underwent various degrees of desolvation or fragmentation based on the value of the applied voltages. DNA strands of the hairpin (1HP) and Linear (1L) from the set 1 were studied at various cone voltages. The mass spectra were shown in Figures 3 and 4. From these spectra, the following trend was observed: an increase in the cone voltage caused a decrease in the charge state values of the ions. At a cone voltage of 10 V, both the hairpin DNA (Figure 3a) and the linear DNA (Figure 4a) showed a broad range of charge states, extending from −4 to −8. Within this range, the hairpin was more populated in the higher charge states: the −5 peak of the hairpin was the most intense; whereas the −4 peak of the linear was the most intense. At this low cone voltage, it was also noted that the peaks appeared broad due to complexation of oligonucleotides with ammonia. Lower charged ions have more adducts. This suggests that insufficient interface energy was transferred to the developing gas phase ions to disrupt the negative DNA ammonium complex ions. As the cone voltage was increased, the presence of ammonia adducts decreased, and the charge state distributions of both hairpin and linear structural DNAs moved to lower values (Figures 3b and 4b). At a cone voltage of 50 V, most molecular ions had a charge of −4. This shift to a lower charge state was more pronounced for the hairpin than linear DNA in the range of cone voltage from 10 to 50 V (Figure 3c–e and Figure 4c–e). This observation is consistent with the possibility that the higher collision energy at higher cone voltages causes hairpins to unfold. We see no evidence of fragmentation at a cone voltage of 50 V. The DNA strands in set 2 demonstrated similar results (data not shown).
Figure 3.
ESI mass spectra of the hairpin 1HP at various cone voltages of (a) 10 V, (b) 20 V, (c) 30 V, (d) 40 V and (e) 50 V.
Figure 4.
ESI mass spectra of the linear 1L at various cone voltages of (a) 10 V, (b) 20 V, (c) 30 V, (d) 40 V and (e) 50 V.
Effect of DNA secondary structure
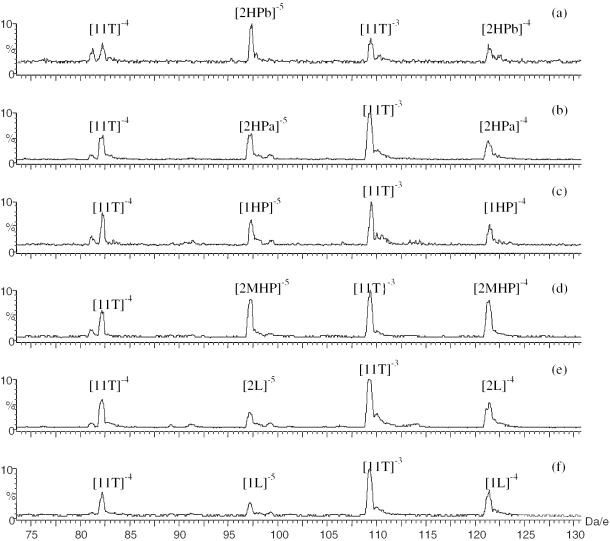
The six DNA strands with hairpin or linear conformations were then analyzed at optimal instrument and solution conditions to determine the effect of secondary structure on the charge state distributions of the negative oligonucleotide ions. The concentrations of the strands were 20 μM, the solvent was 20/80 (v/v) methanol/10 mM ammonium acetate, and the cone voltage was set at 30 V. In addition, an internal standard of 20 μM (dT)11 DNA strand was added into the solution to monitor the reproducibility. The (dT)11 was selected as internal standard for two reasons: (i) the (dT)11 was unlikely to interact with our 16mer DNA strands and (ii) the (dT)11 produced two intense peaks with m/z values that are next to the two intense peaks from our studied DNA strands.
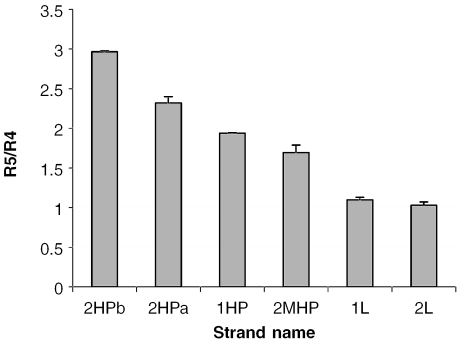
As shown in the Figure 5, the ions with the charge of −4 and −5 for six of the 16mer DNA strands and ions with the charge of −3 and −4 for (dT)11 DNA internal standard were detected. The DNA strands with the hairpin conformation demonstrated the most intense peaks with charge of −5, whereas linear strands demonstrated the most intense peaks with charge of −4. To quantitatively measure the tendency of the six DNA strands to form higher charged ions, the areas of the −5 and −4 peaks of the 16mer DNA ions and the −4 and −3 peaks of internal standard (dT)11 were integrated. The relative area ratio R5/R4 for each strand of the six strands was calculated according to Equation 1.
| 1 |
where A5 = −5 peak area of 16mer strand; A4 = −4 peak area of 16mer strand; A4i = −4 peak area of (dT)11; and A3i = −3 peak area of (dT)11.
Figure 5.
Mass spectra of the hairpins of (a) 2HPb, (b) 2HPa, (c) 1HP, (d) 2MHP) and the linears of (e) 1L, (f) 2L mixed with (dT)11 internal standard.
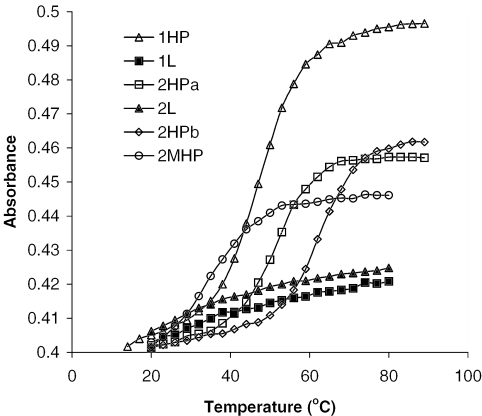
As shown in Figure 6, R5/R4 values for the hairpin strands (1HP, 2HPa, 2HPb and 2MHP) were higher than the values for the linear strands (1L and 2L). Specifically, the following order of the ratio R5/R4 was observed: 2HPb > 2HPa > 1HP > 2MHP > 1L ≈ 2L. Each R5/R4 value in the graph was the average of triplicate acquisitions, the RSD values range are between 1 and 10%. This order may reflect the relative stability of the folded secondary structure. Stem regions with more G:C base pairs will form more stable hairpin structures. This same order of stability was observed in the aqueous solutions analyzed by the UV melting curves (see below). Oligonucleotide 2MHP is an interesting case: it is the ‘exception’ that proves the rule. 2MHP was intended to be linear; however, its behavior in ESI-MS was more representative of a hairpin than a linear molecule. Closer scrutiny of the sequence revealed that 2MHP might form a hairpin with a three-base loop and a mismatched stem. UV spectroscopy (Figure 7) provides evidence that 2MHP may form such a structure in aqueous ammonium acetate solution. This structure was not predicted by mfold. The closest structure predicted had only the left two GC pairs and the GT mismatch; a structure assigned a melting point near 5°C.
Figure 6.
Bar graph of R5/R4 ratios of six DNA strands as a function of DNA name.
Figure 7.
UV spectra of all hairpin and linear oligonucleotide strands obtained at wavelength 260 nm as measured over the temperature range of 20–95°C.
UV spectroscopy corroborates the hairpin and linear structures
It is well established that the disruption of double helices in nucleic acids is accompanied by an increase in the UV absorbance at 260 nm wavelength (25). In the present work, the melting of the hairpin 1HP was previously measured in pure water, in the presence of different concentrations of ammonium acetate and in the presence of 20/80 (v/v) methanol/10 mM ammonium acetate. No stem melting was observed when the hairpin 1HP strand was prepared in pure water or in low concentrations of ammonium acetate solution. The introduction of 20% methanol into the solution containing 10 mM ammonium acetate yielded no significant reduction of melting temperatures compared with the no methanol solution. The UV absorbance of six DNA strands were measured at a wavelength of 260 nm to determine the melting of base-paired stems in our hairpin structures when temperatures of solution containing DNA strands were increased from 20 to 95°C. As shown in Figure 7, those DNAs designed to fold into a hairpin conformation experienced a transition in the absorbance as the stem melts. Such transitions were not observed for the linear DNAs 1L and 2L. Hairpin strand 1HP showed the largest absorbance shift of the set; however, its melting point (44.5°C) was lower than hairpins in set 2 (2HPa 50.5°C and 2HPb 61.5°C). The melting temperature (Tm) of the strands showed in this order: 2HPb > 2HPa > 1HP > 2MHP, which was consistent with the order of area ratio of −5 to −4 charged peaks measured by ESI-MS. The strand 2MHP produced a transition with a Tm of 32.5°C, supporting the ESI-MS observation that it behaved like a hairpin.
Table 2 shows that there is a direct correlation between the melting point determined by UV absorbance and the area ratio of the molecular ions −5 charge state to −4 charge state at a cone voltage of 30 V. This supports our postulate that secondary structure in DNA stabilizes higher negative charge states in molecular ions. The results are consistent with the theory of hydrogen bonding and base stacking of DNA helices formation in both solution and the gas phase as proposed by Gabelica and Pauw (26).
Table 2.
Melting temperatures and area ratios R5/R4 of six DNA strands
| 2HPb | 2Hpa | 1HP | 2MHP | 1L | 2L | |
|---|---|---|---|---|---|---|
| Mt (°C) | 61.5 | 50.5 | 44.5 | 32.5 | None | None |
| R5/R4 | 2.97 | 2.32 | 1.94 | 1.69 | 1.10 | 1.03 |
DISCUSSION
Why would secondary structure support more negatively charged ion distributions? The observation that hairpin structures slightly favor higher charges seems counterintuitive. When proteins are observed in the positive ion mode, folded proteins give lower charged ions than denatured proteins. Following this example, one might expect that for a given charge state, the compact hairpin would have a higher charge density, and as a result, be less stable. We suggest that the differences in charge state distribution reflect the kinetics of protonation and deprotonation of an ion population that is not in equilibrium.
It is likely that lower charged DNA ions are the result of protonated bases rather than neutralized phosphates of the backbone. In aqueous solution, ring nitrogens with a pair of sp2 electrons protonate before the oxygens of the negatively charged phosphodiester group (27), and similar behavior is expected in the gas phase. Green-Church and Limbach (28) calculated that gas phase proton affinities in ring nitrogen was larger than the oxygen in the phosphate of dAMP and dCTP, and the calculated results were consistent with these determinations by fast atom bombardment mass spectrometry.
The ammonium ions present in our studies have strong acidity in the gas phase to provide protons; the gas phase basicity of NH3 or is reported as 195.6 kcal/mol (29), which is lower than the basicity of nitrogenous bases of DNA strand. When oligonucleotide strands are transferred to the gas phase, protons are transferred from the ammonium ions to the nitrogenous bases. It has been observed (Figures 1 and 2) that the hairpin and linear strands demonstrate the difference in the charge state distributions only in a concentrated ammonium acetate solution. We propose that the concentrated ammonium acetate serves two roles: it induces the DNA molecules to fold by increasing the ionic strength and it transfers protons from ammonium ions to the nitrogenous bases in the gas phase.
The number of protonation sites will be determined by whether or not the bases are Watson–Crick paired. The N1 of adenine and N3 of cytosine cannot be protonated in a base pair. Thus, a DNA strand in a hairpin conformation cannot as easily become a low-charged ion as DNA with no base pairs. It may be that only a fraction of the strands in the hairpin-sequence samples actually have the hairpin conformation. This would explain why there is not a very strong difference between the charge state distributions for hairpin and linear strands.
Clearly, the ammonium ions play important roles on the charge number of the negative oligonucleotide ions in the gas phase. The mass spectra acquired at low cone voltage have indicated that the ammonium ions first act as counter ions adducted to the negative DNA ions (Figures 3A and 4A), then leave as ammonia at increased cone voltages. Favre et al. (30,31) observed that the adducted sodium ions are usually located in the middle of the phosphate backbone to stabilize the DNA strands, whereas the negative charge is usually located at the 5′ terminal to reduce the repulsions among the negative charges. However, the charge location and detailed mechanism of proton transfer for DNA in the hairpin conformation will require further investigation.
The conformation on the linear oligonucleotide strands may also influence the charge state distribution. We have used the term ‘linear’ to mean ‘not-hairpin’. We do not know that such strands are actually extended. Currently, there is almost no information on the conformations of these strands. Any conformation that produces tight salt bridges or hydrogen bonds between the backbone and protonated bases will stabilize structures.
CONCLUSION
To our knowledge, this is the first demonstration of the effect of secondary structure on the electrospray ionization charge state distributions of single-stranded oligonucleotide ions. Secondary structures stabilize more highly charged negative ions. The presence of ammonium acetate plays an important role, shifting the charge state distributions to lower values and leading the secondary strand to demonstrate higher charged values. ESI-MS is a well-established technique that has been used to study the folding and unfolding process of proteins by measuring the charge state distributions in positive ion mode. The present work shows that ESI-MS can also be used for studying the conformation of oligonucleotides in negative ion mode. The advantage of this method is speed and sensitivity. The difference of charge state distributions induced by secondary structure is not very strong and the reason may be attributed to incomplete formation of DNA secondary structure in the gas phase. This method can also be extended to study the conformation of more complicated single DNA strands and folding process of the nucleic acid in the gas phase.
Acknowledgments
The authors thank Dr Jeffrey Honovich at Drexel University for assistance in repairing and maintaining the Trio 2000 mass spectrometer and gratefully acknowledge the University of the Sciences in Philadelphia for the financial support of this research. Funding to pay the Open Access publication charges for this article was provided by the University of the Sciences in Philadelphia.
Conflict of interest statement. None declared.
REFERENCES
- 1.Nordhoff E., Kirpekar F., Roepstorff P. Mass spectrometry of nucleic acids. Mass Spectrom. Rev. 1997;15:67–138. doi: 10.1002/(SICI)1098-2787(1996)15:2<67::AID-MAS1>3.0.CO;2-8. [DOI] [PubMed] [Google Scholar]
- 2.Limbach P.A. Indirect mass spectrometric methods for characterizing and sequencing oligonucleotides. Mass Spectrom. Rev. 1996;15:297–336. doi: 10.1002/(SICI)1098-2787(1996)15:5<297::AID-MAS2>3.0.CO;2-D. [DOI] [PubMed] [Google Scholar]
- 3.Huber C.G., Oberacher H. Analysis of nucleic acids by on-line liquid chromatography mass spectrometry. Mass Spectrom. Rev. 2001;20:310–343. doi: 10.1002/mas.10011. [DOI] [PubMed] [Google Scholar]
- 4.Light-Wahl K.J., Springer D.L., Winger B.E., Edmonds C.G., Camp D.G., II, Thrall B.D., Smith R.D. Observation of a small oligonucleotide duplex by electrospray ionization mass spectrometry. J. Am. Chem. Soc. 1993;115:803–804. [Google Scholar]
- 5.Rosu F., Gabelica V., Houssier C., Colson P., Pauw E.D. Triplex and quadruplex DNA structures studied by electrospray mass spectrometry. Rapid Commun. Mass Spectrom. 2002;16:1729–1736. doi: 10.1002/rcm.778. [DOI] [PubMed] [Google Scholar]
- 6.Gale D.C., Smith R.D. Characterization of non-covalent complexes formed between minor groove binding molecules and duplex DNA by electrospray ionization-mass spectrometry. J. Am. Soc. Mass Spectrom. 1995;6:1154–1164. doi: 10.1016/1044-0305(95)00530-7. [DOI] [PubMed] [Google Scholar]
- 7.Schnier P.D., Klassen J.S., Strittmatter E.F., Williams E.R. Activation energies for dissociation of double strand oligonucleotide anions: evidence for Watson–Crick base pairing in vacuo. J. Am. Chem. Soc. 1998;120:9605–9613. doi: 10.1021/ja973534h. [DOI] [PMC free article] [PubMed] [Google Scholar]
- 8.Wan K.X., Shibue T., Gross M.L. Non-covalent complexes between DNA-binding drugs and double-stranded oligodeoxynucleotides: a study by ESI ion-trap mass spectrometry. J. Am. Chem. Soc. 2000;122:300–307. doi: 10.1016/S1044-0305(00)00095-7. [DOI] [PubMed] [Google Scholar]
- 9.Loo J.A., Edmonds C.G., Udseh H.R., Smith R.D. Effect of reducing disulfide-containing proteins on electrospray ionization mass spectra. Anal. Chem. 1990;62:693–698. doi: 10.1021/ac00206a009. [DOI] [PubMed] [Google Scholar]
- 10.Chowdhury S.K., Katta V., Chait B.T. Probing conformational changes in proteins by mass spectrometry. J. Am. Chem. Soc. 1990;112:9012–9013. [Google Scholar]
- 11.Konermann L., Douglas D.J. Acid-induced unfolding of cytochrome c at different methanol concentrations: electrospray ionization mass spectrometry specifically monitors changes in the tertiary structure. Biochemistry. 1997;36:12296–12302. doi: 10.1021/bi971266u. [DOI] [PubMed] [Google Scholar]
- 12.Konermann L., Douglas D.J. Equilibrium unfolding of proteins monitored by electrospray ionization mass spectrometry: distinguishing two-state from multi-state transitions. Rapid Commun. Mass Spectrom. 1998;12:435–442. doi: 10.1002/(SICI)1097-0231(19980430)12:8<435::AID-RCM181>3.0.CO;2-F. [DOI] [PubMed] [Google Scholar]
- 13.Lee V.W., Chen Y., Komermann L. Reconstitution of acid-denatured holomyoglobin studied by time resolved electrospray ionization mass spectrometry. Anal. Chem. 1999;71:4154–4159. doi: 10.1021/ac9904664. [DOI] [PubMed] [Google Scholar]
- 14.Sogbein O.O., Simmons D.A., Konermann L. Effects of pH on the kinetic reaction mechanism of myoglobin unfolding studies by time-resolved electrospray ionization mass spectrometry. J. Am. Soc. Mass Spectrom. 2000;11:312–319. doi: 10.1016/s1044-0305(99)00149-x. [DOI] [PubMed] [Google Scholar]
- 15.Elstner M., Hobza P., Frauenheim T., Suhai S., Kaxiras E. Hydrogen bonding and stacking interactions of nucleic acid base pairs: a density-functional-theory based treatment. J. Chem. Phys. 2001;114:5149–5155. [Google Scholar]
- 16.Sharp K.A., Honig B. Salt effects on nucleic acids. Curr. Opin. Struct. Biol. 1995;5:323–328. doi: 10.1016/0959-440x(95)80093-x. [DOI] [PubMed] [Google Scholar]
- 17.Feley M.O., Olson W.K., Tobias I., Manning G.S. Electrostatic effects in short superhelical DNA. Biophys. Chem. 1994;50:255–271. doi: 10.1016/0301-4622(93)e0094-l. [DOI] [PubMed] [Google Scholar]
- 18.Wang G. Solution, gas-phase, and instrumental parameter influences on charge state distributions in electrospray ionization mass spectrometry. In: Cole R.B., editor. Electrospray Ionization Mass Spectrometry. NY: John Wiley & Sons, Inc.; 1997. pp. 137–174. [Google Scholar]
- 19.Muddiman D.C., Cheng X., Udeseth H.R., Smith R.D. Charge-state reduction with improved signal intensity of oligonucleotides in electrospray ionization mass spectrometry. J. Am. Soc. Mass Spectrom. 1996;7:697–706. doi: 10.1016/1044-0305(96)80516-2. [DOI] [PubMed] [Google Scholar]
- 20.Cheng X., Gale D.C., Udseth H.R., Smith R.D. Charge state reduction of oligonucleotide negative ions from electrospray ionization. Anal. Chem. 1995;67:586–593. [Google Scholar]
- 21.Wang G., Cole R.B. Mechanistic interpretation of the dependence of charge state distributions on analyte concentrations in electrospray ionization mass spectrometry. Anal. Chem. 1995;67:2892–2900. [Google Scholar]
- 22.Ashton D.S., Beddell C.R., Cooper D.J., Green B.N., Oliver R.W.A. Mechanism of production of ions in electrospray mass spectrometry. Org. Mass Spectrom. 1993;28:721–728. [Google Scholar]
- 23.Seeman N.C. De novo design of sequences for nucleic acid structural engineering. J. Biomol. Struct. Dyn. 1990;8:573–581. doi: 10.1080/07391102.1990.10507829. [DOI] [PubMed] [Google Scholar]
- 24.Mirza U.A., Chait B.T. Do proteins denature during droplet evolution in electrospray ionization? Int. J. Mass Spectrom. Ion Process. 1997;162:173–181. [Google Scholar]
- 25.Lehniger L.A., Neolson L.D., Cox M.M. Principles of Biochemistry. 2nd edn. NY: Worth publishers; 1982. [Google Scholar]
- 26.Gabelica V., Pauw E.D. Comparison between solution-phase stability and gas-phase kinetic stability of oligonucleotide duplexes. J. Mass Spectrom. 2001;36:397–402. doi: 10.1002/jms.141. [DOI] [PubMed] [Google Scholar]
- 27.Saenger W. Principles of Nucleic Acid Structure. NY: Springer-Verlag; 1984. [Google Scholar]
- 28.Green-Church K.B., Limbach P.A. Mononucleotide gas-phase proton affinities as determined by the kinetic method. J. Am. Soc. Mass Spectrom. 2000;11:24–32. doi: 10.1016/S1044-0305(99)00116-6. [DOI] [PubMed] [Google Scholar]
- 29.Yen T.Y., Charles M.J. Processes that affect electrospray ionization-mass spectrometry of nucleobases and nucleosides. J. Am. Soc. Mass Spectrom. 1996;7:1106–1108. doi: 10.1016/S1044-0305(96)00073-6. [DOI] [PubMed] [Google Scholar]
- 30.Favre A., Gonnet F., Tabet J.-C. Location of the Na+ cation in negative ions of DNA evidenced by using MS2 experiments in ion trap mass spectrometry. Int. J. Mass Spectrom. 1999;190/191:303–312. [Google Scholar]
- 31.Favre A., Gonnet F., Tabet J.-C. Location of the negative charge(s) on the backbone of single-stranded deoxyribonucleic acid in the gas phase. Eur. J. Mass Spectrom. 2000;6:389–396. [Google Scholar]


