
Figure 6.
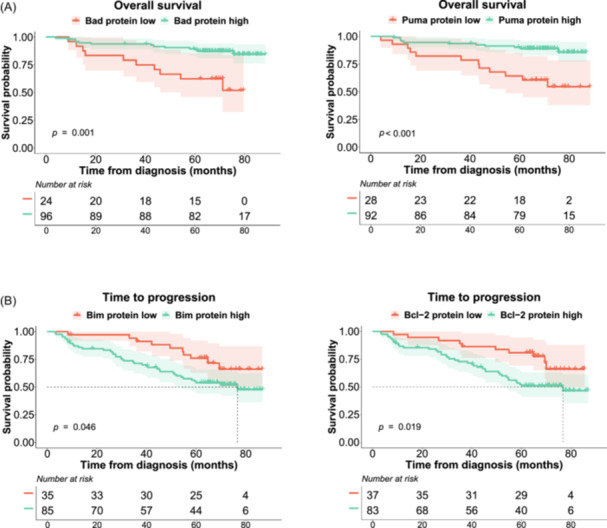
Kaplan–Meier curves for Bad, Puma, Bim, and Bcl‐2. Probability of overall survival (OS) (A) and survival without progression (time to progression [TTP]) (B) of MM patients by protein expression. The log‐rank test p values are shown.
Official websites use .gov
A
.gov website belongs to an official
government organization in the United States.
Secure .gov websites use HTTPS
A lock (
) or https:// means you've safely
connected to the .gov website. Share sensitive
information only on official, secure websites.
Kaplan–Meier curves for Bad, Puma, Bim, and Bcl‐2. Probability of overall survival (OS) (A) and survival without progression (time to progression [TTP]) (B) of MM patients by protein expression. The log‐rank test p values are shown.