Abstract
Background: Cancer represents a highly intricate disease, characterized by the uncontrolled proliferation and invasion of aberrant cells, leading to widespread global morbidity and mortality. This study investigates the influence of CD19, a marker specific to B-cells, within the tumor microenvironment (TME) across a spectrum of cancer types. Methodology: To explore the role of CD19, we employed a wide array of bioinformatics tools and databases, including UALCAN, GEPIA2, univariate Cox regression, KM plotter, HPA, GSCA, cBioPortal, TISIDB, and DAVID. Additionally, we conducted experimental validations using cell culture, Real-time quantitative PCR (RT-qPCR), and western blot analyses. Results: An extensive analysis of CD19 expression was performed using The Cancer Genome Atlas (TCGA) data sourced from TIMER2 and UALCAN, covering 33 different cancer types. We observed a marked variability in CD19 expression, with notable upregulation in Adrenocortical Carcinoma (ACC) and Breast Invasive Carcinoma (BRCA), contrasted by significant downregulation in Cervical Squamous Cell Carcinoma (CESC), Rectum Adenocarcinoma (READ), and Sarcoma (SARC). Prognostic assessments through univariate Cox regression and Kaplan-Meier plots revealed that lower levels of CD19 were linked to a poorer overall survival rate in CESC, READ, and SARC. These findings were reinforced by validation using GEPIA2 and GSCA, where reduced CD19 expression correlated negatively with methylation levels in the affected cancers. Furthermore, immunohistochemical staining data from the Human Protein Atlas (HPA) provided additional confirmation of these results. Mutation analysis through cBioPortal suggested that alterations in CD19 were infrequent and had a minimal impact on tumor mutation burden (TMB) and microsatellite instability (MSI). Correlation studies using TISIDB highlighted significant associations between CD19 expression and immune-related genes, emphasizing its potential role in immune regulation. Additionally, GSCA analysis demonstrated that CD19 expression was positively associated with immune cell infiltration, though no significant effect on drug sensitivity was detected. Experimental validation using RT-qPCR in READ cell lines substantiated the down-regulation of CD19. Further functional analysis revealed that reduced CD19 expression significantly influenced the cellular behavior of SW480 cells. Conclusion: These findings underscore the critical role of CD19 within the tumor microenvironment, suggesting its potential as a biomarker and a therapeutic target in specific types of cancer.
Keywords: Cancer, tumor microenvironment (TME), diagnosis, prognosis: CD19, treatment
Introduction
Cancer remains a dominant cause of both illness and death worldwide, with recent statistics indicating around 19.3 million new cases and nearly 10 million cancer-related fatalities in 2023 alone [1]. The intricate nature and variability of cancer presents substantial obstacles in its diagnosis, prognosis, and treatment [2]. However, advancements in genomics and bioinformatics have revolutionized our understanding of cancer at a molecular level, unveiling new biomarkers and potential therapeutic targets [3,4]. Among the numerous genes implicated in cancer, CD19 has attracted significant interest. This gene encodes a transmembrane glycoprotein that is predominantly found on B cells, where it plays a pivotal role in their development, activation, and differentiation [5-7]. Due to its selective expression in B cells, CD19 has emerged as a promising target for immunotherapy, particularly in B-cell malignancies including leukemia and lymphoma [8,9].
The promise of CD19 as a therapeutic target became evident with the development of chimeric antigen receptor (CAR) T-cell therapy [10]. In this innovative treatment, T-cells are engineered to express receptors that specifically recognize CD19, leading to remarkable success in treating patients with relapsed or refractory B-cell acute lymphoblastic leukemia (B-ALL) and diffuse large B-cell lymphoma (DLBCL) [8,9,11]. These therapies have achieved significant clinical success, with high response rates and long-lasting remissions, fundamentally altering the treatment landscape for these blood cancers [11]. Despite the extensive research on CD19 in hematological cancers, its role in solid tumors remains less explored. Emerging evidence suggests that CD19 may also be present in certain solid tumors, where it could influence tumor progression and help the tumor evade the immune system [12,13]. For example, studies have detected CD19 expression in breast cancer and melanoma, opening up the possibility of extending CD19-targeted therapies to these types of cancer [14,15].
Considering the therapeutic potential of CD19, it is crucial to perform a comprehensive pan-cancer analysis to fully understand its diagnostic, prognostic, and therapeutic implications across various cancer types. Pan-cancer studies, which examine large-scale genomic and transcriptomic data across multiple cancer types, are essential for identifying both shared and unique molecular characteristics that can inform clinical strategies. The primary objectives of this study are to systematically assess the expression patterns of CD19 across multiple cancer types, determine its value as a diagnostic and prognostic biomarker, and explore the potential for targeting CD19 in solid tumors.
This study utilized extensive data from The Cancer Genome Atlas (TCGA) and other publicly available databases to analyze CD19 expression across a diverse range of cancers. We investigated how CD19 expression correlates with clinical outcomes using sophisticated bioinformatics approaches. Our goal was to evaluate whether CD19 expression can serve as a reliable biomarker for early detection, prognosis, or response to treatment. Additionally, by drawing on the success of CD19-targeted therapies in hematological malignancies, we explored the applicability of these strategies to solid tumors through in vivo models. The study aims to offer a detailed evaluation of the CD19 gene across multiple cancer types by leveraging bioinformatics and molecular biology techniques. By uncovering the diagnostic, prognostic, and therapeutic roles of CD19, we hope to contribute to the development of more precise and effective cancer therapies, ultimately improving patient outcomes.
Materials and methods
Expression landscape of CD19 in pan-cancer
TIMER2 (http://timer.cistrome.org/) [16] and UALCAN (https://ualcan.path.uab.edu/) [17] are powerful bioinformatics platforms designed to analyze gene expression and its clinical significance across a wide range of cancers. TIMER2 facilitates an in-depth examination of immune cell infiltration and gene expression patterns within multiple cancer types, utilizing data from The Cancer Genome Atlas (TCGA) project to shed light on the intricate interactions between tumors and the immune system. UALCAN, on the other hand, provides an intuitive interface for accessing TCGA data, with a focus on analyzing gene expression, survival outcomes, and epigenetic alterations. These tools are indispensable for researchers aiming to uncover gene functions, pinpoint potential biomarkers, and decipher the molecular mechanisms driving cancer progression. In our study, both TIMER2 and UALCAN were employed to map the expression profile of CD19 across a spectrum of cancers, offering valuable insights into its role within the pan-cancer landscape.
Prognostic significance of CD19 in pan-cancer
To assess the prognostic impact of CD19 on overall survival (OS) across different cancer types, we conducted a univariate Cox regression analysis. Additionally, the KM Plotter tool (https://kmplot.com/analysis/) [18] was utilized to generate Kaplan-Meier (KM) survival curves for CD19 in various cancer cohorts. KM Plotter is an invaluable resource for survival analysis, enabling researchers to link gene expression levels with patient outcomes across a multitude of cancers, thereby aiding in the identification of prognostic biomarkers. Through this approach, we sought to determine the potential of CD19 as a predictor of patient survival in a pan-cancer context.
Validation of CD19 expression and promoter methylation analysis
GEPIA2 (http://gepia2.cancer-pku.cn/#index) [19] and the Human Protein Atlas (HPA) (https://www.proteinatlas.org/) [20] are indispensable tools in cancer research. GEPIA2 offers customizable and interactive analysis of RNA sequencing data derived from TCGA and GTEx, allowing researchers to explore gene expression trends, survival outcomes, and differential expression between tumor and normal tissues. Complementing this, the HPA database provides extensive protein expression data via immunohistochemistry, enabling the visualization of protein distribution across various tissues and cancer types. By combining the insights from these databases, researchers can gain a comprehensive understanding of gene and protein expression, aiding in the identification of novel biomarkers and therapeutic targets in cancer research. In our study, we employed GEPIA2 and HPA to validate CD19 expression at both the mRNA and protein levels, utilizing additional patient cohorts to ensure robust findings.
The GSCA (https://guolab.wchscu.cn/GSCA/) database is another powerful resource that supports extensive cancer genomics research [21]. By integrating multi-omics data-including gene expression, mutations, methylation patterns, and copy number variations-across numerous cancer types, GSCA facilitates in-depth analysis of gene sets and their relationships with clinical outcomes, immune infiltration, and drug response. In our research, we used GSCA to examine the correlation between CD19 expression and its promoter methylation levels across specific cancer types, providing deeper insights into the epigenetic regulation of CD19.
Mutational Landscape of CD19
The cBioPortal (https://www.cbioportal.org/) serves as a comprehensive, open-access platform for visualizing, analyzing, and downloading large-scale cancer genomics datasets [22]. Developed by the Memorial Sloan Kettering Cancer Center, it aggregates data from multiple sources, including TCGA, and offers detailed information on mutations, copy number alterations, mRNA expression, DNA methylation, and protein levels. In this study, we utilized cBioPortal to investigate the mutational landscape of CD19 across selected cancer types, enabling a deeper understanding of how genetic alterations in CD19 may influence cancer development and progression.
To further explore CD19’s involvement in the tumor microenvironment (TME) and its interaction with the immune system, we analyzed its correlation with two critical TME biomarkers: Tumor Mutational Burden (TMB) and Microsatellite Instability (MSI). TMB measures the number of mutations per million bases in tumor DNA, while MSI represents changes in the length of repetitive DNA sequences within tumor cells due to insertions or deletions. We conducted an analysis using R 3.6.3 to investigate the relationship between CD19 expression and these biomarkers, offering insights into how CD19 might influence immune responses within the TME.
Associations of CD19 gene expression with immune-related genes and immune subtypes across various cancers
TISIDB (http://cis.hku.hk/TISIDB/) is a pivotal resource for examining the interplay between tumors and the immune system. This platform amalgamates data from extensive high-throughput experiments and diverse public repositories, offering a rich compendium of information on tumor-immune interactions [23]. TISIDB provides insights into gene expression, immune cell infiltration, and the role of immunomodulators across a broad spectrum of cancer types. In our investigation, we employed TISIDB to analyze the correlations between CD19 gene expression.
Gene enrichment analysis
The STRING database (https://string-db.org/) is an essential tool for exploring protein-protein interactions (PPIs) and functional relationships [24]. It combines experimental data, computational predictions, and curated knowledge to construct comprehensive networks depicting protein interactions. In this study, we utilized STRING to develop a network of proteins associated with CD19, revealing the broader functional context of CD19-enriched genes.
DAVID (https://david.ncifcrf.gov/) is a prominent bioinformatics platform for functional annotation and enrichment analysis of gene lists. It provides sophisticated tools to elucidate the biological significance of extensive gene lists generated from high-throughput studies [25]. DAVID integrates a range of biological databases and analytical resources to perform functional annotation, gene ontology (GO) enrichment, and pathway analysis. By leveraging DAVID, researchers can uncover the biological processes, molecular functions, and cellular components related to their gene lists, thereby facilitating hypothesis generation and biological interpretation. In our study, DAVID was employed to conduct an enrichment analysis of genes associated with CD19.
Associations of CD19 with immune infiltrates and drug sensitivity
To examine the relationship between CD19 expression and immune infiltrates as well as drug sensitivity across various cancers, we utilized the GSCA database (https://guolab.wchscu.cn/GSCA/) [21]. This analysis aimed to elucidate how CD19 expression correlates with immune cell presence and response to therapeutic agents, contributing to a more nuanced understanding of CD19’s role in cancer treatment and immune modulation.
Cell lines and cell culture
We utilized a range of cell lines for our experiments, including five normal rectal epithelial cell lines-FHC, CCD 841 CoN, NCM460, HCoEpiC, and NCM356-and ten colorectal cancer cell lines-HCT-15, HT-29, Caco-2, SW480, SW620, DLD-1, LS174T, Colo205, LoVo, and RKO. These cell lines were sourced from the American Type Culture Collection (ATCC) in the USA. The cells were cultured in Dulbecco’s Modified Eagle Medium (DMEM) from Gibco, supplemented with 10% fetal bovine serum (FBS), also from Gibco. Cultures were maintained in a controlled environment at 37°C with 5% CO2 to ensure optimal growth conditions.
Real-time quantitative PCR (RT-qPCR)
Total RNA was extracted from the cells using the Simply P Total RNA Extraction Kit from BIOER, following the manufacturer’s instructions. cDNA was then synthesized using the ReverTra AceTM qPCR RT Kit from TOYOBO. RT-qPCR was conducted using the SYBR® Green Realtime PCR Master Mix from TOYOBO, allowing for precise quantification of gene expression levels. The GAPDH gene was used as an internal control and expression was calculated using 2^-∆∆CT method. Following primer sequences were used; GAPDH-F 5’-ACCCACTCCTCCACCTTTGAC-3’, GAPDH-R 5’-CTGTTGCTGTAGCCAAATTCG-3’; CD19-F: 5’-GGCTATGAGGAACCTGACAGTG-3’, CD19-R: 5’-TCATCCTCAGGGTTCTCGTAGC-3’.
Induction of CD19 overexpression in SW480 cells
To achieve CD19 overexpression in SW480 cells, we utilized a plasmid engineered to express the CD19 gene under a potent promoter. The SW480 cells were maintained in Dulbecco’s Modified Eagle Medium (DMEM) supplemented with 10% fetal bovine serum (FBS) and incubated in a controlled environment at 37°C with 5% CO2. For the transfection process, we employed Lipofectamine™ 3000 Transfection Reagent (Thermo Fisher Scientific, Cat. No. L3000008) combined with Opti-MEM™ I Reduced Serum Medium (Thermo Fisher Scientific, Cat. No. 31985062) to enhance transfection efficiency. The cells were plated in 6-well plates at a density of 2 × 10^5 cells per well and incubated overnight to achieve 70-90% confluency. The transfection complex was prepared by diluting 2.5 µg of the CD19 expression vector in 125 µL of Opti-MEM™ and mixing it with 5 µL of P3000™ Reagent. In a separate tube, 7.5 µL of Lipofectamine™ 3000 was diluted in 125 µL of Opti-MEM™. After a 15-minute incubation at room temperature, the diluted DNA and Lipofectamine™ solutions were combined and then added dropwise to each well containing SW480 cells and 1.5 mL of fresh DMEM. The cells were incubated at 37°C in a CO2 incubator for 48 hours to facilitate CD19 overexpression. Following transfection, the cells were harvested for subsequent analyses to verify CD19 overexpression.
RT-qPCR and western blot analyses
Post-transfection, we confirmed CD19 overexpression in SW480 cells through RT-qPCR and Western blot analyses. For RT-qPCR, total RNA was extracted using the Simply P Total RNA Extraction Kit from BIOER, and cDNA synthesis was carried out with the ReverTra AceTM qPCR RT Kit from TOYOBO. The quantification of CD19 expression was performed using SYBR® Green Realtime PCR Master Mix (TOYOBO). For Western blot analysis, cells were lysed with RIPA buffer supplemented with protease inhibitors. Protein concentrations were determined using the Pierce™ BCA Protein Assay Kit (Thermo Fisher Scientific, Cat. No. 23225). Equal protein amounts (20-30 µg) were separated by SDS-PAGE and transferred to a PVDF membrane. The membrane was blocked with 5% non-fat dry milk in TBST (TBS + 0.1% Tween 20) for 1 hour at room temperature and then incubated overnight at 4°C with primary antibodies against CD19 (Thermo Fisher Scientific, Cat. No. MA5-13141) and GAPDH (Thermo Fisher Scientific, Cat. No. MA5-15738) as a loading control. After washing, the membrane was probed with HRP-conjugated secondary antibodies (Thermo Fisher Scientific, Cat. No. 31460 for anti-mouse and 31430 for anti-rabbit) for 1 hour at room temperature. Protein bands were visualized using SuperSignal™ West Pico PLUS Chemiluminescent Substrate (Thermo Fisher Scientific, Cat. No. 34580) and imaged with a chemiluminescence detection system.
Colony formation assay
To evaluate the clonogenic potential of CD19-overexpressing SW480 cells, we performed a colony formation assay. Transfected cells were seeded in 6-well plates at a density of 500 cells per well and cultured for 10-14 days in DMEM with 10% FBS, with media changes every 3 days. After the incubation period, colonies were fixed with 4% paraformaldehyde for 15 minutes and stained with 0.5% crystal violet for 30 minutes. The plates were washed with PBS to remove excess dye, and colonies were counted under a microscope.
Cell proliferation assay
Cell proliferation was assessed using the CellTiter 96® AQueous One Solution Cell Proliferation Assay (MTS) (Promega, Cat. No. G3580). Transfected SW480 cells were plated in a 96-well plate at a density of 2,000 cells per well in 100 µL of DMEM. At various time points (24, 48, and 72 hours), 20 µL of the MTS reagent was added to each well and incubated for 1-4 hours at 37°C. Absorbance was measured at 490 nm using a microplate reader to evaluate cell proliferation relative to control cells.
Wound healing assay
To investigate the migratory ability of CD19-overexpressing SW480 cells, a wound healing assay was performed. Transfected cells were seeded in 6-well plates and grown to 90% confluency. A straight scratch (wound) was made across the cell monolayer with a sterile 200 µL pipette tip. After washing with PBS to remove detached cells, the cells were incubated in DMEM with 1% FBS to minimize proliferation. Images of the wound were captured at 0 and 24 hours using a phase-contrast microscope. The wound area was analyzed using ImageJ software, and the percentage of wound closure was calculated by comparing the initial wound area to the area after 24 hours.
Statistical analysis
Statistical analysis was performed using GraphPad Prism 7.0 software. An independent sample t-test was employed to compare means between two groups, with significance set at P < 0.05. Pearson correlation analysis was used to assess relationships between variables. Additionally, Receiver Operating Characteristic (ROC) curve analysis was conducted to evaluate the diagnostic efficacy of CD19 expression in distinguishing between control and treated groups. The area under the ROC curve (AUC) was calculated to determine the accuracy, sensitivity, and specificity of CD19 as a potential biomarker. Statistical significance was defined as P < 0.05.
Results
Variations in CD19 expression across tumor and pan-cancer tissues
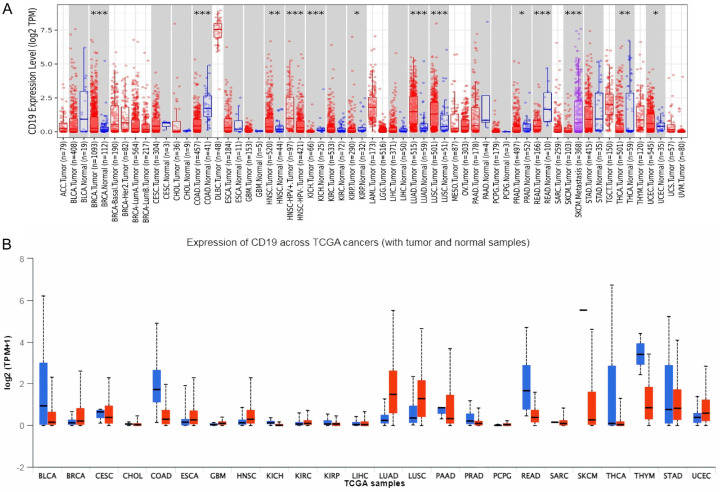
Initially, we explored CD19 expression across 33 cancer types from the TCGA using the TIMER2 platform. This analysis revealed a marked elevation of CD19 expression in tumor tissues relative to normal tissues in several cancers, including Adrenocortical Carcinoma (ACC), Breast Invasive Carcinoma (BRCA), Cholangiocarcinoma (CHOL), Glioblastoma Multiforme (GBM), Head and Neck Squamous Cell Carcinoma (HNSC), Kidney Renal Clear Cell Carcinoma (KIRC), Liver Hepatocellular Carcinoma (LIHC), and Pancreatic Adenocarcinoma (PAAD) (Figure 1A). Conversely, CD19 expression was notably reduced in Cervical Squamous Cell Carcinoma (CESC), Rectum Adenocarcinoma (READ), and Sarcoma (SARC) (Figure 1A). Consistent with TIMER2 data, the UALCAN database (Figure 1B) also highlighted similar patterns, where many cancers exhibited reduced CD19 expression in tumor tissues compared to normal samples.
Figure 1.
Expression analysis of CD19 across various cancer types using TCGA dataset. A. This panel displays the expression levels of CD19 across different cancer types using the TCGA dataset, analyzed via the TIMER2 database. The expression levels are represented in log2 TPM (transcripts per million) scale. B. This panel shows the expression levels of CD19 across various cancer types using the TCGA dataset, analyzed via the UALCAN database. The expression levels are again presented in log2 TPM + 1 scale. * = P-value < 0.05. ** = P-value < 0.01. *** = P-value < 0.001.
Prognostic relevance of CD19 expression
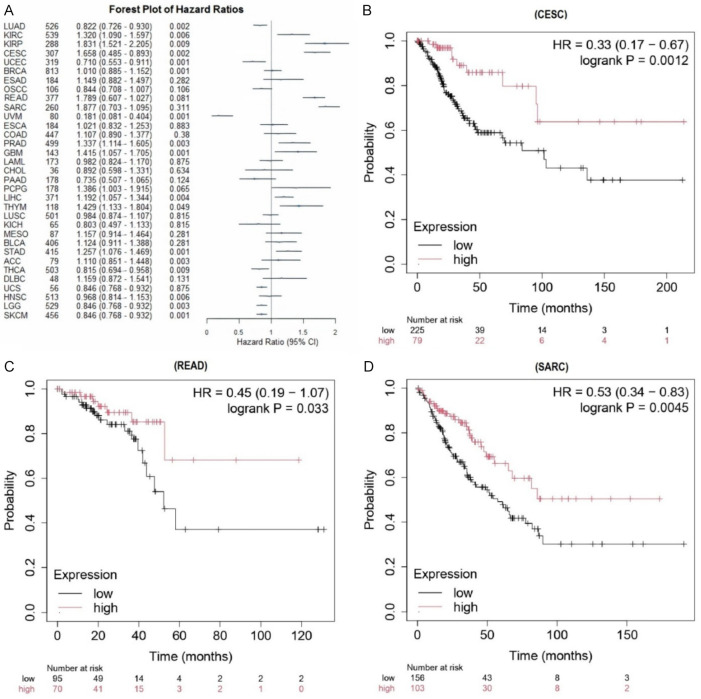
Figure 2A illustrates the outcomes of a univariate Cox regression analysis, which assessed the impact of CD19 expression on overall survival (OS) across various cancers. A significant increase in hazard ratios was observed with lower CD19 expression, correlating with a poorer prognosis in cancers such as CESC, READ, and SARC. Figure 2B-D depicts KM survival curves for these cancers, showing a clear association between diminished CD19 expression and reduced OS. Collectively, these analyses suggest that CD19 may serve as a prognostic indicator in CESC, READ, and SARC.
Figure 2.
Survival analysis of CD19 expression in various cancer types. A. This forest plot illustrates the hazard ratios (HRs) of CD19 expression for overall survival across different cancer types. B. The Kaplan-Meier survival curve for cervical squamous cell carcinoma (CESC) sourced from the KM plotter. C. The Kaplan-Meier survival curve for rectum adenocarcinoma (READ) sourced from the KM plotter. D. The Kaplan-Meier survival curve for sarcoma (SARC) sourced from the KM plotter. This plot shows overall survival for patients with low (black line) and high (red line) CD19 expression. The HR, 95% CI, and log-rank p-value are included, demonstrating a significant link between higher CD19 expression and better survival. P-value < 0.05.
Validation of CD19 expression and methylation analysis
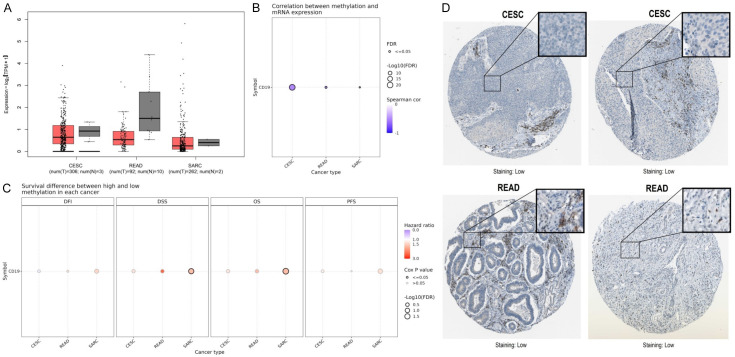
Figure 3A presents box plots from the GEPIA2 database, illustrating CD19 expression levels across CESC, READ, and SARC. In CESC, CD19 expression is significantly lower in tumor tissues compared to normal tissues (Figure 3A). A similar pattern is seen in READ, where tumor tissues exhibit decreased CD19 expression (Figure 3A). However, SARC shows considerable variability in CD19 expression levels between tumor and normal samples (Figure 3A). Figure 3B explores the relationship between CD19 mRNA expression and promoter methylation levels using the GSCA database. The analysis reveals a strong negative correlation between CD19 methylation and expression in CESC, READ, and SARC (Figure 3B). Figure 3C evaluates survival outcomes based on high versus low CD19 methylation levels across four metrics: Disease-Free Interval (DFI), Disease-Specific Survival (DSS), OS, and Progression-Free Survival (PFS). Notably, in READ, lower CD19 methylation is associated with poorer DSS outcomes (Figure 3C). However, no significant survival differences are observed for CESC and SARC. Lastly, Figure 3D provides immunohistochemical staining images of CD19 in CESC and READ tissues from the HPA database, showing minimal protein expression. This indicates that CD19 protein levels are relatively low in these cancer types.
Figure 3.
Methylation and protein expression analysis of CD19 in various cancer types. A. GEPIA2-based box plot illustrating the expression levels of CD19 in cervical squamous cell carcinoma (CESC), rectum adenocarcinoma (READ), and sarcoma (SARC). B. GSAC-based correlation plot showing the relationship between CD19 methylation and mRNA expression across CESC, READ, and SARC. C. Survival difference analysis between high and low CD19 methylation in various cancers. D. HPA-based Immunohistochemical staining images showing low CD19 protein expression in CESC and READ tumor tissues. P-value < 0.05.
Mutational characteristics of CD19
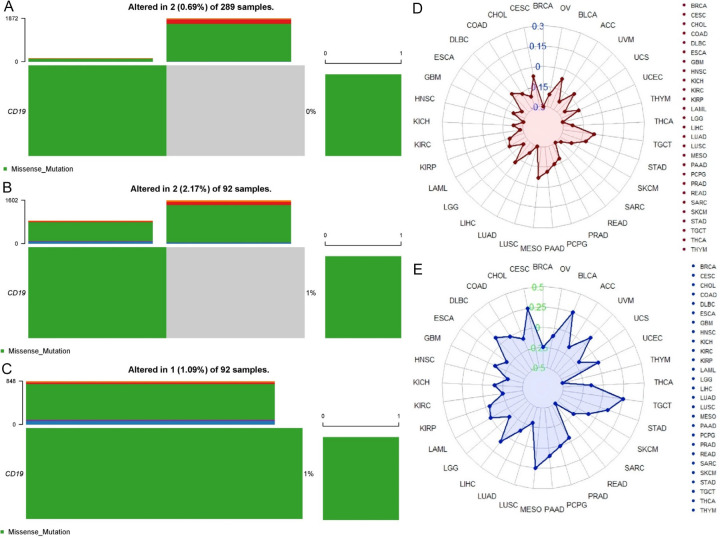
Figure 4A-C displays the mutation analysis of CD19 derived from cBioPortal, which reveals that CD19 mutations occur in a small fraction of cancer samples: 0.69% in 289 Cervical Squamous Cell Carcinoma (CESC) samples, 2.17% in 92 Rectum Adenocarcinoma (READ) samples, and 1.09% in 92 Sarcoma (SARC) samples. These mutations are predominantly missense alterations. This indicates that CD19 mutations are relatively infrequent in these cancers. Figure 4D shows Tumor Mutational Burden (TMB) analysis, which aligns with the mutation data, revealing that CESC, READ, and SARC have low rates of CD19 mutations. Specifically, CESC shows minimal CD19 alterations, READ shows a modest increase, and SARC maintains a low mutation rate. This suggests that CD19 mutations have a limited impact on the overall mutational burden in these cancers. Figure 4E presents Microsatellite Instability (MSI) results, indicating that CD19 mutations are present in a minor proportion of CESC, READ, and SARC samples. In CESC, MSI is not significantly altered, READ shows a slight increase in MSI, and SARC exhibits minimal CD19-related MSI. Overall, these findings suggest that CD19 mutations are rare and have minimal influence on tumor mutational burden and microsatellite instability in these cancers, indicating that CD19 may not significantly contribute to genomic instability in these contexts.
Figure 4.
Mutation analysis of CD19 across various cancer types. A. This panel shows that out of 289 cervical squamous cell carcinoma (CESC) samples, 0.69% (2 samples) exhibit alterations, with missense mutations predominantly represented in green. B. This panel presents data from 92 rectum adenocarcinoma (READ) samples, revealing a 2.17% (2 samples) alteration rate, again with missense mutations being the most common. C. This panel also analyzes 92 sarcoma (SARC) samples, indicates that 1.09% (1 sample) have mutations, predominantly missense mutations. D. Tumor mutation burden (TMB) analysis of CD19 in various cancers. E. Microsatellite instability (MSI) analysis of CD19 in various cancers. P-value < 0.05.
Correlations of CD19 with immune-related genes and subtypes
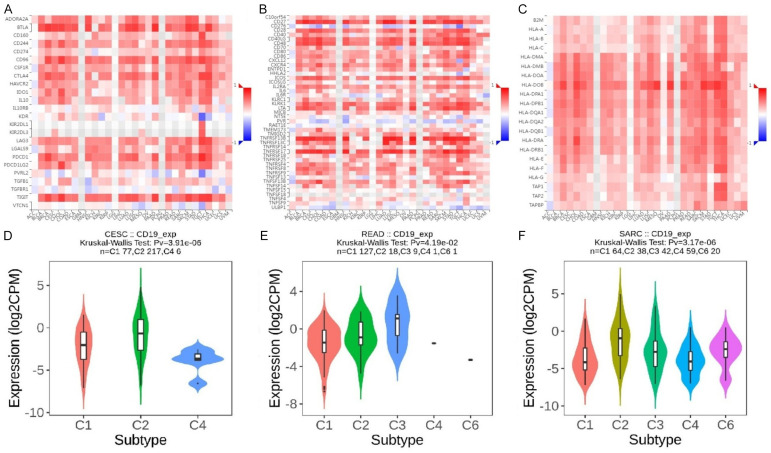
Figure 5A features heatmaps illustrating the correlation between CD19 expression and immune inhibitor genes using the TISIDB database. Figure 5B details correlations with immune stimulator genes, while Figure 5C shows correlations with MHC genes. In CESC, READ, and SARC, CD19 expression demonstrates significant associations with various immune inhibitors such as PDCD1 (PD-1), CTLA4, LAG3, TIGIT, and CD274 (PD-L1), all crucial for immune checkpoint regulation and T cell activity modulation. Notable correlations with immune stimulators include CD80, CD86, TNFRSF9 (4-1BB), and ICOS, which are vital for T cell activation and longevity. Additionally, CD19 expression is linked with MHC genes like HLA-A, HLA-B, HLA-C, HLA-DRA, and HLA-DRB1, important for antigen presentation to T cells. The Kruskal-Wallis test for CD19 expression across immune subtypes in CESC (Figure 5D) yields a p-value of 3.91e-06, highlighting notable differences among subtypes. Violin plots indicate significantly higher CD19 expression in subtype C2 compared to others, suggesting a unique immunological profile. For READ, Figure 5E shows variable CD19 expression across subtypes, with subtype C3 exhibiting slightly elevated levels. In SARC, the Kruskal-Wallis test results in a p-value of 3.17e-06, indicating substantial differences in CD19 expression across immune subtypes. Violin plots reveal that subtype C4 has the highest CD19 expression, reflecting a distinctive immune environment with elevated CD19 levels (Figure 5F). Overall, these results illustrate significant correlations between CD19 expression and various immune-related genes across CESC, READ, and SARC, with distinct expression patterns observed among different immune subtypes within each cancer type.
Figure 5.
Correlation of CD19 expression with immune regulators and subtypes across different cancer types. A. This panel displays the correlation of CD19 with immune inhibitor genes. B. This panel shows the correlation of CD19 with immune stimulator genes. C. This panel illustrates the correlation of CD19 with MHC (Major Histocompatibility Complex) genes. The color scale again indicates the strength and direction of the correlation. D. This panel represents the expression of CD19 in in cervical squamous cell carcinoma (CESC) across different immune subtypes (C1, C2, and C4). E. This panel shows CD19 expression rectum adenocarcinoma (READ) across subtypes C1, C2, C3, C4, and C6. F. This panel illustrates CD19 expression in sarcoma (SARC) across subtypes C1, C2, C3, C4, and C6. P-value < 0.05.
Gene enrichment analysis
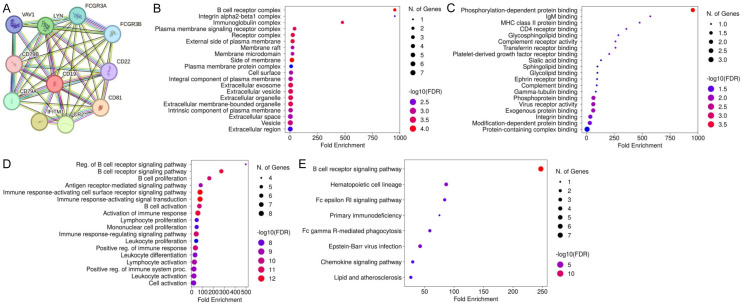
Figure 6A depicts the Protein-Protein Interaction (PPI) network involving CD19 from STRING, highlighting its interactions with proteins such as FCGR3A, FCGR3B, CD22, CD81, CD79A, CD79B, CR2, IFITM1, LYN, and VAV1. This network underscores the intricate connections among these proteins. Figure 6B presents cellular component (CC) enrichment analysis, identifying significant enrichment in complexes such as the B cell receptor complex, plasma membrane signaling receptor complex, and integrin alpha2-beta1 complex. Figure 6C illustrates molecular function (MF) enrichment, emphasizing significant associations with phosphorylation-dependent protein binding, IgM binding, and MHC class II protein binding. Figure 6D highlights biological process (BP) enrichment, revealing strong associations with B cell receptor signaling regulation, B cell proliferation, and antigen receptor-mediated signaling pathways. Lastly, Figure 6E outlines pathway enrichment analysis, identifying crucial pathways like the B cell receptor signaling pathway, hematopoietic cell lineage, Fc epsilon RI signaling pathway, and Epstein-Barr virus infection. These findings collectively emphasize the critical roles of CD19 and its associated proteins in various cellular components, molecular functions, biological processes, and pathways integral to B cell function and immune response.
Figure 6.
Functional enrichment analysis of CD19 and its interacting proteins. A. STRING-based PPI network of CD19 interacting proteins. B. This panel highlights the enrichment of cellular components (CC). C. This panel highlights the enrichment of molecular function (MF). D. This panel shows enrichment in biological processes (BP). E. This panel highlights the enrichment of pathways. P-value < 0.05.
Correlation of CD19 with immune infiltrates and drug sensitivity
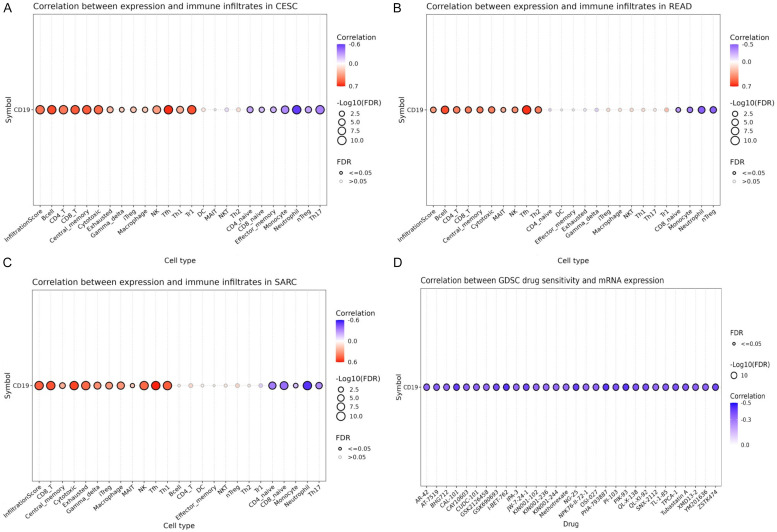
The relationship between CD19 expression and immune cell infiltration was assessed using the GSCA database. Figure 7A highlights that in CESC, CD19 expression shows a significant positive correlation with several immune cell types, including B cells, CD8+ T cells, cytotoxic T cells, macrophages, and dendritic cells, with the strongest associations noted with B cells and CD8+ T cells. Similarly, Figure 7B reveals that in READ, CD19 levels are positively correlated with the infiltration of B cells, CD8+ T cells, and cytotoxic T cells. For SARC, Figure 7C confirms that CD19 expression correlates positively with B cells, CD8+ T cells, cytotoxic T cells, and macrophages. These findings collectively suggest that CD19 is intricately linked to the immune cell landscape in CESC, READ, and SARC, indicating its potential role in the immune microenvironment of these cancers. However, Figure 7D illustrates that CD19 expression does not show significant correlations with drug sensitivity across various treatments, as observed in the GDSC database. This suggests that while CD19 may influence immune cell infiltration, it does not notably affect the sensitivity of cancer cells to therapeutic drugs.
Figure 7.
Correlations of CD19 expression with immune infiltrates and drug sensitivity in cervical squamous cell carcinoma (CESC), rectum adenocarcinoma (READ), and sarcoma (SARC). A. Correlation between CD19 expression and immune infiltrates in CESC. B. Correlation between CD19 expression and immune infiltrates in READ. C. Correlation between CD19 expression and immune infiltrates in SARC. D. Correlation between CD19 mRNA expression and drug sensitivity. P-value < 0.05.
Expression validation of CD19 in READ cell lines
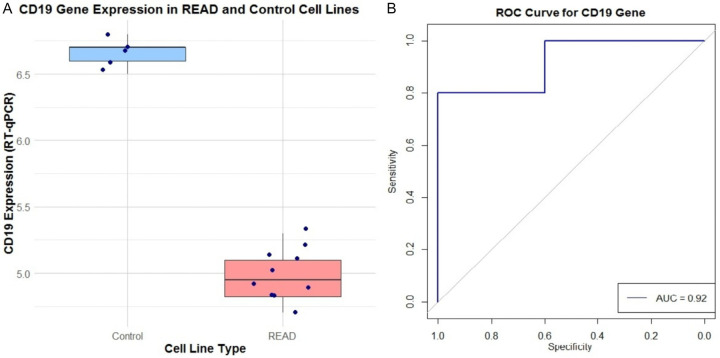
To validate CD19 expression levels, RT-qPCR was performed on 10 READ cell lines and 5 control lines. Figure 8A presents a box plot demonstrating a significant reduction in CD19 expression in READ cell lines compared to controls. Additionally, Figure 8B features an ROC curve for CD19, with an area under the curve (AUC) of 0.92. This high AUC indicates strong sensitivity and specificity in distinguishing READ samples from normal controls based on CD19 expression levels.
Figure 8.
RT-qPCR-based CD19 gene expression and its diagnostic performance in READ (Rectum Adenocarcinoma) versus control cell lines. A. This box plot compares CD19 expression levels, measured by RT-qPCR. B. The receiver operating characteristic (ROC) curve assesses the diagnostic performance of CD19 expression in distinguishing between control and READ cell lines.
Evaluation of CD19 overexpression on SW480 cell functionality
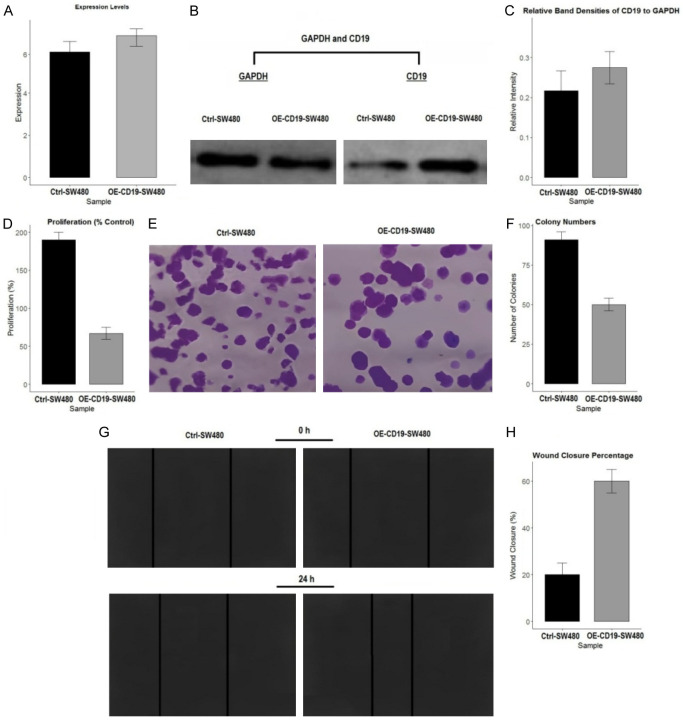
The effects of CD19 overexpression on SW480 cell functionality were evaluated through various assays. Figure 9A confirms the successful overexpression of CD19 in SW480 cells (OE-CD19-SW480) compared to control cells (Ctrl-SW480) using RT-qPCR. Figure 9B and 9C show Western blot analyses confirming increased CD19 protein levels in OE-CD19-SW480 cells. Figure 9D presents the results of a cell proliferation assay, which reveals a significant decrease in proliferation in OE-CD19-SW480 cells compared to Ctrl-SW480 cells, indicating that CD19 overexpression impairs cell growth. Figure 9E and 9F illustrate the colony formation assay results, showing a reduction in the number of colonies formed by OE-CD19-SW480 cells, suggesting decreased clonogenic potential. Figure 9G and 9H depict the wound healing assay, where OE-CD19-SW480 cells demonstrate a significantly higher wound closure percentage compared to Ctrl-SW480 cells, reflecting enhanced migratory capability due to CD19 overexpression. These results indicate that CD19 overexpression in SW480 cells leads to reduced cell proliferation and colony formation but enhances wound healing, emphasizing its multifaceted role in cellular dynamics.
Figure 9.
Effects of CD19 overexpression on SW480 cell proliferation, colony formation, and migration. A. Expression levels of CD19 in control (Ctrl-SW480) and CD19-overexpressing (OE-CD19-SW480) cells as determined by quantitative RT-qPCR. B. Western blot analysis showing protein levels of CD19 and GAPDH in Ctrl-SW480 and OE-CD19-SW480 cells. C. Quantification of relative band densities of CD19 to GAPDH from the Western blot. D. Proliferation percentage of Ctrl-SW480 and OE-CD19-SW480 cells. E. Representative images from the colony formation assay, showing colonies formed by Ctrl-SW480 and OE-CD19-SW480 cells. F. Quantification of colony numbers in Ctrl-SW480 and OE-CD19-SW480 cells. G. Wound healing assay images at 0 and 24 hours post-scratch for Ctrl-SW480 and OE-CD19-SW480 cells. H. Quantification of wound closure percentage at 24 hours for Ctrl-SW480 and OE-CD19-SW480 cells.
Discussion
Cancer remains one of the foremost causes of death globally, characterized by its intricate interplay of genetic, epigenetic, and environmental elements, which complicates both its understanding and treatment [26-29]. Recent strides in molecular biology and advanced high-throughput techniques have opened avenues to investigate various biomarkers that could potentially enhance cancer diagnosis, prognosis, and therapy [30-33]. Among these biomarkers is CD19, a transmembrane protein predominantly found on B cells, plays a pivotal role in B cell maturation and functionality [34,35]. Although CD19 has gained prominence in hematological malignancies as a target for chimeric antigen receptor (CAR) T cell therapies [36,37], its role in solid tumors remains underexplored, presenting a unique opportunity to evaluate its expression and implications across different cancer types.
CD19’s involvement in hematological malignancies, such as B-cell acute lymphoblastic leukemia (B-ALL) and B-cell non-Hodgkin lymphoma (B-NHL), is well-established [38,39]. Therapeutic strategies targeting CD19, particularly through CAR-T cell therapies, have shown considerable success, transforming treatment approaches for patients with refractory or relapsed B-cell malignancies [13]. However, the extent of CD19’s role in solid tumors has not been thoroughly examined [40]. Emerging evidence suggests that CD19 might influence immune cell infiltration and modulate the tumor microenvironment in solid tumors, hinting at a broader functional role than previously understood [41,42].
In our investigation, we examined CD19 expression across 33 cancer types using data from the TCGA database, analyzed through TIMER2 and UALCAN platforms. Our analysis revealed notably elevated CD19 levels in tumor tissues of several cancers, including Adrenocortical Carcinoma (ACC), Breast Invasive Carcinoma (BRCA), Cholangiocarcinoma (CHOL), Glioblastoma Multiforme (GBM), Head and Neck Squamous Cell Carcinoma (HNSC), Kidney Renal Clear Cell Carcinoma (KIRC), Liver Hepatocellular Carcinoma (LIHC), and Pancreatic Adenocarcinoma (PAAD) compared to normal tissues. Conversely, we observed a significant down-regulation of CD19 in Cervical Squamous Cell Carcinoma (CESC), Rectum Adenocarcinoma (READ), and Sarcoma (SARC). These observations align with existing literature indicating heterogeneous CD19 expression patterns across different cancer types [43,44]. Our prognostic analysis demonstrated that diminished CD19 expression correlates with poorer outcomes in CESC, READ, and SARC. Both univariate Cox regression analysis and Kaplan-Meier survival curves substantiated that reduced CD19 levels are associated with adverse overall survival in these cancers, corroborating previous findings that CD19 expression could serve as a prognostic indicator in specific malignancies [45,46].
Additionally, our methylation studies revealed a significant inverse relationship between CD19 gene methylation and mRNA expression in CESC, READ, and SARC. This epigenetic modification suggests that DNA methylation may play a crucial role in regulating CD19 expression in these cancers, supporting earlier research that highlights DNA methylation’s impact on gene expression in cancer [47,48]. We further investigated the mutational landscape of CD19, discovering that mutations in this gene are relatively rare in CESC, READ, and SARC, with negligible effects on tumor mutational burden and microsatellite instability. This indicates that CD19 mutations do not substantially contribute to the genomic instability of these cancers, consistent with previous studies [49,50].
Our analysis also explored the correlations between CD19 expression and immune-related genes, revealing significant associations with various immune inhibitors, stimulators, and MHC genes. These findings underscore CD19’s potential involvement in the tumor immune microenvironment, suggesting that it might influence immune cell infiltration and interactions within the tumor. Finally, we validated CD19 expression in READ cell lines, confirming significantly lower CD19 levels at both the gene and protein levels in tumor cells compared to normal controls. This down-regulation was corroborated by Western blot analysis, with an ROC curve demonstrating high sensitivity and specificity for CD19 as a distinguishing marker between READ tumors and normal tissues.
Conclusion
This investigation offers an in-depth exploration of CD19 expression across a diverse array of cancer types, uncovering notable variations and their potential prognostic significance. Our analysis revealed elevated CD19 levels in several cancers, including Adrenocortical Carcinoma (ACC), Breast Invasive Carcinoma (BRCA), Cholangiocarcinoma (CHOL), Glioblastoma Multiforme (GBM), Head and Neck Squamous Cell Carcinoma (HNSC), Kidney Renal Clear Cell Carcinoma (KIRC), Liver Hepatocellular Carcinoma (LIHC), and Pancreatic Adenocarcinoma (PAAD). Conversely, significant down-regulation of CD19 was observed in Cervical Squamous Cell Carcinoma (CESC), Rectum Adenocarcinoma (READ), and Sarcoma (SARC). The association of reduced CD19 expression with poor overall survival in CESC, READ, and SARC underscores its prognostic relevance. Our methylation studies revealed an inverse relationship between CD19 methylation and its gene expression, highlighting the role of epigenetic regulation in modulating CD19 levels. Furthermore, the significant correlations between CD19 expression and various immune-related genes and infiltrates point to its involvement in shaping the tumor immune microenvironment. Although the study predominantly relies on public databases, and further protein-level and functional validations are necessary, these findings provide crucial insights into CD19’s role beyond hematological malignancies. The results emphasize CD19’s potential as a biomarker for diagnostic, prognostic, and therapeutic purposes in solid tumors. Future investigations should prioritize experimental validation and clinical trials to substantiate these observations and elucidate the mechanisms by which CD19 influences cancer progression and immune modulation. Such research could pave the way for innovative therapeutic strategies targeting CD19.
Disclosure of conflict of interest
None.
References
- 1.Yan C, Shan F, Ying X, Li Z. Global burden prediction of gastric cancer during demographic transition from 2020 to 2040. Chin Med J (Engl) 2023;136:397–406. doi: 10.1097/CM9.0000000000002626. [DOI] [PMC free article] [PubMed] [Google Scholar]
- 2.Ramón y Cajal S, Sesé M, Capdevila C, Aasen T, De Mattos-Arruda L, Diaz-Cano SJ, Hernández-Losa J, Castellví J. Clinical implications of intratumor heterogeneity: challenges and opportunities. J Mol Med (Berl) 2020;98:161–177. doi: 10.1007/s00109-020-01874-2. [DOI] [PMC free article] [PubMed] [Google Scholar]
- 3.Dar MA, Arafah A, Bhat KA, Khan A, Khan MS, Ali A, Ahmad SM, Rashid SM, Rehman MU. Multiomics technologies: role in disease biomarker discoveries and therapeutics. Brief Funct Genomics. 2023;22:76–96. doi: 10.1093/bfgp/elac017. [DOI] [PubMed] [Google Scholar]
- 4.Restrepo JC, Dueñas D, Corredor Z, Liscano Y. Advances in genomic data and biomarkers: revolutionizing NSCLC diagnosis and treatment. Cancers (Basel) 2023;15:3474. doi: 10.3390/cancers15133474. [DOI] [PMC free article] [PubMed] [Google Scholar]
- 5.Vicente MM, Leite-Gomes E, Pinho SS. Glycome dynamics in T and B cell development: basic immunological mechanisms and clinical applications. Trends Immunol. 2023;44:585–597. doi: 10.1016/j.it.2023.06.004. [DOI] [PMC free article] [PubMed] [Google Scholar]
- 6.Weiland J, Elder A, Forster V, Heidenreich O, Koschmieder S, Vormoor J. CD19: a multifunctional immunological target molecule and its implications for Blineage acute lymphoblastic leukemia. Pediatr Blood Cancer. 2015;62:1144–1148. doi: 10.1002/pbc.25462. [DOI] [PubMed] [Google Scholar]
- 7.Holborough-Kerkvliet MD, Kroos S, van de Wetering R, Toes REM. Addressing the key issue: antigen-specific targeting of B cells in autoimmune diseases. Immunol Lett. 2023;259:37–45. doi: 10.1016/j.imlet.2023.05.005. [DOI] [PubMed] [Google Scholar]
- 8.Gambella M, Carlomagno S, Raiola AM, Giannoni L, Ghiggi C, Setti C, Giordano C, Luchetti S, Serio A, Bo A, Falco M, Della Chiesa M, Angelucci E, Sivori S. CD19-targeted immunotherapies for diffuse large B-cell lymphoma. Front Immunol. 2022;13:837457. doi: 10.3389/fimmu.2022.837457. [DOI] [PMC free article] [PubMed] [Google Scholar]
- 9.Raufi A, Ebrahim AS, Al-Katib A. Targeting CD19 in B-cell lymphoma: emerging role of SAR3419. Cancer Manag Res. 2013;5:225–233. doi: 10.2147/CMAR.S45957. [DOI] [PMC free article] [PubMed] [Google Scholar]
- 10.Poojary R, Song AF, Song BS, Song CS, Wang L, Song J. Investigating chimeric antigen receptor T cell therapy and the potential for cancer immunotherapy. Mol Clin Oncol. 2023;19:95. doi: 10.3892/mco.2023.2691. [DOI] [PMC free article] [PubMed] [Google Scholar]
- 11.Bao F, Wan W, He T, Qi F, Liu G, Hu K, Lu XA, Yang P, Dong F, Wang J, Jing H. Autologous CD19-directed chimeric antigen receptor-T cell is an effective and safe treatment to refractory or relapsed diffuse large B-cell lymphoma. Cancer Gene Ther. 2019;26:248–255. doi: 10.1038/s41417-018-0073-7. [DOI] [PubMed] [Google Scholar]
- 12.Sworder BJ, Kurtz DM, Alig SK, Frank MJ, Shukla N, Garofalo A, Macaulay CW, Shahrokh Esfahani M, Olsen MN, Hamilton J, Hosoya H, Hamilton M, Spiegel JY, Baird JH, Sugio T, Carleton M, Craig AFM, Younes SF, Sahaf B, Sheybani ND, Schroers-Martin JG, Liu CL, Oak JS, Jin MC, Beygi S, Hüttmann A, Hanoun C, Dührsen U, Westin JR, Khodadoust MS, Natkunam Y, Majzner RG, Mackall CL, Diehn M, Miklos DB, Alizadeh AA. Determinants of resistance to engineered T cell therapies targeting CD19 in large B cell lymphomas. Cancer Cell. 2023;41:210–225. e215. doi: 10.1016/j.ccell.2022.12.005. [DOI] [PMC free article] [PubMed] [Google Scholar]
- 13.Dagar G, Gupta A, Masoodi T, Nisar S, Merhi M, Hashem S, Chauhan R, Dagar M, Mirza S, Bagga P, Kumar R, Akil ASA, Macha MA, Haris M, Uddin S, Singh M, Bhat AA. Harnessing the potential of CAR-T cell therapy: progress, challenges, and future directions in hematological and solid tumor treatments. J Transl Med. 2023;21:449. doi: 10.1186/s12967-023-04292-3. [DOI] [PMC free article] [PubMed] [Google Scholar]
- 14.Acharya L, Garg A, Rai M, Kshetri R, Grewal US, Dhakal P. Novel chimeric antigen receptor targets and constructs for acute lymphoblastic leukemia: moving beyond CD19. J Investig Med. 2024;72:32–46. doi: 10.1177/10815589231191811. [DOI] [PubMed] [Google Scholar]
- 15.Russler-Germain DA, Ghobadi A. T-cell redirecting therapies for B-cell non-Hodgkin lymphoma: recent progress and future directions. Front Oncol. 2023;13:1168622. doi: 10.3389/fonc.2023.1168622. [DOI] [PMC free article] [PubMed] [Google Scholar]
- 16.Li T, Fu J, Zeng Z, Cohen D, Li J, Chen Q, Li B, Liu XS. TIMER2.0 for analysis of tumor-infiltrating immune cells. Nucleic Acids Res. 2020;48:W509–W514. doi: 10.1093/nar/gkaa407. [DOI] [PMC free article] [PubMed] [Google Scholar]
- 17.Chandrashekar DS, Bashel B, Balasubramanya SAH, Creighton CJ, Ponce-Rodriguez I, Chakravarthi BVSK, Varambally S. UALCAN: a portal for facilitating tumor subgroup gene expression and survival analyses. Neoplasia. 2017;19:649–658. doi: 10.1016/j.neo.2017.05.002. [DOI] [PMC free article] [PubMed] [Google Scholar]
- 18.Lánczky A, Győrffy B. Web-based survival analysis tool tailored for medical research (KMplot): development and implementation. J Med Internet Res. 2021;23:e27633. doi: 10.2196/27633. [DOI] [PMC free article] [PubMed] [Google Scholar]
- 19.Tang Z, Kang B, Li C, Chen T, Zhang Z. GEPIA2: an enhanced web server for large-scale expression profiling and interactive analysis. Nucleic Acids Res. 2019;47:W556–W560. doi: 10.1093/nar/gkz430. [DOI] [PMC free article] [PubMed] [Google Scholar]
- 20.Thul PJ, Lindskog C. The human protein atlas: a spatial map of the human proteome. Protein Sci. 2018;27:233–244. doi: 10.1002/pro.3307. [DOI] [PMC free article] [PubMed] [Google Scholar]
- 21.Liu CJ, Hu FF, Xie GY, Miao YR, Li XW, Zeng Y, Guo AY. GSCA: an integrated platform for gene set cancer analysis at genomic, pharmacogenomic and immunogenomic levels. Brief Bioinform. 2023;24:bbac558. doi: 10.1093/bib/bbac558. [DOI] [PubMed] [Google Scholar]
- 22.Cerami E, Gao J, Dogrusoz U, Gross BE, Sumer SO, Aksoy BA, Jacobsen A, Byrne CJ, Heuer ML, Larsson E, Antipin Y, Reva B, Goldberg AP, Sander C, Schultz N. The cBio cancer genomics portal: an open platform for exploring multidimensional cancer genomics data. Cancer Discov. 2012;2:401–404. doi: 10.1158/2159-8290.CD-12-0095. [DOI] [PMC free article] [PubMed] [Google Scholar]
- 23.Ru B, Wong CN, Tong Y, Zhong JY, Zhong SSW, Wu WC, Chu KC, Wong CY, Lau CY, Chen I, Chan NW, Zhang J. TISIDB: an integrated repository portal for tumor-immune system interactions. Bioinformatics. 2019;35:4200–4202. doi: 10.1093/bioinformatics/btz210. [DOI] [PubMed] [Google Scholar]
- 24.Szklarczyk D, Gable AL, Lyon D, Junge A, Wyder S, Huerta-Cepas J, Simonovic M, Doncheva NT, Morris JH, Bork P, Jensen LJ, Mering CV. STRING v11: protein-protein association networks with increased coverage, supporting functional discovery in genome-wide experimental datasets. Nucleic Acids Res. 2019;47:D607–D613. doi: 10.1093/nar/gky1131. [DOI] [PMC free article] [PubMed] [Google Scholar]
- 25.Sherman BT, Hao M, Qiu J, Jiao X, Baseler MW, Lane HC, Imamichi T, Chang W. DAVID: a web server for functional enrichment analysis and functional annotation of gene lists (2021 update) Nucleic Acids Res. 2022;50:W216–W221. doi: 10.1093/nar/gkac194. [DOI] [PMC free article] [PubMed] [Google Scholar]
- 26.Roy M, Biswas J, Datta A. Genetics and epigenetics of breast cancer. Springer; 2023. [Google Scholar]
- 27.Usman M, Hameed Y, Ahmad M. Does human papillomavirus cause human colorectal cancer? Applying Bradford Hill criteria postulates. Ecancermedicalscience. 2020;14:1107. doi: 10.3332/ecancer.2020.1107. [DOI] [PMC free article] [PubMed] [Google Scholar]
- 28.Xu W, Li H, Hameed Y, Abdel-Maksoud MA, Almutairi SM, Mubarak A, Aufy M, Alturaiki W, Alshalani AJ, Mahmoud AM, Li C. Elucidating the clinical and immunological value of m6A regulator-mediated methylation modification patterns in adrenocortical carcinoma. Oncol Res. 2023;31:819–831. doi: 10.32604/or.2023.029414. [DOI] [PMC free article] [PubMed] [Google Scholar]
- 29.Hu H, Umair M, Khan SA, Sani AI, Iqbal S, Khalid F, Sultan R, Abdel-Maksoud MA, Mubarak A, Dawoud TM, Malik A, Saleh IA, Al Amri AA, Algarzae NK, Kodous AS, Hameed Y. CDCA8, a mitosis-related gene, as a prospective pan-cancer biomarker: implications for survival prognosis and oncogenic immunology. Am J Transl Res. 2024;16:432–445. doi: 10.62347/WSEF7878. [DOI] [PMC free article] [PubMed] [Google Scholar]
- 30.Orsini A, Diquigiovanni C, Bonora E. Omics technologies improving breast cancer research and diagnostics. Int J Mol Sci. 2023;24:12690. doi: 10.3390/ijms241612690. [DOI] [PMC free article] [PubMed] [Google Scholar]
- 31.Chen J, Niu C, Yang N, Liu C, Zou SS, Zhu S. Biomarker discovery and application-an opportunity to resolve the challenge of liver cancer diagnosis and treatment. Pharmacol Res. 2023;189:106674. doi: 10.1016/j.phrs.2023.106674. [DOI] [PubMed] [Google Scholar]
- 32.Abdel-Maksoud MA, Ullah S, Nadeem A, Shaikh A, Zia MK, Zakri AM, Almanaa TN, Alfuraydi AA, Mubarak A, Hameed Y. Unlocking the diagnostic, prognostic roles, and immune implications of BAX gene expression in pan-cancer analysis. Am J Transl Res. 2024;16:63–74. doi: 10.62347/TWOY1681. [DOI] [PMC free article] [PubMed] [Google Scholar]
- 33.Hameed Y, Ejaz S. Integrative analysis of multi-omics data highlighted TP53 as a potential diagnostic and prognostic biomarker of survival in breast invasive carcinoma patients. Comput Biol Chem. 2021;92:107457. doi: 10.1016/j.compbiolchem.2021.107457. [DOI] [PubMed] [Google Scholar]
- 34.Xu H, Li N, Wang G, Cao Y. Predictive short/long-term efficacy biomarkers and resistance mechanisms of CD19-directed CAR-T immunotherapy in relapsed/refractory B-cell lymphomas. Front Immunol. 2023;14:1110028. doi: 10.3389/fimmu.2023.1110028. [DOI] [PMC free article] [PubMed] [Google Scholar]
- 35.Sanchez E, Tanenbaum EJ, Patil S, Li M, Soof CM, Vidisheva A, Waterman GN, Hekmati T, Tang G, Wang CS, Chen H, Berenson J. The clinical significance of B-cell maturation antigen as a therapeutic target and biomarker. Expert Rev Mol Diagn. 2018;18:319–329. doi: 10.1080/14737159.2018.1448269. [DOI] [PubMed] [Google Scholar]
- 36.Abbasi S, Totmaj MA, Abbasi M, Hajazimian S, Goleij P, Behroozi J, Shademan B, Isazadeh A, Baradaran B. Chimeric antigen receptor T (CAR-T) cells: novel cell therapy for hematologi cal malignancies. Cancer Med. 2023;12:7844–7858. doi: 10.1002/cam4.5551. [DOI] [PMC free article] [PubMed] [Google Scholar]
- 37.Savoldo B, Grover N, Dotti G. CAR T cells for hematological malignancies. J Clin Invest. 2024;134:e177160. doi: 10.1172/JCI177160. [DOI] [PMC free article] [PubMed] [Google Scholar]
- 38.Villasboas JC, Ansell SM. Therapeutic targets and investigated strategies for treating B-cell non-Hodgkin lymphoma. Expert Opinion on Orphan Drugs. 2015;3:921–932. [Google Scholar]
- 39.Purev E, Fry TJ. Chimeric antigen receptor T cells for the treatment of lymphoma. Ann Lymphoma. 2017;1:31–42. [Google Scholar]
- 40.Daei Sorkhabi A, Mohamed Khosroshahi L, Sarkesh A, Mardi A, Aghebati-Maleki A, Aghebati-Maleki L, Baradaran B. The current landscape of CAR T-cell therapy for solid tumors: mechanisms, research progress, challenges, and counterstrategies. Front Immunol. 2023;14:1113882. doi: 10.3389/fimmu.2023.1113882. [DOI] [PMC free article] [PubMed] [Google Scholar]
- 41.Martinez M, Moon EK. CAR T cells for solid tumors: new strategies for finding, infiltrating, and surviving in the tumor microenvironment. Front Immunol. 2019;10:128. doi: 10.3389/fimmu.2019.00128. [DOI] [PMC free article] [PubMed] [Google Scholar]
- 42.Liu G, Rui W, Zhao X, Lin X. Enhancing CAR-T cell efficacy in solid tumors by targeting the tumor microenvironment. Cell Mol Immunol. 2021;18:1085–1095. doi: 10.1038/s41423-021-00655-2. [DOI] [PMC free article] [PubMed] [Google Scholar]
- 43.Ginaldi L, De Martinis M, Matutes E, Farahat N, Morilla R, Catovsky D. Levels of expression of CD19 and CD20 in chronic B cell leukaemias. J Clin Pathol. 1998;51:364–369. doi: 10.1136/jcp.51.5.364. [DOI] [PMC free article] [PubMed] [Google Scholar]
- 44.Kochenderfer JN, Rosenberg SA. Treating B-cell cancer with T cells expressing anti-CD19 chimeric antigen receptors. Nat Rev Clin Oncol. 2013;10:267–276. doi: 10.1038/nrclinonc.2013.46. [DOI] [PMC free article] [PubMed] [Google Scholar]
- 45.Sun H, Wang H, Pan H, Zuo Y, Zhao R, Huang R, Xue Y, Song H. CD19 (+) B cell combined with prognostic nutritional index predicts the clinical outcomes of patients with gastric cancer who underwent surgery. Cancers (Basel) 2023;15:2531. doi: 10.3390/cancers15092531. [DOI] [PMC free article] [PubMed] [Google Scholar]
- 46.Ball ED, Davis RB, Griffin JD, Mayer RJ, Davey FR, Arthur DC, Wurster-Hill D, Noll W, Elghetany MT, Allen SL, et al. Prognostic value of lymphocyte surface markers in acute myeloid leukemia. Blood. 1991;77:2242–50. [PubMed] [Google Scholar]
- 47.Yang Y, Chen Y, Xu S, Guo X, Jia G, Ping J, Shu X, Zhao T, Yuan F, Wang G. Integrating genome and epigenome data to identify tissue-specific DNA methylation biomarkers for cancer risk. medRxiv. 2023;2023:23293899. doi: 10.1038/s41467-024-50404-y. [DOI] [PMC free article] [PubMed] [Google Scholar]
- 48.Xie Q, Bai Q, Zou LY, Zhang QY, Zhou Y, Chang H, Yi L, Zhu JD, Mi MT. Genistein inhibits DNA methylation and increases expression of tumor suppressor genes in human breast cancer cells. Genes Chromosomes Cancer. 2014;53:422–431. doi: 10.1002/gcc.22154. [DOI] [PubMed] [Google Scholar]
- 49.McBride KM, Kil H, Mu Y, Plummer JB, Lee J, Zelazowski MJ, Sebastian M, Abba MC, Aldaz CM. Wwox deletion in mouse B cells leads to genomic instability, neoplastic transformation, and monoclonal gammopathies. Front Oncol. 2019;9:517. doi: 10.3389/fonc.2019.00517. [DOI] [PMC free article] [PubMed] [Google Scholar]
- 50.Riley MF, You MJ, Multani AS, Lozano G. Mdm2 overexpression and p73 loss exacerbate genomic instability and dampen apoptosis, resulting in B-cell lymphoma. Oncogene. 2016;35:358–365. doi: 10.1038/onc.2015.88. [DOI] [PMC free article] [PubMed] [Google Scholar]


