Abstract
Objective: To evaluate the efficacy and safety of 128 slice CT low-dose scanning technology combined with low-density contrast agent in lower extremity computed tomography angiography (CTA) for patients with diabetic foot. Methods: A retrospective study was conducted on 342 patients with diabetic foot admitted to Shaanxi Kangfu Hospital from March 2021 to May 2023. Of these, 181 received 128 slice CT low-dose scanning technology combined with low-density contrast medium for lower extremity CTA examination (research group), and 161 patients underwent conventional dose contrast medium for CTA examination (control group). Diagnostic outcomes of the two groups were compared, along with image quality, contrast agent dosage, patient tolerance to contrast agents, and incidence of adverse reactions. Results: No significant difference was observed in diabetic foot detection rate between the two groups (90.06% in research group vs. 86.96% in control group, P > 0.05). No significant difference in image quality or vascular CT values was found between the two groups (P > 0.05). Although the research group exhibited slightly higher image noise and lower signal-to-noise ratio (SNR) and contrast-to-noise ratio (CNR), these differences were not significant (all P > 0.05). The volume computed tomography dose index (CTDIvol), effective dose (ED), and iodine uptake in the research group were significantly lower than those of the control group (all P < 0.05). In terms of the incidence of adverse reactions, patients in the research group had a good tolerance to contrast agents, with an 8.29% incidence of mild discomfort (such as nausea and mild rash) and no reports of severe allergic reactions. In contrast, the incidence of mild discomfort reactions in the control group was 14.91% (P < 0.05). Among the diabetic foot patients, 46.20% had mild stenosis, while 53.80% had moderate-to-severe stenosis. The detection rate of moderate-to-severe stenosis was 84.67% (138/163) in the research group and 82.86% (116/140) in the control group (P > 0.05). The ROC curve results indicated good diagnostic accuracy in both groups (AUC of 0.690 in research group and 0.783 in control), with significant difference between the two groups (P > 0.05). Conclusion: 128 slice CT low-dose scanning technology combined with low concentration contrast medium shows good effectiveness and safety for CTA of lower limbs in patients with diabetic foot. It provides an optimized scheme for vascular assessment of diabetic foot patients, reducing contrast agent exposure, lowering the risk of complications, and maintaining diagnostic accuracy.
Keywords: CT low-dose scanning technology, contrast agent, diabetic foot, lower limb CTA
Introduction
Diabetes is a globally prevalent chronic metabolic disease characterized by hyperglycemia. It is a leading cause of cardiovascular diseases, retinopathy, and nephropathy, as well as a severe complication of diabetic foot. Studies have found that about 15% of diabetic patients develop diabetic foot, primarily characterized by vascular lesions in the lower extremities that cause circulatory disorders. According to data from the International Diabetes Federation (IDF), the global population of diabetes patients has exceeded 463 million, with approximately 15% experiencing diabetic foot during their lifetime [1]. The incidence of diabetic foot significantly increases with disease progression, leading to foot ulcers, infections, and even amputations, which severely worsen patients’ quality of life and life expectancy [2].
Early detection and accurate assessment of vascular lesions in diabetic foot patients are crucial, and imaging examinations play a key role in this process. Computed tomography angiography (CTA), as a non-invasive imaging technique, has been widely used in clinical practice [3,4]. Conventional CTA examinations, with high accuracy and resolution, clearly display the anatomic structures and pathologic changes of the lower extremity arteries. However, conventional CTA requires high doses of radiation and high concentrations of contrast agents, which present risks for diabetic patients, especially those with impaired renal function [5]. Research has reported that high-dose radiation exposure may increase the risk of cancer, and high-concentration contrast agents may cause contrast-induced nephropathy (CIN), further impairing renal function and possibly causing acute renal failure [6].
In recent years, 128-slice CT low-dose scanning technology has gradually become an important option for CTA examinations due to its advantages of low radiation dose, fast imaging speed, and high image quality. Studies have found that the application of low-concentration contrast agents not only reduces the risk of renal impairment but also lowers the incidence of contrast-related adverse reactions [7]. However, there remains a lack of systematic research on the effectiveness and safety of combining low-dose scanning technology with low-concentration contrast agents in lower extremity CTA for diabetic foot. This study aims to investigate the clinical efficacy and safety of 128-slice CT low-dose scanning technology combined with low-concentration contrast agents in lower extremity CTA for diabetic foot. By comparing with conventional CTA examination methods, this study seeks to identify the advantages and challenges of this technology in clinical practice, providing a reference for clinical practice.
Materials and methods
Study subjects
This study included 342 diabetic foot patients treated at Shaanxi Kangfu Hospital from March 2021 to May 2023, with approval from the hospital’s ethics committee (Ethics Lot Number: 2023001). The hospital’s medical record system and radiology department database were searched to screen all diabetic foot patients who underwent lower extremity CTA examination. Relevant data, including scanning protocol, contrast agent types and doses, were collected. Based on imaging reports and contrast agent injection records, 342 diabetic foot patients were screened out, including 181 patients who received lower limb CTA examination with 128-slice CT low-dose scanning technology combined with low-concentration contrast agent (as research group), and 161 patients who received conventional-dose CTA examination with standard contrast agent (as control group). The sample size was estimated using the formula: n=(Zα/2+Zβ)2·(p1(1-p1)+p2(1-p2))/(p1-p2)2, where n represents the required samples for each group quantity, Zα/2 stands for the critical value under normal distribution (for significance level α = 0.05, Zα/2 ≈ 1.96), Zβ represents the critical value corresponding to statistical power (usually 80%, Zβ ≈ 0.84), p1 represents expected detection rate in the research group, and p2 represents expected detection rate in the control group. Based on the expected detection rate, the estimated sample size was 348, which aligns with the 342 cases collected in this study.
Inclusion criteria
Inclusion criteria: (1) Patients diagnosed with type 2 diabetes and diabetic foot according to diagnostic guidelines provided by the American Diabetes Association (ADA), with diagnostic criteria including X-rays, MRI, or CTA showing lesions in the bones and soft tissues of the foot, clinical examination revealing insufficient blood flow, skin lesions, or infections, and symptoms such as foot ulcers, infections, gangrene, foot pain, or sensory abnormalities [8]; (2) Age between 50 and 80 years; (3) No history of lower extremity vascular surgery; (4) Able to cooperate in completing the CTA examination; (5) Complete medical records.
Exclusion criteria: (1) Allergy to contrast agents; (2) Pregnant or breastfeeding women; (3) Patients with acute renal insufficiency; (4) Patients with severe heart or lung dysfunction.
Methods
Before examination, both groups underwent body weight measurement and renal function evaluation. The low-dose 128-slice CT scanner (Siemens SOMATOM Definition AS) for lower extremity examination in the research group. Patients were positioned supine on the scanning table, head first. The scanning parameters: tube voltage at 100 kV, tube current at 300 mA, scanning speed at 0.35 seconds/rotation, slice thickness of 0.625 mm, and pitch of 1.375. A low-dose localization scan was performed, with the scanning range and position from the renal arteries to the ankle joint and dorsum of the foot. The actual scan started simultaneously with the injection of the contrast agent. In the research group, patients received an injection of iodixanol (120 ml), with the concentration controlled at approximately 270 mg I/mL, injected through the elbow vein at a rate of 3.5 mL/s using a high-pressure injector. In the control group, iodixanol (120 ml) with a concentration controlled at 350 mg I/mL was used, injected at the same rate. Post-scan, the CTA images of the lower extremities were obtained through computer processing.
Image quality evaluation
The image quality was independently evaluated by two experienced radiologists using a five-point scale (1 = poor image quality, 5 = excellent image quality). The evaluation criteria included image clarity, vascular display quality, noise level, signal-to-noise ratio (SNR), and contrast-to-noise ratio (CNR) [9]. In cases of disagreement between the two radiologists, a senior physician independently reviewed the images and provided the final diagnosis.
Contrast agent dosage and tolerance recording
The total amount of contrast agent administered to each patient was recorded, along with their tolerance to the contrast agent. Adverse reactions during and after the examination, such as nausea, rash, dizziness, were documented.
Distribution of stenosis degree and detection rate of moderate-to-severe stenosis
The degree of stenosis (mild stenosis vs. moderate-to-severe stenosis) in all diabetic foot patients was statistically analyzed, with comprehensive diagnostic results used as the standard. The detection rates of moderate-to-severe stenosis in the two groups were compared. The grading criteria for vascular lesion stenosis were as follows: mild stenosis: post-treatment arterial lumen narrowing of less than 30%; moderate stenosis: post-treatment arterial lumen narrowing of 30%-69%; severe stenosis: post-treatment arterial lumen narrowing of 70%-99%.
Statistical methods
Data were processed and analyzed using SPSS 26.0 statistical software. Measured data were expressed as mean ± standard deviation (x̅ ± s) and analyzed using the independent samples t-test. Counted data were expressed as rates or percentages and compared using the χ2 test. A two-tailed test result with P < 0.05 was considered significant.
Results
Comparison of baseline data between the two groups
The research group consisted of 181 patients with an average age of (65.2 ± 7.8) years, including 112 men and 69 women. The control group included 161 patients with an average age of (64.8 ± 8.1) years, including 90 men and 71 women. There were no significant differences between the two groups in terms of gender, age, duration of diabetes, blood glucose control level, or other basic characteristics (all P > 0.05), ensuring comparability of baseline characteristics between the two groups, as shown in Table 1.
Table 1.
Comparison of General Information between the two groups
| Feature | Research group (n = 181) | Control group (n = 161) | χ2/t | P |
|---|---|---|---|---|
| Age (years) | 65.23 ± 7.84 | 64.85 ± 8.12 | 0.440 | 0.660 |
| Gender (n, male/female) | 112/69 | 90/71 | 1.259 | 0.262 |
| Diabetes duration (years) | 10.5 ± 5.4 | 10.2 ± 5.74 | 0.498 | 0.619 |
| Diabetic foot duration (years) | 3.6 ± 1.1 | 3.4 ± 1.3 | 1.541 | 0.124 |
| HbA1c (%) | 8.26 ± 1.46 | 8.11 ± 1.55 | 0.921 | 0.358 |
| BMI (kg/m2) | 27.52 ± 3.27 | 27.32 ± 3.43 | 0.552 | 0.582 |
| Smoking history (%) | 45 (24.9%) | 39 (24.2%) | 0.137 | 0.891 |
| History of hypertension (%) | 120 (66.3%) | 106 (65.8%) | 0.090 | 0.929 |
| History of cardiovascular disease (%) | 55 (30.4%) | 49 (30.4%) | 0.242 | 0.809 |
Note: BMI: Body Mass Index.
Comparison of detection rate and diagnostic effect between the two groups
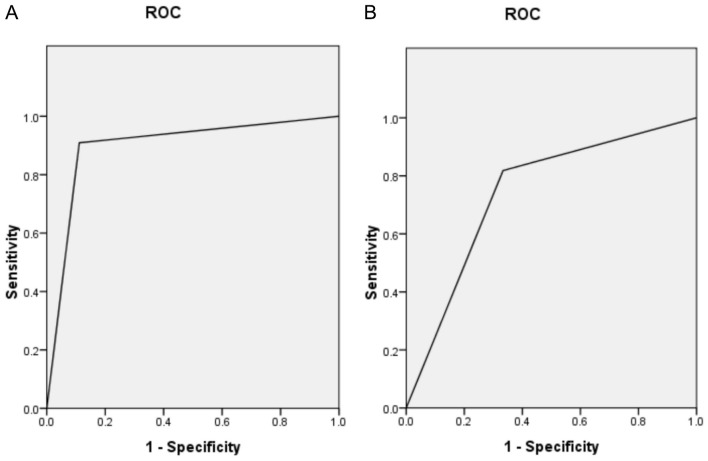
According to the ADA diagnostic guidelines, the gold standard for diagnosis includes clinical presentation, pathological examination, and imaging studies (such as MRI, ultrasound, and CTA). In the research group, the detection rate of diabetic foot was 90.06%, with sensitivity and specificity of 88.39% and 82.61%, respectively. In the control group, the detection rate was 86.96%, with sensitivity and specificity of 85.44% and 75.00%, respectively. There were no significant differences in the detection rate between the two groups (P > 0.05), as shown in Table 2 and Figure 1.
Table 2.
Comparison of detection rates and diagnostic outcomes between the two groups (cases, %)
| Group | n | Number of detected cases (n) | Detection rate (%) | Sensitivity (%) | Specificity (%) |
|---|---|---|---|---|---|
| Research group | 181 | 163 | 90.06 | 88.39 (160/181) | 82.61 (19/23) |
| Control group | 161 | 140 | 86.96 | 85.44 (135/158) | 75.00 (18/24) |
Figure 1.
ROC curves for diabetic foot diagnosis in research group (A) and control group (B).
Comparison of image quality and noise levels between the two groups
There were no significant differences in image quality and vascular CT values between the research group and the control group (all P > 0.05). The research group had slightly higher imaging noise and slightly lower SNR and CNR compared to the control group, but these differences were not significant (all P > 0.05), as shown in Table 3.
Table 3.
Comparison of image quality and noise levels between the two groups (x̅±s)
| Group | n | Image quality (Score) | Vascular CT value (HU) | Image noise (HU) | SNR (HU) | CNR (HU) |
|---|---|---|---|---|---|---|
| Research group | 181 | 4.27 ± 0.64 | 380.54 ± 22.24 | 22.24 ± 2.52 | 17.32 ± 1.95 | 15.84 ± 1.75 |
| Control group | 161 | 4.10 ± 0.55 | 384.48 ± 23.42 | 21.96 ± 2.34 | 17.62 ± 1.84 | 16.13 ± 1.60 |
| t | 2.618 | 1.595 | 1.061 | 1.458 | 1.592 | |
| P | 0.009 | 0.112 | 0.290 | 0.146 | 0.112 |
Note: SNR: signal-to-noise ratio; CNR: contrast-to-noise ratio.
Comparison of radiation dose and contrast agent usage between the two groups
The CTDIvol, ED, and iodine dose in the research group were significantly lower than those in the control group (all P < 0.05), as shown in Table 4.
Table 4.
Comparison of radiation dose and contrast agent use between the two groups (x̅±s)
| Group | n | CTD (mGy) | ED (mSy) | Iodine Intake (g) |
|---|---|---|---|---|
| Research group | 181 | 6.54 ± 1.24 | 3.51 ± 0.35 | 6.38 ± 1.36 |
| Control group | 161 | 9.22 ± 1.50 | 5.11 ± 0.43 | 8.56 ± 1.27 |
| t | 18.077 | 37.899 | 15.263 | |
| P | 0.000 | 0.000 | 0.000 |
Note: CTDIvol: volume computed tomography dose index; ED: effective dose.
Comparison of patient tolerance and adverse reactions between the two groups
Patients in the research group had better tolerance to the contrast agent, with a rate of mild adverse reactions (such as nausea and slight rash) of 8.29%, and no severe allergic reactions were reported. In contrast, the control group had a mild adverse reaction rate of 14.91%. The incidence of adverse reactions in the research group was significantly lower than that in the control group (P < 0.05), as shown in Figure 2.
Figure 2.
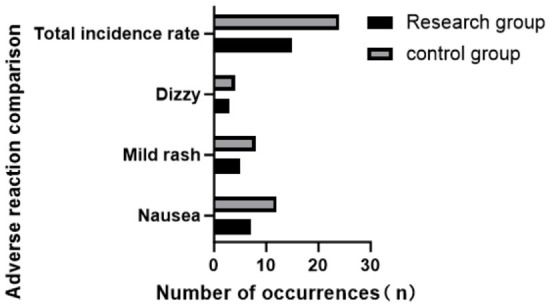
Comparison of adverse reactions between the two groups.
Comparison of the distribution and detection rates of mild and moderate-to-severe stenosis between the two groups
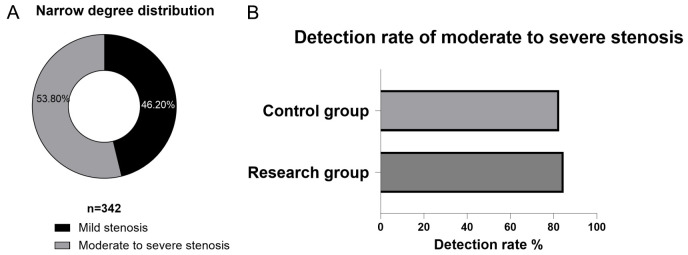
Among diabetic foot patients, 46.20% had mild stenosis, while 53.80% had moderate-to-severe stenosis. The detection rate of moderate-to-severe stenosis in the research group was 84.67% (138/163), compared to 82.86% (116/140) in the control group (P > 0.05), as shown in Figure 3.
Figure 3.
Distribution of stenosis degree in diabetic foot patients (A) and comparison of detection rates of moderate-to-severe stenosis between the two groups (B).
The ROC curve results are shown in Figure 4, indicating good diagnostic accuracy for both groups (AUC of 0.690 for the research group and 0.783 for the control group). However, there was no significant difference between the two groups (P > 0.05).
Figure 4.
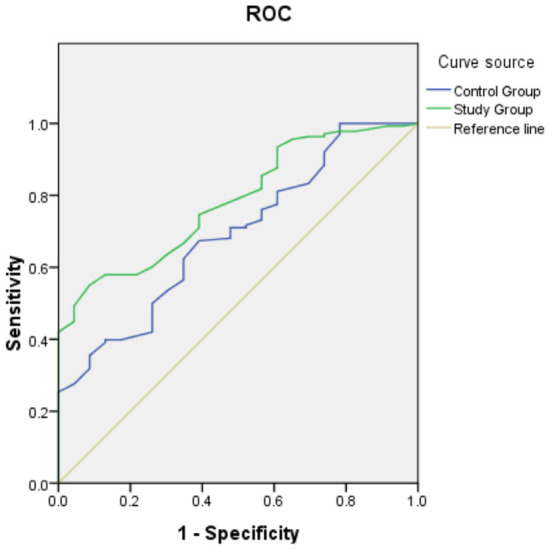
ROC curves for diagnosing moderate-to-severe stenosis in both groups.
Typical cases
Figure 5 shows the CTA images of lower extremities in diabetic foot patients using conventional-dose and low-dose scanning technologies combined with low-concentration contrast agents. Patient A (70 years old, male, low dose, mild stenosis): The images are complete and clear, with the mild stenosis area distinctly visible. Patient B (72 years old, male, conventional dose, moderate stenosis): The images show small vessel structures and moderate stenosis. Patient C (78 years old, male, conventional dose, localized occlusion): The images display the localized occlusion area clearly, showing the occlusion site. Patient D (83 years old, female, low dose, moderate stenosis): The images demonstrate good vascular enhancement and detailed presentation of moderate stenosis.
Figure 5.
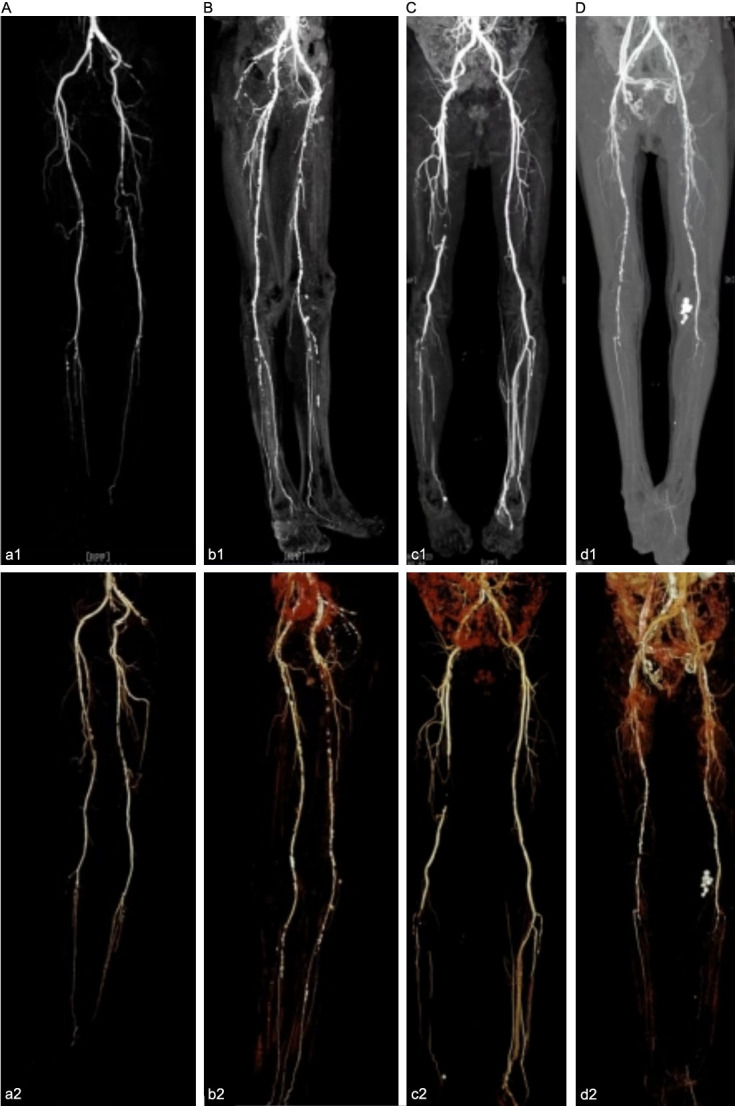
Typical CTA images of lower extremities in diabetic foot patients (A-D) using conventional dose and low-dose scanning technology with low-concentration contrast agents. Note: a1~a2: low dose, b1~b2: conventional dose, c1~c2: conventional dose, d1~d2: low dose.
Discussion
Diabetic foot is a chronic complication of prolonged hyperglycemia, often accompanied by lower limb arterial sclerosis and vascular stenosis, which can lead to severe consequences such as foot ulcers and amputation [10]. Early and accurate diagnosis of vascular lesions in diabetic foot is crucial for preventing serious complications. Traditional lower limb CTA exams typically use standard doses of contrast agents and radiation, which may increase patients’ exposure to radiation and elevate the risk of contrast-related adverse reactions [11,12]. The application of 128-slice CT low-dose scanning technology combined with low-concentration contrast agents holds promise for reducing these risks while maintaining diagnostic accuracy. This study aimed to evaluate the effectiveness and safety of this optimized approach in lower limb CTA for diabetic foot patients.
The results of this study indicate that the research group using 128-slice CT low-dose scanning technology combined with low-concentration contrast agents had a high detection rate for diabetic foot, with good sensitivity and specificity. Although there was no significant difference in detection rates between the two groups, the research group showed slightly higher sensitivity and specificity, suggesting that low-dose scanning technology combined with low-concentration contrast agents can effectively detect diabetic foot while maintaining diagnostic accuracy. A study found that compared to traditional high-dose scanning technology, low-dose CT scanning combined with low-concentration contrast agents has similar sensitivity and specificity for diagnosing peripheral vascular lesions, while significantly reducing radiation exposure and contrast agent usage [13]. This is consistent with our findings, likely because low-concentration contrast agents can provide adequate contrast while reducing the dose, thereby maintaining image clarity and accuracy [14].
In terms of safety, there were no significant differences in image quality or vascular CT values between the research and control groups. While the research group exhibited slightly higher image noise and lower SNR and CNR, these differences were not statistically significant. This suggests that low-dose scanning technology does not significantly increase noise or reduce contrast-to-noise ratio, while still ensuring good image quality. This may be attributed to advanced image reconstruction algorithms that effectively reduce noise and enhance image clarity and contrast [15-17]. Additionally, the research group had significantly lower CTDIvol, ED, and iodine intake compared to the control group, indicating that low-dose scanning technology significantly reduces patient exposure to radiation and contrast agents. The 128-slice CT low-dose scanning technology significantly reduces CTDIvol and ED through optimized scanning parameters (e.g., lower tube voltage and iterative reconstruction algorithms) and efficient detector technology [18,19]. This not only reduces the risk of radiation exposure but also lowers the potential long-term health risks associated with radiation. Moreover, using low-concentration contrast agents reduces iodine usage while maintaining image contrast. The optimized injection protocol ensures uniform distribution of the contrast agent in the vessels, further reducing the burden on kidneys and other organs and decreasing the risk of adverse reactions [20]. Since contrast agents have been associated with the risk of acute renal injury [21], it is noteworthy that this study found no severe allergic reactions in either group. Additionally, the research group demonstrated better tolerance, with a significantly lower incidence of mild adverse reactions compared to the control group, further demonstrating the safety and tolerance of 128-slice CT low-dose scanning technology combined with low-concentration contrast agents. The safety advantages of this technology are mainly due to its effective reduction of radiation exposure and contrast agent usage while maintaining high image quality and patient tolerance.
The study also analyzed the degree of stenosis in diabetic foot patients. Vascular stenosis is one of the main pathological changes in diabetic foot patients, and early detection and accurate assessment of stenosis are crucial for preventing and treating severe outcomes of diabetic foot [22,23]. The results showed that in the detection of moderate-to-severe stenosis, the research group demonstrated a detection rate of 84.67%, compared to 82.86% in the control group. Although there was no statistical difference between the two groups, the slightly higher detection rate in research group may be due to the ability of low-dose scanning technology to more precisely display vascular structures and stenosis while maintaining image quality, thus improving the detection rate of stenosis [24,25]. This also indicates that 128-slice CT low-dose scanning technology is effective in detecting various degrees of stenosis.
Conclusions
The 128-slice CT low-dose scanning technology combined with low-concentration contrast agents demonstrates good effectiveness and safety in lower limb CTA for diabetic foot patients. This approach not only reduces patients’ exposure to contrast agents and potential complications but also maintains diagnostic accuracy. This technology is likely to be the preferred option for vascular assessment in diabetic foot patients, providing a safer and more effective diagnostic tool for clinical practice. However, this study has limitations. First, the retrospective design may have introduced selection bias, as patients were not fully randomized into groups. Second, despite the inclusion of a scoring mechanism by three doctors to address subjectivity, physician judgment may have influenced the final scores. Additionally, since this study was conducted at a single center, the external validity of the results may be limited. Future research should consider multi-center, large-scale prospective designs to further validate the application of 128-slice CT low-dose scanning technology combined with low-concentration contrast agents in diabetic foot patients.
Acknowledgements
This study was supported by the Xi’an Science and Technology Plan Project (2023JH-YXYB-0329).
Disclosure of conflict of interest
None.
References
- 1.Saeedi P, Petersohn I, Salpea P, Malanda B, Karuranga S, Unwin N, Colagiuri S, Guariguata L, Motala AA, Ogurtsova K, Shaw JE, Bright D, Williams R IDF Diabetes Atlas Committee. Global and regional diabetes prevalence estimates for 2019 and projections for 2030 and 2045: results from the International Diabetes Federation Diabetes Atlas, 9(th) edition. Diabetes Res Clin Pract. 2019;157:107843. doi: 10.1016/j.diabres.2019.107843. [DOI] [PubMed] [Google Scholar]
- 2.Cloete L. Diabetes mellitus: an overview of the types, symptoms, complications and management. Nurs Stand. 2022;37:61–66. doi: 10.7748/ns.2021.e11709. [DOI] [PubMed] [Google Scholar]
- 3.Kolarić V, Svirčević V, Bijuk R, Zupančič V. Chronic complications of diabetes and quality of life. Acta Clin Croat. 2022;61:520–527. doi: 10.20471/acc.2022.61.03.18. [DOI] [PMC free article] [PubMed] [Google Scholar]
- 4.Li X, Wen S, Dong M, Yuan Y, Gong M, Wang C, Yuan X, Jin J, Zhou M, Zhou L. The metabolic characteristics of patients at the risk for diabetic foot ulcer: a comparative study of diabetic patients with and without diabetic foot. Diabetes Metab Syndr Obes. 2023;16:3197–3211. doi: 10.2147/DMSO.S430426. [DOI] [PMC free article] [PubMed] [Google Scholar]
- 5.Betoko A, Matheson MB, Ostovaneh MR, Miller JM, Brinker J, Cox C, Lima JAC, Arbab-Zadeh A. Acute kidney injury after repeated exposure to contrast material for coronary angiography. Mayo Clin Proc Innov Qual Outcomes. 2021;5:46–54. doi: 10.1016/j.mayocpiqo.2020.08.012. [DOI] [PMC free article] [PubMed] [Google Scholar]
- 6.Yoon JH, Park JY, Lee SM, Lee ES, Kim JH, Lee JM. Renal protection CT protocol using low-dose and low-concentration iodine contrast medium in at-risk patients of HCC and with chronic kidney disease: a randomized controlled non-inferiority trial. Cancer Imaging. 2023;23:100. doi: 10.1186/s40644-023-00616-0. [DOI] [PMC free article] [PubMed] [Google Scholar]
- 7.Gucun M, Kahyaoglu M, Celik M, Guner A, Akyuz O, Yilmaz Y. Predictive value of post-procedural hyponatremia on contrast-induced nephropathy in patients who underwent coronary angiography or percutaneous coronary intervention. Acta Cardiol. 2022;77:215–221. doi: 10.1080/00015385.2021.1901022. [DOI] [PubMed] [Google Scholar]
- 8.Holt RIG, DeVries JH, Hess-Fischl A, Hirsch IB, Kirkman MS, Klupa T, Ludwig B, Nørgaard K, Pettus J, Renard E, Skyler JS, Snoek FJ, Weinstock RS, Peters AL. The management of type 1 diabetes in adults. A consensus report by the American Diabetes Association (ADA) and the European Association for the Study of Diabetes (EASD) Diabetologia. 2021;64:2609–2652. doi: 10.1007/s00125-021-05568-3. [DOI] [PMC free article] [PubMed] [Google Scholar]
- 9.Senneville É, Albalawi Z, van Asten SA, Abbas ZG, Allison G, Aragón-Sánchez J, Embil JM, Lavery LA, Alhasan M, Oz O, Uçkay I, Urbančič-Rovan V, Xu ZR, Peters EJG. Diagnosis of infection in the foot of patients with diabetes: a systematic review. Diabetes Metab Res Rev. 2024;40:e3723. doi: 10.1002/dmrr.3723. [DOI] [PubMed] [Google Scholar]
- 10.Wu B, Niu Z, Hu F. Study on risk factors of peripheral neuropathy in type 2 diabetes mellitus and establishment of prediction model. Diabetes Metab J. 2021;45:526–538. doi: 10.4093/dmj.2020.0100. [DOI] [PMC free article] [PubMed] [Google Scholar]
- 11.Joseph TI, Ratnakanthan PJ, Paul E, Clements W. Utility of computed tomography angiography in traumatic lower limb injury: review of clinical impact in level 1 trauma centre. Injury. 2021;52:3064–3067. doi: 10.1016/j.injury.2021.02.047. [DOI] [PubMed] [Google Scholar]
- 12.Kristiansen CH, Thomas O, Tran TT, Roy S, Hykkerud DL, Sanderud A, Geitung JT, Lauritzen PM. Halved contrast medium dose in lower limb dual-energy computed tomography angiography-a randomized controlled trial. Eur Radiol. 2023;33:6033–6044. doi: 10.1007/s00330-023-09575-3. [DOI] [PMC free article] [PubMed] [Google Scholar]
- 13.Li J, Wang YH, Zheng FL, Chen XY, Lin Y, Zhu CR, Wu YF, Xu Q, Jin ZY, Xue HD. Feasibility of utilizing ultra-low-dose contrast medium for pancreatic artery depiction using the combination of advanced virtual monoenergetic imaging and high-concentration contrast medium: an intra-patient study. Insights Imaging. 2021;12:166. doi: 10.1186/s13244-021-01079-2. [DOI] [PMC free article] [PubMed] [Google Scholar]
- 14.Chang S, Jung JI, Beck KS. Low tube voltage chest computed tomography with enhancement using low-concentration iodinated contrast media: comparison of 240 mg/ml versus 300 mg/ml iodinated contrast media. Can Assoc Radiol J. 2023;74:127–136. doi: 10.1177/08465371221102631. [DOI] [PubMed] [Google Scholar]
- 15.Im DJ, Kim YH, Choo KS, Kang JW, Jung JI, Won Y, Kim HR, Chung MH, Han K, Choi BW. Comparison of coronary computed tomography angiography image quality with high-concentration and low-concentration contrast agents: the randomized CONCENTRATE trial. J Thorac Imaging. 2023;38:120–127. doi: 10.1097/RTI.0000000000000633. [DOI] [PubMed] [Google Scholar]
- 16.Kim J, Kim JY, Oh SW, Kim HG. Evaluating the image quality of neck structures scanned on chest CT with low-concentration-iodine contrast media. Tomography. 2022;8:2854–2863. doi: 10.3390/tomography8060239. [DOI] [PMC free article] [PubMed] [Google Scholar]
- 17.Miyoshi K, Onoda H, Tanabe M, Nakao S, Higashi M, Iida E, Okada M, Furukawa M, Ito K. Image quality in dual-source multiphasic dynamic computed tomography of the abdomen: evaluating the effects of a low tube voltage (70 kVp) in combination with contrast dose reduction. Abdom Radiol (NY) 2020;45:3755–3762. doi: 10.1007/s00261-020-02565-9. [DOI] [PubMed] [Google Scholar]
- 18.Park MS, Ha HI, Ahn JH, Lee IJ, Lim HK. Reducing contrast-agent volume and radiation dose in CT with 90-kVp tube voltage, high tube current modulation, and advanced iteration algorithm. PLoS One. 2023;18:e0287214. doi: 10.1371/journal.pone.0287214. [DOI] [PMC free article] [PubMed] [Google Scholar]
- 19.Baumeister T, Kloth C, Schmidt SA, Kloempken S, Brunner H, Buckert D, Bernhardt P, Panknin C, Beer M. On-site CT-derived cFFR in patients with suspected coronary artery disease: feasibility on a 128-row CT scanner in everyday clinical practice. Rofo. 2024;196:62–71. doi: 10.1055/a-2142-1643. [DOI] [PubMed] [Google Scholar]
- 20.Haris Á, Mátyus J. Occurrence and prevention of iodinated contrast agent-induced kidney injury in light of the newest literature data: time to change our clinical practice! Orv Hetil. 2022;163:83–91. doi: 10.1556/650.2022.32364. [DOI] [PubMed] [Google Scholar]
- 21.Gucun M, Isik ME. Contrast-induced acute kidney injury in COVID-19 patients. Bratisl Lek Listy. 2021;122:643–646. doi: 10.4149/BLL_2021_103. [DOI] [PubMed] [Google Scholar]
- 22.Andreini D, Mushtaq S, Conte E, Segurini C, Guglielmo M, Petullà M, Volpato V, Annoni A, Baggiano A, Formenti A, Bartorelli AL, Fiorentini C, Pepi M. Coronary CT angiography with 80 kV tube voltage and low iodine concentration contrast agent in patients with low body weight. J Cardiovasc Comput Tomogr. 2016;10:322–326. doi: 10.1016/j.jcct.2016.06.003. [DOI] [PubMed] [Google Scholar]
- 23.Truong VT, Choo J, McCoy L, Mussman A, Ambach S, Kereiakes D, Sarembock I, Mazur W. Low-volume contrast CT angiography via pulmonary artery injection for measurement of aortic annulus in patients undergoing transcatheter aortic valve replacement. J Invasive Cardiol. 2017;29:181–186. [PubMed] [Google Scholar]
- 24.Hinkmann FM, Voit HL, Anders K, Baum U, Seidensticker P, Bautz WA, Lell MM. Ultra-fast carotid CT-angiography: low versus standard volume contrast material protocol for a 128-slice CT-system. Invest Radiol. 2009;44:257–264. doi: 10.1097/RLI.0b013e31819b08a0. [DOI] [PubMed] [Google Scholar]
- 25.Zorger N, Jung EM, Hamer OW, Paetzel C, Schreyer A, Seitz J, Stehr A, Steinbauer M, Feuerbach S, Herold T. Intraarterial gadolinium-enhanced magnetic resonance angiography of the renal arteries in humans: feasibility, contrast agent reduction, and accuracy for detection of stenoses. Clin Hemorheol Microcirc. 2008;38:97–104. [PubMed] [Google Scholar]


