Abstract
Translational control is an essential process in regulation of gene expression, which occurs at the initiation step performed by a number of translation initiation factor complexes. eIF3a (eIF3 p170) is the largest subunit of the eIF3 complex. eIF3a has been suggested to play roles in regulating translation of a subset of mRNAs and in regulating cell cycle progression and cell proliferation. In this study, we examined the expression profile of eIF3a in cell cycle and its role in cell cycle progression. We found that eIF3a expression oscillated with cell cycle and peaked in S phase. Reducing eIF3a expression also reduced cell proliferation rate by elongating cell cycle but did not change the cell cycle distribution. However, eIF3a appears to play an important role in cellular responses to external cell cycle modulators likely by affecting synthesis of target proteins of these modulators.
Keywords: eIF3a, eIF3 p170, Cell cycle, Modulators, Translational control
Introduction
Translational control of mRNAs is one of the major regulations of gene expression and it occurs mainly at the translation initiation, the speed-limiting step of protein synthesis. In eukaryotes, there are at least 12 translation initiation factor complexes (eIFs) involved in this complicated procedure [1]. One of these factors, eIF3, is the most complex one with a molecular weight of about 550–700 kDa, consisting of 13 putative subunits known as eIF3a through eIF3m [1,2].
eIF3a (also called eIF3 p170) is the largest and thought to be the major subunit of eIF3 complex initially purified from rabbit reticulocyte lysate [3]. However, its functional importance in translational control and role in the eIF3 complex still remain to be determined. The finding that eIF3a interacts with other subunits of eIF3 [4,5], eIF4B [6], and RNA [5,7] supports a role of eIF3a in the function of the eIF3 complex and in translation initiation. It has also been observed that eIF3 preparations relatively rich in eIF3a did not differ substantially in specific activity of stimulating formation of pre-initiation complexes from preparations that essentially lacked this protein [8], suggesting that eIF3a may have other functions in regulating mRNA translation by binding to other components of the eIF3 complex. Indeed, we recently found that eIF3a regulates the translation of tyrosinated α-tubulin, ribonucleotide reductase M2, and p27 [9,10]. Interestingly, the effect of eIF3a on the translation of p27, tyrosinated α-tubulin, and ribonucleotide reductase M2 are different. Thus, it is possible that the eIF3 complexes with and without eIF3a subunit may be responsible for the translation of different subsets of mRNAs.
The expression of eIF3a is significantly elevated in several human cancers including breast [11], cervix [12], esophagus [13], stomach [14], and colon (Dong et al., unpublished observations), suggesting that eIF3a may be needed for the malignant growth of tumors. Indeed, knocking down the expression of eIF3a in both breast and lung cancer cell lines reversed the malignant phenotype of these cells [9]. Furthermore, eIF3a has been suggested to be essential for G1-S phase transition in yeast and it may be involved in growth control of yeast cells [15].
Together, these previous findings suggest that eIF3a may be involved in the regulation of cell growth, proliferation and cell cycle progression. In the present study, we investigated the role of mammalian eIF3a in cell cycle control and found that its expression oscillates with cell cycle and peaks in S phase. Down regulating eIF3a expression increased the doubling time without altering cell cycle distribution but changed the sensitivity of cells to environmental stresses that affect cell cycle.
Materials and methods
Materials
Antibodies against actin and GAPDH were from Sigma (ST. Louis, MO) and Abcam (Cambridge, MA), respectively. [3H]thymidine, Hoechst 33342, and the enhanced chemiluminescence (ECL) system for Western blot analysis were from ICN, Invitrogene (Carlsbad, CA) and Amersham Biosciences (Piscataway, NJ), respectively. Sequi-Blot polyvinylidene membrane and concentrated protein assay dye reagents were from Bio-Rad (Hercules, CA). All other reagents were of molecular biology grade and obtained from Sigma or Fisher Scientific (Chicago, IL).
Cell lines, culture, treatment and cell growth rate
NIH3T3 cells were cultured in DMEM containing 10% calf serum and maintained in a humidified atmosphere with 10% CO2 at 37 °C. H1299 was maintained in RPMI 1640 supplemented with 10% fetal bovine serum in a humidified incubator at 37 °C with 5% CO2. The H1299 cells stably-transfected with antisense cDNA of eIF3a or vector control, HAS4, HAS5 and HVec, were cultured in RPMI1640 plus 10% fetal bovine serum and 100 mg/ml Zeocin.
Starvation, synchronization and treatment were performed by plating 6×10⁵ cells in 10-cm dishes. The cells were allowed to grow for three days in complete medium and the medium was then replaced with that containing 0.1% fetal bovine serum for starvation and synchronization or with fresh complete medium containing mimosine, hydroxyurea, or nocodazole for treatment. Cell growth rate was performed exactly as previously described [9].
Real-Time RT-PCR
Real-Time RT-PCR was performed as described previously [16]. Briefly, total RNAs were extracted using RNeasy Mini Kit (Qiagen). 1 μg of the total RNAs was reverse transcribed to synthesize cDNA using iScriptTM cDNA Synthesis Kit (Bio-Rad). The PCRs were carried out in ABI Prism@7000 Sequence Detection System (Applied Biosystems) using SYBR Green diction according to the manufacturer’s instructions. The primers used for eIF3a are 5′-AGATGAGGACAGAGGACCTAGAC-3′ (forward) and 5′-TCAGCATTCCGCCAGGATGA-3′ (reverse) and the primers used for GAPDH control are 5′-AAGGACTCATGACCACAGTCCAT-3′ (forward) and 5′-CCATCACGCCACAGTTTTC-3′ (reverse). The threshold cycle (Ct) was defined as the PCR cycle number at which the reporter fluorescence crosses the threshold reflecting a statistically significant point above the calculated baseline. The Ct of eIF3a was determined and normalized against that of GAPDH internal control. The relative RNA level=2ΔCt.
Cell cycle analysis, metabolic labeling and sorting
Cell cycle analysis was performed as previously described [10]. Briefly, cells were harvested and washed twice with phosphate-buffered saline (PBS) followed by fixation in 80% ethanol for 30 min at room temperature. The cells were then collected by centrifugation and stained with 50 μg/μl propidium iodide. The cells were then treated with 100 μg/μl RNase for 15 min at 37 °C followed by analysis using a FACScan flow cytometer. Cell cycle distribution was analyzed with the Modfit LT program.
[3H]thymidine labeling was performed by growing 1×10⁵ cells/well in a 24-well plate in triplicates for 24 h followed by serum starvation/synchronization for 48 h as described above. The synchronized cells were then released into cell cycle progression by replacing with fresh complete medium and were pulse-labeled for 1 h with 3 mCi/ml [3H]thymidine (60 Ci/mmol) at different time points. The cells were then harvested, counted, and precipitated with 10% TCA. The acid-insoluble material was collected on a filter by rapid filtration and the radioactivity was determined by scintillation counting.
Cell sorting was performed as previously described [17]. Briefly, 5×10⁷ cells were washed twice with Hst buffer consisting of Hanks Balanced Salt Solution, 20 mM HEPES (pH 7.2), 1 g/l glucose and 10% fetal bovine serum. After washing, the cells were stained in Hst buffer containing 1.67 μM Hst at 37 °C for 1 h. The cells were then washed twice and resuspended in 2 ml Hst buffer. Cell sorting was performed on a Becton-Dickinson FACSstarplus equipped with a 6 W argon-ion laser emitting 50 mW of ultraviolet (UV 351–356 nm) light. Cells were sorted and collected into three fractions of G0/G1, S and G2/M phase based on the Hoechst 33342 staining intensity. Each fraction was then re-tested to confirm cell cycle and used for preparation of cell lysate and western blot analysis.
Sample preparation and western blot analyses
Sample preparation and western blot analyses were performed as described previously [10]. Briefly, cell lysates were prepared by lysis of cells with TNN-SDS buffer (50 mM Tris–HCl, pH 7.5, 150 mM NaCl, 0.5% Nonidet P-40, 50 mM NaF, 1 mM sodium orthovanadate, 1 mM DTT, 0.1% SDS and 2 mM phenylmethylsulfonyl fluoride) at 4 °C for 30 min followed by centrifugation (10,000 g for 10 min at 4 °C) for clearance and protein concentration measurement using Bradford method [18]. The cell lysates were separated by 8% SDS-PAGE and transferred to a PVDF membrane. The blot was then probed with affinity-purified polyclonal antibody AbD (1:1000 dilution) and actin or GAPDH-specific monoclonal antibodies (1:3000 dilution).
Results
EIF3a expression oscillates with cell cycle and peaks in S phase
To investigate the relationship between eIF3a expression and cell cycle progression, we first determined if eIF3a expression changed after arresting cells in G0/G1 by serum starvation. As shown in Fig. 1, over 92% NIH3T3 cells accumulated in G0/G1 with a decrease in population of cells in S and G2/M phases following serum starvation for 48 h. Interestingly, eIF3a expression drastically decreased following serum starvation, but the expression level of other subunits of eIF3 (eIF3b and eIF3d) decreased little or had no change compared with eIF3a. These results suggest that eIF3a expression may be low in G0/G1 phase but higher in S and/or G2/M phases.
Fig. 1 –
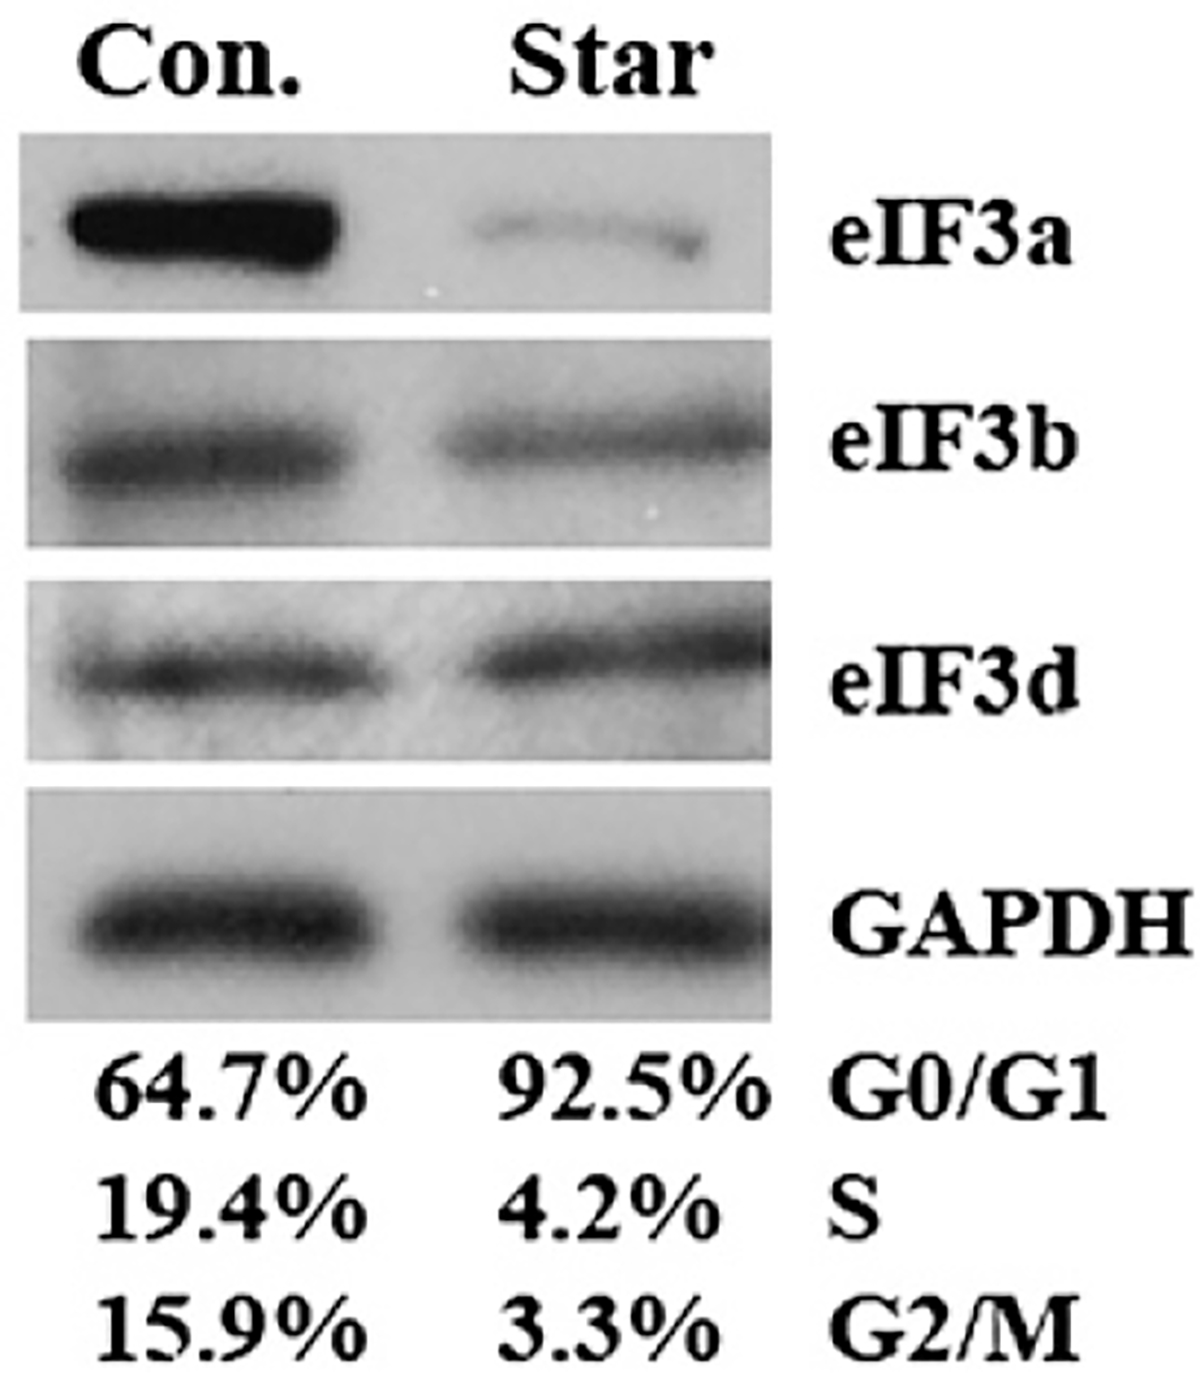
Effect of serum starvation on expression of eIF3a, eIF3b and eIF3d. NIH3T3 cells were cultured in the presence or absence of serum for 48 h followed by collection of cells for analysis of cell cycle distribution or western blot analysis of the expression of eIF3a, eIF3b and eIF3d with GAPDH as a loading control.
To further delineate eIF3a expression profile in cell cycle progression, we synchronized NIH3T3 cells using serum starvation and then released them into cell cycle progression by adding fresh complete medium. Cells were then harvested at different time points after releasing into cell cycle progression for analysis of cell cycle distribution and eIF3a expression. As shown in Figs. 2A and B, majority of cells reached S phase at 16 h after release of starvation as determined using FACS analysis and [3H] thymidine incorporation. The expression of eIF3a, however, appears to be low throughout the time course of release but with a peak at 16 h or S phase as determined by western blot (Fig. 2C). The mRNA level of eIF3a also increased at 16 h (S phase) after release of starvation as determine using Real-Time RT-PCR (Fig. 2D), consistent with the increased protein level of eIF3a in S phase.
Fig. 2 –
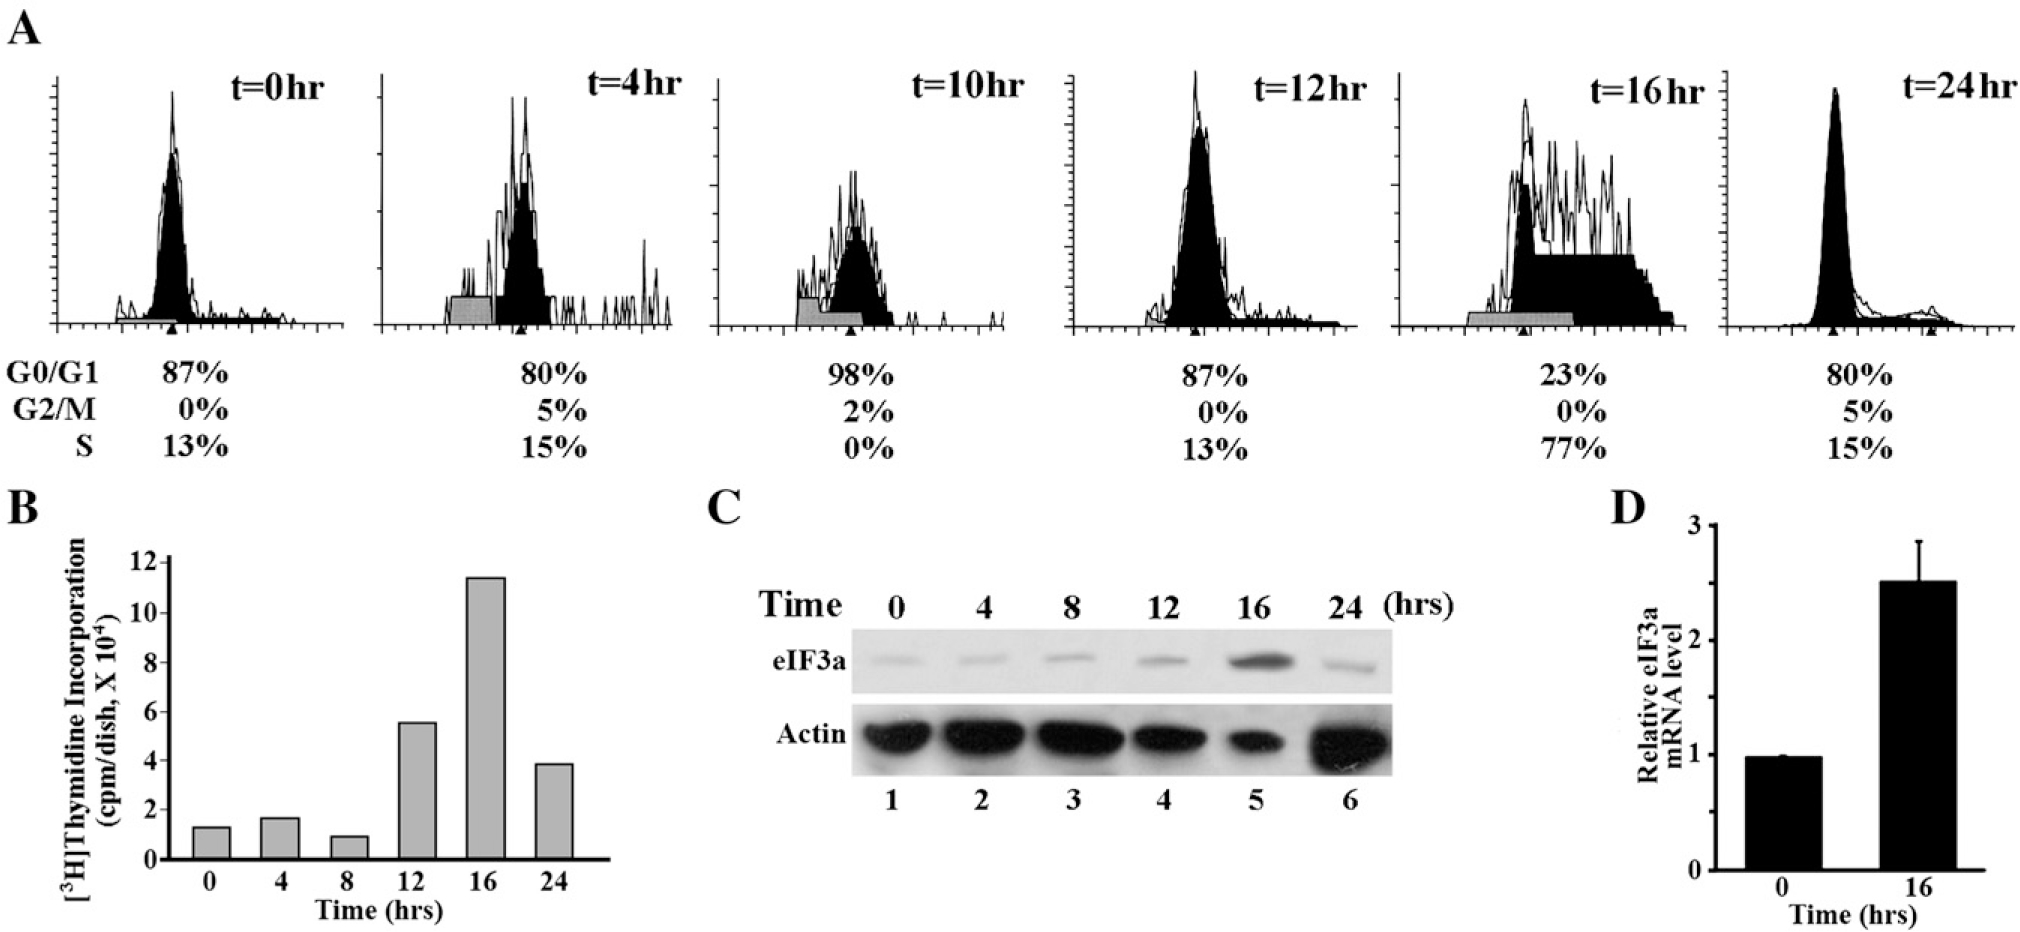
Synchronization study of NIH 3T3 cells. NIH 3T3 cells were synchronized by serum starvation for 48 h and then released by adding fresh complete medium. Cells were harvested at different time point for analysis of cell cycle distribution (A), 3H-thymidine incorporation (B), western blot analysis of eIF3a with actin as a loading control (C), and Real-Time RT-PCR analysis of eIF3a mRNA level (D).
To eliminate the possible effect of serum starvation on eIF3a expression, we sorted untreated NIH3T3 cells into different stages of cell cycle using Hoechst 33342 stain and then analyzed eIF3a expression as well as distribution of sorted cells in different cycle stages. As shown in Fig. 3A, each collected fraction indeed consists of majority of cells for the designated cell cycle stage and eIF3a expression again appears to be higher in the fraction of S phase cells compared with cells in fractions containing mostly G0/G1 or G2/M phases. Similar results were also observed with human lung cancer cell line H1299 following sorting of cells with different cycle stages (Fig. 3B). Taken together, these results suggest that eIF3a expression oscillates with cell cycle and is high in S phase but low in G0/G1 and G2/M phases.
Fig. 3 –
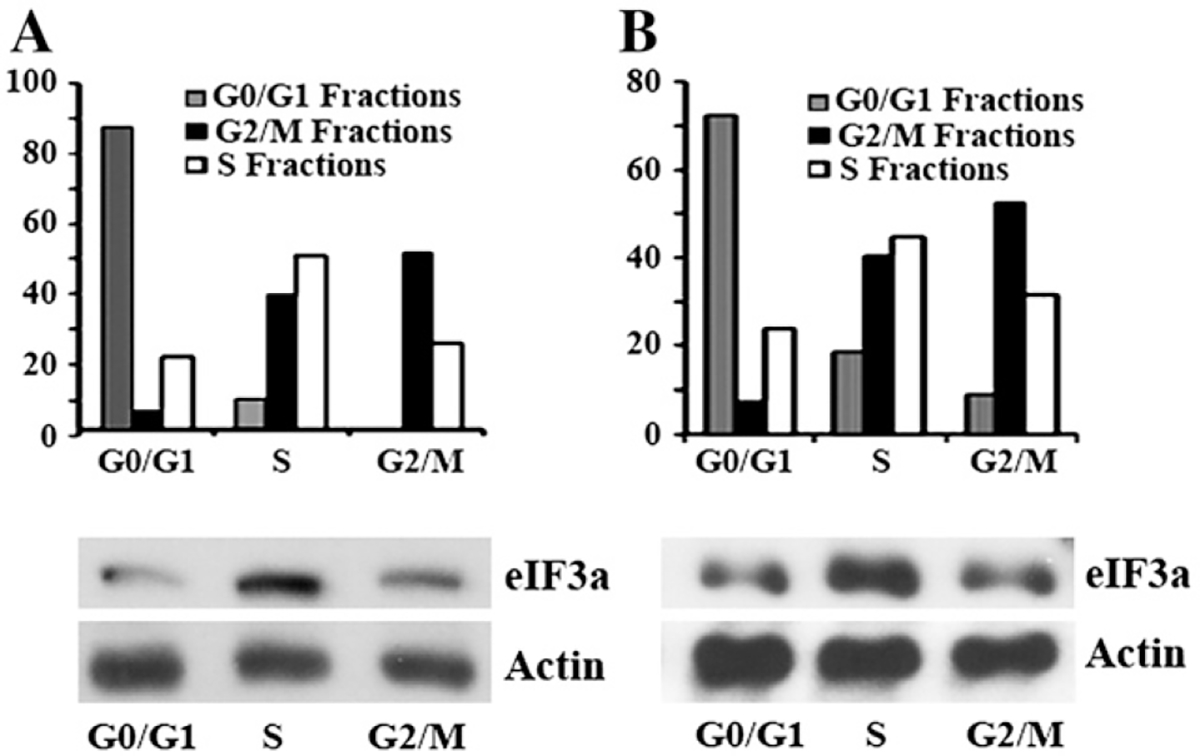
The expression level of eIF3a in isolated cells at G0/G1, S, and G2/M phases. NIH 3T3 (A) and H1299 (B) cells were stained with Hoechst 33342 and sorted to fractionate cells at G0/G1, S and G2/M phases. The collected cells were then analyzed again using propidium iodide staining to confirm their cell cycle distribution followed by western blot analysis of eIF3a expression with actin as a loading control.
Change in eIF3a expression alone does not affect cell cycle distribution
Previously, we observed that mimosine, a plant non-protein amino acid that can arrest cells in G1 phase, could decrease eIF3a expression in HeLa cells prior to G0/G1 cell cycle arrest [10], suggesting that eIF3a may mediate the effect of mimosine on cell cycle. To confirm this finding, we treated H1299 cell line with mimosine for 8 or 48 h and analyzed cell cycle distribution and eIF3a expression. As shown in Fig. 4, eIF3a expression was decreased at both time points. However, the cell cycle distribution changed only after 48 h treatment with mimosine. Treating NIH3T3 cells with mimosine for 8 h also decreased eIF3a expression without altering cell cycle distribution (data not shown). Thus, it is possible that eIF3a expression may play a role in cell cycle regulation.
Fig. 4 –
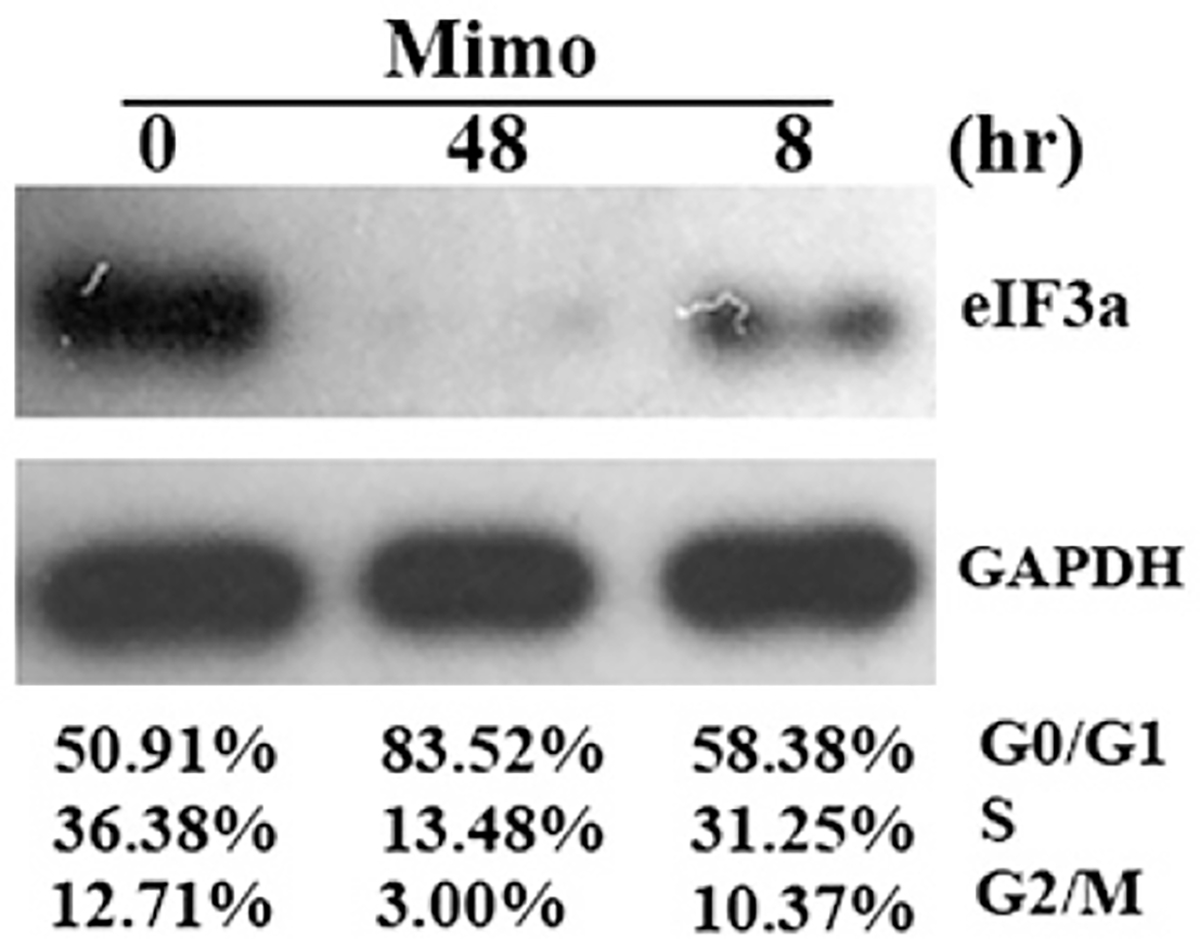
The effect of mimosine on eIF3a expression and cell cycle distribution. H1299 cells were treated with mimosine for 8 or 48 h followed by analysis of cell cycle distribution and western blot analysis of eIF3a expression with GAPDH as a loading control.
To test this possibility, we took use of the H1299 cells with stable knock down of eIF3a expression established previously [9] and tested the cell cycle distribution. Fig. 5A shows that the eIF3a expression level was drastically decreased by its antisense cDNA in the two stable clones, HAS4 and HAS5, compared with the vector-transfected control cells. This decrease in eIF3a expression also significantly slowed down the growth of these cells (Fig. 5B). Thus, down regulating eIF3a expression slows down the cell cycle progression. However, as shown in Fig. 5C, knocking down eIF3a expression did not affect cell cycle distribution. Thus, the decreased eIF3a expression likely extended each stage of the cell cycle equally without any effect on cell cycle distribution.
Fig. 5 –
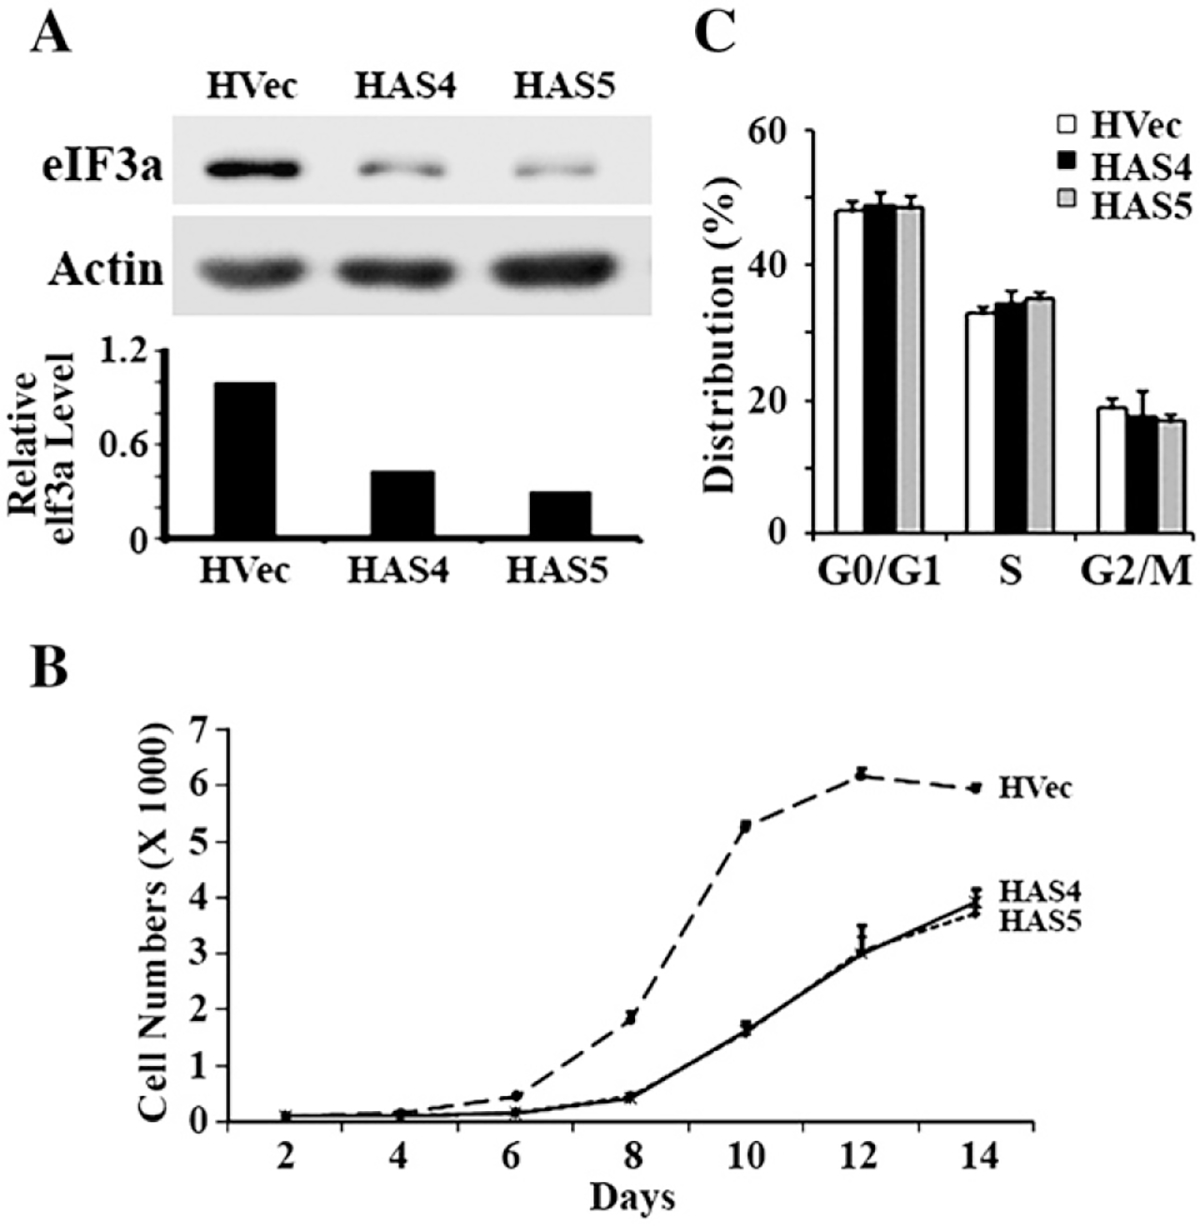
The effect of reducing eIF3a expression on cell cycle distribution. Two stable H1299 cell clones transfected with antisense cDNA of eIF3a (HAS4 and HAS5) together with vector-transfected clones (HVec) were used to test the expression level of eIF3a using western blot analysis with actin as a loading control (A), growth rate (B), and cell cycle distribution (C) using methods as described in Materials and methods.
Effect of eIF3a expression on cellular responses to cell cycle modulators
To determine if eIF3a plays any role in modulator-mediated cell cycle changes, we used the stable clones that have down regulated level of eIF3a in comparison with control cell clones transfected with vector. We first tested if serum starvation-induced G0/G1 arrest is affected by reduced eIF3a expression. As shown in Fig. 6, there is no difference in cell cycle distribution between the vector-transfected control cell line (HVec) and the stable clones with reduced eIF3a expression (HAS4 and HAS5) in the control culture with complete medium. However, compared with HVec cells, HAS4 and HAS5 cells clearly have more cells in G0/G1 with reduced number of cells in S phase after serum starvation for 24 h. These results indicate that the cells with reduced eIF3a expression are more sensitive to serum starvation-induced G0/G1 arrest.
Fig. 6 –
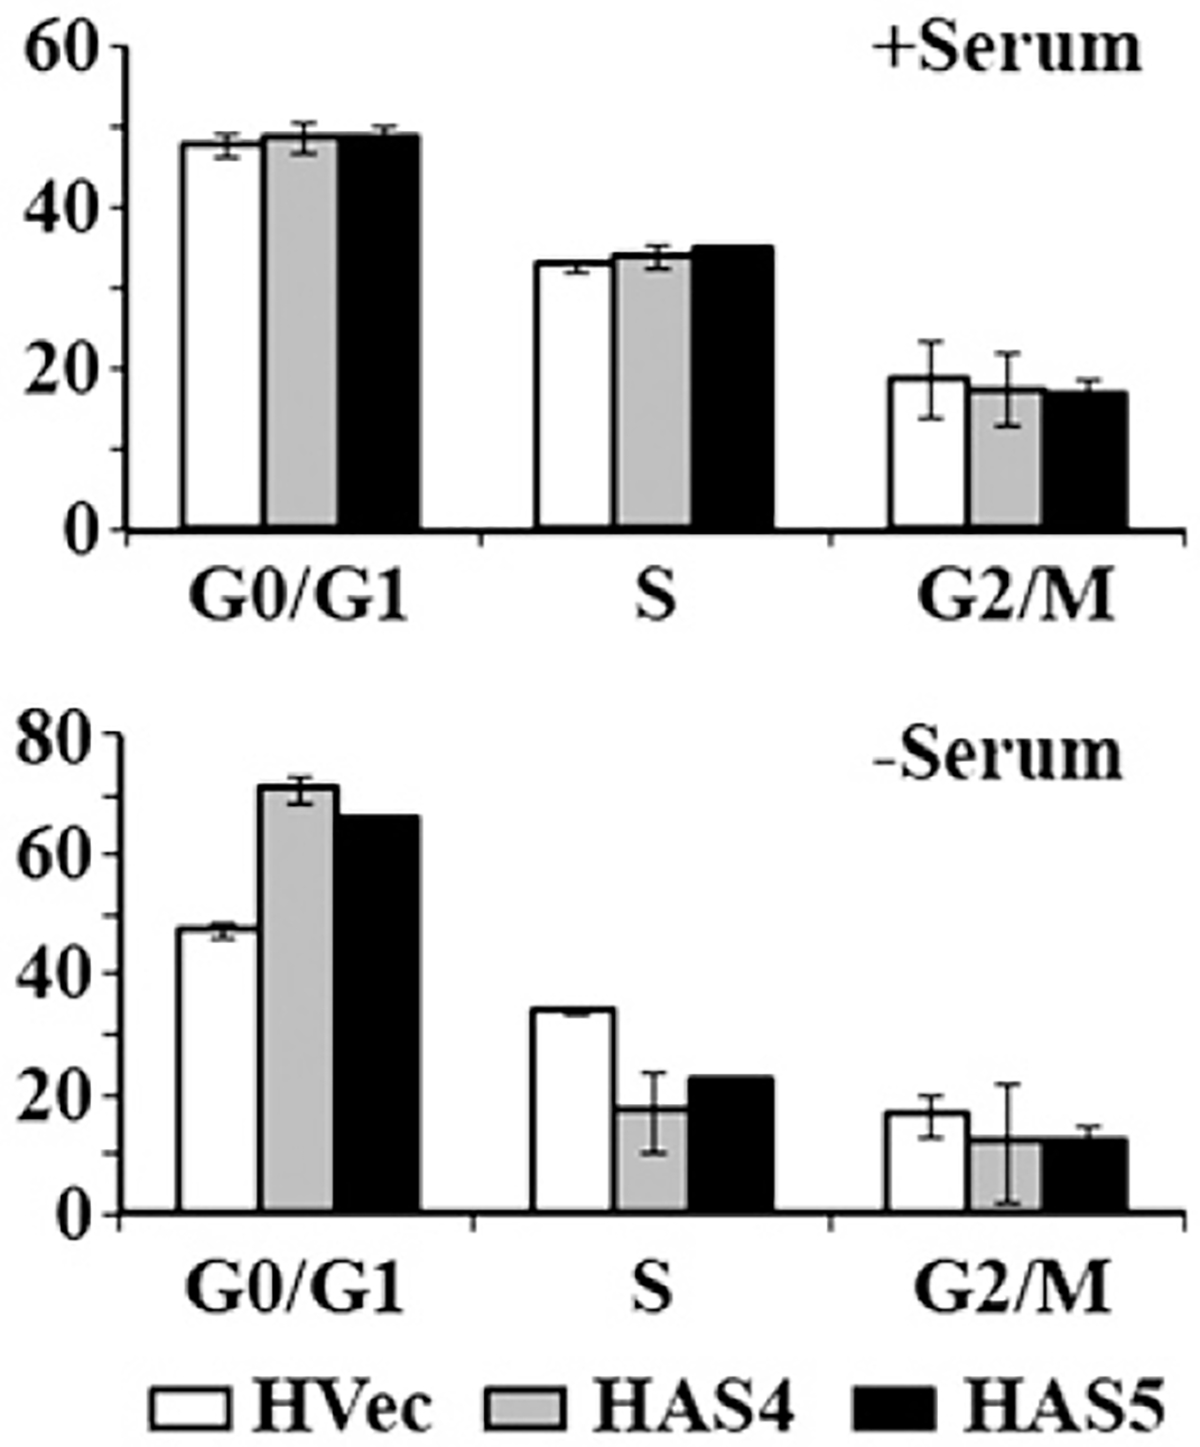
Effect of reducing eIF3a expression on cellular response to serum starvation. Stable H1299 clones transfected with vector (HVec) or antisense eIF3a (HAS4 and HAS5) [9] were cultured in normal condition with serum or in the absence of serum for 24 h followed by analysis of cell cycle distribution.
To determine the effect of eIF3a expression on S phase arrest, we used hydroxyurea, a ribonucleotide reductase inhibitor that arrests cells in S phase. As shown in Fig. 7A, the effect of hydroxyurea on the vector-transfected control cells is concentration dependent. The maximum arrest in S phase occurred with the use of 0.3 mM hydroxyurea. However, the maximum arrest in S phase for the cells with reduced eIF3a expression (HAS4 and HAS5) requires higher concentration (0.5 mM) of hydroxyurea, suggesting that the cells with reduced eIF3a expression are less sensitive to hydroxyurea-induced S phase arrest.
Fig. 7 –
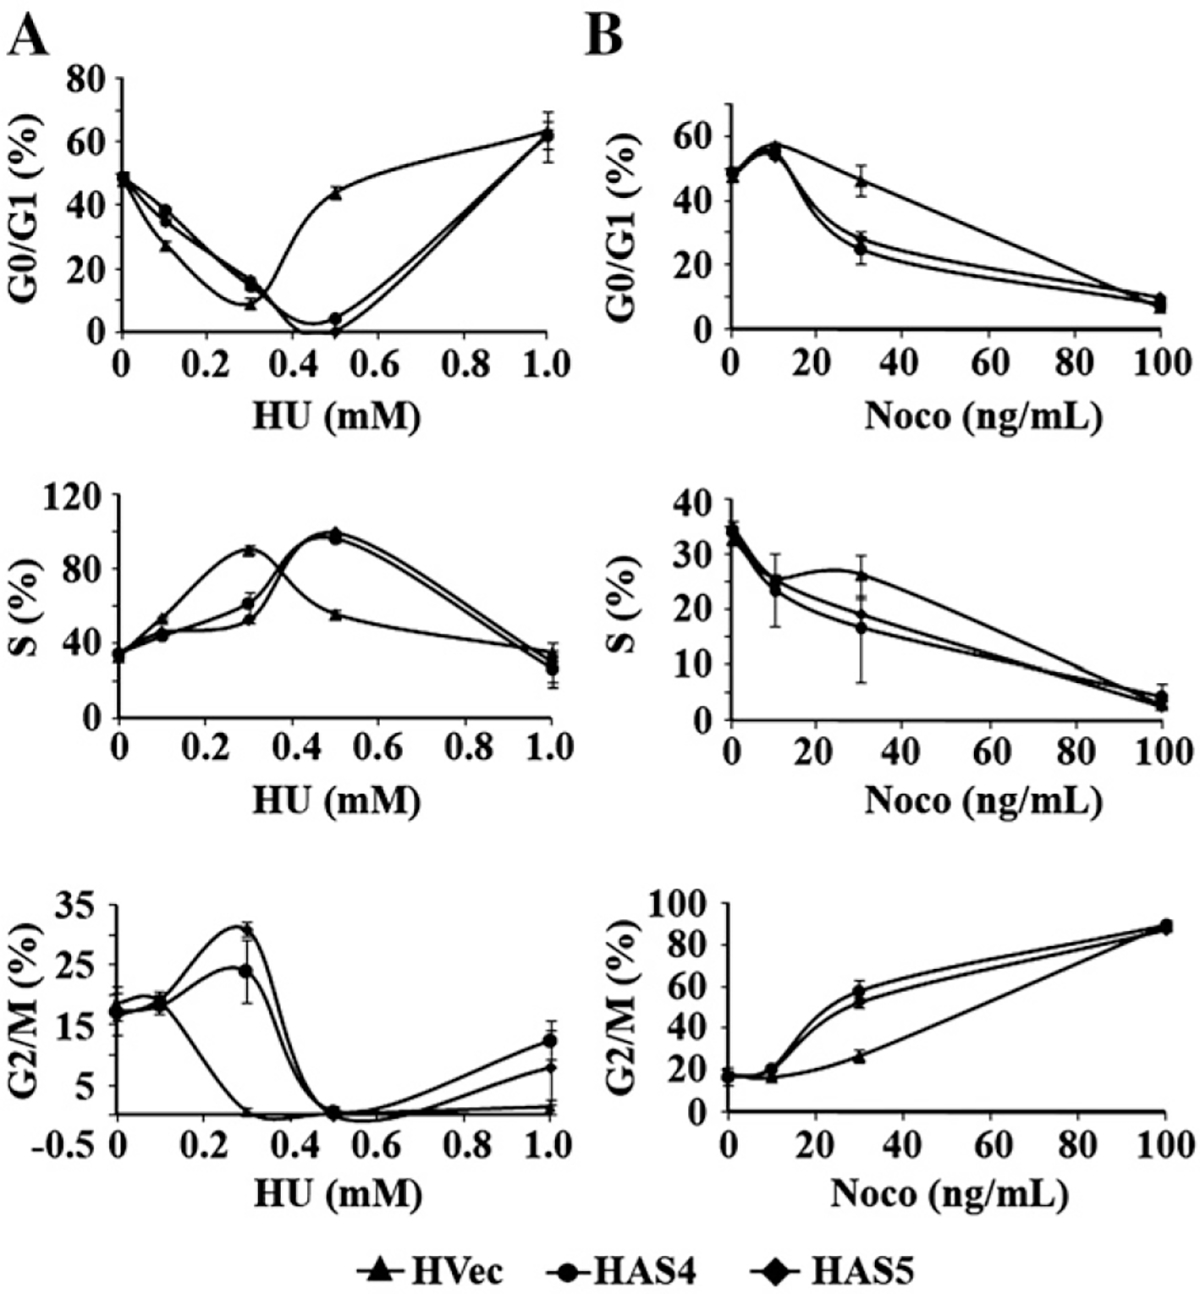
Effect of reducing eIF3a expression on cellular response to hydroxyurea and nocodazole. Stable H1299 clones transfected with vector (HVec) or antisense eIF3a (HAS4 and HAS5) [9] were treated with various concentrations of hydroxyurea (HU) or nocodazole (Noco) for 48 h. Cells were then collected for analysis of cell cycle distribution.
To determine the effect of eIF3a expression on G2/M phase arrest, we used nocodazole, a microtubule polymerization inhibitor, which arrests cells in G2/M phase. As shown in Fig. 7B, at 100 ng/ml, nocodazole arrested more than 80% of both vector-transfected control (HVec) as well as the cells with reduced eIF3a expression (HAS4 and HAS5). However, HAS4 and HAS5 cells appears to be more sensitive to lower nocodazole concentration compared to HVec cells and the number of HAS4 and HAS5 cells at G2/M phase following treatment with 30 ng/ml nocodazole is significantly higher than that of the HVec cells.
Discussion
In this study we showed that eIF3a expression oscillates with cell cycle and peaks in S phase. Stably suppressing eIF3a expression changed the sensitivity of cells to external cell cycle modulators. However, the change in eIF3a expression alone did not change the cell cycle distribution although it lengthened the doubling time of these cells.
The finding that eIF3a expression peaks in S phase indicates that eIF3a may be a translational regulator for proteins important for S phase entrance. Indeed, we previously found that eIF3a regulates the expression of ribonucleotide reductase M2 (RRM2) [9], a subunit of ribonucleotide reductase, which also oscillates with cell cycle and peaks in S phase [19–21]. Ribonucleotide reductase is required in S phase and it converts ribonucleotides to their corresponding deoxyribonucleotides to provide dNTP pools for DNA synthesis. However, it is noteworthy that suppressing eIF3a expression alone could not arrest cells in S phase, suggesting that other mechanisms may complement the negative effect of reduced eIF3a expression on S phase.
Although altering eIF3a expression alone did not change the distribution of cell cycle, stably reducing eIF3a expression consistently altered cellular responses to external cell cycle modulators. While reducing eIF3a expression decreased cellular sensitivity to S phase modulator (hydroxyurea), it increased cellular sensitivity to modulators of G0/G1 (serum starvation) and G2/M (nocodazole) phases. The exact mechanisms of these effects are not yet known. However, it is possible that eIF3a regulates the expression of genes that are associated with cell cycle or growth. Previously, we have shown that eIF3a plays an important role in regulating the translation of p27kip1, ribonucleotide reductase M2 (RRM2), and tyrosinated α-tubulin [9,10]. While increasing eIF3a level by ectopic over-expression increased the synthesis of ribonucleotide reductase and tyrosinated α-tubulin, it decreased the synthesis of p27kip1 and vice versa. It has also been shown that removal of eIF3a by proteosomal cleavage differentially altered the translations of different mRNAs both in vitro and in vivo [22]. While proteosomal cleavage of eIF3a had no effect on the assembly of 48S pre-initiation complexes on the IRES of HAV RNA, it had a significant inhibitory effect on the assembly of ribosomal complexes on the native capped β-globin mRNA and the IRES of Theiler’s murine encephalomyelitis virus. Clearly, further studies are needed to investigate what genes are under eIF3a control, that mediate cellular response to external cell cycle modulators.
It has been reported that the rate of protein synthesis varies during cell cycle progression in mammalian cells. While cap dependent translation is prevalent in the G1 and S phases, it is inhibited in the G2/M phase [23]. The synthesis of proteins required for the completion of mitosis is, however, maintained by a cap-independent mechanism [23,24]. Oscillation of eIF3a expression in different cell cycle stages suggests its regulatory role in the translations of different genes at different cell cycle stages. The regulatory role of eIF3a in translation initiation was initially suggested by Chaudhuri et al. who showed that eIF3 preparations rich in eIF3a did not differ from preparations that essentially lacked this protein in pre-initiation complex formation [8]. As discussed above, it was found later that eIF3a directly regulates the translation of p27, ribonucleotide reductase, as well as tyrosinated α-tubulin [2,9,10,25]. The role of eIF3a in cap-independent translation has also been suggested previously [7,26,27]. Thus, it is possible that eIF3a plays an important role in regulating synthesis of proteins that are important for cell cycle progression at all cell cycle stages.
In conclusion, eIF3a expression oscillates with cell cycle and peaks in S phase and it plays an important role in cell proliferation that affects the sensitivity of cells to environmental stresses that affect cell cycle possibly by controlling the synthesis of the target proteins of these stresses.
Acknowledgment
This work was supported in part by the National Institutes of Heath Grant CA94961.
REFERENCES
- [1].Hershey JWB, Merrick WC, Pathway and mechanism of initiation of protein synthesis, in: Sonenberg N, Hershey JWB, Mathews MB (Eds.), Translational Control of Gene Expression, Cold Spring Harbor Laboratory Press, Cold Spring Harbor, New York, 2000, pp. 33–88. [Google Scholar]
- [2].Dong Z, Zhang JT, Initiation factor eIF3 and regulation of mRNA translation, cell growth, and cancer, Crit. Rev. Oncol. Hematol. 59 (2006) 169–180. [DOI] [PubMed] [Google Scholar]
- [3].Benne R, Hershey JW, Purification and characterization of initiation factor IF-E3 from rabbit reticulocytes, Proc. Natl. Acad. Sci. U. S. A. 73 (1976) 3005–3009. [DOI] [PMC free article] [PubMed] [Google Scholar]
- [4].Methot N, Rom E, Olsen H, Sonenberg N, The human homologue of the yeast Prt1 protein is an integral part of the eukaryotic initiation factor 3 complex and interacts with p170, J. Biol. Chem. 272 (1997) 1110–1116. [DOI] [PubMed] [Google Scholar]
- [5].Block KL, Vornlocher HP, Hershey JW, Characterization of cDNAs encoding the p44 and p35 subunits of human translation initiation factor eIF3, J. Biol. Chem. 273 (1998) 31901–31908. [DOI] [PubMed] [Google Scholar]
- [6].Methot N, Song MS, Sonenberg N, A region rich in aspartic acid, arginine, tyrosine, and glycine (DRYG) mediates eukaryotic initiation factor 4B (eIF4B) self-association and interaction with eIF3, Mol. Cell. Biol. 16 (1996) 5328–5334. [DOI] [PMC free article] [PubMed] [Google Scholar]
- [7].Buratti E, Tisminetzky S, Zotti M, Baralle FE, Functional analysis of the interaction between HCV 5′UTR and putative subunits of eukaryotic translation initiation factor eIF3, Nucleic Acids Res. 26 (1998) 3179–3187. [DOI] [PMC free article] [PubMed] [Google Scholar]
- [8].Chaudhuri J, Chakrabarti A, Maitra U, Biochemical characterization of mammalian translation initiation factor 3 (eIF3). Molecular cloning reveals that p110 subunit is the mammalian homologue of Saccharomyces cerevisiae protein Prt1, J. Biol. Chem. 272 (1997) 30975–30983. [DOI] [PubMed] [Google Scholar]
- [9].Dong Z, Liu LH, Han B, Pincheira R, Zhang JT, Role of eIF3 p170 in controlling synthesis of ribonucleotide reductase M2 and cell growth, Oncogene 23 (2004) 3790–3801. [DOI] [PubMed] [Google Scholar]
- [10].Dong Z, Zhang JT, EIF3 p170, a mediator of mimosine effect on protein synthesis and cell cycle progression, Mol. Biol. Cell 14 (2003) 3942–3951. [DOI] [PMC free article] [PubMed] [Google Scholar]
- [11].Pincheira R, Chen Q, Zhang JT, Identification of a 170-kDa protein over-expressed in lung cancers, Br. J. Cancer 84 (2001) 1520–1527. [DOI] [PMC free article] [PubMed] [Google Scholar]
- [12].Dellas A, Torhorst J, Bachmann F, Banziger R, Schultheiss E, Burger MM, Expression of p150 in cervical neoplasia and its potential value in predicting survival, Cancer 83 (1998) 1376–1383. [DOI] [PubMed] [Google Scholar]
- [13].Chen G, Burger MM, p150 expression and its prognostic value in squamous-cell carcinoma of the esophagus, Int. J. Cancer 84 (1999) 95–100. [DOI] [PubMed] [Google Scholar]
- [14].Chen G, Burger MM, p150 overexpression in gastric carcinoma: the association with p53, apoptosis and cell proliferation, Int. J. Cancer 112 (2004) 393–398. [DOI] [PubMed] [Google Scholar]
- [15].Kovarik P, Hasek J, Valasek L, Ruis H, RPG1: an essential gene of Saccharomyces cerevisiae encoding a 110-kDa protein required for passage through the G1 phase, Curr. Genet. 33 (1998) 100–109. [DOI] [PubMed] [Google Scholar]
- [16].Liu Z, Dong Z, Yang Z, Chen Q, Pan Y, Yang Y, Cui P, Zhang X, Zhang JT, Role of eIF3a (eIF3 p170) in intestinal cell differentiation and its association with early development, Differentiation 75 (2007) 652–661. [DOI] [PubMed] [Google Scholar]
- [17].Gothot A, Pyatt R, McMahel J, Rice S, Srour EF, Functional heterogeneity of human CD34(+) cells isolated in subcompartments of the G0/G1 phase of the cell cycle, Blood 90 (1997) 4384–4393. [PubMed] [Google Scholar]
- [18].Bradford MM, A rapid and sensitive method for the quantitation of microgram quantities of protein utilizing the principle of protein-dye binding, Anal. Biochem. 72 (1976) 248–254. [DOI] [PubMed] [Google Scholar]
- [19].Engstrom Y, Eriksson S, Jildevik I, Skog S, Thelander L, Tribukait B, Cell cycle-dependent expression of mammalian ribonucleotide reductase. Differential regulation of the two subunits, J. Biol. Chem. 260 (1985) 9114–9116. [PubMed] [Google Scholar]
- [20].Bjorklund S, Skog S, Tribukait B, Thelander L, S-phase-specific expression of mammalian ribonucleotide reductase R1 and R2 subunit mRNAs, Biochemistry 29 (1990) 5452–5458. [DOI] [PubMed] [Google Scholar]
- [21].Bjorklund S, Skogman E, Thelander L, An S-phase specific release from a transcriptional block regulates the expression of mouse ribonucleotide reductase R2 subunit, EMBO J. 11 (1992) 4953–4959. [DOI] [PMC free article] [PubMed] [Google Scholar]
- [22].Baugh JM, Pilipenko EV, 20S proteasome differentially alters translation of different mRNAs via the cleavage of eIF4F and eIF3, Mol. Cell 16 (2004) 575–586. [DOI] [PubMed] [Google Scholar]
- [23].Pyronnet S, Sonenberg N, Cell-cycle-dependent translational control, Curr. Opin. Genet. Dev. 11 (2001) 13–18. [DOI] [PubMed] [Google Scholar]
- [24].Cornelis S, Bruynooghe Y, Denecker G, Van Huffel S, Tinton S, Beyaert R, Identification and characterization of a novel cell cycle-regulated internal ribosome entry site, Mol. Cell 5 (2000) 597–605. [DOI] [PubMed] [Google Scholar]
- [25].Dong Z, Liu Y, Zhang JT, Regulation of ribonucleotide reductase M2 expression by the upstream AUGs, Nucleic Acids Res. 33 (2005) 2715–2725. [DOI] [PMC free article] [PubMed] [Google Scholar]
- [26].Odreman-Macchioli FE, Tisminetzky SG, Zotti M, Baralle FE, Buratti E, Influence of correct secondary and tertiary RNA folding on the binding of cellular factors to the HCV IRES, Nucleic Acids Res. 28 (2000) 875–885. [DOI] [PMC free article] [PubMed] [Google Scholar]
- [27].Sizova DV, Kolupaeva VG, Pestova TV, Shatsky IN, Hellen CU, Specific interaction of eukaryotic translation initiation factor 3 with the 5′ nontranslated regions of hepatitis C virus and classical swine fever virus RNAs, J. Virol. 72 (1998) 4775–4782. [DOI] [PMC free article] [PubMed] [Google Scholar]


