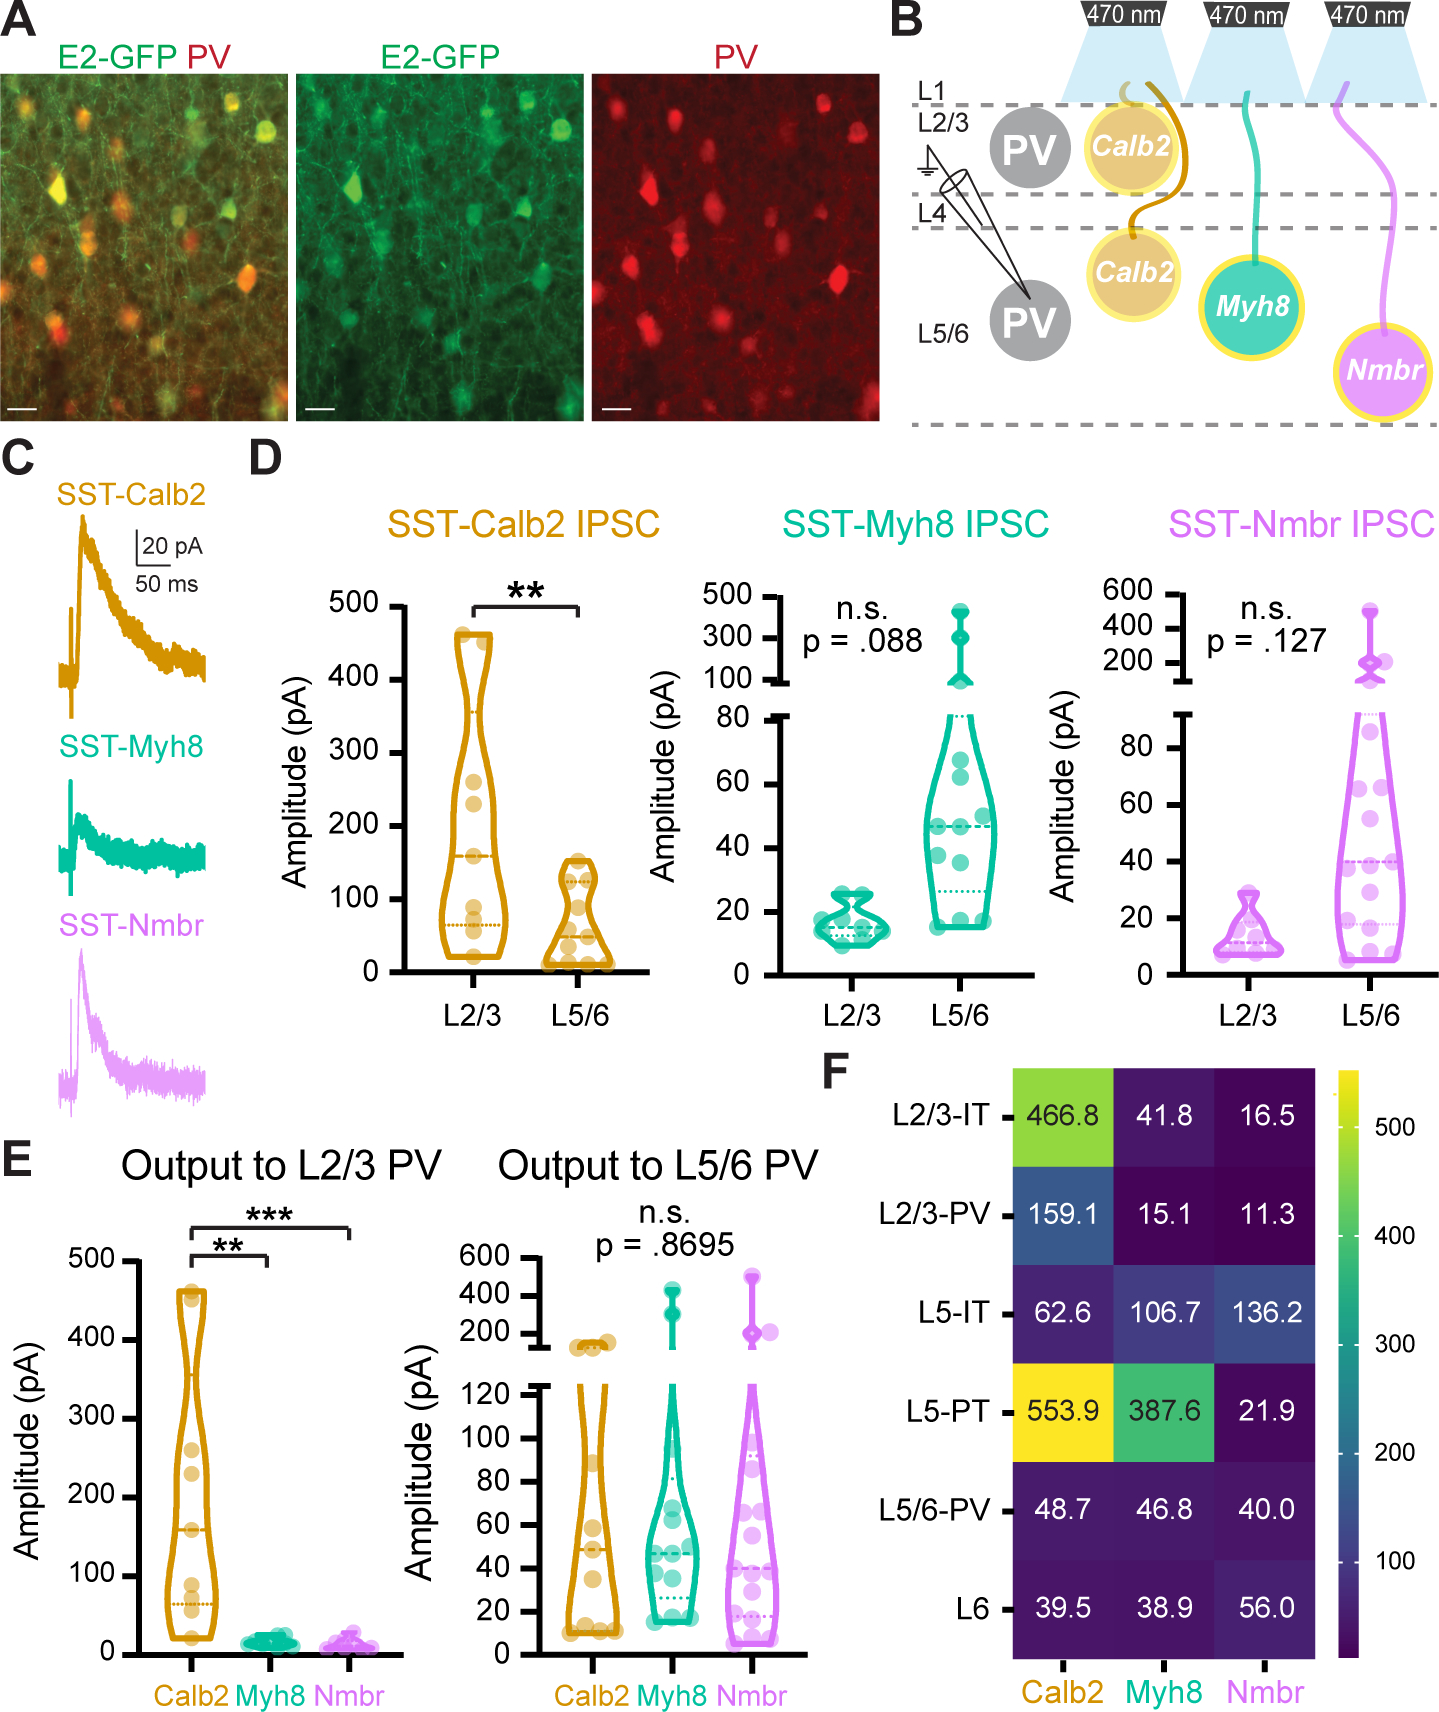
Figure 5. SST subtypes differentially innervate PV interneurons.

(A) Representative images of E2-GFP injection in V1 labeling PV interneurons. Scale bars, 5 μm.
(B) Recording scheme. SST-Calb2, SST-Myh8, SST-Nmbr interneurons were genetically targeted to express CatCh by crossing with the Ai80 reporter line. IPSCs were recorded from PV neurons in response to 1 ms light stimulation.
(C-D) Representative traces of IPSCs and violin plots of IPSC amplitudes in PV interneurons in response to optogenetic stimulation of different SST subtypes.
(E) Comparison of different SST subtypes output to L2/3 (left) and L5/6 PV interneurons (right).
(F) Heatmap of median evoked IPSC amplitude (pA) from each SST subtype across pyramidal neurons and PV interneurons in different layers.
Statistics in Table S7.
