Abstract
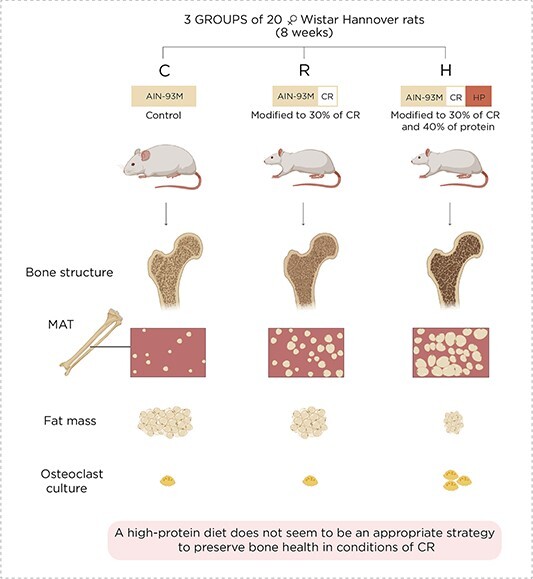
The present study was designed to evaluate the influence of a high-protein diet under conditions of calorie restriction (CR) in the muscle, adipose tissue, bone, and marrow adipose tissue (MAT). It included three groups of 20 female Wistar Hannover rats, fed with the following diets for 8 wk: control group (C) fed with an AIN93M diet, CR group (R) fed with an AIN-93M diet modified to 30% CR, and CR + high-protein group (H) fed with an AIN-93M diet modified to 30% CR with 40% protein. Body composition was determined by DXA. The femur was used for histomorphometry and the estimation of adipocytes. Microcomputed tomography (μCT) was employed to analyze the bone structure. Hematopoietic stem cells from the bone marrow were harvested for osteoclastogenesis. Body composition revealed that the gain in lean mass surpassed the increase in fat mass only in the H group. Bone histomorphometry and μCT showed that a high-protein diet did not mitigate CR-induced bone deterioration. In addition, the number of bone marrow adipocytes and the differentiation of hematopoietic stem cells into osteoclasts were higher in H than in the other groups. These results indicated that under CR, a high-protein diet was beneficial for muscle mass. However, as the μCT scanning detected significant bone deterioration, this combined diet might accentuate the detrimental effect on the skeleton caused by CR. Remarkably, the H group rats exhibited greater MAT expansion and elevated hematopoietic stem cell differentiation into osteoclasts than the CR and control counterparts. These data suggest that a high protein may not be an appropriate strategy to preserve bone health under CR conditions.
Keywords: caloric restriction; high-protein diet; bone histomorphometry, bone marrow adipocytes; microcomputed tomography; osteoclastogenesis
Graphical Abstract
Graphical Abstract.
Introduction
Energy is an absolute requirement for maintaining cell activity and the complex network that connects different tissues, as well as the systems that integrate the whole body to work as a unit. Mammals have an intermittent feeding habit; as such, they need to store energy to guarantee its supply during fasting. Carbohydrates, lipids, and proteins are the universal substrates for energy disposal, energy storage, and building blocks during development and tissue repair, respectively. Excessive intake of carbohydrates or lipids is closely linked to insulin resistance, diabetes mellitus, and cardiovascular disease, while a high-protein diet is often advocated as beneficial because it promotes lean mass gain.1 On the other hand, divergent reports exist in the literature regarding the impacts of a high-protein diet on bone. The pre-1990s investigations alert that high-protein diets lead to systemic acidosis, which causes osteolysis and bone loss.2 However, more recent studies call attention to the mechanisms by which the nutritional and hormonal environments (ie, elevated levels of growth factors) associated with a high-protein diet can create conditions favorable for bone anabolism, ultimately driving bone gain.3,4
Calorie restriction (CR) has long been revered as a healthy habit, capable of increasing life expectancy, preventing degenerative disorders, and preserving the quality of life.5 However, in the complex physiology of vertebrates, there is no silver bullet that has beneficial effects on all tissues and systems. Bone is negatively affected by weight loss induced by caloric restriction, resulting in bone loss, reduced bone strength, and higher susceptibility to fractures.6,7 Anorexia nervosa (AN) is a chronic caloric restriction disorder triggered by a psychiatric condition in which an individual suffers from a distorted body image. It mainly affects adolescent girls and young women. Body weight loss often occurs not only due to compulsory fasting but also strenuous exercise. Muscle and adipose tissue reduction in AN is readily evident, whereas bone loss is not visibly perceptible. Several strategies have been attempted to overcome bone deterioration under caloric restriction. For instance, estrogen therapy is insufficient in providing complete skeletal recovery in AN adolescents, despite hypothalamic hypogonadism being a frequent occurrence.8 Similarly, running, an impact-associated exercise, does not produce a beneficial influence on bones when energy availability is insufficient to cover expenditure.9 The low success rate of medical and behavioral therapy and a significant risk of relapse challenge the development of alternatives to mitigate bone disorders during AN.
Marrow adipose tissue (MAT) surges during perinatal life and is programmed to expand independently of the nutritional state.10,11 Curiously, caloric deprivation serves as a strong stimulus for bone adipocyte expansion; in healthy adults, MAT accounts for 10% of total body adipose tissue, whereas this figure reaches 30% in AN. Studies show a negative relationship between BMD and MAT.1,12 Additionally, clinical recovery from AN (ie, body weight and gonadal axis function) enhances BMD and reduces MAT.13 There are divergent data concerning the effect of a hyperproteic diet on bone mass, and, so far, no study has evaluated the impact of high-protein intake on the expansion of MAT under caloric restriction. All these points were specifically evaluated in an experimental model of adolescent female rodents.
A high-protein and hypocaloric diet has frequently been used as one of the strategies for weight loss and maintenance during obesity treatment. However, there is a paucity of reports investigating the impact of high-protein intake under a CR diet. The main objective of the present study was to determine whether a high-protein diet can mitigate muscle and bone loss during caloric restriction in female rats.
Material and methods
The study protocol was approved by the Animal Care Institutional Ethical Committee of the Ribeirão Preto Medical School, University of São Paulo, São Paulo, Brazil (#83/2018). For the study, 60 female Wistar Hannover rats, 8 wk old, were maintained in individual cages in a temperature- and humidity-controlled room with a 12 h light/dark diurnal cycle. All had free access to water.
The study comprised two protocols with three groups of 10 animals each, totaling 60: the control group (C), which received an AIN93M diet; the 30% CR group (R) (AIN-93M adjusted to 30% of the diet ingested by the control group); and the group with a combination of caloric restriction (30%) and high-protein diet (40%) (H) (AIN-93M modified to 30% fewer calories and 40% increased protein). In protocol 1, the bone specimens of rats were used to microcomputed tomography (μCT) and histomorphometry, and in protocol 2, to DXA. The animals received anesthesia (ketamine 50 mg/kg and xylazine 10 mg/kg) before each DXA exam. The number of deaths during anesthesia was one in C and two in R groups. The C, R, and H groups received 140, 140, and 460 of casein (g/kg of diet), respectively. Complete information about the diet composition can be found in Table S1. Rats were housed in a single cage. The food intake of the control group was estimated daily and used to adjust the amount offered to the two caloric restriction groups. In protocol 1, body weight was measured weekly, and in protocol 2, it was assessed before DXA examination. Fasting and non-fasting blood glucose were ascertained employing an Accu-Chek Performa blood glucometer (Roche) at the following time points: 0 (basal) and at the ends of 2, 5, and 8 wk. After the completion of 8 wk, the animals were euthanized and blood and tissues were collected. The serum levels of the C-terminal telopeptide cross-link of type 1 collagen were determined by ELISA (Nordic Bioscience, Herlev, Denmark). Body composition was ascertained by a Prodigy Series X DXA at basal, 4 and 8 wk (GE Medical Systems, Lunar, Wisconsin, USA).
Bone histomorphometry
Histomorphometry was performed on five tibias from each group by employing the OsteoMeasure system (Osteometrics, Decatur, GA, USA). The tibias were dehydrated in ethanol, infiltrated, and embedded in methyl methacrylate without demineralization. Sections of 5 μm thickness were cut, stained with 0.1% toluidine blue (pH 6.4), and viewed under polarized light at 250× magnification. The cancellous bone of the proximal tibia metaphysis was measured at 195 μm from the epiphyseal growth plate in a total of 20 fields. The following indices were analyzed: bone volume (BV/TV, %), bone surface (BS/TV), trabecular thickness (Tb.Th, μm), trabecular number (Tb.N, /mm), trabecular separation (Tb.Sp, μm), osteoblast number per trabecular area (N.Ob/T.Ar, /mm2), osteoclast number per trabecular area (N.Oc/T.Ar, /mm2), and adipocyte number per area (N.Ad/T.Ar) and per perimeter (N.Ad/B.Pm).
Assessment of the bone structure by μCT
The rat femur and L5 vertebra of five rats per group were fixed in 70% ethanol, and the bone volume and microarchitecture were evaluated using a Skyscan 1176 μCT scanner (Skyscan 1176, Bruker, Belgium). The microarchitecture of both the proximal trabecular bone and midshaft cortical bone in the femur and L5 vertebra was examined by employing μCT at a resolution of 9 μm and utilizing a 0.5 mm aluminum filter. The structure was analyzed using the CTAn software version 1.20.3.0 (Bruker μCT). All datasets were applied with thresholding before morphometrics.
For the femoral head analysis, the ROI was located 0.3 mm away from the articular cartilage, represented by a cylinder, 0.8 mm in radius, and 0.3 mm in thickness. As for the femoral neck, a manual contouring was drawn along the neck extension, avoiding the cortex. The cortical bone was assessed for 2 mm in extension, distal to the third trochanter. In the L5 vertebral body, the trabecular bone was evaluated in a region beginning 100 μm below the cranial endplate and extending up to 100 μm above the caudal endplate. The trabecular bone regions were identified by manually contouring the endocortical region of the bone. The same threshold was employed to segment bone from the soft tissue in the femur and L5 vertebrae. Calibration phantoms were scanned and reconstructed employing the same settings as bone samples. The guidelines for the assessment of rodent bones by μCT image acquisition were used in this study.14
Osteoclast culture
Bone marrow cells were flushed from the femur and tibia of rats from the three groups and cultured in a minimal essential medium [aMEM] (GIBCO, Carlsbad, CA, USA). Cells were cultured for 3 d in Petri dishes (Corning, NY, USA) with α-MEM containing 10% fetal bovine serum (Gibco), 100 mg/mL penicillin, 100 mg/mL streptomycin (Thermo Fisher Scientific, Carlsbad, CA, USA), and 30 ng/mL of M-CSF (R&D Systems Inc., Minneapolis, MN, USA). Adherent cells were cultured in an osteoclastogenic medium with 30 ng/mL of M-CSF and 10 ng/mL RANKL (R&D Systems Inc.), for 4 d. Cells were stained for TRAP and TRAP + cells with ≥3 nuclei being counted.
Statistical analysis
Statistical analysis was performed using R Core Team (Vienna, Austria) and SAS Statistical Software version 9.3 (SAS Institute Inc., Cary, NC, USA). The data were reported as the mean ± SD. Linear regression with mixed effects was applied to analyze the weight and blood glucose at basal time, 2, 4, and 8 wk. Additionally, a one-way ANOVA followed by Tukey’s post-test was used to compare the parameters between the groups. For all statistical analyses, the significance level was 95% (p < .05).
Results
The animals of the three groups showed similar body weights at baseline (all animals from experiments 1 and 2: C = 202.0 ± 28.7 vs R = 204.8 ± 30.8 vs H = 204.6 ± 32.3 g). Table S1 shows the individual body weight evolution in protocols 1 and 2. The only group that demonstrated significant body weight gain was the C (delta: 59.7 ± 40.4 g; 28.3%), while the R (delta: 7.1 ± 17.6 g; 3.2%) and H (delta: 0.3 ± 13.1; −0.3%) groups showed no marked variation with basal time. There was a significant difference in the evolution of body composition in the three groups. The group receiving a high-protein diet gained less fat mass (6.9 ± 18.6 g) than the C group (51.4 ± 53 g) p < .05, whereas there was no difference between C and R (17.4 ± 26.7 g), as well as R and H. Thus, while there was no difference in percentage of fat mass (% fat mass) between C (34.3 ± 12.6%) and R (26.3 ± 6.7%), but the H group (19.2 ± 5.9%) showed lower % fat mass than the C group. There was no difference in the lean mass of the three groups at the end of the experimental protocol (C = 12.9 ± 31.9; R = 6.3 ± 25.7; and H = 14.0 ± 19.6 g) (Figure 1).
Figure 1.
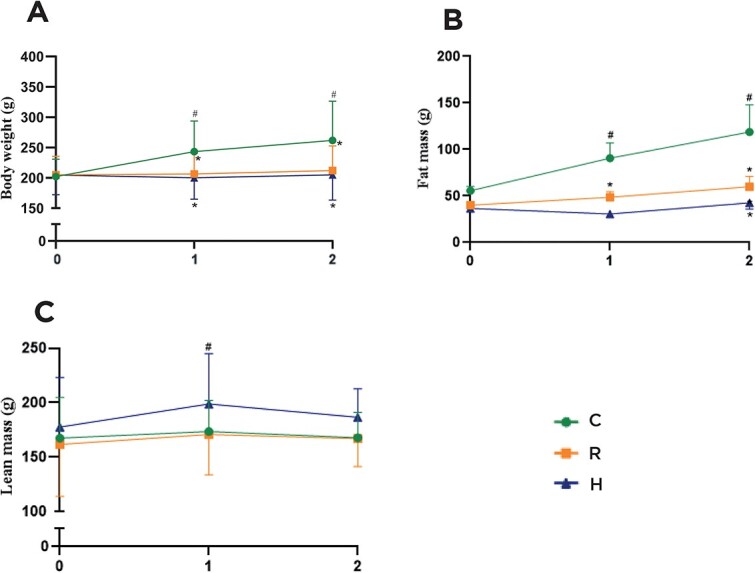
Evolution of weight (A) and body composition (fat (B) and lean (C) mass) during the 8-wk experiment. C: Control group; R: Caloric restriction (30%) group, and H: Caloric restriction (30%) + high-protein (40%) group diets. * means difference in comparison to C, p < .05. # means difference in comparison to basal time, p < .05.
Figure 2 shows non-fasting blood glucose levels. In non-fasting status, both groups submitted to diet restriction demonstrated lower blood glucose levels than the C group at the second, fifth, and eighth weeks. Moreover, in the second week of CR, glycemia was lower in H than in R, but this variation was not observed in the fifth and eighth weeks. There was no significant difference in serum levels of CTX between the three groups (C = 16.5 ± 3.3 vs R = 18.0 ± 2.7 vs H = 20.4 ± 4.1 ng/mL).
Figure 2.
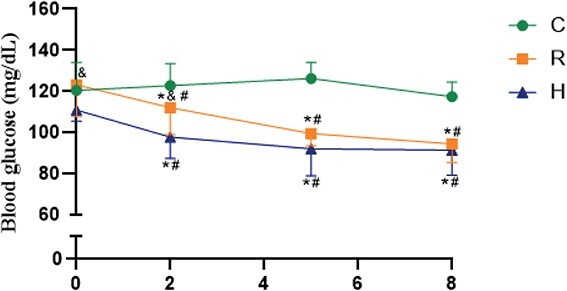
Blood glucose at 0 (basal) and the ends of 2, 5, and 8 wk of the experiment. C: Control group; R: Caloric restriction (30%) group; and H: Caloric restriction (30%) + high-protein (40%) group diets. * means difference in comparison to C, p < .05. # means difference in comparison to basal time, p < .05.
The results of the right tibial histomorphometry showed that the bone microstructure was negatively affected by CR (Table 1, Figure 3). The R and H groups demonstrated significantly lower BV/TV, BS/TV, and Tb.N than C. Tb.Sp was higher in R and H in comparison to C. Moreover, the enhancement in dietary protein did not mitigate the detrimental effect of CR on the bone. The H group revealed fewer osteoblasts than the C group. Additionally, R also exhibited a trend of having fewer osteoblasts per area than C (p = .06). The R group exhibited fewer osteoclasts per area than the C group.
Table 1.
Histomorphometric parameters in tibia.
| Histomorphometry | C (n = 10) | R (n = 10) | H (n = 9) |
|---|---|---|---|
| Mean ± SD | Mean ± SD | Mean ± SD | |
| BV/TV (%) | 39.46 ± 6.48 | 28.4 ± 4.03a | 26.14 ± 9.08a |
| BS/TV (mm2/mm3) | 8.99 ± 1.18 | 6.86 ± 1.13a | 6.42 ± 1.62a |
| BS/BV (mm2/mm3) | 22.94 ± 1.72 | 24.26 ± 2.95 | 25.73 ± 4.51 |
| Tb.Th (μm) | 87.62 ± 6.47 | 83.57 ± 10.21 | 79.73 ± 13.29 |
| Nob/Tar (/mm.mm2) | 8.83 ± 1.31 | 6.76 ± 1.98 | 5.46 ± 2.51a |
| Noc/Tar (/mm.mm2) | 2.17 ± 0.75 | 1.39 ± 0.56a | 1.74 ± 0.28 |
| Tb.Sp (μm) | 138.7 ± 34.77 | 214.9 ± 42.76a | 251.48 ± 98.47a |
| Tb.N (/mm) | 4.49 ± 0.59 | 3.43 ± 0.56a | 3.21 ± 0.81a |
| N.Ad/T.Ar (cells/mm2) | 3.27 ± 1.42 | 16.7 ± 11.74 | 41.19 ± 22.64ab |
| N.Ad/B.Pm (μm) | 0.53 ± 0.26 | 3.64 ± 2.83a | 10.53 ± 8.87ab |
C: control group, R: caloric restriction (30%), and H: caloric restriction (30%) + high-protein (40%) diets offered during the 8 wk of the experiment. Abbreviations: BV/TV, bone volume fraction; BS/TV, bone surface density; BS/BV, bone surface/volume ratio; Tb.N, trabecular number; Tb.Sp, trabecular separation; Tb.Th, trabecular thickness; Nob/Tar, osteoblasts number; Noc/Tar, osteoclasts number; N.Ad/T.Ar, number of adipocytes per area; N.Ad/B.Pm, number of adipocytes per perimeter.
ameans difference between C, p < .05.
means difference between R, p < .05.
Figure 3.
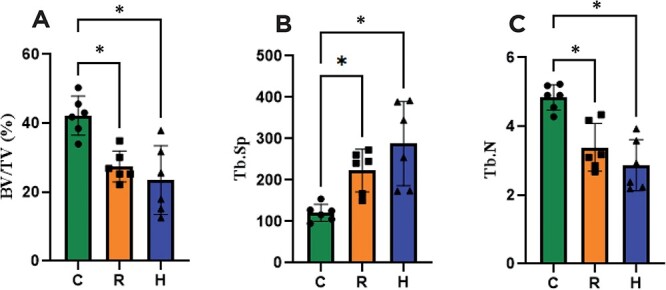
Bone histomorphometry parameters. (A) BV/TV: bone volume density, (B) Tb.Sp: Trabecular separation, and (C) Tb.N: Trabecular number. C: Control group; R: Caloric restriction (30%) group; and H: Caloric restriction (30%) + high-protein (40%) group diets. * means p < .05.
Figure 4 indicates that CR promotes bone marrow adipogenesis and also highlights that the adipocyte expansion in bone marrow intensified in the H group. In summary, the number of adipocytes increased in CR rats, in particular, in those consuming a hyperproteic diet. The N.Ad/T.Ar (cells/mm2) was markedly higher in H than in the C and R groups (Table 1).
Figure 4.
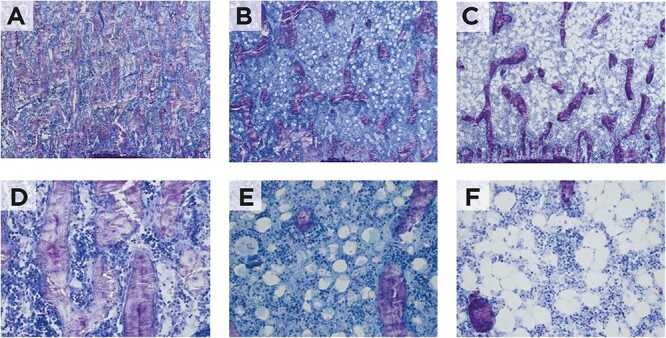
Representative microscopic features of the bone marrow. (A) Control, (B) caloric restriction (C) caloric restriction (30%) + high-protein (40%) groups; 200× magnification, (D) control, (E) caloric restriction (F) caloric restriction (30%) + high-protein (40%) groups; 400× magnification.
The μCT revealed that the H group was the only one that showed evidently greater bone deterioration in comparison to the C group, suggesting that an increase in protein content enhanced the catabolic effect of CR on the bone. Femoral analysis in ROI 1 (femoral head): only the H group showed markedly lower BV/TV (p < .01) and higher Tb.Sp (p < .05) than the C group, whereas there was no difference between C and R (Table 2 and Figure 5). Femoral analysis in ROI 2 (femoral neck): there was no statistically significant difference between the groups at this site. The Ct.Th was lower in H than in C (p < .05), but there was no difference between R and C. All these results are summarized in Table 2.
Table 2.
Microcomputed tomography results.
| MicroCT | C (n = 5) | R (n = 5) | H (n = 5) |
|---|---|---|---|
| Mean ± SD | Mean ± SD | Mean ± SD | |
| ROI1–Femoral head | |||
| TV (mm3) | 1.43 ± 0.15 | 1.55 ± 0.36 | 1.51 ± 0.2 |
| BV (mm3) | 1.04 ± 0.06 | 1.00 ± 0.28 | 0.91 ± 0.07 |
| BV/TV (%) | 73.71 ± 6.23 | 63.84 ± 4.94 | 61.12 ± 6.7 a |
| TS (mm2) | 8.88 ± 0.78 | 9.89 ± 0.8 | 9.37 ± 0.8 |
| BS (mm2) | 20.15 ± 3.54 | 23.28 ± 2.95 | 22.11 ± 2.85 |
| Tb.Th (mm) | 0.16 ± 0.02 | 0.14 ± 0.02 | 0.13 ± 0.01 |
| Tb.N (mm) | 4.67 ± 0.32 | 4.75 ± 0.57 | 4.55 ± 0.33 |
| Tb.Sp (mm) | 0.11 ± 0.01 | 0.12 ± 0.01 | 0.13 ± 0.02 a |
| Conn.Dn (mm3) | 85.45 ± 27.26 | 131.14 ± 48.35 | 104.68 ± 17.15 |
| ROI2–Femoral neck | |||
| TV (mm3) | 0.83 ± 0.28 | 0.8 ± 0.14 | 0.72 ± 0.11 |
| BV (mm3) | 0.4 ± 0.15 | 0.34 ± 0.03 | 0.3 ± 0.06 |
| BV/TV (%) | 48.31 ± 7.58 | 43.48 ± 4.72 | 40.99 ± 6.53 |
| TS (mm2) | 8.0 ± 2.0 | 7.37 ± 0.4 | 6.77 ± 0.5 |
| BS (mm2) | 11.80 ± 4.43 | 11.58 ± 0.88 | 9.55 ± 1.29 |
| Tb.Th (mm) | 0.12 ± 0.01 | 0.11 ± 0.01 | 0.11 ± 0.01 |
| Tb.N (mm) | 3.95 ± 0.48 | 3.95 ± 0.53 | 3.62 ± 0.36 |
| Tb.Sp (mm) | 0.18 ± 0.02 | 0.18 ± 0.04 | 0.20 ± 0.02 |
| Conn.Dn (mm3) | 106.29 ± 25.53 | 139.83 ± 27.26 | 103.34 ± 20.21 |
| Cortical | |||
| Ct.BV (mm3) | 4.63 ± 0.25 | 4.35 ± 0.17 | 4.22 ± 0.29 |
| Ct.BV/TV (%) | 38.1 ± 4.3 | 29.96 ± 3.19 | 31.24 ± 6.47 |
| Tt.Ar (mm2) | 43.86 ± 2.22 | 48.54 ± 4.96 | 48.46 ± 11.8 |
| Ct.Ar (mm2) | 28.6 ± 0.86 | 27.7 ± 0.82 | 27.33 ± 1.38 |
| Ct.Th (mm) | 0.56 ± 0.02 | 0.55 ± 0.03 | 0.52 ± 0.02 a |
| Total porosity(%) | 61.9 ± 4.3 | 70.04 ± 3.19 | 68.76 ± 6.47 |
| Vertebra | |||
| TV (mm3) | 4.47 ± 0.41 | 5.05 ± 0.69 | 4.67 ± 1.05 |
| BV (mm3) | 1.48 ± 0.28 | 1.54 ± 0.49 | 1.22 ± 0.27 |
| BV/TV (%) | 33.14 ± 6.87 | 29.9 ± 5.39 | 26.46 ± 3.44 |
| TS (mm2) | 18.61 ± 1.43 | 19.74 ± 1.77 | 18.81 ± 3.55 |
| BS (mm2) | 47.36 ± 5.59 | 54.25 ± 16.4 | 46.56 ± 10.62 |
| Tb.Th (mm) | 0.11 ± 0.01 | 0.10 ± 0.0 | 0.09 ± 0.00 a |
| Tb.N (mm) | 3.11 ± 0.42 | 3.1 ± 0.57 | 2.93 ± 0.28 |
| Tb.Sp (mm) | 0.26 ± 0.03 | 0.26 ± 0.04 | 0.27 ± 0.02 |
| Conn.Dn (mm3) | 96.49 ± 16.48 | 95.46 ± 32.87 | 83.8 ± 17.67 |
C: control group, R: caloric restriction (30%), and H: caloric restriction (30%) + high-protein (40%) diets offered during the 8 wk of the experiment. Abbreviations: BV/TV, bone volume fraction; BS/TV, bone surface density; BS/BV, bone surface/volume ratio; Tb.N, trabecular number; Tb.Sp, trabecular separation; Tb.Th, trabecular thickness; Nob/Tar, osteoblasts number; Noc/Tar, osteoclasts number; N.Ad/T.Ar, number of adipocytes per area; N.Ad/B.Pm, number of adipocytes per perimeter.
ameans difference between C group, p < .05.
Figure 5.
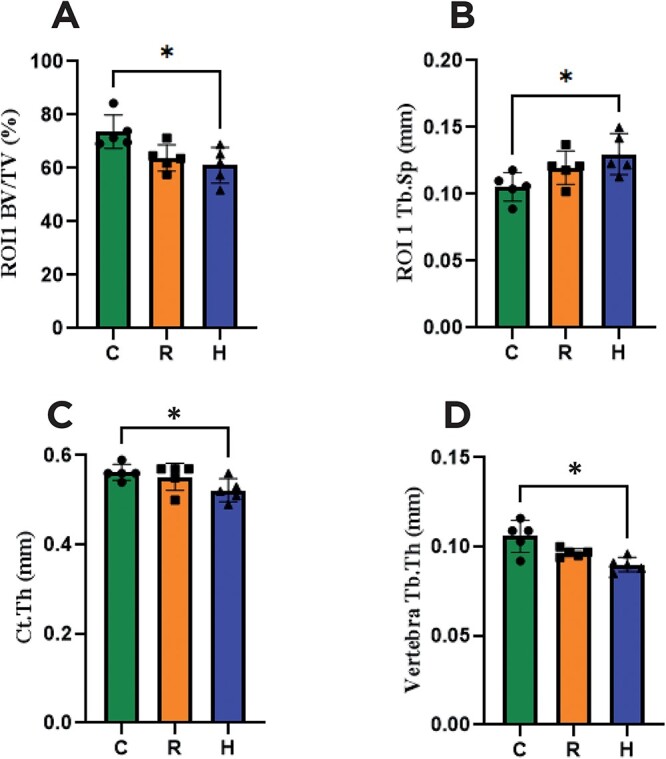
High-resolution μCT parameters. (A) ROI 1 (femoral head) bone volume density (BV/TV), (B) ROI 1 (femoral head) trabecular thickness (Tb.Th), (C) femur cortical thickness (Ct.Th), and (D) vertebra trabecular separation (Tb.Sp). C: Control group; R: Caloric restriction (30%) group; and H: Caloric restriction (30%) + high-protein (40%) group diets. * means p < .05.
Figure 6 shows a microphotograph of the culture of hematopoietic lineage cells derived from the bone marrow after stimulation of osteoclast differentiation with RANKL and M-CSF. An estimation of the number of cells harboring at least three nuclei and expressing TRAP (considered osteoclasts) indicated a lower number and area of osteoclasts for group R (19 ± 6.98 OC/well and 0.14 ± 0.06 mm2) in comparison to H (130 ± 50.8 OC/well and 1.61 ± 0.75 mm2) and C (105 ± 32.2 OC/well and 1.25 ± 0.47 mm2).
Figure 6.
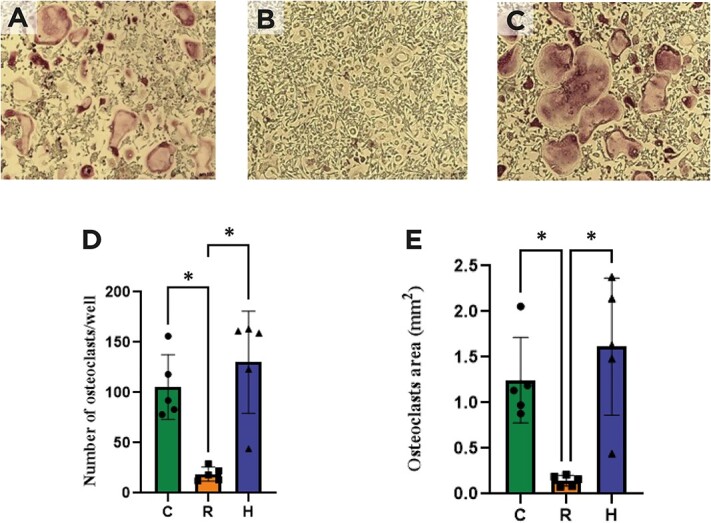
Osteoclast (OC) differentiation identified by TRAP staining. (A) Control, (B) caloric restriction (30%) (C) caloric restriction (30%) + high-protein (40%) groups, (D) number of osteoclasts per well, (E) osteoclasts area (mm2). * means p < .05.
Discussion
The skeleton is not directly involved in the provision of energy-related substrates under caloric restriction. However, bone loss and growth arrest are important consequences of metabolic adaptations during an energy shortage. Intriguingly, experimental and clinical studies reveal that MAT expands under caloric restriction and in women with AN, and there was an inverse relationship between BMD and MAT. A high-protein diet mitigates muscle loss during caloric restriction,1,15,16 but its impact on the skeleton has been scarcely investigated. The present study shows that protein overload during caloric restriction mitigates lean mass loss, but can potentially accentuate bone deterioration, as captured by μCT, and boosts MAT expansion.
At the end of 8 wk, only the control group exhibited weight gain, while both groups in CR showed body weight maintenance. In addition, there were remarkable differences in body composition between the three groups at the end of the experiment. A marked increase in the body weight of the animals with free access to food was mostly due to the expansion of fat mass. In contrast, the H group gained significantly less fat mass than the C, but there was no statistical difference in the variation of lean mass between the groups. These results are in line with those of previous studies showing the influence of high-protein diets as a strategy to maintain muscle mass under different conditions, eg, in obesity during caloric restriction and in intestinal cancer during chemotherapy.17–19 The long-term impacts of a high-protein diet (50%) on body weight, adipose tissue, calcium balance, and renal and hepatic function in rats were investigated; after 6 mo, rats fed on a high-protein diet exhibited significantly less adipose tissue than the group on a normoproteic diet, whereas the ratio of energy intake to lean body mass was similar in both groups.20 A high-protein diet in combination with resistance exercise enhanced free fat mass during a 10-wk weight loss program in obese elderly individuals.17
The negative impact of caloric restriction on bone was well demonstrated, where in 3-wk-old male mice, impairment of bone microstructure was observed after 12 wk of 30% caloric restriction, along with a marked expansion of MAT.21 In the present study, despite a positive effect on the maintenance of lean mass, the high-protein diet did not mitigate the detrimental effect imposed by caloric restriction on the skeleton of female rats. The μCT scanning in the L5 and femur detected apparent impairment in certain microstructural parameters in H, but not in R, in comparison to the control group, suggesting that an increase in protein content exacerbates the negative impact of CR on bone. On the other hand, bone histomorphometry indicated the detrimental effect of CR to be of the same magnitude, independent of protein content. The current results corroborate with a previous report that also found increased MAT after CR.21 The present study contributes to this line of investigation that in the context of CR, a high-protein diet intensifies adipocyte expansion within the bone marrow.
The limitation of the present study was that only female rats were evaluated, and the estrous cycle was not assessed during the experiment. Therefore, the results cannot be directly applied to male rats, as evidence suggests sex dimorphism in metabolic as well as body composition in response to different physiological stimuli.22,23 However, AN affects predominantly young women, while bone loss and fractures are feared complications that are difficult to manage.24 As these individuals usually resist gaining weight, this study attempts to investigate the influence of a high-protein diet on bone mass maintenance.
The present study indicates that under CR, a high-protein diet has a beneficial effect on muscle mass. However, the combined diet can have an additional detrimental impact on the skeleton in comparison to CR, as observed in the μCT scanning results. In line with these results, female rats submitted to CR with a high-protein diet exhibited greater expansion of MAT and significantly higher differentiation of hematopoietic stem cells in the osteoclasts. In addition, the higher expansion of MAT in this combined diet reinforces the potential negative influence of increased protein intake since, in several conditions, bone marrow expansion is associated with bone loss.
Supplementary Material
Acknowledgments
The author thanks Marta Tocico Nakao Maibashi and Maria Valci dos Santos for their valuable technical assistance.
Contributor Information
Beatriz Coimbra Romano, Department of Internal Medicine, Ribeirão Preto Medical School, University of São Paulo, Ribeirão Preto 14.049-900, Brazil.
Iana Mizumukai de Araújo, Department of Internal Medicine, Ribeirão Preto Medical School, University of São Paulo, Ribeirão Preto 14.049-900, Brazil.
Mariana S P Ribeiro, Department of Bio-Molecular Sciences, School of Pharmaceutical Science, University of São Paulo, Ribeirão Preto 14.040-903, Brazil.
Luciana T Parreiras e Silva, Department of Internal Medicine, Ribeirão Preto Medical School, University of São Paulo, Ribeirão Preto 14.049-900, Brazil.
Ingid Dick-de-Paula, Department of Internal Medicine, Ribeirão Preto Medical School, University of São Paulo, Ribeirão Preto 14.049-900, Brazil.
Sandra Y Fukada, Department of Bio-Molecular Sciences, School of Pharmaceutical Science, University of São Paulo, Ribeirão Preto 14.040-903, Brazil.
Felipe Manoel Porto, Department of Internal Medicine, Ribeirão Preto Medical School, University of São Paulo, Ribeirão Preto 14.049-900, Brazil.
Vanda Jorgetti, Department of Internal Medicine, School of Medicine, University of São Paulo, São Paulo 01.246-903, Brazil.
Francisco de Assis Pereira, Division of Endocrinology, Federal University of Sergipe, Aracaju, Sergipe 49.060-108, Brazil.
Lucila Leico Kagohara Elias, Department of Internal Medicine, Ribeirão Preto Medical School, University of São Paulo, Ribeirão Preto 14.049-900, Brazil.
Francisco José Albuquerque de Paula, Department of Internal Medicine, Ribeirão Preto Medical School, University of São Paulo, Ribeirão Preto 14.049-900, Brazil.
Author contributions
Beatriz Coimbra Romano and Iana Mizumukai de Araújo contributed equally to this work.
Beatriz Coimbra Romano and Iana Mizumukai de Araújo: conducted the studies, acquisition of data and data analysis; Mariana S.P. Ribeiro, Luciana T. Parreiras e Silva, Ingid Dick-de-Paula, Sandra Y. Fukada, Felipe Manoel Porto, Vanda Jorgetti, and Francisco de Assis Pereira: data acquisition and interpretation, assisted in methodology and analysis; Lucila Leico Kagohara Elias: concept, protocol review, and approval, assisted in design, methodology, and funding; and Francisco José Albuquerque de Paula: concept, design, data and funding acquisition, formal analyses, drafted and critically revised the manuscript. All authors edited and approved the final version of the manuscript.
Funding
F.J.A.P.: Fundação de Amparo à Pesquisa do Estado de São Paulo (FAPESP) (2018/18071-5), Conselho Nacional de Desenvolvimento Científico e Tecnológico (CNPq) (309 316/2021-9), Fundação de Apoio ao Ensino Pesquisa e Assistência HCFMRP-USP (FAEPA) and I.M.A.: FAPESP (2021/03152-2).
Conflicts of interest
The authors declare no conflict of interest.
Ethical approval
The study protocol was approved by the Animal Care Institutional Ethical Committee of Ribeirão Preto Medical School, University of São Paulo (#83/2018).
Data availability
The data of this study are available from the corresponding author upon request.
References
- 1. Longland TM, Oikawa SY, Mitchell CJ, Devries MC, Phillips SM. Higher compared with lower dietary protein during an energy deficit combined with intense exercise promotes greater lean mass gain and fat mass loss: a randomized trial. Am J Clin Nutr. 2016;103(3):738–746. 10.3945/ajcn.115.119339 [DOI] [PubMed] [Google Scholar]
- 2. Barzel US, Massey LK. Excess dietary protein can adversely affect bone. J Nutr. 1998;128(6):1051–1053. 10.1093/jn/128.6.1051 [DOI] [PubMed] [Google Scholar]
- 3. Bonjour JP. The dietary protein, IGF-I, skeletal health axis. Horm Mol Biol Clin Invest. 2016;28(1):39–53. 10.1515/hmbci-2016-0003 [DOI] [PubMed] [Google Scholar]
- 4. Cao JJ. High dietary protein intake and protein-related acid load on bone health. Curr Osteoporos Rep. 2017;15(6):571–576. 10.1007/s11914-017-0408-6 [DOI] [PubMed] [Google Scholar]
- 5. Madeo F, Carmona-Gutierrez D, Hofer SJ, Kroemer G. Caloric restriction mimetics against age-associated disease: targets, mechanisms, and therapeutic potential. Cell Metab. 2019;29(3):592–610. 10.1016/j.cmet.2019.01.018 [DOI] [PubMed] [Google Scholar]
- 6. Gomes MM, da Silva MMR, de Araújo IM, de Paula FJA. Bone, fat, and muscle interactions in health and disease. Arch Endocrinol Metab. 2022;66(5):611–620. 10.20945/2359-3997000000550 [DOI] [PMC free article] [PubMed] [Google Scholar]
- 7. Vestergaard P, Emborg C, Støving RK, Hagen C, Mosekilde L, Brixen K. Fractures in patients with anorexia nervosa, bulimia nervosa, and other eating disorders--a nationwide register study. Int J Eat Disord. 2002;32(3):301–308. 10.1002/eat.10101 [DOI] [PubMed] [Google Scholar]
- 8. Misra M, Klibanski A. Anorexia nervosa and bone. J Endocrinol. 2014;221(3):R163–R176. 10.1530/JOE-14-0039 [DOI] [PMC free article] [PubMed] [Google Scholar]
- 9. Brook EM, Tenforde AS, Broad EM, et al. Low energy availability, menstrual dysfunction, and impaired bone health: a survey of elite para athletes. Scand J Med Sci Sports. 2019;29(5):678–685. 10.1111/sms.13385 [DOI] [PubMed] [Google Scholar]
- 10. de Paula FJA, Rosen CJ. Structure and function of bone marrow adipocytes. Compr physiol. 2017;8(1):315–349. 10.1002/cphy.c170010 [DOI] [PubMed] [Google Scholar]
- 11. Suchacki KJ, Cawthorn WP, Rosen CJ. Bone marrow adipose tissue: formation, function and regulation. Curr Opin Pharmacol. 2016;28:50–56. 10.1016/j.coph.2016.03.001 [DOI] [PMC free article] [PubMed] [Google Scholar]
- 12. Bredella MA, Fazeli PK, Miller KK, et al. Increased bone marrow fat in anorexia nervosa. J Clin Endocrinol Metab. 2009;94(6):2129–2136. 10.1210/jc.2008-2532 [DOI] [PMC free article] [PubMed] [Google Scholar]
- 13. Fazeli PK, Bredella MA, Freedman L, et al. Marrow fat and preadipocyte factor-1 levels decrease with recovery in women with anorexia nervosa. J Bone Miner Res. 2012;27(9):1864–1871. 10.1002/jbmr.1640 [DOI] [PMC free article] [PubMed] [Google Scholar]
- 14. Bouxsein ML, Boyd SK, Christiansen BA, Guldberg RE, Jepsen KJ, Müller R. Guidelines for assessment of bone microstructure in rodents using micro-computed tomography. J Bone Miner Res. 2010;25(7):1468–1486. 10.1002/jbmr.l141 [DOI] [PubMed] [Google Scholar]
- 15. Cava E, Yeat NC, Mittendorfer B. Preserving healthy muscle during weight loss. Adv Nutr. 2017;8(3):511–519. 10.3945/an.116.014506 [DOI] [PMC free article] [PubMed] [Google Scholar]
- 16. Holt SH, Miller JC, Petocz P, Farmakalidis E. A satiety index of common foods. Eur J Clin Nutr. 1995;49(9):675–690. [PubMed] [Google Scholar]
- 17. Verreijen AM, Engberink MF, Memelink RG, van der Plas SE, Visser M, Weijs PJ. Effect of a high protein diet and/or resistance exercise on the preservation of fat free mass during weight loss in overweight and obese older adults: a randomized controlled trial. Nutr J. 2017;16(1):10. 10.1186/s12937-017-0229-6 [DOI] [PMC free article] [PubMed] [Google Scholar]
- 18. Boutière M, Cottet-Rousselle C, Coppard C, et al. Protein intake in cancer: does it improve nutritional status and/or modify tumour response to chemotherapy? J Cachexia Sarcopenia Muscle. 2023;14(5):2003–2015. 10.1002/jcsm.13276 [DOI] [PMC free article] [PubMed] [Google Scholar]
- 19. Tian Y, Huan Y, Chen L, Peng S, He Z, Wang Q. Effects of protein intake from an energy-restricted diet on the skeletal muscle composition of overweight and obese rats. Sci Rep. 2022;12(1):20396. 10.1038/s41598-022-24961-5 [DOI] [PMC free article] [PubMed] [Google Scholar]
- 20. Lacroix M, Gaudichon C, Martin A, et al. A long-term high-protein diet markedly reduces adipose tissue without major side effects in Wistar male rats. Am J Physiol Regul Integr Comp Physiol. 2004;287(4):R934–R942. 10.1152/ajpregu.00100.2004 [DOI] [PubMed] [Google Scholar]
- 21. Devlin MJ, Cloutier AM, Thomas NA, et al. Caloric restriction leads to high marrow adiposity and low bone mass in growing mice. J Bone Miner Res. 2010;25(9):2078–2088. 10.1002/jbmr.82 [DOI] [PMC free article] [PubMed] [Google Scholar]
- 22. de Paula FJ, Dick-de-Paula I, Bornstein S, et al. VDR haploinsufficiency impacts body composition and skeletal acquisition in a gender-specific manner. Calcif Tissue Int. 2011;89(3):179–191. 10.1007/s00223-011-9505-1 [DOI] [PMC free article] [PubMed] [Google Scholar]
- 23. Quirós Cognuck S, Reis WL, Silva M, et al. Sex differences in body composition, metabolism-related hormones, and energy homeostasis during aging in Wistar rats. Physiol Rep. 2020;8(20):e14597. 10.14814/phy2.14597 [DOI] [PMC free article] [PubMed] [Google Scholar]
- 24. Fazeli PK, Klibanski A. Effects of anorexia nervosa on bone metabolism. Endocr Rev. 2018;39(6):895–910. 10.1210/er.2018-00063 [DOI] [PMC free article] [PubMed] [Google Scholar]
Associated Data
This section collects any data citations, data availability statements, or supplementary materials included in this article.
Supplementary Materials
Data Availability Statement
The data of this study are available from the corresponding author upon request.


