

Abstract
Background
Type 2 diabetes (T2DM) and obesity are characterized by altered insulin metabolism and action. Reduced hepatic insulin clearance is increasingly recognized as a key contributor to hyperinsulinemia and insulin resistance. CEACAM1 promotes hepatic insulin clearance, and its loss in hepatocytes is associated with reduced insulin clearance in mice and men. This study examines whether CEACAM1 circulating levels reflect compromised insulin metabolism and resistance in the PREVADIAB2 cohort.
Methods
A total of 1019 individuals from the PREVADIAB2 cohort were evaluated for diabetes by 75 g‐OGTT and classified according to WHO 2019 criteria. CEACAM1 circulating levels were measured by ELISA, and insulin metabolism parameters were calculated. Hierarchical clustering of insulin metabolic indices and CEACAM1 levels was performed. Statistical significance was assessed using Kruskal–Wallis and Wilcoxon–Mann–Whitney tests.
Results
BMI, insulin resistance (HOMA‐IR), and hepatic steatosis progressively increased with disease severity. Insulin secretion rose and its clearance declined in parallel to circulating CEACAM1 levels in prediabetes and T2DM, indicating compensatory hyperinsulinemia. Hierarchical metabolic clustering identified four clusters with distinct patterns and further showed that insulin clearance positively correlated with circulating CEACAM1, especially in individuals with normoglycemia, lower obesity and hepatic steatosis. This suggests that circulating CEACAM1 can reflect the status of hepatic insulin clearance.
Conclusions
This study demonstrates a progressive increase in insulin resistance and hyperinsulinemia in parallel to elevated BMI and hepatic steatosis prevalence, accompanied by declining circulating CEACAM1 levels. Cluster analysis further linked reduced insulin clearance to lower circulating CEACAM1 levels, suggesting its potential usefulness as a biomarker for metabolic disease progression.
Keywords: CEACAM1, diabetes, hepatic steatosis, hyperinsulinemia, insulin clearance, insulin resistance
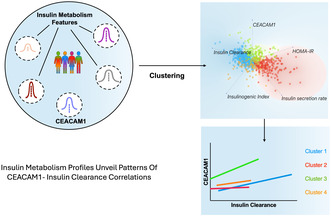
Analysing the intertwining of CEACAM1 and insulin metabolism, this study reveals that the correlation of circulating levels of CEACAM1 and insulin clearance rate is kept in the majority of the population, but it is lost in individuals showing increased insulin secretion or insulin resistance in association with hyperinsulinemia or fatty liver disease. The findings suggest circulating CEACAM1 is a promising component for multi‐biomarker approaches to predict metabolic disease progression.
1. INTRODUCTION
Type 2 diabetes mellitus (T2DM) is characterized by β‐cell dysfunction 1 and insulin resistance that is marked by chronic hyperinsulinemia. 2 The role of impaired hepatic insulin clearance in hyperinsulinemia and in the pathogenesis of T2DM has attracted interest. 2 , 3 Whereas it is commonly known to compensate for insulin resistance together with increased insulin secretion, 4 it has been increasingly recognized as a primary cause of hyperinsulinemia‐driven hepatic insulin resistance. 2 , 5 , 6 , 7 In obese adolescents, the decline in insulin sensitivity was found to be associated with reduced baseline hepatic insulin clearance preceding a progressive decline in β‐cell function. 8 Moreover, impaired insulin clearance has emerged as a risk factor for metabolic syndrome in several ethnic groups. 9 , 10
Carcinoembryonic antigen‐related cell adhesion molecule 1 (CEACAM1) is a surface membrane glycoprotein that belongs to the immunoglobulin superfamily. In the liver, it is predominantly produced in hepatocytes and to a lower extent in liver endothelial, stellate, and Kupffer cells. It is expressed as two alternatively spliced isoforms with the long one, localized to the sinusoidal domain of hepatocytes, 11 undergoing phosphorylation by the insulin receptor tyrosine kinase in response to pulses of insulin to promote its cellular receptor‐mediated endocytosis and extraction. 3 This regulatory role of hepatic CEACAM1 is bolstered by the observation that chronic hyperinsulinemia develops secondarily to reduced hepatic insulin clearance in L‐SACC1 12 and AlbuminCre + Cc1 fl/fl mice 5 , 13 with liver‐specific inactivation and deletion of CEACAM1, respectively. Chronic hyperinsulinemia causes downregulation of the insulin receptor and increases de novo lipogenesis to trigger hepatic insulin resistance and steatosis, respectively. This is followed by increased redistribution of VLDL‐triglycerides to white adipose tissue and resultant visceral obesity. Further emphasizing the critical role of hepatic CEACAM1 is the restoration of insulin clearance, insulin sensitivity, and the normal metabolic phenotype in Cc1 −/− null mice with exclusive reconstitution of CEACAM1 expression in hepatocytes. 14
In humans, several studies proposed that reduced insulin clearance plays a primary role in hyperinsulinemia in obese Chinese adults 15 and children with Metabolic‐Associated Steatotic Liver Disease (MASLD) 16 in the absence of changes to insulin secretion. Likewise, hyperinsulinemia in American 17 and Japanese 18 subjects with MASLD was mainly attributed to reduced hepatic insulin clearance. Potential alterations in hepatic CEACAM1 have been associated with insulin resistance in human disease. For instance, reduction of hepatic CEACAM1 levels was linked to insulin resistance in ~30% of obese South Korean subjects with hepatic steatosis independently of diabetes. 19 Few studies have examined the relationship between plasma CEACAM1 levels and T2DM. A recent study showed a positive association between circulating CEACAM1 levels and insulin sensitivity in patients with gestational diabetes, 20 whereas another showed lower CEACAM1 in these patients or those with T2DM relative to subjects with normal glucose tolerance. 21
To address this gap in knowledge, we herein analysed the relationship between circulating levels of CEACAM1 and insulin metabolism and resistance in participants of the Portugal PREVADIAB2 diabetes prevalence study. 22 , 23
2. METHODS
2.1. Ethics statement
All participants in this study were consented informed volunteers. The Ethics Committee of Associação Protectora dos Diabéticos de Portugal (APDP) approved the protocol. The study adhered to the guidelines of the Declaration of Helsinki and was authorized by the Autoridade Nacional de Proteção de Dados (3228/2013).
2.2. Population
The study population is from participants from PREVADIAB2, a continuation of Portugal's original diabetes prevalence study, PREVADIAB1. 22 , 23 Between 2008 and 2009, 5167 individuals accessing the Portuguese healthcare system were screened for prediabetes and T2DM using an oral glucose tolerance test (OGTT). In 2014, 1084 individuals from PREVADIAB1 were randomly selected for the follow‐up study, excluding 54 who have been diagnosed with T2DM and have been treated with diabetes medications. Additionally, 11 participants were excluded due to a lack of available samples. Consequently, our final study population consists of 1019 individuals.
2.3. Inclusion criteria
Participants were subjected to a 75 g oral glucose challenge, with venous blood samples collected after a 12‐h fasting period (baseline) and at 30 and 120 min post‐glucose administration. This allowed the classification of the subjects as having prediabetes or T2DM, based on the 2019 WHO criteria (https://www.who.int/publications/i/item/classification‐of‐diabetes‐mellitus accessed August 27th, 2024). As such, this study involved 58 patients newly diagnosed with T2DM, 226 participants classified with prediabetes due to impaired fasting glucose (IFG) and/or impaired glucose tolerance (IGT), and 735 subjects had normal glucose tolerance. Moreover, the 30‐min time point was selected, as it allows for the assessment of maximal insulin clearance suppression, typically observed in healthy individuals at this time point. 24
2.4. CEACAM1 quantification
Sera CEACAM1 protein levels were assessed using an ELISA kit. Anti‐CEACAM1 specific monoclonal antibody (B3‐17, 5 μg/mL in PBS, LeukoCom GmbH, Essen, Germany) was used to coat 96‐well plates for 2 h at room temperature (RT). Excess coating antibody was removed, and the wells were blocked with a 1% (w/v) BSA in PBS solution for 4 h at RT and washed with PBS. Then, sera samples were added and left overnight at 4°C. Following another wash with PBS, rabbit anti‐human CEACAM1‐Fc detection antibody (5 μg/mL in PBS‐0.5% BSA, LeukoCom GmbH) was added and left at RT for 2 h and washed with PBS. Goat anti‐rabbit HRP polyclonal antibody (25 ng/mL, DAKO P0448, Agilent Technologies, Glostrup, Denmark) was then added and left at RT for 1.5 h. Following a PBS wash, the chemical reaction was initiated using the chromogenic substrate 3,3′,5,5′‐Tetramethylbenzidine (Santa Clara, California, USA). The plate was kept in the dark, shaking gently at RT for 15–30 min before being stopped with 0.2 M sulfuric acid. Optical density (OD) was measured at 450 and 620 nm as the reference wavelength using a BioTek Synergy HT plate reader. An average of the triplicate readings for each standard (0.625, 1.25, 2.5, 5, 10, 15 and 20 ng/mL), internal control and unknown samples was performed. The average of zero standard OD was subtracted from each value. A standard curve was created for each 96‐well plate with CEACAM1 standards on the y‐axis and absorbance (OD450nm‐OD620nm) on the x‐axis. A polynomial trend curve was drawn through the points, and the concentration of each unknown sample was determined. Reproducibility within the assay was evaluated in eleven independent experiments. Each assay was carried out in triplicates, and the calculated overall intra‐assay coefficient of variation was 9.4%. Assay‐to‐assay reproducibility was evaluated in triplicates in eleven independent experiments, and the calculated overall inter‐assay coefficient of variation was 10.3%.
2.5. Insulin metabolism indices
Insulin secretion rate at fast (fast‐ISR, pmol/min) and insulinogenic index (IGI) were used to evaluate insulin secretion. As described, 25 Fast‐ISR was estimated from insulin and C‐peptide levels as previously reported using a two compartmental model with population parameters 26 and IGI was calculated as (Insulin 30 min − Insulin 0 min)/(Glucose 30 min − Glucose 0 min). 27 Fasting insulin clearance (Fast‐IC, l/min) was determined as the ratio of peripheral insulin disposal rates and circulating insulin concentrations, as previously described, 26 and Homeostatic Model Assessment of Insulin Resistance (HOMA‐IR) was used to determine fasting insulin resistance. 28
2.6. Cluster analysis
Multidimensional stratification of the PREVADIAB2 population used insulin metabolic indices and circulating CEACAM1 levels. Fast‐ISR was used as a measure of insulin secretion during fasting, IGI to assess insulin secretion during the first phase of the OGTT, Fast‐IC to determine fasting insulin clearance, and HOMA‐IR served as a measure of systemic insulin resistance. Data variables were centered and scaled. The agglomerative hierarchical clustering algorithm used Euclidean distances and the Ward method implemented in the Orange data mining package (Version 3.37). The optimal number of clusters was determined using the NbClust package in R, utilizing the majority rule method (Figure S1).
2.7. Statistical analyses
Group median comparisons (glycemic phenotypes and clusters) were analysed using the Kruskal–Wallis test and Wilcoxon–Mann–Whitney test for continuous variables. Statistical analysis was conducted using GraphPad Prism 9 software, and results were reported as median and interquartile range (IQR). A p‐value <.05 was considered statistically significant. Pearson correlation (r coefficient and p‐value), regression analysis and slope 95% confidence intervals were calculated and plotted using GraphPad Prism 9 software.
3. RESULTS
3.1. Metabolic characterization of the PREVADIAB2 population
The PREVADIAB2 study, conducted in 2014, evaluated glucose tolerance by a 2 h‐OGTT in Portuguese individuals from the national public healthcare system, who had been identified without diabetes 5 years earlier. In the present study, we evaluated a cross‐sectional sample of 1019 subjects with a median age of 62 years and 60% women (Table 1). This includes individuals with normoglycemia (72%), prediabetes (22%) and newly diagnosed T2DM (6%) (Table 1). As Table 1 indicates, blood glucose levels at baseline (0 min) and at 30 and 120 min post‐oral glucose challenge increased gradually as the disease progressed.
TABLE 1.
Profiling of the PREVADIAB2 population according to glycemic phenotypes.
| All | Normoglycemia | Prediabetes | T2DM | |
|---|---|---|---|---|
| Total, n (%) | 1019 | 735 (72%) | 226 (22%) | 58 (6%) |
| Age, Years | 62 (17) | 60 (16) | 66 (13) | 71 (16) |
| a***, b*** | ||||
| BMI, Kg/m2 | 27 (6) | 26 (5) | 28 (6) | 29 (8) |
| a***, b*** | ||||
| Glucose 0 min, mmol/L | 5.0 (.9) | 4.9 (.7) | 5.5 (1.2) | 6.1 (1.6) |
| a***, b*** | c*** | |||
| Glucose 30 min, mmol/L | 8.4 (2.4) | 8.0 (2.0) | 9.6 (2.2) | 10.7 (2.3) |
| a***, b*** | c** | |||
| Glucose 120 min, mmol/L | 6.1 (2.6) | 5.5 (1.7) | 8.4 (1.4) | 12.0 (2.2) |
| a***, b*** | c** | |||
| FLI ≥60, n (%) | 332 (33%) | 192 (26%) | 105 (46%) | 35 (60%) |
| HOMA‐IR | 1.4 (1.4) | 1.2 (1.1) | 1.9 (1.8) | 2.5 (2.9) |
| a***, b*** | ||||
| Insulin 0 min, μIU/mL | 6.2 (5.9) | 5.8 (5.0) | 8.5 (7.2) | 10.0 (10.1) |
| a***, b*** | ||||
| C‐peptide 0 min, ng/mL | 2.1 (1.0) | 2.0 (.9) | 2.4 (1.4) | 2.7 (1.6) |
| a***, b*** | ||||
| Fast‐ISR, pmol/min | 152 (86) | 143 (79) | 180 (111) | 215 (125) |
| a***, b*** | ||||
| IGI | .65 (.73) | .73 (.81) | .45 (.46) | .26 (.37) |
| a***, b*** | c** | |||
| CEACAM1, ng/mL | 29.2 (11.5) | 29.8 (11.2) | 26.6 (12.2) | 27.3 (11.1) |
| a***, b* | ||||
| Fast‐IC, L/min | 4.0 (2.0) | 4.0 (1.9) | 3.8 (1.8) | 4.2 (2.5) |
| a* | ||||
| OGTT insulin clearance | .17 (.08) | .17 (.08) | .16 (.08) | .18 (.10) |
| a* |
Note: Parameters are reported as median and (Interquartile Range, IQR) (continuous variables) or counts (and percent of column) for categorical variables. Comparison between glycemic phenotypes was performed with one‐way ANOVA, Kruskal–Wallis test for continuous variables. Summary statistics: aNormoglycemia versus Prediabetes, bNormoglycemia versus Diabetes and cPrediabetes versus Diabetes, where *p < .05, **p < .01, ***p < .001.
Abbreviations: HOMA‐IR, Homeostatic Model Assessment of Insulin Resistance; IC, insulin clearance; IGI, Insulinogenic Index; ISR, insulin secretion rate; T2DM, Type 2 diabetes mellitus.
We observed substantial differences in the metabolic profiles of participants when analysed according to their glycemic status. As anticipated, participants with prediabetes and with recently diagnosed T2DM exhibited several distinct metabolic characteristics compared to those with normoglycemia. Specifically, the body mass index (BMI) increased with disease progression, as often associated with increased adiposity, hepatic steatosis and insulin resistance. Consistently, the prevalence of fatty liver index (FLI) increased from 26% in subjects with normoglycemia to 46% in subjects with prediabetes and 60% in individuals with recent T2DM diagnosis (Table 1). Consistently, HOMA‐IR progressively increased together with circulating insulin levels with advanced disease, indicating the development of systemic insulin resistance.
3.2. Insulin secretion in the PREVADIAB2 population
As hyperglycemia intensified and insulin resistance progressed, fasting insulin secretion (Fast‐ISR) and C‐peptide levels, a marker of insulin production, increased (Table 1). Together, this indicates a compensatory increase in insulin secretion secondary to insulin resistance.
The insulinogenic index (IGI), a measure of early‐phase insulin secretion in response to a glucose stimulus, progressively declined until it reached ~60% and ~35% that of normoglycemic individuals in patients with prediabetes and T2DM, respectively (Table 1). This suggests that subjects with T2DM have diminished capacity for a timely insulin release, which is a hallmark of b‐cell dysfunction (Table 1).
3.3. Circulating CEACAM1 levels in the PREVADIAB2 population
Circulating CEACAM1 levels were lower in subjects with prediabetes and with T2DM relative to subjects with normoglycemia (Figure 1 and Table 1). This was associated with a reduction in insulin clearance, as assessed during fasting (Fast‐IC) and post‐oral glucose challenge (OGTT Insulin Clearance) in subjects with prediabetes relative to those with normoglycemia (Table 1). In this cohort, circulating CEACAM1 levels did not change during the OGTT (Figure S2). Of note, insulin clearance was not reduced in individuals recently diagnosed with T2DM. Collectively, this highlights the importance of glycemic status in evaluating circulating CEACAM1 levels as well as the complex relationship between glucose and CEACAM1 in the regulation of insulin turnover.
FIGURE 1.
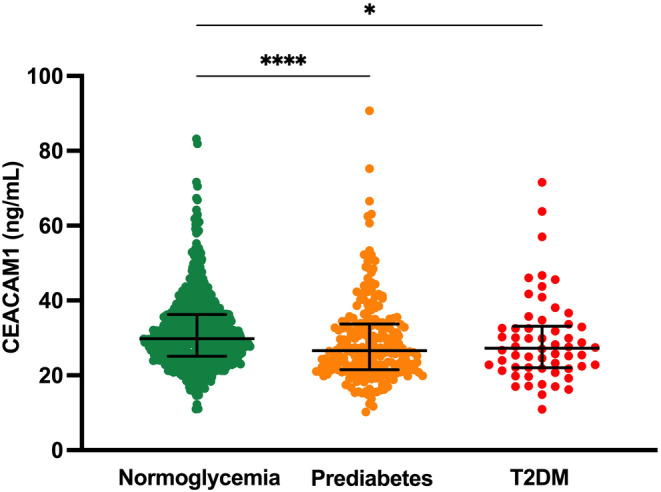
CEACAM1 circulating levels in the PREVADIAB2 cohort (n = 1019 subjects). Subjects with normoglycemia (green), prediabetes (orange) and type 2 diabetes (T2DM, red). Comparison between the three groups was performed with One‐way ANOVA, Kruskal–Wallis test, *p < .05, ****p < .0001.
3.4. Insulin metabolism‐based clustering including circulating CEACAM1 levels
Next, we characterized changes to circulating CEACAM1 levels under different conditions of insulin metabolism/action. To this end, we introduced circulating CEACAM1 levels as a feature in a multidimensional analysis associated with the pathophysiology of dysglycemia related to changes in insulin homeostasis (insulin secretion and insulin clearance) and action (insulin resistance). Data projection of hierarchical clustering highlights the four predominant clusters identified within the PREVADIAB2 cohort (Figure 2). This visualization elucidates the underlying heterogeneity within the cohort. Nonetheless, it emphasizes the closer relationship between circulating CEACAM1 levels and fasting insulin clearance (Fast‐IC) rather than insulin secretion and how this contributes to the regulation of insulin sensitivity/resistance (HOMA‐IR). This observation recapitulates the positive relationship between hepatic CEACAM1 and insulin clearance, as has been demonstrated by impairment of insulin clearance causing insulin resistance in Cc1 −/− mice with global Ceacam1 gene deletion that manifest intact insulin secretion despite loss of Ceacam1 from pancreatic β‐cells. 29
FIGURE 2.
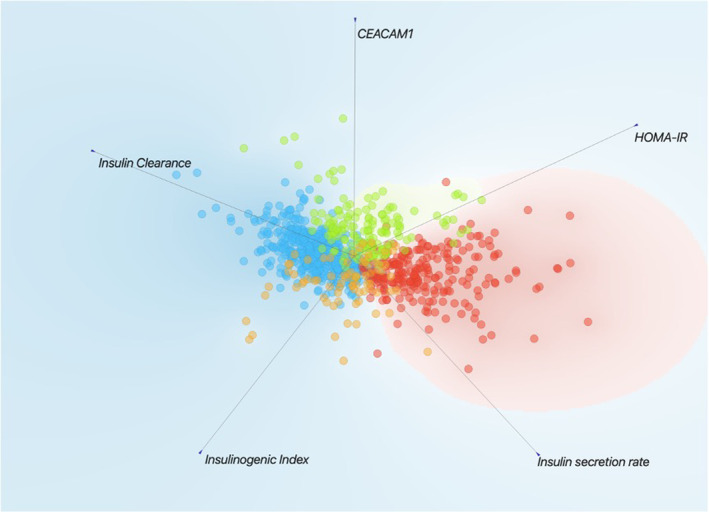
CEACAM1 circulating levels as a distinctive feature in insulin metabolism profiling. Data projection of hierarchical clustering results using the FreeViz tool implemented in the Orange package (Version 3.37) and illustrating the four major clusters within the PREVADIAB2 cohort, using Euclidean distances calculated from standardize distributions of CEACAM1, fasting insulin clearance, Insulinogenic index, Insulin secretion rate, and HOMA‐IR after adjusting for age and sex as appropriate. Cluster 1 (blue), Cluster 2 (red), Cluster 3 (green) and Cluster 4 (orange).
The distinct metabolic profiles that characterize each cluster are summarized in Table 2. Noteworthy fasting baseline glucose levels were normal ranging from 4.8 mmol/L, in Cluster 4 to 5.4 mmol/L, in Cluster 2. Except for Cluster 4 that included predominantly subjects with normoglycemia, the other clusters included individuals with glucose intolerance and T2DM (as indicated by >5.7–6.9 mmol/L at 120 min post‐OGTT) (Table 2). Because 51% of this cohort fell in Cluster 1 and 25% in Cluster 2, we started by comparing their metabolic parameters that have been adjusted for sex and age. Interestingly, these clusters were in general, at both ends of the metabolic spectrum of all 4 clusters, with Cluster 1 exhibiting the lowest and Cluster 2 the highest BMI, prevalence of elevated fatty liver index (FLI), HOMA‐IR, circulating insulin and C‐peptide levels, and Fast‐ISR. In contrast, Cluster 1 exhibited the highest insulin clearance at fasting (Fast‐IC) and during the 2 h‐OGTT, as opposed to Cluster 2 that exhibited the lowest. Whereas circulating CEACAM1 levels were not the highest in Cluster 1, they were higher than in Cluster 2, which exhibited the lowest circulating CEACAM1 levels in parallel to the lowest insulin clearance (Table 2). Collectively, these data show that in 51% of the population (as in Cluster 1), high insulin clearance correlated with insulin sensitivity and low obesity and fat deposition in the liver. In the absence of insulin resistance, there is no need for a compensatory increase in insulin secretion in this cluster. In contrast, in 25% of the population (as in Cluster 2) that exhibited the highest insulin resistance and BMI, insulin secretion increased substantially in parallel to a reduction in insulin clearance, likely to compensate for insulin resistance. Together, this caused hyperinsulinemia in individuals in Cluster 2 relative to those in Cluster 1. Individuals in Clusters 3 and 4 exhibited a higher insulin resistance than those in Cluster 1, together with higher insulin secretion (fast‐ISR) and IGI. However, despite higher circulating CEACAM1 levels, insulin clearance was lower than in Cluster 1. Once again, the increase in insulin secretion with the decrease in insulin clearance would lead to a compensatory increase in insulin levels by comparison to Cluster 1. Consistent with insulin resistance, BMI was higher in parallel to increased prevalence of hepatic steatosis in Clusters 3 and 4 than Cluster 1 subjects. Comparison between Cluster 3 and 2 showed a similar comparison to that between Cluster 1 and 2 insofar as BMI, the prevalence of fatty liver index (FLI), HOMA‐IR, circulating insulin and C‐peptide levels, and Fast‐ISR are lower in Cluster 3 than 2 whereas CEACAM1 levels and insulin clearance at fasting (Fast‐IC) and during the 2 h‐OGTT are higher than Cluster 2 (Table 2). Of note, Cluster 4 was distinguished by a notably high insulinogenic index, indicative of the pancreas's enhanced capacity to secrete insulin in response to glucose. This could contribute to the lowest glucose levels in this cluster (Table 2).
TABLE 2.
Profiling of the PREVADIAB 2 according to insulin metabolism clusters.
| All | Cluster 1 | Cluster 2 | Cluster 3 | Cluster 4 | |
|---|---|---|---|---|---|
| Total, n (%) | 945 | 480 (51%) | 233 (25%) | 157 (17%) | 75 (8%) |
| Age, Years | 62 (17) | 62 (16) | 64 (16) | 62 (19) | 59 (14) |
| BMI, Kg/m2 | 27 (6) | 26 (4) | 30 (6) | 27 (5) | 27 (6) |
| a *** , b *** , c* | d *** , e *** | ||||
| Glucose 0 min, mmol/L | 5.0 (0.8) | 4.9 (.7) | 5.4 (.9) | 5.0 (.8) | 4.8 (.6) |
| a*** | d***, e*** | f* | |||
| Glucose 30 min, mmol/L | 8.4 (2.3) | 8.1 (1.9) | 9.4 (2.4) | 8.8 (2.0) | 6.6 (1.4) |
| a***, b***, c*** | d*, e*** | f*** | |||
| Glucose 120 min, mmol/L | 6.0 (2.6) | 5.7 (2.2) | 6.9 (3.1) | 6.4 (2.4) | 5.1 (1.8) |
| a***, b*, c*** | d*, e*** | f*** | |||
| FLI ≥60, n (%) | 311 (33%) | 91 (19%) | 136 (58%) | 61 (39%) | 23 (31%) |
| HOMA‐IR | 1.4 (1.3) | .97 (.5) | 2.9 (1.4) | 1.7 (.9) | 1.8 (.9) |
| a***, b***, c*** | d***, e*** | ||||
| Insulin 0 min, μIU/mL | 6.2 (5.6) | 4.4 (2.2) | 12.1 (5.0) | 7.5 (3.8) | 8.7 (4.1) |
| a***, b***, c*** | d***, e*** | ||||
| C‐peptide 0 min, ng/mL | 2.1 (1.0) | 1.7 (.6) | 3.0 (1.2) | 2.2 (.9) | 2.1 (.6) |
| a***, b***, c*** | d***, e*** | ||||
| Fast‐ISR, pmol/min | 151 (84) | 127 (48) | 231 (106) | 157 (75) | 163 (64) |
| a***, b***, c*** | d***, e*** | ||||
| IGI | .67 (.72) | .57 (.49) | .77 (.67) | .64 (.56) | 2.4 (1.1) |
| a***, c*** | d*, e*** | f*** | |||
| CEACAM1, ng/mL | 29.0 (11.0) | 27.5 (8.6) | 26.3 (8.6) | 41.7 (13.7) | 30.0 (9.1) |
| a*, b***, c** | d***, e*** | f*** | |||
| Fast‐IC, L/min | 4.0 (2.0) | 4.9 (1.9) | 3.1 (1.0) | 3.5 (1.4) | 3.4 (1.2) |
| a***, b***, c*** | d* | ||||
| OGTT insulin clearance | .17 (.08) | .20 (.07) | .13 (.05) | .16 (.07) | .13 (.05) |
| a***, b***, c*** | d*** | f*** |
Note: Profiling parameters are reported as median and (Interquartile Range, IQR) (continuous variables) or counts (and percent of column) for categorical parameters. In bold are the parameters use to inform the cluster analysis. Comparison between clusters was performed with one‐way ANOVA, Kruskal–Wallis test for continuous variables. Summary statistics: aCluster 1 versus Cluster 2, bCluster 1 versus Cluster 3, cCluster 1 versus Cluster 4, dCluster 2 versus Cluster 3, eCluster 2 versus Cluster 4 and fCluster 3 versus Cluster 4, where *p < .05, **p < .01, ***p < .001.
Abbreviations: FLI, Fatty Liver Index; HOMA‐IR, Homeostatic Model Assessment of Insulin Resistance; IC, insulin clearance; IGI, Insulinogenic Index; ISR, insulin secretion rate.
3.5. Linear correlation between circulating CEACAM1 levels and insulin clearance
Insulin clearance is a critical factor in maintaining insulin homeostasis and is mechanistically linked to hepatic CEACAM1. Although circulating CEACAM1 can originate from different cells, hepatocytes are likely to be a major contributor. Thus, we further assessed the relationship between insulin clearance and circulating CEACAM1 levels across the four clusters. The scatter plot in Figure 3A illustrates distinct patterns of distribution within the CEACAM1/insulin clearance correlation space across the clusters. This observation was further supported by linear regression analysis (Figure 3B). Notably, Clusters 1 and 3 demonstrated a more positive correlation between insulin clearance and CEACAM1 levels relative to Clusters 2 and 4. However, as noted above, circulating CEACAM1 levels were the lowest in parallel to the lowest insulin clearance in Cluster 2 (Table 2).
FIGURE 3.
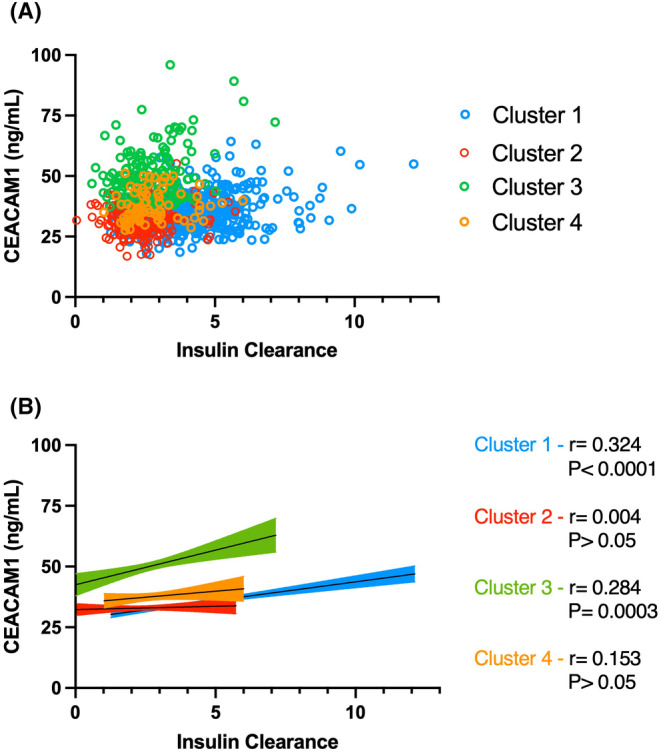
Correlation of circulating CEACAM1 levels and fasting insulin clearance in insulin metabolism clusters. (A) Scatter plot of CEACAM1 circulating levels and fasting insulin clearance in PREVADIAB2 individuals ascribed to different insulin metabolism clusters (as described in Figure 2). (B) Cluster‐wise linear fitting of CEACAM1 circulating levels and fasting insulin clearance, indicating Spearman correlation coefficient (r) and significance level (P).
4. DISCUSSION
In obese individuals, 30 , 31 chronic hyperinsulinemia results from increased insulin secretion 32 and reduced insulin clearance, 33 , 34 , 35 , 36 to compensate for peripheral insulin resistance. Furthermore, recent studies in humans and animal models showed that obesity 15 and MASLD 18 are characterized by reduced hepatic insulin clearance as a cause of hyperinsulinemia, 2 , 5 , 15 , 17 , 18 and identified insulin clearance as a determinant of systemic insulin sensitivity. 5 , 18 Moreover, elevated fasting insulin levels have recently been proposed as a predictor of MASLD progression to T2DM. 37
Consistently, the current study revealed that after adjusting for age and sex, participants in Portugal's PREVADIAB2 study who had prediabetes or were newly diagnosed with T2DM manifested higher circulating insulin levels and systemic insulin resistance relative to those with normoglycemia. Hyperinsulinemia in these subjects resulted from increased insulin secretion as well as reduced insulin clearance (assessed at fasting and in response to glucose challenge). Interestingly, BMI and the prevalence of hepatic steatosis increased as the disease progressed (46%–60% in prediabetes‐diabetes vs. 26% in subjects with normoglycemia). In parallel, circulating CEACAM1 levels gradually declined with the progression of the disease. The stronger correlation between circulating CEACAM1 levels and insulin clearance in individuals with normoglycemia than in subjects with glucose intolerance could stem from the declined ability of insulin to induce CEACAM1 expression 38 and its phosphorylation by the insulin receptor 39 with the onset of glucose intolerance and insulin resistance. This could lower CEACAM1‐mediated sequestration of the insulin/insulin receptor complex and disturb its targeting to the degradation process. In addition, impaired glucose tolerance is a transition state, so it is likely that individual heterogeneity also played a role in reducing the strength of the association. Nonetheless, the similarity of this metabolic profile to that of mice with liver‐specific deletion of Ceacam1 5 , 13 that manifested hyperinsulinemia and resultant insulin resistance secondarily to reduced insulin clearance raises the possibility that low circulating CEACAM1 levels reflect low hepatic CEACAM1 content in the PREVADIAB2 cohorts with prediabetes and T2DM.
To further address whether circulating CEACAM1 could constitute a marker of metabolic disease progression, we conducted a hierarchical clustering of the PREVADIAB2 cohort, using circulating CEACAM1 levels as a feature in a multidimensional analysis associated with insulin homeostasis and action. The analysis revealed four distinct clusters, with a notably significant positive correlation between insulin clearance and circulating CEACAM1 levels in Clusters 1 and 3, representing 51% and 17% of the study population, respectively. Nonetheless, the degree of correlation between circulating CEACAM1 and insulin clearance in Clusters 1 and 3 is relatively low. This could be due to clustering patients based on available clinical data, from which neither the trajectory nor the duration of the disease can be imputed. As noted above, it can also be partly related to the heterogeneity in the compensatory increase in insulin secretion among individuals with glucose intolerance.
The analysis also revealed that as BMI and the prevalence of hepatic steatosis increased, insulin resistance and hyperinsulinemia became more pronounced, particularly in Cluster 2, with a lower degree observed in Clusters 3 and 4. Importantly, hyperinsulinemia resulted from increased insulin secretion and reduced insulin clearance (fast‐ISR and IC in Clusters 2, 3 and 4 relative to Cluster 1). Further emphasizing the relationship between insulin clearance and circulating CEACAM1 levels is the lowest circulating CEACAM1 levels as well as the lowest insulin clearance in Cluster 2 subjects who exhibited the highest BMI and prevalence of hepatic steatosis relative to the other clusters. This was observed in parallel to the highest insulin resistance (HOMA‐IR), basal glucose levels and glucose intolerance that triggered the highest compensatory insulin secretion rate in subjects of this cluster. Given that Cluster 1 represents 51% and Cluster 2 includes 25% of the participants in the study, the data collectively demonstrate a strong relationship between circulating levels of CEACAM1 and insulin clearance. Thus, the study indicates a reduction of circulating CEACAM1 as a non‐invasive surrogate diagnostic marker for reduced insulin clearance in combination with high circulating fasting insulin levels, particularly in obese patients with MASLD who are at a high risk of developing T2DM. The findings also implicate hyperinsulinemia and reduced insulin clearance in the progression of MASLD, specially in the context of T2DM and its advancement, as has been recently reported in a study performed on 50 participants between 45 and 65 years of age with a BMI distribution similar to that of the cohort in our study. 40
4.1. Strengths and weaknesses
The strength of this study is that it examined a large cohort that provided a critical platform to test the hypothesis that like its hepatic counterpart, low circulating CEACAM1 content is a marker of compromised insulin clearance and the progression of insulin resistance. However, few weaknesses should be noted. First, the findings are correlative. Second, the association between circulating CEACAM1 and insulin clearance differs among the four clusters. The low strength of the observed correlation could stem partly from the potential implication of additional mechanisms that may oversee the complex biological process of insulin clearance. These include the involvement of insulin‐degrading enzyme 7 , 41 and the degree of the contribution of renal insulin clearance. 42 Third, because this is a cross‐sectional study, it is hard to assess the temporal relationship between insulin clearance and insulin secretion changes in the different clusters. Fourth, our studies are limited to a single cohort, and further validation in additional ethnic groups will be required to test the robustness of the findings. If the findings are reproducible in other groups, low circulating levels of CEACAM1 could become a non‐invasive diagnostic tool to detect systemic insulin resistance and predisposition to diabetes.
In conclusion, reduced insulin clearance is associated with lower circulating CEACAM1 levels, highlighting its potential use as a novel and valuable biomarker for monitoring the progression of metabolic diseases. By serving as an early indicator of impaired insulin metabolism, CEACAM1 could play a crucial role in identifying individuals at increased risk of developing conditions such as MASLD and T2DM. Its non‐invasive nature further strengthens its utility as a diagnostic tool in clinical settings.
AUTHOR CONTRIBUTIONS
Conceptualization and supervision of PREVADIAB2 study: JFR and MPM; PREVADIAB2 administration, RTR and JFR. Conceptualization of the study: CP‐G, SMN and MPM. Methodology: RSP, MJM, VS, BBG and CP‐G. Formal analysis: RSP, MJM, LH, AG, CP‐G, SMN and MPM. Discussion: RSP, CP‐G, SMN and MPM. Writing–original draft preparation: RSP, CP‐G, SMN and MPM. Writing–review and editing: RSP, MJM, HEG, SD, CP‐G, SMN and MPM. All authors have read and agreed to the published version of the manuscript. Funding acquisition: SMN and MPM. Except for the late BBS, who passed away before the preparation of the manuscript, all authors critically edited the manuscript and approved the final version. SMN and MPM are the guarantors of this work and, as such, had full access to all the data in the study and take responsibility for the integrity of the data and the accuracy of the data analysis.
CONFLICT OF INTEREST STATEMENT
AG has served as a consultant and participated in advisory boards for Boehringer Ingelheim and Novo Nordisk, Eli‐Lilly, Fractyl, Pfizer, Merck‐MSD and Metadeq; and received speaker's honorarium or other fees from Eli‐Lilly, Novo Nordisk and Pfizer. All other authors report they have no conflicts of interest.
Supporting information
Figure S1.
Figure S2.
ACKNOWLEDGEMENTS
The authors thank the study participants for commitment and loyalty. The authors would like to acknowledge the guidance of the late PD Dr. Bernhard B. Singer, PhD and from Verena Schmitt, PhD from the Universitätsklinikum, Essen, Germany for their guidance on setting up the ELISA analysis of circulating CEACAM1 levels. This study was supported by “Fundação para a Ciência e a Tecnologia” – iNOVA4Health (UIDB/Multi/04462/2020), by the European Commission, Horizon Europe Framework Programme, PAS GRAS (Grant agreement n. 101080329) and by the Sociedade Portuguesa de Diabetologia. The study was also partly supported by grants from the US National Institutes of Health [R01‐DK054254 and R01‐MD012579] and from the Osteopathic Heritage Foundation J.J. Kopchick, PhD, Endowed Eminent Research Chair to SMN.
Patarrão RS, Meneses MJ, Ghadieh HE, et al. Insights into circulating CEACAM1 in insulin clearance and disease progression: Evidence from the Portuguese PREVADIAB2 study. Eur J Clin Invest. 2024;54(Suppl. 2):e14344. doi: 10.1111/eci.14344
Sonia M. Najjar and M. Paula Macedo equally contributed to the work.
Contributor Information
Sonia M. Najjar, Email: najjar@ohio.edu.
M. Paula Macedo, Email: paula.macedo@nms.unl.pt.
DATA AVAILABILITY STATEMENT
All relevant data within this manuscript will be shared upon reasonable request to the corresponding author.
REFERENCES
- 1. Abel ED, Gloyn AL, Evans‐Molina C, et al. Diabetes mellitus‐Progress and opportunities in the evolving epidemic. Cell. 2024;187(15):3789‐3820. doi: 10.1016/j.cell.2024.06.029 [DOI] [PMC free article] [PubMed] [Google Scholar]
- 2. Najjar SM, Caprio S, Gastaldelli A. Insulin clearance in health and disease. Annu Rev Physiol. 2023;85:363‐381. doi: 10.1146/annurev-physiol-031622-043133 [DOI] [PubMed] [Google Scholar]
- 3. Najjar SM, Perdomo G. Hepatic insulin clearance: mechanism and physiology. Phys Ther (Bethesda). 2019;34(3):198‐215. doi: 10.1152/physiol.00048.2018 [DOI] [PMC free article] [PubMed] [Google Scholar]
- 4. de Oliveira DM, Tura A, Vasques ACJ, et al. Insulin resistance in congenital adrenal hyperplasia is compensated for by reduced insulin clearance. J Clin Endocrinol Metab. 2021;106(4):e1574‐e1585. doi: 10.1210/clinem/dgab010 [DOI] [PubMed] [Google Scholar]
- 5. Zaidi S, Asalla S, Muturi HT, et al. Loss of CEACAM1 in hepatocytes causes hepatic fibrosis. Eur J Clin Investig. 2024;54(7):e14177. doi: 10.1111/eci.14177 [DOI] [PMC free article] [PubMed] [Google Scholar]
- 6. Bergman RN, Kabir M, Ader M. The physiology of insulin clearance. Int J Mol Sci. 2022;23(3):1826. doi: 10.3390/ijms23031826 [DOI] [PMC free article] [PubMed] [Google Scholar]
- 7. Borges DO, Patarrao RS, Ribeiro RT, et al. Loss of postprandial insulin clearance control by insulin‐degrading enzyme drives dysmetabolism traits. Metabolism. 2021;118:154735. doi: 10.1016/j.metabol.2021.154735 [DOI] [PubMed] [Google Scholar]
- 8. Galderisi A, Polidori D, Weiss R, et al. Lower insulin clearance parallels a reduced insulin sensitivity in obese youths and is associated with a decline in beta‐cell function over time. Diabetes. 2019;68(11):2074‐2084. doi: 10.2337/db19-0120 [DOI] [PMC free article] [PubMed] [Google Scholar]
- 9. Shah MH, Piaggi P, Looker HC, Paddock E, Krakoff J, Chang DC. Lower insulin clearance is associated with increased risk of type 2 diabetes in native Americans. Diabetologia. 2021;64(4):914‐922. doi: 10.1007/s00125-020-05348-5 [DOI] [PubMed] [Google Scholar]
- 10. Lee CC, Haffner SM, Wagenknecht LE, et al. Insulin clearance and the incidence of type 2 diabetes in Hispanics and African Americans: the IRAS family study. Diabetes Care. 2013;36(4):901‐907. doi: 10.2337/dc12-1316 [DOI] [PMC free article] [PubMed] [Google Scholar]
- 11. Sundberg U, Beauchemin N, Obrink B. The cytoplasmic domain of CEACAM1‐L controls its lateral localization and the organization of desmosomes in polarized epithelial cells. J Cell Sci. 2004;117(Pt 7):1091‐1104. doi: 10.1242/jcs.00944 [DOI] [PubMed] [Google Scholar]
- 12. Poy MN, Yang Y, Rezaei K, et al. CEACAM1 regulates insulin clearance in liver. Nat Genet. 2002;30(3):270‐276. doi: 10.1038/ng840 [DOI] [PubMed] [Google Scholar]
- 13. Ghadieh HE, Russo L, Muturi HT, et al. Hyperinsulinemia drives hepatic insulin resistance in male mice with liver‐specific Ceacam1 deletion independently of lipolysis. Metabolism. 2019;93:33‐43. doi: 10.1016/j.metabol.2019.01.008 [DOI] [PMC free article] [PubMed] [Google Scholar]
- 14. Russo L, Muturi HT, Ghadieh HE, et al. Liver‐specific reconstitution of CEACAM1 reverses the metabolic abnormalities caused by its global deletion in male mice. Diabetologia. 2017;60(12):2463‐2474. doi: 10.1007/s00125-017-4432-y [DOI] [PMC free article] [PubMed] [Google Scholar]
- 15. Fu Z, Wu Q, Guo W, et al. Impaired insulin clearance as the initial regulator of obesity‐associated hyperinsulinemia: novel insight into the underlying mechanism based on serum bile acid profiles. Diabetes Care. 2022;45(2):425‐435. doi: 10.2337/dc21-1023 [DOI] [PubMed] [Google Scholar]
- 16. Jiang L, Lai J, Xu X, et al. Reduced insulin clearance in paediatric metabolic (dysfunction)‐associated fatty liver disease and its dual role in beta‐cell offload and diabetes risk. Diabetes Obes Metab. 2024;26:5390‐5398. doi: 10.1111/dom.15902 [DOI] [PubMed] [Google Scholar]
- 17. Bril F, Lomonaco R, Orsak B, et al. Relationship between disease severity, hyperinsulinemia, and impaired insulin clearance in patients with nonalcoholic steatohepatitis. Hepatology. 2014;59(6):2178‐2187. doi: 10.1002/hep.26988 [DOI] [PubMed] [Google Scholar]
- 18. Matsubayashi Y, Yoshida A, Suganami H, et al. Role of fatty liver in the association between obesity and reduced hepatic insulin clearance. Diabetes Metab. 2018;44(2):135‐142. doi: 10.1016/j.diabet.2017.12.003 [DOI] [PubMed] [Google Scholar]
- 19. Lee W. The CEACAM1 expression is decreased in the liver of severely obese patients with or without diabetes. Diagn Pathol. 2011;6:40. doi: 10.1186/1746-1596-6-40 [DOI] [PMC free article] [PubMed] [Google Scholar]
- 20. Wu Y, Yang Z, Zhu L, Su Q, Qin L. Association of circulating CEACAM1 levels and insulin sensitivity in gestational diabetes mellitus. BMC Endocr Disord. 2020;20(1):66. doi: 10.1186/s12902-020-00550-3 [DOI] [PMC free article] [PubMed] [Google Scholar]
- 21. Kopylov AT, Kaysheva AL, Papysheva O, et al. Association of proteins modulating immune response and insulin clearance during gestation with antenatal complications in patients with gestational or type 2 diabetes mellitus. Cells. 2020;9(4):1032. doi: 10.3390/cells9041032 [DOI] [PMC free article] [PubMed] [Google Scholar]
- 22. Gardete‐Correia L, Boavida JM, Raposo JF, et al. First diabetes prevalence study in Portugal: PREVADIAB study. Diabet Med. 2010;27(8):879‐881. doi: 10.1111/j.1464-5491.2010.03017.x [DOI] [PubMed] [Google Scholar]
- 23. Pina AF, Patarrao RS, Ribeiro RT, et al. Metabolic footprint, towards understanding type 2 diabetes beyond glycemia. J Clin Med. 2020;9(8):2588. doi: 10.3390/jcm9082588 [DOI] [PMC free article] [PubMed] [Google Scholar]
- 24. Natali A, Ribeiro R, Baldi S, et al. Systemic inhibition of nitric oxide synthesis in non‐diabetic individuals produces a significant deterioration in glucose tolerance by increasing insulin clearance and inhibiting insulin secretion. Diabetologia. 2013;56(5):1183‐1191. doi: 10.1007/s00125-013-2836-x [DOI] [PubMed] [Google Scholar]
- 25. Meneses MJ, Patarrao RS, Pinheiro T, et al. Leveraging the future of diagnosis and management of diabetes: from old indexes to new technologies. Eur J Clin Investig. 2023;53(4):e13934. doi: 10.1111/eci.13934 [DOI] [PubMed] [Google Scholar]
- 26. Gastaldelli A, Abdul Ghani M, DeFronzo RA. Adaptation of insulin clearance to metabolic demand is a key determinant of glucose tolerance. Diabetes. 2021;70(2):377‐385. doi: 10.2337/db19-1152 [DOI] [PMC free article] [PubMed] [Google Scholar]
- 27. Seltzer HS, Allen EW, Herron AL Jr, Brennan MT. Insulin secretion in response to glycemic stimulus: relation of delayed initial release to carbohydrate intolerance in mild diabetes mellitus. J Clin Invest. 1967;46(3):323‐335. doi: 10.1172/JCI105534 [DOI] [PMC free article] [PubMed] [Google Scholar]
- 28. Wallace TM, Levy JC, Matthews DR. Use and abuse of HOMA modeling. Diabetes Care. 2004;27(6):1487‐1495. doi: 10.2337/diacare.27.6.1487 [DOI] [PubMed] [Google Scholar]
- 29. DeAngelis AM, Heinrich G, Dai T, et al. Carcinoembryonic antigen‐related cell adhesion molecule 1: a link between insulin and lipid metabolism. Diabetes. 2008;57(9):2296‐2303. doi: 10.2337/db08-0379 [DOI] [PMC free article] [PubMed] [Google Scholar]
- 30. Jones CN, Abbasi F, Carantoni M, Polonsky KS, Reaven GM. Roles of insulin resistance and obesity in regulation of plasma insulin concentrations. Am J Physiol Endocrinol Metab. 2000;278:E501‐E508. [DOI] [PubMed] [Google Scholar]
- 31. Jung SH, Jung CH, Reaven GM, Kim SH. Adapting to insulin resistance in obesity: role of insulin secretion and clearance. Diabetologia. 2018;61(3):681‐687. doi: 10.1007/s00125-017-4511-0 [DOI] [PMC free article] [PubMed] [Google Scholar]
- 32. Ferrannini E. The stunned beta cell: a brief history. Cell Metab. 2010;11(5):349‐352. doi: 10.1016/j.cmet.2010.04.009 [DOI] [PubMed] [Google Scholar]
- 33. Kotronen A, Juurinen L, Tiikkainen M, Vehkavaara S, Yki‐Jarvinen H. Increased liver fat, impaired insulin clearance, and hepatic and adipose tissue insulin resistance in type 2 diabetes. Gastroenterology. 2008;135(1):122‐130. [DOI] [PubMed] [Google Scholar]
- 34. Kaga H, Tamura Y, Takeno K, et al. Correlates of insulin clearance in apparently healthy non‐obese Japanese men. Sci Rep. 2017;7(1):1462. doi: 10.1038/s41598-017-01469-x [DOI] [PMC free article] [PubMed] [Google Scholar]
- 35. Asare‐Bediako I, Paszkiewicz RL, Kim SP, et al. Variability of directly measured first‐pass hepatic insulin extraction and its association with insulin sensitivity and plasma insulin. Diabetes. 2018;67(8):1495‐1503. doi: 10.2337/db17-1520 [DOI] [PMC free article] [PubMed] [Google Scholar]
- 36. Goodarzi MO, Cui J, Chen YD, Hsueh WA, Guo X, Rotter JI. Fasting insulin reflects heterogeneous physiological processes: role of insulin clearance. Am J Physiol Endocrinol Metab. 2011;301(2):E402‐E408. doi: 10.1152/ajpendo.00013.2011 [DOI] [PMC free article] [PubMed] [Google Scholar]
- 37. Harrison SA, Dubourg J, Knott M, Colca J. Hyperinsulinemia, an overlooked clue and potential way forward in metabolic dysfunction‐associated steatotic liver disease. Hepatology. 2023;10‐97. doi: 10.1097/HEP.0000000000000710 [DOI] [PubMed] [Google Scholar]
- 38. Najjar S, Boisclair Y, Nabih Z, et al. Cloning and characterization of a functional promoter of the rat pp120 gene, encoding a substrate of the insulin receptor tyrosine kinase. J Biol Chem. 1996;271(15):8809‐8817. [DOI] [PubMed] [Google Scholar]
- 39. Ramakrishnan SK, Khuder SS, Al‐Share QY, et al. PPARalpha (peroxisome proliferator‐activated receptor alpha) activation reduces hepatic CEACAM1 protein expression to regulate fatty acid oxidation during fasting‐refeeding transition. J Biol Chem. 2016;291(15):8121‐8129. doi: 10.1074/jbc.M116.714014 [DOI] [PMC free article] [PubMed] [Google Scholar]
- 40. Gignac T, Trepanier G, Pradeau M, et al. Metabolic‐associated fatty liver disease is characterized by a post‐oral glucose load hyperinsulinemia in individuals with mild metabolic alterations. Am J Physiol Endocrinol Metab. 2024;326(5):E616‐E625. doi: 10.1152/ajpendo.00294.2023 [DOI] [PubMed] [Google Scholar]
- 41. Merino B, Fernandez‐Diaz CM, Parrado‐Fernandez C, et al. Hepatic insulin‐degrading enzyme regulates glucose and insulin homeostasis in diet‐induced obese mice. Metabolism. 2020;113:154352. doi: 10.1016/j.metabol.2020.154352 [DOI] [PMC free article] [PubMed] [Google Scholar]
- 42. Pina AF, Borges DO, Meneses MJ, et al. Insulin: trigger and target of renal functions. Front Cell Dev Biol. 2020;8:519. doi: 10.3389/fcell.2020.00519 [DOI] [PMC free article] [PubMed] [Google Scholar]
Associated Data
This section collects any data citations, data availability statements, or supplementary materials included in this article.
Supplementary Materials
Figure S1.
Figure S2.
Data Availability Statement
All relevant data within this manuscript will be shared upon reasonable request to the corresponding author.