Abstract
Salinity affects large areas of agricultural land, and all major crop species are intolerant to high levels of sodium ions. The principal route for Na+ uptake into plant cells remains to be identified. Non-selective ion channels and high-affinity potassium transporters have emerged as potential pathways for Na+ entry. A third candidate for Na+ transport into plant cells is a low-affinity cation transporter represented by the wheat protein LCT1, which is known to be permeable for a wide range of cations when expressed in yeast (Saccharomyces cerevisiae). To investigate the role of LCT1 in salt tolerance we have used the yeast strain G19, which is disrupted in the genes encoding Na+ export pumps and as a result displays salt sensitivity comparable with wheat. After transformation with LCT1, G19 cells became hypersensitive to NaCl. We show that LCT1 expression results in a strong decrease of intracellular K+/Na+ ratio in G19 cells due to the combined effect of enhanced Na+ accumulation and loss of intracellular K+. Na+ uptake through LCT1 was inhibited by K+ and Ca2+ at high concentrations and the addition of these ions rescued growth of LCT1-transformed G19 on saline medium. LCT1 was also shown to mediate the uptake of Li+ and Cs+. Expression of two mutant LCT1 cDNAs with N-terminal truncations resulted in decreased Ca2+ uptake and increased Na+ tolerance compared with expression of the full-length LCT1. Our findings strongly suggest that LCT1 represents a molecular link between Ca2+ and Na+ uptake into plant cells.
Salinity affects large areas of agricultural land as a result of intensive irrigation. Although a diverse range of plant species thrives on saline soils, all major crop species are intolerant to high levels of salt. Sodium ions in particular are toxic to living cells if accumulated in the cytoplasm. Considerable progress in understanding plant salt tolerance at a cellular level has been made in the areas of signal transduction (Liu and Zhu, 1998; Halfter et al., 2000; Liu et al., 2000), H+-coupled Na+ export (Apse et al., 1999; Shi et al., 2000), and compatible solutes (Rentsch et al., 1996; Nuccio et al., 1998). Although there remains uncertainty regarding the principle pathway by which Na+ enters root cells, electrophysiological and molecular studies have started to reveal possible routes for Na+ uptake in plants.
Electrophysiological investigations have uncovered the presence of non-selective cation channels in the plasma membrane of various cell types and plant species (Amtmann and Sanders, 1999; Tyerman and Skerett, 1999). These channels are freely Na+ permeable; although, to date, their molecular identities remain unknown. High-affinity transporters might also play a role in Na+ uptake. At a molecular level, HKT1 was originally identified, in a yeast (Saccharomyces cerevisiae) functional complementation screen of a wheat cDNA library, as a cDNA encoding a high-affinity K+ transporter (Schachtman and Schroeder, 1994). It was subsequently shown that HKT1 is a K+-Na+ symporter that can mediate low-affinity Na+ transport at high external Na+ (Rubio et al., 1995; Gassmann et al., 1996), and a HKT1 homolog from Arabidopsis has recently been reported as functioning solely as a Na+ transporter (Uozumi et al., 2000). Nevertheless, the membrane location and function of HKT1 in planta have yet to be established.
A further possible pathway for Na+ uptake might be encoded by the LCT1 gene. LCT1 was cloned from a wheat cDNA library by functional complementation of a yeast strain defective in high-affinity K+ uptake (Anderson et al., 1992; Schachtman et al., 1997). In contrast to HKT1, LCT1 conferred K+ uptake capacity only at K+ concentrations of 1 mm K+ and above, indicating relatively low affinity for K+. LCT1 has no homology with any protein described to date, although the predicted secondary structure, with eight to 10 membrane-spanning domains, clearly indicates a membrane location. Southern analysis shows that the LCT4 gene is present in the wheat genome and LCT1-mRNA was detected by reverse transcriptase-PCR in wheat leaf and root tissue (Schachtman et al., 1997). In accordance with the notion that LCT1 encodes a plasma membrane cation transporter, LCT1-transformed yeast cells exhibit increased unidirectional influx of a wide range of cations including not only K+, Na+, and Ca2+, but also various heavy metals (Schachtman et al., 1997; Clemens et al., 1998).
The observation that LCT1 mediates Na+ influx led to the suggestion that LCT1 plays a role in salt sensitivity of wheat (Schachtman et al., 1997). However, to support a role of LCT1 in salinity stress, four fundamental questions remain to be answered. Is LCT1-mediated Na+ uptake at high external Na+ concentrations (>10 mm) large enough to cause salt toxicity? Does LCT1-mediated transport of other cations, i.e. K+, counter-balance or aggravate physiological consequences of Na+ uptake? What is the effect of external Ca2+ on LCT1-mediated Na+ uptake? In which membrane and cell types is LCT1 located in planta?
Attempts to identify the subcellular localization of LCT1 using antibodies and GFP-fusion constructs unfortunately have so far been unsuccessful (D.P. Schachtman, unpublished data). In a similar manner, the first three questions cannot be studied in planta since transformation and gene inactivation are still problematic in wheat. We, therefore, continued to use yeast as a heterologous expression system for LCT1. Yeast has proven to be a useful model system with respect to salt toxicity targets and signaling pathways involved in salt tolerance (Serrano, 1996; Serrano et al., 1999). Since wild-type yeast is very salt tolerant due to effective Na+ export by the plasma membrane-located Na+ pumps ENA1 through 4 (Haro et al., 1991, 1993), our experiments were carried out with the yeast strain G19, which is disrupted in the ENA1-4 genes (Quintero et al., 1996). G19 cells are similar to plant cells in that they possess the Na+/H+ antiport systems, NHA1 and NHX1, residing in the plasma membrane and the tonoplast, respectively (Nass et al., 1997; Bañuelos et al., 1998), as well as efficient K+ uptake systems, TRK1 and 2 (Gaber et al., 1988; Ko and Gaber 1991). As a result, the salt sensitivity of G19 is comparable with that of wheat. We show here that expression of LCT1 in G19 cells leads to salt hypersensitivity due to increased accumulation of intracellular Na+ and net loss of intracellular K+. Low concentrations of external Ca2+ did not alleviate LCT1-induced salt stress, but Na+ uptake was inhibited by high concentrations of Ca2+ as well as K+ and Cs+.
The lack of general homology between LCT1 and known proteins precludes predictions regarding domains involved in transport function or regulation. The N terminus of LCT1 hosts the only domain that has homology to known motifs: a sequence rich in Pro, Glu, Ser, and Thr (PEST) sequence was recognized with high score between amino acids 123 and 140 (Schachtman et al., 1997). PEST sequences have been correlated with rapid degradation of proteins and it has been suggested that they represent recognition sites for specific proteases (Rogers et al., 1986; Rechsteiner and Rogers, 1996). It is tempting to hypothesize that N-terminal protein cleavage at the PEST sequence is involved in regulation of LCT1 (Schachtman et al., 1997). To test this hypothesis we have constructed N-terminal deletion mutants of LCT1 that mimic protein cleavage at the PEST site. We found that yeast strains transformed with N-terminal-deleted cDNAs exhibited decreased uptake capacity for Na+ and Ca2+. The results are discussed with respect to future engineering of salt tolerance in wheat.
RESULTS
LCT1-Transformed Yeast Cells Are Hypersensitive to Na+ and Li+
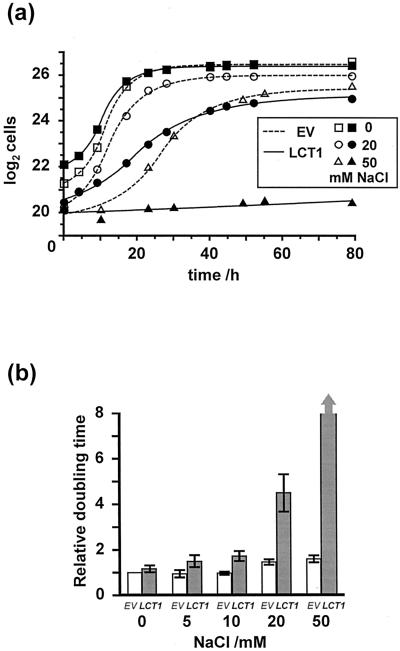
The genes encoding plasma membrane Na+ export pumps have been deleted in the yeast strain G19 and, therefore, it is more sensitive to external Na+ concentration than wild-type yeast (Bañuelos et al., 1998). Any gene product facilitating Na+ uptake into G19 cells should further increase salt sensitivity. LCT1-transformed cells were significantly more sensitive to elevated external concentrations of Na+ than cells transformed with the empty plasmid (EV). Figure 1 shows typical growth curves and mean doubling times during exponential growth for EV- and LCT1-transformed cells in liquid Arg phosphate (AP) medium containing 1 mm KCl, 0.2 mm CaCl2, and various concentrations of NaCl. Growth of LCT1-transformed cultures was similar to growth of control cultures when no NaCl was present, but strongly reduced in 20 mm NaCl. No growth of LCT1-transformed cultures occurred in 50 mm NaCl, whereas control cultures still grew well in these conditions.
Figure 1.
Salt sensitivity of G19 yeast transformed with LCT1. a, Typical growth of LCT1-transformed G19 cultures (black symbols and lines) and G19 cultures transformed with the empty pYES2 plasmid (EV, white symbols and dashed lines) in liquid AP medium containing 1 mm KCl, 0.2 mm CaCl2, and various concentrations of NaCl. b, Mean doubling times of G19 cultures transformed with EV (white bars) and LCT1 (black bars) in various concentrations of NaCl. Data are standardized with respect to the doubling times of EV cultures in Na+-free medium in the same experiment. Values for LCT1-transformed cultures in 50 mm NaCl were >100. Means of nine, three, four, five, and three experiments (for 0, 5, 10, 20, and 50 mm NaCl, respectively) ± se.
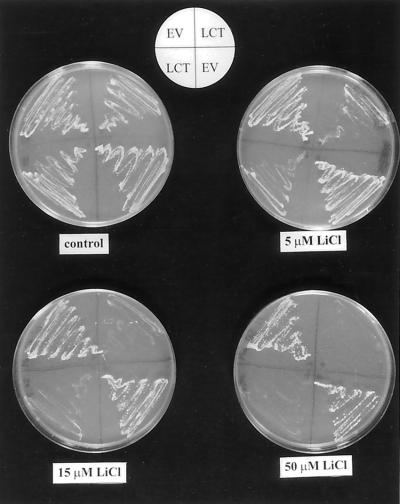
Lithium is toxic to all living cells at very low cytoplasmic concentrations binding to Na+-sensitive enzymes with high affinity (Serrano, 1996). In wild-type yeast, Li+ is removed from the cytoplasm by the ENA pumps, and G19 cells are more sensitive to Li+ than wild-type yeast (Haro et al., 1991). Figure 2 shows that transformation with LCT1 further increased Li+ sensitivity of the yeast mutant strain. External LiCl inhibited growth of LCT1-transformed yeast at concentrations as low as 5 μm, whereas EV-transformed yeast grew well with 50 μm LiCl in the growth medium.
Figure 2.
Li+ hypersensitivity of LCT1-transformed cells. Growth of G19 cells transformed with EV and LCT1 on plates containing AP medium with different concentrations of LiCl. Note that growth of LCT1-transformed cells is reduced at Li+ concentrations as low as 5 μm.
LCT1-Transformed Yeast Accumulates Significantly More Sodium Than EV-Transformed Cells
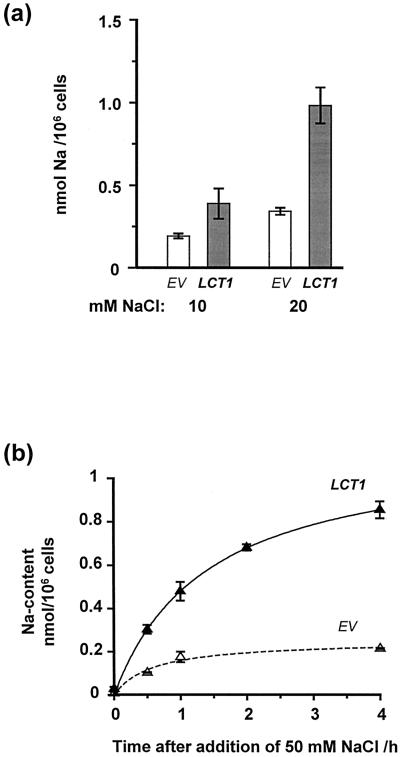
Reduced growth of LCT1-transformed cells in saline medium correlated with increased Na+ contents of the cells. Figure 3a demonstrates that after growth of the cultures in liquid AP medium with 10 mm or 20 mm NaCl, LCT1-transformed cells contained two or three times more Na+ than the controls. Figure 3b shows the time course of Na+ accumulation in LCT1-transformed cells and controls over the first 4 h after the addition of 50 mm NaCl. For this experiment cultures were grown to the early stationary phase in Na+-free AP medium before 50 mm NaCl was added. Net Na+ uptake rates during the first 30 min and Na+ accumulation after 4 h were increased by factors of three and four in LCT1-transformed cells compared with control cells. Enhanced Na+ uptake by LCT1-transformed cells was not due to cell death, as viability of yeast during salt exposure was confirmed by methylene-blue staining.
Figure 3.
Na+ content of LCT1-transformed cells after growth in NaCl-containing media. a, Intracellular Na+ content of G19 cultures transformed with EV (white bars) or LCT1 (black bars) after growth in liquid AP medium containing 10 or 20 mm NaCl. For this experiment, precultures of G19 cells grown in Na+-free medium were diluted to an OD600 of 0.05 and were exposed to different NaCl concentrations. Two days later cells were harvested in the stationary phase. Means of three experiments ± sem are shown. b, Time course of Na+ accumulation in EV- (dashed curve) and LCT1- (black curve) transformed cells after addition of 50 mm NaCl. Prior to the experiment, the cultures had grown to the early stationary phase in Na+-free liquid AP medium. Means of three experiments ± se are shown.
LCT1-Transformed Yeast Cells Lose More Potassium upon Salt Treatment Than EV-Transformed Cells
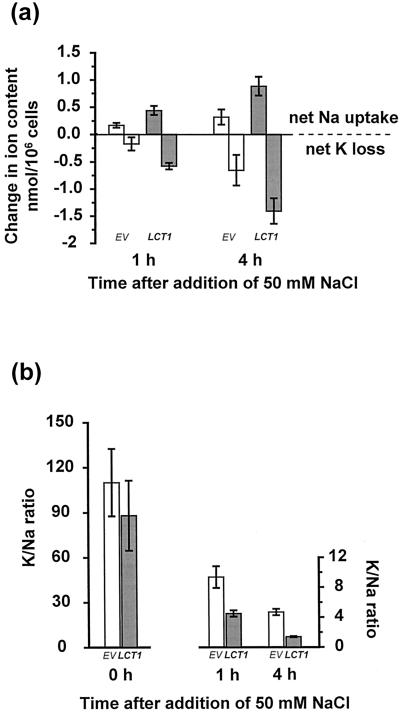
It is the intracellular K+/Na+ ratio rather than simply the absolute intracellular concentration of Na+ that determines salt tolerance in yeast and plant cells. To investigate the possible role of K+ in enhanced salt sensitivity of LCT1-transformed cells we measured cellular K+ content in normal growth conditions (1 mm K+) and during salinity stress (1 mm K+ + 50 mm Na+). When grown without NaCl in the medium, there was no significant difference in the K+ contents of EV- and LCT1-transformed cells. Addition of 50 mm Na+ to the external medium caused not only a rise of intracellular Na+, but also a net loss of intracellular K+ (Fig. 4a). This decrease in intracellular K+ was significantly larger in LCT1-transformed cells than in EV-transformed cells. Net uptake of Na+ and net loss of K+ upon salt treatment resulted in dramatically smaller intracellular K+/Na+ ratios in LCT1-transformed cells than in control cells (Fig. 4b). Addition of 50 mm KCl instead of NaCl did not change intracellular K+ contents (data not shown). Addition of 50 mm KCl together with 50 mm NaCl decreased Na+ uptake (see below) and K+ loss, but K+/Na+ ratios were still lower in LCT1-transformants than in EV-transformed cells (data not shown).
Figure 4.
Changes in Na+ and K+ content of LCT1-transformed cells after addition of 50 mm NaCl. a, Net Na+ uptake and K+ loss of G19 cells transformed with EV (white bars) or LCT1 (black bars) at 1 and 4 h after addition of 50 mm NaCl. Values were calculated by subtracting Na+ and K+ contents at time 0 from Na+ and K+ contents at the given time. Means of five experiments ± sem are shown. b, Intracellular K+/Na+ ratios in G19 cells transformed with EV (white bars) and LCT1 (black bars) before and after addition of 50 mm NaCl. Means of five experiments ± se are shown.
Effect of Other Cations on LCT1-Induced Na+ Uptake and Salt Sensitivity
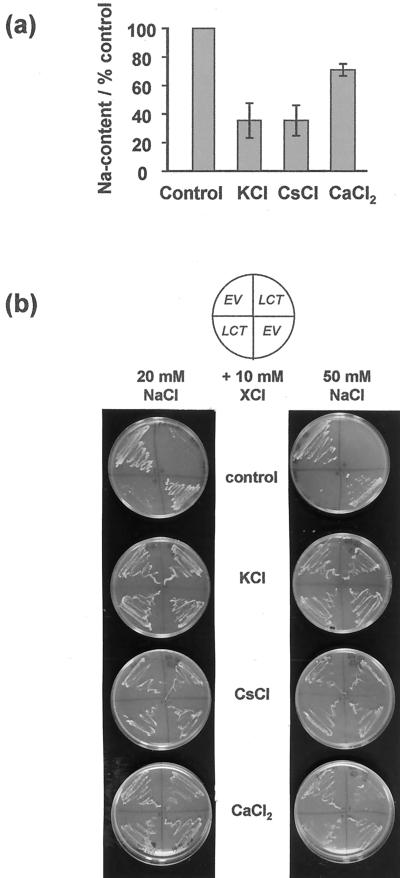
To further investigate the interaction between Na+ and other cations in LCT1-transformed cells, intracellular Na+ contents of yeast in liquid culture were measured after incubation in 50 mm NaCl, added alone or with 50 mm KCl, CsCl, or CaCl2. Figure 5a shows that LCT1-induced Na+ accumulation was strongly inhibited by KCl and CsCl, which reduced Na+ contents by more than 60%, whereas Ca2+ decreased Na+ accumulation only by about 25%. The same tendency was found for Na+ accumulation through endogenous transporters in EV-transformed cells, but ses were large due to the small absolute Na+ contents in these cells (data not shown). In accordance with the measured decrease of LCT1-induced Na+ accumulation by liquid cultures, addition of KCl, CsCl, or CaCl2 restored growth of LCT1-transformed yeast on agar plates with elevated NaCl concentrations (Fig. 5b). With 10 mm CsCl or CaCl2, LCT1-transformed yeast could grow at NaCl concentrations up to 50 mm. 10 mm KCl allowed growth of LCT1-transformed cells even at 100 mm NaCl (data not shown). Addition of KCl and CaCl2 also increased the Na+ tolerance of EV- transformed cells.
Figure 5.
Effect of K+, Cs+, and Ca2+ on Na+ contents and Na+ sensitivity of LCT1-transformed cells. a, Na+ contents of LCT1-transformed G19 cells 7 h after addition of 50 mm NaCl alone (control) or together with 50 mm KCl, CsCl or CaCl2. Values are standardized with respect to Na+ contents in 50 mm NaCl with no other cations added. Means of three experiments ± se are shown. b, Addition of 10 mm KCl, CsCl, or CaCl2 restores growth of LCT1-transformed cells on agar plates containing AP medium with 20 or 50 mm NaCl added.
Growth of LCT1 transformants on plates containing 50 μm LiCl was restored by addition of KCl and CaCl2, but not by addition of NaCl (all 10 mm, data not shown). Ca2+ concentrations lower than 10 mm did not rescue growth of LCT1-transformed cultures in media containing 50 μm Li+ or 50 mm Na+ (data not shown).
Deletion of the N Terminus Alleviates LCT1-Induced Phenotypes
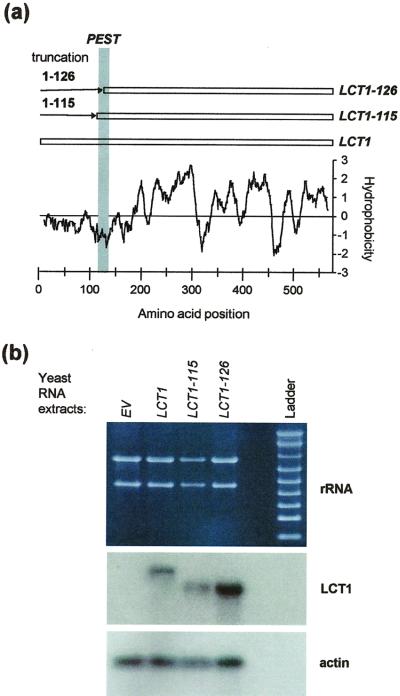
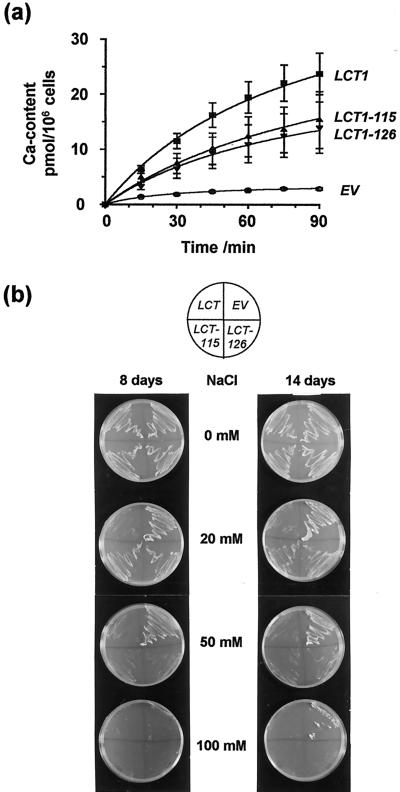
The predicted LCT1 protein sequence has no overall homology to any other known protein and, therefore, predictions about functionally important regions are difficult. Only the hydrophilic N terminus hosts a known motif, a so-called PEST sequence, which may represent a recognition site for proteases (Rogers et al., 1986; Schachtman et al., 1997). To mimic N-terminal protein cleavage at this site we constructed mutant clones of LCT1 in which the N terminus was cleaved at two positions in the PEST sequence (Fig. 6a). Transcription of the constructs was verified by northern analysis of transformed G19 cells (Fig. 6b). Taking into account the amounts of RNA blotted onto nitrocellulose membrane (indicated by total rRNA and actin mRNA), transcription of the two LCT1 truncations appeared to be similar to the transcription of the full-length LCT1, although expression of LCT1-126 may be slightly higher. For analysis of the mutants we first used a yeast strain, here called JKmc, which is deleted in MID1 and CCH1, two yeast genes involved in Ca2+ influx and Ca2+-dependent mating processes (Iida et al., 1994; Fischer et al., 1997). Ca2+ uptake, which is usually very small in JKmc cells, is significantly enhanced by LCT1, as determined in flux experiments with 45Ca2+ (Fig. 7a, compare with Clemens et al., 1998). Transformation of JKmc with N-terminally truncated LCT1 showed decreased rates of 45Ca2+ uptake compared with the full-length LCT1 transformants, but 45Ca2+ uptake was still larger than in control cells (Fig. 7a). We were interested to find out whether this phenotype of N-terminally truncated LCT1 clones was maintained in G19 cells. G19 cells transformed with LCT1-115 and LCT1-126 were significantly less sensitive to salt than cells transformed with full-length LCT1. At high external NaCl concentrations (50 mm), neither of yeast-expressing the truncated LCT1 constructs grew, indicating that the mutant cDNAs are translated into functional proteins. However, at intermediate NaCl concentrations (20 mm), cells transformed with LCT1-115 and LCT1-126 grew consistently better than yeast containing full-length LCT1 (Fig. 7b). Our results indicate that Ca2+ and Na+ uptake are reduced in the mutant LCT1 transformants compared with full-length LCT1 transformants.
Figure 6.
Construction of N terminally truncated LCT1 genes and expression in yeast. a, Positions of PEST sequence and N-terminal truncations on the hydropathy plot of LCT1. b, Agarose-formamide gel and northern blots of total RNA extracted from G19 cells transformed with EV (first lane), full length LCT1 (second lane), and N-terminal truncations LCT1-115 (third lane), and LCT1-126 (fourth lane). Top, Bands for ribosomal RNA on agarose-formaldehyde gel. Middle, Hybridization of blot with LCT1 probe. Bottom, Hybridization with actin probe. Note that differences in band intensities for LCT1 constructs are mainly due to different loading.
Figure 7.
Ca2+ uptake and Na+ sensitivity of yeast cells transformed with wild-type LCT1 or N-terminally truncated LCT1 genes. a, 45Ca2+ uptake of JKmc cells transformed with EV, wild-type LCT1, or N-terminally truncated LCT1 genes (LCT1-115, LCT1-126, compare with Fig. 6) in liquid uracil-free synthetic medium (SD) medium containing 100 μm CaCl2. Means of nine experiments ± se are shown. b, Growth of G19 cells transformed with EV, wild-type LCT1, or N-terminally truncated LCT1 (LCT-115 and LCT-126) on plates containing AP medium with various concentrations of NaCl. Note that the truncated LCT1 constructs resemble EV on 20 mm NaCl and LCT1 on higher NaCl. Growth after 8 and 14 d is shown to demonstrate sustainability of phenotypes.
DISCUSSION
Uptake of Na+, Li+, and Cs+ by LCT1
We have shown here that heterologous expression of LCT1 induces salt hypersensitivity in a salt-sensitive yeast mutant strain. Poor growth of the LCT1 transformants at NaCl concentrations above 20 mm was clearly correlated with increased levels of intracellular Na+ and, therefore, in yeast, LCT1 is localized in the plasma membrane where it directly mediates or facilitates Na+ uptake into the cell. Stabilization of intracellular Na+ levels can be explained with Na+ export through Na+/H+ antiporters in the plasma membrane and tonoplast (Nass et al., 1997; Bañuelos et al., 1998). Medium acidification during culture growth probably further increases Na+ extrusion by Nha1.
LCT1 also facilitates the uptake of Li+ and Cs+ across the plasma membrane of transformed yeast cells. Li+ is known to be very toxic when present in the cytoplasm (Serrano, 1996). The toxic effect of external Li+ on LCT1-transformed cells was still visible at medium concentrations as low as 5 μm even though Ca2+ and K+ were present at 40 and 200 times higher concentrations than Li+, respectively (see Fig. 2). The fact that Na+ did not rescue growth of LCT1-transformed yeast on Li+ confirms that Li+ acts as a “hypersodium” ion, exacerbating its toxic effect at the same sites as Na+. Thus, even if Na+ competes for Li+ in uptake, the resulting additive toxic effect of both ions remains the same.
Inhibition of Na+ uptake by equimolar concentrations of Cs+ indicates permeability of LCT1 for Cs+. Contamination of soils over large areas of Europe with caesium radioisotopes after the accident at the nuclear power plant at Chernobyl in 1986 has been a major concern. Radioactive Cs+ enters the food chain via accumulation in plants. A recent review on Cs+ uptake by plants postulates that voltage-independent non-selective ion channels, as well as high-affinity K+ transporters, are the main pathways for Cs+ entry into plant roots (White and Broadley, 2000). It appears that in addition to the aforementioned transporters, LCT1 has to be considered with respect to low-affinity uptake of Cs+ in wheat. Cs+ has been reported to inhibit plant growth (White and Broadley, 2000). It is interesting that in our experiments, high concentrations of Cs+ were not toxic for yeast (see Fig. 5b). A possible explanation is that Cs+ toxicity in plants is primarily indirect via blockage of K+ uptake through Cs+-sensitive, K+ inward-rectifying channels (Ichida and Schroeder, 1996). This channel type is not present in yeast (Rodríguez-Navarro, 2000).
Role of K+ in LCT1-Induced Salt Stress
Beneficial effects of K+ uptake through LCT1 on salt-stressed yeast only occurred when the K+/Na + ratio in the external medium was greater than 0.1. Under these conditions, LCT1-mediated K+ uptake had a dual effect, inhibition of Na+ transport through LCT1 and maintenance of high intracellular K+ levels. As a result, K+ was more effective in rescuing salt-hypersensitive cells than other cations.
At low external K+/Na+ ratios, the physiological effect of LCT1-induced Na+ accumulation was aggravated by decreased levels of intracellular K+, indicating exchange of intracellular K+ by Na+. K+ efflux may occur through LCT1 itself or via K+/H+ exchange by Nha1 (Bañuelos et al., 1998) or, if the membrane is depolarized, through the K+ outward-rectifying channel Tok1 (Ketchum et al., 1995; Bertl et al., 1998). The fact that K+ loss was always slightly larger than Na+ accumulation points to a sustained membrane depolarization upon NaCl exposure in accordance with a very positive electrochemical equilibrium potential for Na+.
An intracellular K+/Na+ ratio of >0.5 has been shown to be required for growth of yeast (Camacho et al., 1981). A similar, if not higher, cytoplasmic K+/Na+ ratio is probably necessary for the functioning of metabolically active plant cells. In fact, K+ deficiency and low cytoplasmic K+/Na+ ratio are considered to be major components of plant salt stress (Maathuis and Amtmann, 1999; Schachtman and Liu, 1999). LCT1-induced K+ loss and its contribution to a low intracellular K+/Na+ ratio in yeast exemplifies the inverse effects that one non-selective low-affinity transporter can exert on Na+ and K+ contents of a cell when external K+/Na+ ratios are low. This finding is highly relevant for plant cells, which possess a similar suite of K+ efflux pathways as yeast (Rodríguez-Navarro, 2000).
Na+ and Ca2+ Transport through LCT1
High affinity block (KI = 0.3 mm) of 22Na+ uptake by external Ca2+ has been reported for wheat roots (Davenport et al., 1997; see below). Rb+ and Cd2+ uptake through LCT1 has also been found to be blocked by very low external Ca2+ concentrations (Schachtman et al., 1997; Clemens et al., 1998). However, since Rb+ and Cd2+ themselves were used in low concentrations, these experiments could not distinguish between high-affinity block and competitive inhibition. In our study, LCT1-induced salt hypersensitivity and Na+ uptake at high external Na+ concentrations (20–50 mm) were not affected by external Ca2+ concentrations below 10 mm, indicating that Ca2+ inhibition of cation transport through LCT1 does not represent a high-affinity block, but is most probably due to competition.
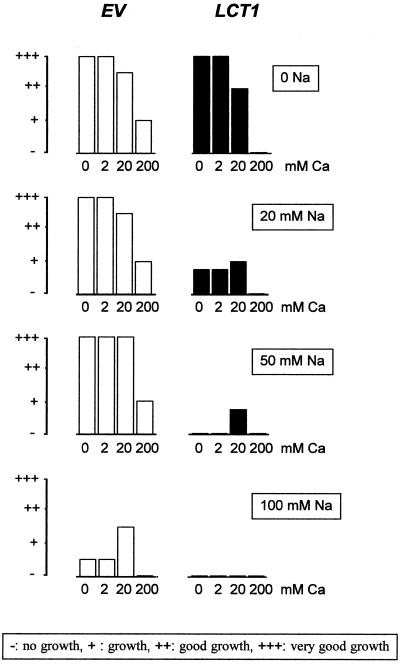
High concentrations of external Ca2+ are toxic for yeast and it has been shown that LCT1 induces hypersensitivity toward Ca2+ in the yeast strain INVSc1 (Clemens et al., 1998). In G19 we also observed an increase of Ca2+ sensitivity after transformation with LCT1, but much higher Ca2+ concentrations than in the previous study were needed to provoke growth reduction. Figure 8 summarizes three major findings concerning the effects of Na+ and Ca2+ on transformed G19: LCT1 increases the Na+ sensitivity of G19, LCT1 increases the Ca2+ sensitivity of G19, and external Ca2+ alleviates the Na+ sensitivity only when present in high (but sublethal) concentrations. Induction of Na+ and Ca2+ hypersensitivity are specifically linked to the presence of LCT1, whereas the beneficial influence of Ca2+ on Na+ sensitivity is a general phenomenon observed in EV- and LCT1-transformed cells.
Figure 8.
Combined effects of Na+ toxicity, Ca2+ rescue, and Ca2+ toxicity on growth of EV- and LCT1–transformed G19 cells. Growth of G19 cells transformed with EV and LCT1 on plates containing AP medium with different concentrations of NaCl and or CaCl2. Bars are qualitative measures for colony density on the plates (see box for description). Each transformant was streaked twice in the same conditions (compare with Fig. 5). Growth was identical for both replica in all conditions. Note hypersensitivity of LCT1 transformants to Na+ and Ca2+, lack of effect of 2 mm Ca2+ on Na+ sensitivity, and rescue of LCT1 and control cultures on high Na+ by 20 mm Ca2+.
Physiological Relevance of LCT1-Mediated Na+ Uptake
Salt stress in plants is alleviated by increasing the external Ca2+ concentration (LeHaye and Epstein, 1969). The role of external Ca2+ in salt tolerance has been linked to Ca2+ dependence of cytoplasmic signaling components (Liu and Zhu, 1998), as well as to inhibition of toxic Na+ uptake (Davenport and Tester, 2000). 22Na+ uptake by wheat roots is inhibited by external Ca2+ with relatively high affinity, i.e. a KI of around 0.3 mm (Ca2+ activity, Davenport et al., 1997). The fact that a non-selective cation channel (NSC) in the wheat plasma membrane is blocked by external Ca2+ with a similar KI is a good indication that the NSC is the major component of Na+ uptake (Tyerman et al., 1997; Davenport and Tester, 2000).
By contrast, Ca2+ inhibition of LCT1-mediated Na+ uptake at high external Na+ levels (20–100 mm) will only become physiologically important if high levels of Ca2+ (above 10 mm) prevail in the soil. However, this does not exclude a function of LCT1 in Na+ uptake in agriculturally relevant situations. The aforementioned high-affinity Ca2+ block affects only about 40% of the Na+ influx in wheat, resulting in a considerable amount of Na+ uptake that is insensitive to external Ca2+ concentrations between 3 and 10 mm (Davenport et al., 1997). Since typical Ca2+ concentrations of saline soils fall into this range, it is the Ca2+-insensitive component of Na+ influx into wheat roots that has to be targeted in the engineering of salt tolerance (Schachtman and Liu, 1999). Currents through the NSC measured in lipid bilayers display a Ca2+-independent component, but unlike Na+ influx into roots, saturate at Na+ concentrations above 7 mm (Davenport and Tester, 2000). By contrast, as shown in our study, LCT1-mediated Na+ sensitivity in transformed yeast cells sharply increases between 10 and 50 mm Na+ (Fig. 1), indicating an important increase in LCT1-mediated Na+ influx over this concentration range (note that the Na+ sensitivity of control cells does not significantly increase over the same range). Attempts to determine ion fluxes through LCT1 directly by measuring electrical currents have been unsuccessful (D. Schachtman and S. Roberts, unpublished data). Voltage-clamp experiments on Xenopus oocytes injected with LCT1 mRNA and patch-clamp experiments on LCT1-transformed JKmc yeast cells did not resolve any currents that could be linked to LCT1. This was probably due to insufficient translation or membrane targeting in the oocytes and small size of membrane surface (and therefore of currents) in yeast.
Role of the N Terminus in LCT1 Function
We have started to assess putative functional domains of LCT1. The N terminus of LCT1 is hydrophobic and contains a highly significant PEST sequence (Schachtman et al., 1997). PEST sequences have been found in rapidly degraded proteins and it has been suggested that such sequences tag proteins for degradation or modification (Rogers et al., 1986; Rechsteiner and Rogers, 1996). At least two membrane proteins have been found to contain PEST sequences that play a role in modulating protein function (Shevchenko et al., 1998; Decatur and Portnoy, 2000). The skeletal muscle ryanodine receptor contains a PEST sequence in the N-terminal region that is cleaved by a specific calpain-like protease (Shevchenko et al., 1998). Application of the purified protease to the ryanodine receptor in lipid bilayers reduces receptor channel activity, but not its ability to bind ryanodine. The pathogenic bacterium Listeria monocytogenes produces a pore-forming protein called Listeriolysin O that provides a release route for the bacterium from the macrophage vacuole into the cytoplasm where it can replicate. Any pore-forming protein produced in the cytoplasm is targeted for degradation to avoid destruction of the macrophage's outer membrane before the bacterium has had time to replicate inside its host (Decatur and Portnoy, 2000). The degradation signal is encoded by a PEST-like sequence at the N terminus of the protein. Post-translational modification of LCT1 may occur in planta and not in yeast. We, therefore, mimicked N-terminal cleavage in LCT1 by creating a set of 5′-cDNA truncations. These truncations were then expressed in yeast. In accordance with the expectations based on the original hypothesis (Rogers et al., 1986) and recent reports (Shevchenko et al., 1998; Decatur and Portnoy, 2000) we found that cleavage of the N terminus of LCT1 at the PEST sequence diminished LCT1-induced phenotypes in yeast, i.e. Ca2+ influx and Na+ sensitivity. Removal of the entire N terminus, including the PEST sequence, abolished the activity of the protein as determined by an inability to complement the CY162 yeast mutant (data not shown).
Outlook
Our results suggest that LCT1 is a potentially important pathway for Na+ and Cs+ uptake in wheat and thus a potential target for molecular engineering of salt tolerance or exclusion of radioactive caesium in this crop. Its physiological role, however, remains to be established in planta. The possibility that LCT1 plays a role in Ca2+ uptake has to be taken into account if the goal is to produce salt-tolerant or caesium-excluding wheat plants by modification of this gene. Any positive effect of reduced Na+ or Cs+ uptake by simple knock-out of LCT1 or overexpression of non-functional mutations (such as N-terminal truncated protein) may be impaired by insufficient Ca2+ uptake (see Fig. 7). Molecular identity of Ca2+ and Na+ transport pathways could explain the limited success in the breeding of salt tolerant varieties. Thus, to avoid a potentially damaging loss of Ca2+ uptake capacity, modification of LCT1 would have to be more specific, i.e. target its Na+/Ca2+ or Cs+/Ca2+ selectivity. Detailed structure-function analysis of LCT1 will be a necessary undertaking for further progress in this matter.
MATERIAL AND METHODS
Yeast Strains
The Saccharomyces cerevisiae strain G19 (MATα leu2-3, 2-112, trp1-1, ura3-3, ade2-1, his3-11 can1-100, 15(ϕ) ena1:: HIS3::ena4, Quintero et al., 1996) was used for all experiments except 45Ca uptake measurements, which were performed with a strain produced in our laboratory (here called JKmc: MATa leu2-3, 112, his4, trp1, ura3-52, rme1, mid1::KAN, cch1::KAN, Fischer et al., 1997). Cells of both strains were transformed with the pYES2 plasmid alone (empty vector, EV), or pYES2 containing full-length LCT1 or one of the N-terminally truncated LCT1 cDNAs (LCT1-115, LCT1-126, see below). Transformants were isolated on SD medium (Sherman, 1991) supplemented with amino acids. Presence of LCT1 and its mutated versions in the transformed cell lines was confirmed on Southern blots.
Growth Experiments
G19 transformants were adapted to growth on AP medium (Rodríguez-Navarro and Ramos, 1984) containing 1 mm KCl, 2 mm MgSO4, 0.2 mm CaCl2, and 3% (w/v) Gal as the sole carbon source. For phenotypic assessment, AP medium was supplemented with various concentrations of alkali cations or Ca2+, all added as their chloride salts. Growth of the cultures was monitored on 2.5% (w/v) agar plates or in liquid media at 30°C. Doubling times in liquid media were calculated from growth rates during the exponential phase. Numbers of cells were deduced from the OD600 of liquid cultures according to a calibration curve based on representative cell counts.
Measurements of Ion Contents
For the determination of intracellular Na+ and K+ contents, cultures were grown in Na+-free liquid AP medium at 30°C to the early stationary phase (OD600 around 1.2). Fifty millimolar NaCl (in some experiments together with other salts) was added and 5-mL samples were taken from the culture after various incubation times. Cells were collected on a nitrocellulose filter, washed twice with ice-cold 100 mm MgCl2, rinsed onto a new filter, and washed once more. Ions were acid-extracted in 5 mL of 100 mm HCl and 100 mm MgCl2 and concentrations of Na+ and K+ were determined by atomic absorption spectroscopy. In an alternative experiment, cultures were grown in AP medium supplemented with 10 or 20 mm NaCl and harvested as above in the stationary phase for determination of Na+ contents. To check the viability of the cells during salt exposure, methylene-blue staining was performed on cell samples. Intracellular ion contents are expressed in nanomoles per 106 cells where the number of cells was derived from OD600.
Uptake of 45Ca
JKmc cells were grown in SD medium with 2% (w/v) Gal, modified according to Iida et al. (1994) to obtain a concentration of 100 μm Ca2+. Exponentially growing cells (liquid culture at 30°C) were harvested and re-suspended to a density of 108 cells/mL in 5 mm HEPES-choline buffer (pH 7) containing 2% (w/v) Gal and 100 μm CaCl2. Cells were incubated at room temperature with 185 kBq 45CaCl2 per mL (1.8 kBq/nmol). At various incubation times samples were taken, filtered through nitrocellulose membrane filters pre-soaked in 5 mm CaCl2, and washed with 25 mL of 5 mm CaCl2. Filters were dried and radioactivity counted by liquid scintillation.
Construction of N-Terminal Deletion Mutants of LCT1
Truncations of the N-terminal region of LCT1 were made using PCR. Primers were designed that contained a BamHI restriction site and a start codon (ATG). These primers annealed to different regions of the LCT1 cDNA and were constructed to maintain the same open reading frame as the predicted protein. Expand High Fidelity PCR System (Boehringer Mannheim, Basel) and a PCR protocol with a low cycle number (20) were used to minimize mistakes introduced by the PCR process. After PCR the products were cloned in pYES2 (Invitrogen, Carlsbad, CA) and sequenced at the 5′ end to ensure that the correct truncations and reading frames were present in the cDNA clone. Clones that contained the introduced ATG and were in the correct reading frame were transformed into the CY162 yeast strain (Anderson et al., 1992) to test for complementation of the K+ uptake-deficient phenotype (Schachtman et al., 1997). Deletion of the entire N terminus up to the first transmembrane domain (amino acid residues 1–168) resulted in non-functional LCT1. Two mutated LCT1 cDNAs that did functionally complement CY162 were chosen for transformation of the yeast strains G19 and JKmc. These were LCT1-115, deleted in the residues 1 to 115, and LCT1-126, deleted in the residues 1 to 126. The position of the deletions in the LCT1 sequence is shown in Figure 6a.
RNA Extraction and Northern Blotting
Total RNA of exponentially growing G19 cells was extracted with the RNeasy Plant Mini kit (Qiagen, Valencia, CA). Total RNA was separated by electrophoresis in denaturing conditions on a 1.2% (w/v) agarose-formaldehyde gel and blotted onto a Zetaprobe nitrocellulose membrane (Bio-Rad, Hercules, CA). A 670-bp PshAI fragment within the LCT1 open reading frame was labeled with [α-32P]dATP and used to probe the nitrocellulose filter. The filter was later stripped according to the manufacturer's instructions and rehybridized with a 760-bp control actin probe labeled with [α-32P]dATP.
ACKNOWLEDGMENTS
We are grateful to Alonso Rodríguez-Navarro and Francisco Rubio (Polytechnic University of Madrid) for providing not only the G19 yeast strain, but also many helpful tips, to David Lindsey (Chemistry Department, University of York) for assistance with the atomic absorption spectrometer, and to Meg Stark (Biology Department, University of York) for photography.
Footnotes
The work was supported by grants from the European Union, Biotechnology and Biological Science Research Council, and the Australian Research Council.
LITERATURE CITED
- Amtmann A, Sanders D. Mechanisms of Na+ uptake by plant cells. Adv Bot Res. 1999;29:76–112. [Google Scholar]
- Anderson JA, Huprikar SS, Kochian LV, Lucas WJ, Gaber RF. Functional expression of a probable Arabidopsis thaliana potassium channel in Saccharomyces cerevisiae. Proc Natl Acad Sci USA. 1992;89:3736–3740. doi: 10.1073/pnas.89.9.3736. [DOI] [PMC free article] [PubMed] [Google Scholar]
- Apse MP, Aharon GS, Snedden WA, Blumwald E. Salt tolerance conferred by overexpression of a vacuolar Na+/H+ antiport in Arabidopsis. Science. 1999;285:1256–1258. doi: 10.1126/science.285.5431.1256. [DOI] [PubMed] [Google Scholar]
- Bañuelos MA, Sychrova H, Bleykasten-Grosshans C, Souciet J-L, Potier S. The Nha1 antiporter of Saccharomyces cerevisiae mediates sodium and potassium efflux. Microbiology. 1998;144:2749–2758. doi: 10.1099/00221287-144-10-2749. [DOI] [PubMed] [Google Scholar]
- Bertl A, Bihler H, Reid JD, Kettner C, Slayman CL. Physiological characterization of the yeast plasma membrane outward rectifying K+ channel, Duk1 (Tok1), in situ. J Membr Biol. 1998;162:67–80. doi: 10.1007/s002329900343. [DOI] [PubMed] [Google Scholar]
- Camacho M, Ramos J, Rodríguez-Navarro A. Potassium requirements of Saccharomyces cerevisiae. Curr Microbiol. 1981;6:295–299. [Google Scholar]
- Clemens S, Antosiewicz DM, Ward JM, Schachtman DP, Schroeder JI. The plant cDNA LCT1 mediates the uptake of calcium and cadmium in yeast. Proc Natl Acad Sci USA. 1998;95:12043–12048. doi: 10.1073/pnas.95.20.12043. [DOI] [PMC free article] [PubMed] [Google Scholar]
- Davenport RJ, Reid RJ, Smith FA. Sodium-calcium interactions in two wheat species differing in salinity tolerance. Physiol Plant. 1997;99:323–327. [Google Scholar]
- Davenport RJ, Tester M. A weakly voltage-dependent, non-selective cation channel mediates toxic sodium influx in wheat. Plant Physiol. 2000;122:823–834. doi: 10.1104/pp.122.3.823. [DOI] [PMC free article] [PubMed] [Google Scholar]
- Decatur AL, Portnoy DA. A PEST-like sequence in Listeriolysin O essential for Listeria monocytogenes pathogenicity. Science. 2000;290:992–995. doi: 10.1126/science.290.5493.992. [DOI] [PubMed] [Google Scholar]
- Fischer M, Schnell N, Chattaway J, Davies P, Dixon G, Sanders D. The Saccharomyces cerevisiae CCH1 gene is involved in calcium influx and mating. FEBS Lett. 1997;419:259–262. doi: 10.1016/s0014-5793(97)01466-x. [DOI] [PubMed] [Google Scholar]
- Gaber RF, Styles CA, Fink GR. TRK1 encodes a plasma membrane protein required for high-affinity potassium transport in Saccharomyces cerevisiae. Mol Cell Biol. 1988;8:2848–2859. doi: 10.1128/mcb.8.7.2848. [DOI] [PMC free article] [PubMed] [Google Scholar]
- Gassmann W, Rubio F, Schroeder JI. Alkali cation selectivity of the wheat root high-affinity potassium transporter HKT1. Plant J. 1996;10:869–882. doi: 10.1046/j.1365-313x.1996.10050869.x. [DOI] [PubMed] [Google Scholar]
- Halfter U, Ishitani M, Zhu J-K. The Arabidopsis SOS2 protein kinase physically interacts with and is activated by the calcium-binding protein SOS3. Proc Natl Acad Sci USA. 2000;97:3735–3740. doi: 10.1073/pnas.040577697. [DOI] [PMC free article] [PubMed] [Google Scholar]
- Haro R, Bañuelos MA, Quintero FJ, Rubio F, Rodríguez-Navarro A. Genetic basis of sodium exclusion and sodium tolerance in yeast: a model for plants. Physiol Plant. 1993;89:868–874. [Google Scholar]
- Haro R, Garciadeblas B, Rodríguez-Navarro A. A novel P-type ATPase from yeast involved in sodium transport. FEBS Lett. 1991;291:189–191. doi: 10.1016/0014-5793(91)81280-l. [DOI] [PubMed] [Google Scholar]
- Ichida AM, Schroeder JI. Increased resistance to extracellular cation block by mutation of the pore domain of the Arabidopsis inward-rectifying K+ channel KAT1. J Membr Biol. 1996;151:53–62. doi: 10.1007/s002329900057. [DOI] [PubMed] [Google Scholar]
- Iida H, Nakamura H, Ono T, Okumara M, Anraku Y. Mid1, a novel Saccharomyces cerevisiae gene encoding a plasma membrane protein, is required for Ca2+ influx and mating. Mol Cell Biol. 1994;14:8258–8271. doi: 10.1128/mcb.14.12.8259. [DOI] [PMC free article] [PubMed] [Google Scholar]
- Ketchum KA, Joiner WJ, Sellers AJ, Kaczmarek LK, Goldstein SAN. A new family of outwardly rectifying potassium channel proteins with 2 pore domains in tandem. Nature. 1995;376:690–695. doi: 10.1038/376690a0. [DOI] [PubMed] [Google Scholar]
- Ko CH, Gaber RF. TRK1 and TRK2 encode structurally related K+ transporters in Saccharomyces cerevisiae. Mol Cell Biol. 1991;11:4266–4273. doi: 10.1128/mcb.11.8.4266. [DOI] [PMC free article] [PubMed] [Google Scholar]
- LeHaye PA, Epstein E. Salt toleration by plants: enhancement with calcium. Science. 1969;166:395–396. doi: 10.1126/science.166.3903.395. [DOI] [PubMed] [Google Scholar]
- Liu J, Ishitani M, Halfter U, Kim C, Zhu J-K. The Arabidopsis thaliana SOS2 gene encodes a protein kinase that is required for salt tolerance. Proc Natl Acad Sci USA. 2000;97:3730–3734. doi: 10.1073/pnas.060034197. [DOI] [PMC free article] [PubMed] [Google Scholar]
- Liu J, Zhu JK. A calcium sensor homolog required for plant salt tolerance. Science. 1998;280:1943–1945. doi: 10.1126/science.280.5371.1943. [DOI] [PubMed] [Google Scholar]
- Maathuis FJM, Amtmann A. K+ nutrition and Na+ toxicity: the basis of cellular K+/Na+ ratios. Ann Bot. 1999;84:123–133. [Google Scholar]
- Nass R, Cunningham KW, Rao R. Intracellular sequestration of sodium by a novel Na+/H+exchanger in yeast is enhanced by mutations in the plasma membrane H+-ATPase. J Biol Chem. 1997;272:26145–26152. doi: 10.1074/jbc.272.42.26145. [DOI] [PubMed] [Google Scholar]
- Nuccio ML, Rhodes D, McNeil SD, Hanson AD. Metabolic engineering of plants for osmotic stress resistance. Curr Opin Plant Biol. 1998;2:128–134. doi: 10.1016/s1369-5266(99)80026-0. [DOI] [PubMed] [Google Scholar]
- Quintero FJ, Garciadeblas B, Rodríguez-Navarro A. The SAL1 gene of Arabidopsis, encoding an enzyme with 3′(2′), 5′-bisphosphate nucleotidase and inositol 1-phosphatase activities, increases salt tolerance in yeast. Plant Cell. 1996;8:529–537. doi: 10.1105/tpc.8.3.529. [DOI] [PMC free article] [PubMed] [Google Scholar]
- Rechsteiner M, Rogers SW. PEST sequences and regulation by proteolysis. Trends Biol Sci. 1996;21:267–271. [PubMed] [Google Scholar]
- Rentsch D, Hirner B, Schmelzer E, Frommer WB. Salt stress-induced proline transporters and salt stress-repressed broad specificity amino acid permeases identified by suppression of a yeast amino acid permease-targeting mutant. Plant Cell. 1996;8:1437–1446. doi: 10.1105/tpc.8.8.1437. [DOI] [PMC free article] [PubMed] [Google Scholar]
- Rodríguez-Navarro A. Potassium transport in fungi and plants. Biochim Biophys Acta. 2000;1469:1–30. doi: 10.1016/s0304-4157(99)00013-1. [DOI] [PubMed] [Google Scholar]
- Rodríguez-Navarro A, Ramos J. Dual system for potassium transport in Saccharomyces cerevisiae. J Bacteriol. 1984;159:940–945. doi: 10.1128/jb.159.3.940-945.1984. [DOI] [PMC free article] [PubMed] [Google Scholar]
- Rogers S, Wells R, Rechsteiner M. Amino acid sequences common to rapidly degraded proteins: the PEST hypothesis. Science. 1986;234:364–368. doi: 10.1126/science.2876518. [DOI] [PubMed] [Google Scholar]
- Rubio F, Gassman W, Schroeder JI. Sodium-driven potassium uptake by the plant potassium transporter HKT1 and mutations conferring salt tolerance. Science. 1995;270:1660–1663. doi: 10.1126/science.270.5242.1660. [DOI] [PubMed] [Google Scholar]
- Schachtman DP, Kumar R, Schroeder JI, Marsh EL. Molecular and functional characterization of a novel low-affinity cation transporter (LCT1) in higher plants. Proc Natl Acad Sci USA. 1997;94:11079–11084. doi: 10.1073/pnas.94.20.11079. [DOI] [PMC free article] [PubMed] [Google Scholar]
- Schachtman DP, Liu W. Molecular pieces to the puzzle of the interaction between potassium and sodium uptake in plants. Trends Plant Sci. 1999;4:281–287. doi: 10.1016/s1360-1385(99)01428-4. [DOI] [PubMed] [Google Scholar]
- Schachtman DP, Schroeder JI. Structure and transport mechanism of a high-affinity potassium uptake transporter from higher plants. Nature. 1994;370:655–658. doi: 10.1038/370655a0. [DOI] [PubMed] [Google Scholar]
- Serrano R. Salt tolerance in plants and microorganisms: toxicity targets and defense responses. Int Rev Cytol. 1996;165:1–52. doi: 10.1016/s0074-7696(08)62219-6. [DOI] [PubMed] [Google Scholar]
- Serrano R, Mulet JM, Rios G, Marquez JA, de Larrinoa IF, Leube MP, Mendizabal I, Pascual-Ahuir A, Proft M, Ros R. A glimpse of the mechanisms of ion homeostasis during salt stress. J Exp Bot. 1999;50:1023–1036. [Google Scholar]
- Sherman F. Getting started with yeast. Methods Enzymol. 1991;194:3–21. doi: 10.1016/0076-6879(91)94004-v. [DOI] [PubMed] [Google Scholar]
- Shevchenko S, Feng W, Varsanyi M, Shoshan-Barmatz V. Identification, characterization and partial purification of a thiol-protease which cleaves specifically the skeletal muscle ryanodine receptor Ca2+ release channel. J Membr Biol. 1998;161:33–43. doi: 10.1007/s002329900312. [DOI] [PubMed] [Google Scholar]
- Shi H, Ishitani M, Kim C, Zhu J-K. The Arabidopsis thaliana salt tolerance gene SOS1 encodes putative Na+/H+ antiporter. Proc Natl Acad Sci USA. 2000;97:6896–6901. doi: 10.1073/pnas.120170197. [DOI] [PMC free article] [PubMed] [Google Scholar]
- Tyerman SD, Skerrett IM. Root ion channels and salinity. Sci Hortic. 1999;78:175–235. [Google Scholar]
- Tyerman SD, Skerrett M, Garrill A, Findlay GP, Leigh RA. Pathways for the permeation of Na+ and Cl− into protoplasts derived from the cortex of wheat roots. J Exp Bot. 1997;48:459–480. doi: 10.1093/jxb/48.Special_Issue.459. [DOI] [PubMed] [Google Scholar]
- Uozumi N, Kim EJ, Rubio F, Yamaguchi T, Muto S, Tsuboi A, Bakker EP, Nakamura T, Schroeder JI. The Arabidopsis HKT1 gene homolog ediates inward Na+ currents in Xenopus laevis oocytes and Na+ uptake in Saccharomyces cerevisiae. Plant Physiol. 2000;122:1249–1259. doi: 10.1104/pp.122.4.1249. [DOI] [PMC free article] [PubMed] [Google Scholar]
- White PJ, Broadley BR. Mechanisms of caesium uptake by plants. New Phytol. 2000;147:241–256. [Google Scholar]


