Abstract
Background
Nemonoxacin is a novel non-fluorinated quinolone antibiotic for the treatment of community-acquired pneumonia. To investigate the pharmacokinetics (PK) of nemonoxacin, a simple and sensitive high-performance liquid chromatography assay (HPLC) was needed.
Methods
An HPLC method with fluorescence (FL) detection was developed for the quantification of nemonoxacin in plasma and bile. Ultraviolet (UV) and FL characteristics were examined for the optimal detection conditions. Nemonoxacin and the internal standard gatifloxacin were extracted from plasma utilizing ethyl acetate-isopropanol (70/30, v/v). For bile sample preparation, direct dilution with the mobile phase buffer was used. Chromatographic separation was achieved on a C6-phenyl column (5 μm, 25 cm × 4.6 mm i.d.) at 30 °C with a flow rate of 1 mL/min. The mobile phase was composed of methanol and 50 mM potassium dihydrogen phosphate containing 0.5% (v/v) triethylamine (pH 7.5) (45/55 and 35/65 (v/v) for plasma and bile samples, respectively). FL was measured at an emission wavelength of 465 nm with excitation at 285 nm.
Results
The calibration curves were linear with a lower limit of quantification of 5 and 100 ng/mL in a small volume of plasma (50 μL) and bile (10 μL). The intra- and inter-day precision was within 9.0% and the accuracy was within 7.6% deviation of the nominal concentration. Nemonoxacin was stable under various storage/handling conditions tested. The method was successfully employed to describe the plasma and biliary profiles of nemonoxacin in rats following a single intravenous dose of 1 mg/kg. Nemonoxacin displayed two-compartment disposition kinetics. The bile-to-plasma area under concentration–time curve ratio (AUCbile/plasma) estimated was 50.7, indicating that nemonoxacin was actively secreted into bile.
Conclusion
A validated method was developed and found to be specific, precise and accurate. The applicability of this proposed method was substantiated in pharmacokinetic studies in rats.
Keywords: nemonoxacin, fluorescence, biliary excretion, HPLC, pharmacokinetics
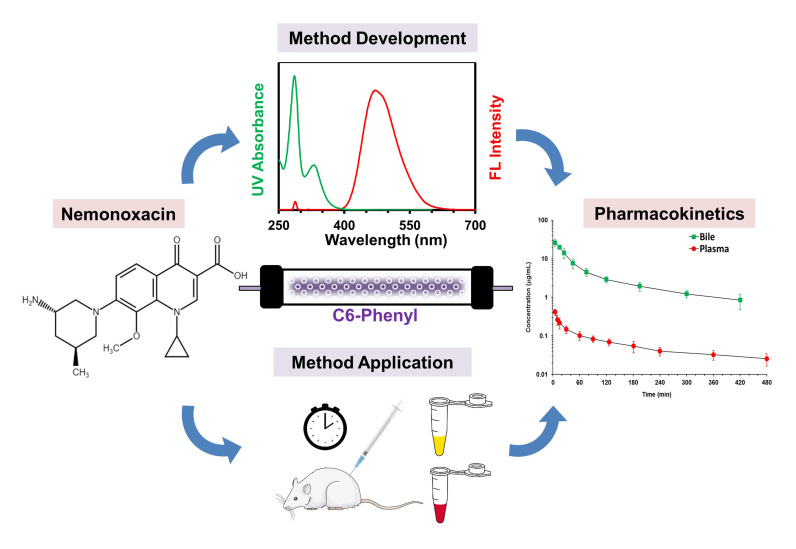
Graphical Abstract
Introduction
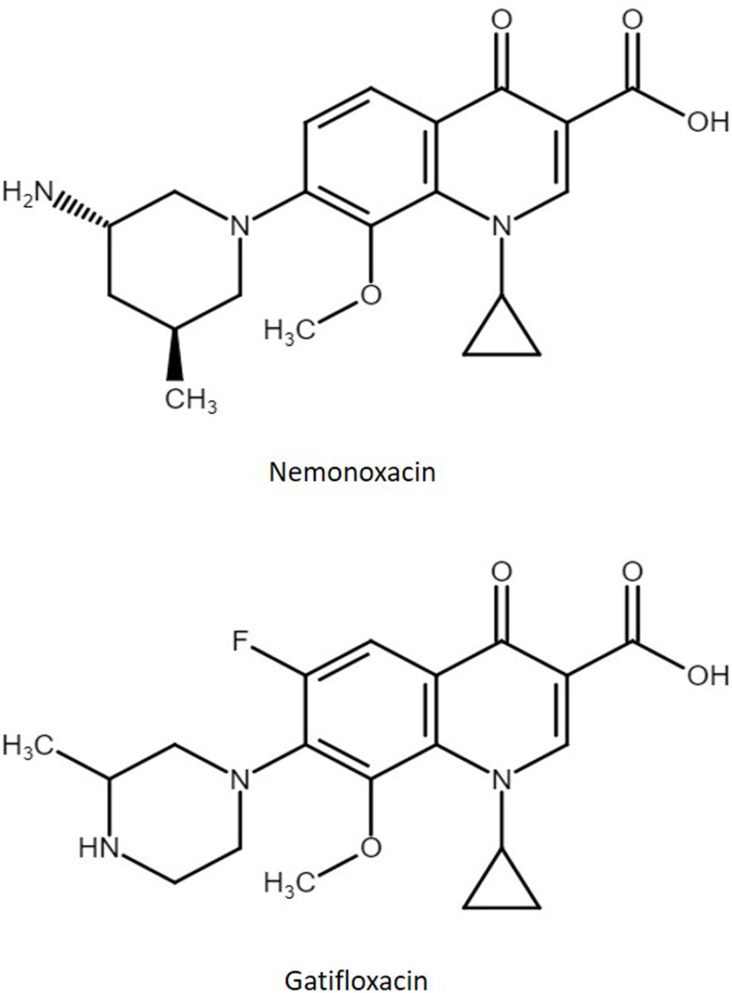
Nemonoxacin (Taigexyn), 7-[(3S,5S)-3-amino-5-methylpiperidin-1-yl]-1-cyclopropyl-8-methoxy-4-oxoquinoline-3-carboxylic acid (Figure 1), a novel C-8-methoxy non-fluorinated quinolone antibiotic which was developed by TaiGen Biotechnology Co., Ltd. in Taiwan for the treatment of community-acquired bacterial pneumonia. Nemonoxacin inhibits bacterial DNA gyrase and topoisomerase IV and exhibits potent activity against Gram-positive bacteria, including methicillin-resistant Staphylococcus aureus (MRSA) and fluoroquinolone-resistant MRSA, Gram-negative and atypical pathogens, and a reduced tendency for resistance development in vitro.1–3
Figure 1.
Chemical structures of nemonoxacin and internal standard gatifloxacin.
The oral capsule of nemonoxacin was first approved in 2014, followed by the intravenous formulation approved in 2020. After oral administration of 500 mg to healthy subjects, the absorption of nemonoxacin is rapid and the peak plasma concentration occurs at 1–2 h post-dose. The absolute bioavailability is approximately 100%. The primary elimination route of nemonoxacin is through the kidneys. The renal clearance of nemonoxacin is 2 to 3 folds higher than the glomerular filtration rate of unbound drugs, suggesting the involvement of active tubular secretion.4–6 In vitro studies also demonstrated that nemonoxacin is a substrate of P-glycoprotein (P-gp). The metabolic biotransformation of nemonoxacin is low and mainly occurs in the liver. The main metabolite is nemonoxacin acyl-β-D-glucuronide. The PK of nemonoxacin is approximately linear within the recommended dose range of 250–750 mg. Nemonoxacin has a large steady-state volume of distribution of about 2. 8 to 5.4 L/kg, a total body clearance of 0.18 to 0.3 L/h/kg, and an elimination half-life of 9.7 to 16.4 h. The concentration reaches steady state on the third day following multiple once-daily dosing. Food significantly decreases maximum plasma concentration and systemic exposure by 34% to 46% and 18% to 27%, respectively, and increases time to maximum plasma concentration by two to three folds. The PK parameters are generally similar between sexes and single versus multiple doses. The kinetic parameters of single and repeated doses are generally dose proportional, with no significant drug accumulation in multiple-dose studies.4–6
There are few quantification methods available for nemonoxacin in biological samples, and the reported methods have some disadvantages.7–12 The quantification of nemonoxacin in biological fluids has been achieved mainly by high-performance liquid chromatography (HPLC) with tandem mass (MS/MS) detection.8–12 Recently, HPLC methods coupled with electrospray ionization MS/MS spectrometry were reported for the determination of nemonoxacin in human plasma, urine, feces and lung tissue. Although these LC-MS/MS methods offer good sensitivity and specificity, they are not widely available in most laboratories since tandem mass spectrometry is a highly sophisticated instrumentation that requires operation by a trained person and relatively high maintenance costs. Additionally, the published methods usually need relatively large volumes (100–500 μL) of plasma, which is unsuitable for monitoring the concentration profile of nemonoxacin in small animals.7–10 As a result, the PK characteristics of nemonoxacin have not been studied extensively.
Even though nemonoxacin possesses native FL due to its highly conjugated system of the bicyclic moiety, there has been no published report for the quantification of nemonoxacin with FL detection until now. We examined the characteristics of fluorescence and ultraviolet (UV) in this work. With the specificity and high sensitivity provided by FL detection, the first fluorimetric HPLC assay is developed and validated to measure nemonoxacin in small volumes of rat plasma and bile. The lower limit of quantification (LLOQ) of the present HPLC-FL method was 5 ng/mL in 50 μL plasma and 100 ng/mL in 10 µL bile. As the sample volume needed for the proposed method was small, it was useful for experimental research in small animals. It was successfully applied to in vivo PK studies of nemonoxacin.
Materials and Methods
Chemicals and Reagents
Nemonoxacin malate hemihydrate (Lot. TGI0475094, purity 99.88%) was from TaiGen Biotechnology Co., Ltd. (Taiwan). Gatifloxacin (Lot. 18-ANR-58-1, purity 98%) was from TRC (Canada) (Figure 1). Potassium dihydrogen phosphate was obtained from Avantor Performance Materials Inc. (PA, USA). Triethylamine (TEA) was obtained from Riedel-de Haën (Seelze, Germany). HPLC-grade acetonitrile and methanol were obtained from Merck (Darmstadt, Germany). Milli-Q Reagent Water (Millipore, Bedford, MA, USA) was used in the preparation of phosphate buffer solutions. Rat plasma and bile matrices were obtained from male Sprague-Dawley rats. All other analytical-grade chemicals were used as received without further purification.
Ultraviolet and Fluorescence Spectrometry
The UV spectra of nemonoxacin (10 μg/mL) in an aqueous solution with various pH values were measured using a 10-mm quartz cell and a Hitachi U-2001 spectrophotometer (Tokyo, Japan). The aqueous solutions used were 50 mM phosphate buffer (pH 4.6, 6.8, 7.5, 9.2), 0.1 M HCl and 0.01 M NaOH.
The FL spectra of nemonoxacin (10 μg/mL) in the mobile phase and in aqueous solution with various pH values were recorded using a 10-mm quartz cell and a Hitachi FL-2500 FL spectrophotometer (Tokyo, Japan) equipped with a xenon lamp. The excitation and emission slit widths were fixed at 10 nm. The aqueous solutions used were 50 mM phosphate buffer (pH 4.6, 6.8, 7.5, 9.2), 0.1 M HCl and 0.01 M NaOH, and the component of the mobile phase in the present method.
Instrumentation and Chromatography Conditions
The determination of nemonoxacin in biological matrices was conducted on a Hitachi HPLC system consisting of an L-7100 pump, an L-7200 autosampler, an L-7300 column oven, an L-7480 FL detector and a D-7000 Chromatography Data Station (Tokyo, Japan).
Chromatographic separation was achieved on a Phenomenex Gemini® C6-phenyl column (5 μm, 25 cm × 4.6 mm i.d., Torrance, California, USA) by isocratic elution. The mobile phase consisted of methanol and 50 mM potassium dihydrogen phosphate buffer containing 0.5% (v/v) TEA (pH 7.5) at the ratio of 45:55 (v/v) for the plasma sample and 35:65 (v/v) for the bile sample, respectively. Analyses were run at a flow rate of 1 mL/min and the column temperature was set at 30 °C. A 100 μL aliquot was injected for analysis. The total run time was 10 min for plasma sample and 20 min for bile sample. The eluants were detected by a FL detector at an excitation wavelength of 285 nm and an emission wavelength of 465 nm.
Preparation of Stock Solutions, Calibration Standards, and Quality Control Samples
The stock solutions of nemonoxacin and the internal standard gatifloxacin (1 mg/mL in methanol as free base) were prepared and stored in tightly sealed condition at −20 °C. The stock solution of nemonoxacin was diluted with methanol to give the working standard solution (100 μg/mL), which was further diluted serially with blank rat plasma to obtain plasma calibration standards at concentrations of 5, 10, 25, 50, 250, 1000 and 2000 ng/mL. The quality controls (QCs) of plasma samples were prepared independently at concentrations of 5, 10, 250 and 2000 ng/mL before sample collection and stored in a −20 °C freezer until analysis. The bile calibration standards (0.1, 0.2, 0.5, 1, 5 and 20 μg/mL) and QC (0.1 and 5 μg/mL) were prepared by appropriate dilution of the working solution of nemonoxacin in blank rat bile. The working solution of gatifloxacin was obtained by diluting the stock solution in methanol to 2 μg/mL. A complete calibration curve was generated with each run.
Sample Preparation
The samples were removed from the freezer and thawed at room temperature before analysis. Calibration standards, quality controls and unknown samples were processed in batches. To extract nemonoxacin in plasma samples, liquid–liquid extraction (LLE) was applied. To 50 μL aliquots of plasma samples, 20 μL aliquots of the internal standard working solution were added. And then 250 μL of ethyl acetate-isopropanol (70/30, v/v) was added. After vortex-mixing for 30 sec and centrifuging at 15850 g at 4 °C for 10 min, the supernatant was transferred to another 1.5 mL microcentrifuge tube and evaporated to dryness under a stream of nitrogen at room temperature. The residue was reconstituted with 150 μL mobile phase, and an aliquot of 100 μL was injected into the HPLC-FL system.
For bile samples, 10 μL were spiked with 190 μL of 50 mM potassium dihydrogen phosphate buffer with 0.5% TEA (pH 7.5). After vortex-mixing for 30 sec and centrifuging at 15850 g at 4 °C for 10 min, an aliquot of 100 μL supernatant was injected onto the column for HPLC analysis.
Assay Validation
Specificity
To evaluate the specificity of the present method, blank plasma and bile from six independent batches were examined to exclude the interference from endogenous substances.
Linearity and Sensitivity
The calibration curve was constructed from 5 to 2000 ng/mL of nemonoxacin in rat plasma and 0.1 to 20 μg/mL in rat bile, respectively. The peak area ratios (nemonoxacin/gatifloxacin) versus nominal concentrations were employed to establish the regression equation for rat plasma samples; as for bile samples, the peak area of nemonoxacin against nominal concentration was employed. The regression equations were obtained via the weighted linear regression method (SigmaPlot, Version 12.5, SYSTAT Software, CA, USA) with a weighting scheme of 1/y2 for both biological matrices. The lower limit of quantification (LLOQ) was the lowest non-zero concentration level with acceptable accuracy (relative error < 20%) and precision (coefficient of variation, CV < 20%).
Accuracy and Precision
Intra-day accuracy and precision were evaluated by analyzing the quality control samples (n = 6) within a single run. Inter-day accuracy and precision were assessed by QC samples (n = 6) over different days. Assay precision was defined as the coefficient of variation (CV, %), which was assessed by calculating the percentage of relative standard deviation. The accuracy was defined as relative error (RE, %), which was estimated by comparing the nominal concentrations with the measured concentrations. The acceptance criteria for accuracy and precision were within 15% of the nominal values. As for the LLOQ, CV and RE should not exceed 20%.
Recovery
Absolute extraction recovery of nemonoxacin (5, 250 and 2000 ng/mL) in plasma samples (n = 3) was determined by comparing the peak areas of nemonoxacin in the extracted samples with the control samples spiked in methanol. Recovery of the internal standard (2 μg/mL) was also evaluated. As bile sample was prepared by direct dilution using the mobile phase buffer without extraction, recovery was not examined.
Stability
The stability of nemonoxacin in plasmas and bile (5, 10, 250 and 2000 ng/mL in plasma sample; 0.1 and 5 μg/mL in bile sample) was assessed under various storage and handling conditions. Freeze-thaw stability of nemonoxacin was assessed by the three freeze-thaw cycles. The samples were thawed at the ambient temperature (about 20 °C) without any assistance, and then kept in the freezer (−20 °C) for 4 h until next thawing. For the bench-top stability, QC samples of nemonoxacin were kept at ambient temperature for 4 h before sample preparation. The short-term stability of nemonoxacin at 4 °C was examined for 24 h and the long-term stability of nemonoxacin was assessed for 4 weeks. The post-preparative stability of nemonoxacin in auto-sampler at ambient temperature was followed for 24 h.
Pharmacokinetic Study in Rats
The HPLC-FL method was employed to a single dose pharmacokinetic study in rats (n = 5). After an intravenous bolus administration of 1 mg/kg nemonoxacin via the right femoral vein, 0.2 mL of blood samples for analytical determinations were collected into the heparinized tubes via the left jugular vein at designated times up to 480 min post-dose (0, 5, 10, 15, 30, 60, 90, 120, 180, 240, 360, 480 min). The plasma samples were separated from the blood after centrifuging at 15850 g at 4 °C for 10 min. Bile samples were collected at specific time intervals (0–10, 10–20, 20–30, 30–60, 60–90, 90–150, 150–240, 240–360, 360–480 min). Plasma and bile samples were stored at −20 °C until analysis.
All animal experiments were conducted in accordance with Guidelines for the Care and Use of Laboratory Animals (2018) and the Animal Protection Act (2021) of Taiwan. The study protocol (No. 109094) has been reviewed and approved by the Institutional Animal Care and Use Committee (IACUC) of National Cheng Kung University (Tainan, Taiwan). All animals were obtained from BioLASCO Taiwan Co., Ltd. The rats were housed under controlled conditions of temperature and light/dark cycle (lights on at 07:00 and off at 20:00) for about one week before the experiment. The animals were fasted overnight and had access to water ad libitum the day before the experiment.
PK parameters were calculated using the Certara WinNonlin software (California, USA). Area under the curve, zero to last (AUC0–t), half-life (T1/2), clearance (CL), steady-state volume of distribution (Vss) and accumulated excreted amount in bile (Ae0–t) were calculated.
Results and Discussions
UV and Fluorescence Spectra
The structure of nemonoxacin features a conjugated configuration, displaying pronounced UV absorption and native fluorescence. Additionally, the drug contains multiple amine groups and one carboxylic group, which may undergo ionization in different pH conditions. Nemonoxacin is a zwitterion with the strongest acidic pKa of 5.53 and the strongest basic pKa of 9.83 (Chemicalize, ChemAxon Ltd. Available from: https://chemicalize.com/. Accessed October 7, 2019). The varying extent of ionization can influence the UV absorbance and fluorescence intensity of nemonoxacin; therefore, it is critical to evaluate the impact of changing pH values on the UV and fluorescence spectra of the nemonoxacin.13–17
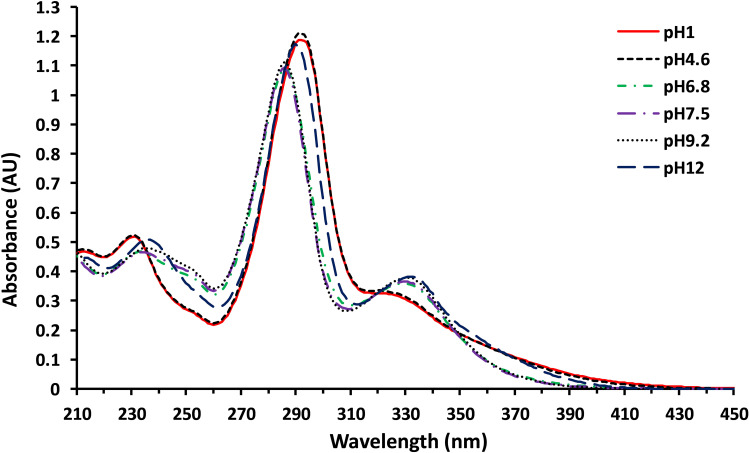
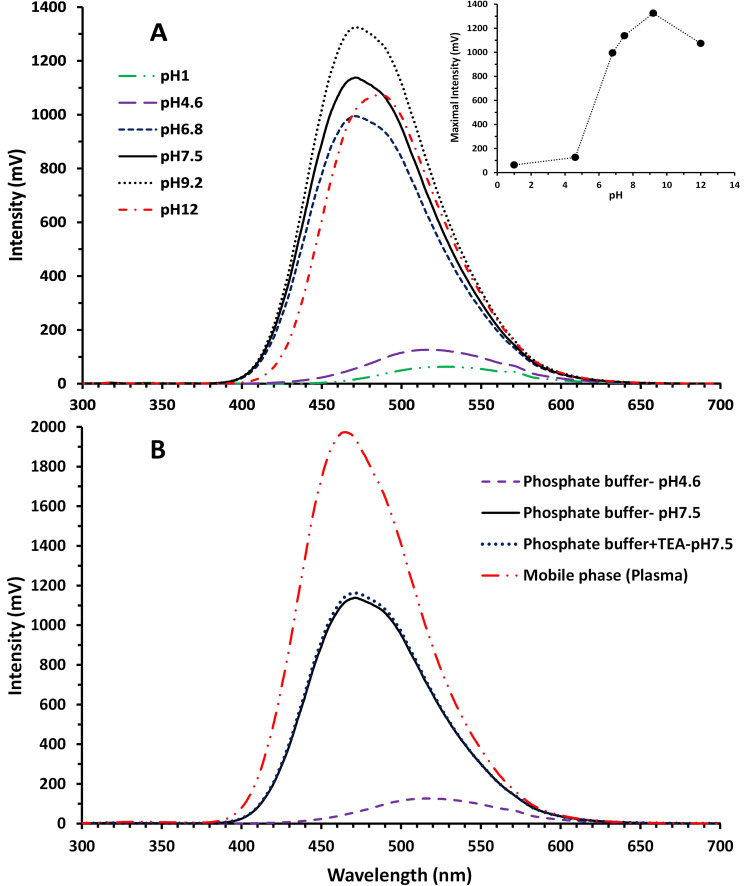
The UV absorption spectra of nemonoxacin measured at different pH values are displayed in Figure 2. Note that there is an overall similarity of the UV absorption spectra of nemonoxacin in various pH conditions, albeit higher absorbance was associated with strong acidic and alkaline conditions. The absorption maximum was around 285–290 nm at different pH values. A smaller maximum absorption peak (or shoulder) can be seen at 330 nm. On the contrary, the emission spectrum varied dramatically with the pH of the solution. Figure 3 shows the FL emission spectra of nemonoxacin in aqueous solutions with pH values ranging from 1 to 12 and in the mobile phase for plasma sample analysis. The excitation wavelength was set at 285 nm. The emission maximum occurred at around 465–520 nm. The emission intensity was rather low when the pH of solution was less than 4.6, in which nemonoxacin existed predominantly as the ionized cation with a λmax of 529 nm and 519 nm for pH 1.2 and pH 4.6, respectively. Maximal FL intensity (λmax ~ 472 nm) occurred in the pH range of 6.8–9, in which nemonoxacin existed predominantly as the zwitterion. FL intensity remained relatively high when nemonoxacin was in the anion form (pH 12), with the λmax shifted to 487 nm. At pH 4.6, the response was only 9.5% of that at pH 9.2, as shown in the inset of Figure 3A. The presence of organic solvent methanol significantly enhanced the FL intensity (Figure 3B).
Figure 2.
Ultraviolet absorption spectra of nemonoxacin (10 μg/mL) under various pH conditions in aqueous solution.
Figure 3.
Fluorescence emission spectra and the maximal intensity (inset) of nemonoxacin (10 μg/mL) under various pH conditions in aqueous solution (A) and in mobile phase composition (B). The excitation wavelength was fixed at 285 nm.
Tang et al developed a HPLC method utilizing UV detection at 292 nm for quantification of nemonoxacin in dog plasma samples.7 Using a sample volume of 500 μL dog plasma, the lower limit of quantification of this method was found to be 100 ng/mL. Although this HPLC-UV method provides adequate sensitivity for PK studies in large animals, the substantial plasma volume required makes this method unsuitable for research in small animal models where sample volume is limited. In addition to UV absorbance, nemonoxacin exhibits native FL due to its highly conjugated fluorophore structure. Therefore, fluorometric detection can offer improved sensitivity and selectivity compared to UV detection. Under current HPLC conditions, an optimal detection with excitation at 285 nm and emission at 465 nm was employed.
HPLC-FL Method Development and Optimization of Chromatography Conditions
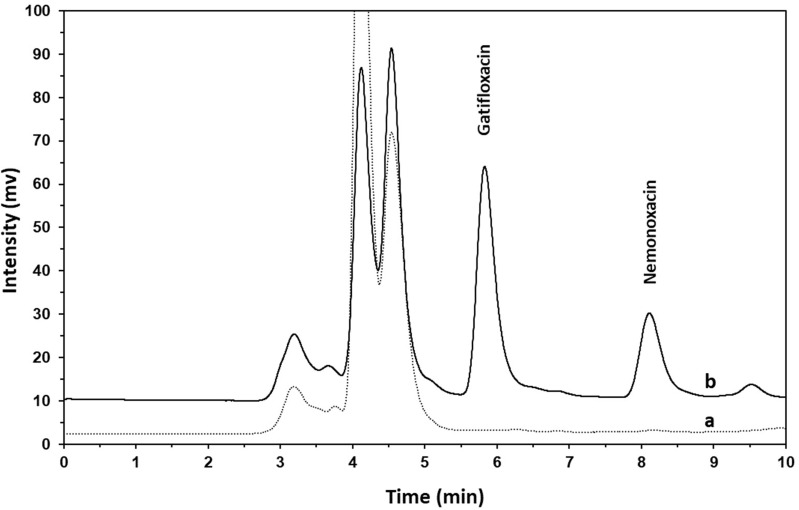
The chromatograms of plasma extracts from pre-dose (a) and 180 min (b) were shown in Figure 4, after intravenous administration of 1 mg/kg nemonoxacin to a rat. As depicted in Figure 4, a good separation of the internal standard, gatifloxacin, and nemonoxacin was achieved under the chromatographic conditions of the present method, with gatifloxacin and nemonoxacin eluted at 6 and 8 min, respectively. No interfering endogenous peaks were observed at the retention time of nemonoxacin and gatifloxacin when blank rat plasma samples were analyzed.
Figure 4.
The chromatograms of plasma samples from an SD rat: (a) pre-dose sample; (b) sample at 180 min after intravenous bolus of 1 mg/kg nemonoxacin.
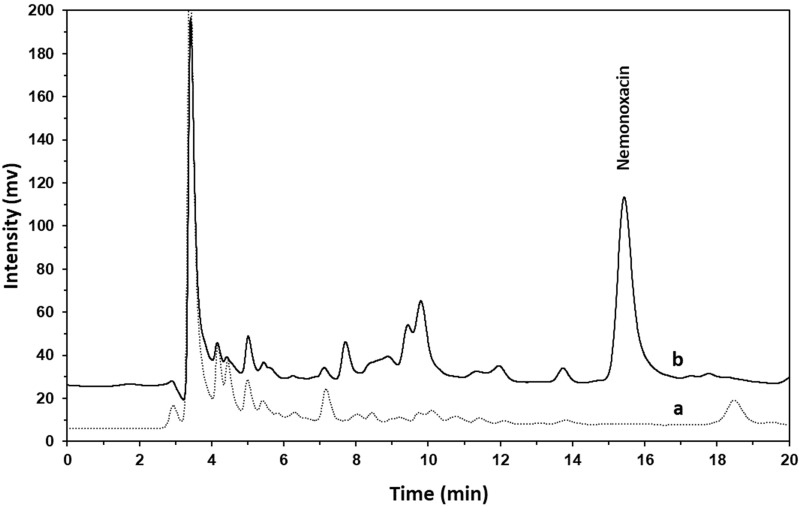
Figure 5 showed the chromatograms of bile samples collected from pre-dose (a) and 240–360 min (b) after administration of 1 mg/kg nemonoxacin to a rat. Previous studies showed that the polar conjugate of nemonoxacin (acyl-β-D-glucuronide) found in human urine and feces eluted earlier than nemonoxacin in reverse-phase chromatography.11 In our preliminary experiments, it was found that nemonoxacin can be metabolized via both glucuronidation and sulfation in rats, and these conjugated metabolites can be detected in bile. To resolve nemonoxacin from its conjugates and endogenous interferences in bile, the solvent strength was decreased by decreasing the percentage of methanol in the mobile phase for bile sample analysis. Thus, nemonoxacin was eluted at 15.5 min.
Figure 5.
The chromatograms of bile samples from an SD rat: (a) pre-dose sample; (b) sample obtained 240–360 min after intravenous bolus of 1 mg/kg nemonoxacin.
Determination of nemonoxacin in biological fluids has been achieved mainly by LC-MS/MS methods using conventional C18 columns with mobile phases consisting of acetonitrile/methanol-aqueous solutions containing modifiers (formic acid and ammonium acetate) under isocratic or gradient elution mode (Table 1). Formic acid is commonly added in mobile phases of reverse-phase chromatography to provide protons for LC-MS/MS analysis. The presence of a low concentration (~0.1%) of formic acid in the mobile phase is also known to improve the peak shapes of the resulting separation. Higher concentration of formic acid is not recommended due to its detrimental effect on column and system performance. Nevertheless, 1% of formic acid was used by Zhang et al.10
Table 1.
Summary of the Published HPLC Methods for the Determination of Nemonoxacin
| Ref. | Detection | Column | Mobile phase | Matrix | Internal standard | Sample (μL) |
LLOQ (ng/mL) |
|---|---|---|---|---|---|---|---|
| This study | Fluorescence (Ex/Em: 285/465 nm) |
C6-phenyl | MeOH:50 mM KH2PO4 with 0.5% TEA (pH7.5)=45:55 (Plasma); 35:65 (Bile) | Plasma Bile |
Gatifloxacin | 50 10 |
5 5 |
| [7] | UV (292 nm) | C18 | ACN:0.2% TEA (pH2.8 adjust with phosphate acid)=22:78 | Plasma | Moxifloxacin | 500 | 100 |
| [8] | MS/MS (m/z 372.2→354.2) | C18 | ACN:0.1% formic acid=18:82 (Plasma); 15:85 (Urine) | Plasma Urine |
Gatifloxacin | 100 150 |
5 5 |
| [9] | MS/MS (m/z 372.1→354.2) | C18 | MeOH:0.1% formic acid=60:40 | Plasma | Gatifloxacin | 100 | 29.2 |
| [10] | MS/MS (m/z 372→311) | C18 | ACN:5 mm ammonium acetate with 1% formic acid=30:70 | Plasma Urine |
Moxifloxacin | 100 100 |
5 200 |
| [11] | MS/MS (m/z 372.4→354.1) | C18 | ACN:0.1% formic acid=16:84 | Feces | Gatifloxacin | 50 | 120a |
| [12] | MS/MS (m/z 372.5→354.5) | C18 | MeOH:0.3% formic acid=gradient | Lung tissueb | Nemonoxacin-D3 | 100 | 20 |
Note: ang/g; blung tissue, bronchial mucosa and bronchial secretions.
Abbreviations: Ex/Em, excitation/emission; MS/MS, tandem mass; MeOH, methanol; TEA, triethylamine; ACN, acetonitrile; LLOQ, lower limit of quantification.
Peak tailing is one of the major challenges in developing the HPLC method for nemonoxacin. An optimized mobile phase of acetonitrile-0.2% TEA (pH 2.8 adjusted with phosphoric acid) (22:78) was chosen by Tang et al7 for the determination nemonoxacin in beagle dog plasma using a C18 column with UV detection (Table 1). In this study, several different types of columns were tested. The C6-phenyl column provided a good resolution and better symmetric peaks for nemonoxacin and the internal standard than the reversed-phase C18 columns tested. The optimized resolution of nemonoxacin and baseline separation from the internal standard for plasma sample was achieved using an isocratic mobile phase composed of methanol-50 mM KH2PO4 buffer containing 0.5% TEA. TEA is commonly used in conventional HPLC methods for its ability to suppress tailing of basic compounds and for its ion-pairing ability. Alkaline pH is preferred for fluorimetric detection of nemonoxacin, as shown in Figure 3A. However, the pH value of 7.5 was selected for buffer on considering the stability of the column and the FL response (about 86% of that for pH 9.2). TEA itself is alkaline, and when 0.5% (v/v) TEA was added into the potassium dihydrogen phosphate buffer, the pH value shifted from 4.6 to 7.5, and the FL intensity is like that of the pH 7.5 phosphate buffer without TEA, as shown in Figure 3B. TEA herein improves resolution, peak symmetry and FL intensity at the same time.
Calibration Range, Quantification Limit and Sample Volume
After oral administration of a single 500 mg dose to healthy subjects, nemonoxacin reached a mean peak plasma concentration (Cmax) of 5.91 μg/mL, with a terminal elimination half-life around 12.8 h.4–6 Steady state was reached within 3–5 days of once-daily dosing with an accumulation factor of approximately 1.1. The steady-state peak and trough concentrations after oral 500 mg dose once daily were 7.0 and 0.37 μg/mL. Published LC-MS/MS methods offer excellent sensitivity for nemonoxacin quantification, with LLOQs down to 5 ng/mL in human plasma and urine (Table 1).8,10
The upper limit of quantification (ULOQ) of calibration curves was set at 1 to 16 μg/mL for human plasma and 1 to 200 μg/mL for human urine by LC-MS/MS methods to characterize the plasma and urine concentration profile of nemonoxacin in healthy subjects.8–10 After considering the expected clinical concentration range and potential drug–drug interactions, in the present method we had validated and set the ULOQ and LLOQ at 2 μg/mL and 5 ng/mL in plasma, respectively. A 10-fold dilution of plasma samples (20 μg/mL) with nemonoxacin concentration above the ULOQ was also successfully validated (data not shown).
There is no published method for the determination of nemonoxacin in rat bile so far. According to the preliminary experiment, we observe that the concentration of nemonoxacin in bile is about 20- to 40-fold higher than that in plasma. The unknown bile samples were 20-folded diluted before quantification and the calibration range of 0.1–20 μg/mL was set for the rat bile samples.
Previously reported methods required relatively large sample volumes of plasma and urine (100–500 μL), as shown in Table 1. To enable PK studies in small animals such as rats, we significantly reduced the sample volume requirements down to 50 μL for plasma and 10 μL for bile while still maintaining sufficient sensitivity. The LLOQ for plasma sample in the present method was comparable with published LC-MS/MS methods.
Optimization of Liquid-Liquid Extraction Method
One-step deproteinization by water-soluble organic solvents, such as methanol or acetonitrile, was commonly used for sample preparation in LC assays. Nemonoxacin can be extracted from human plasma using acetonitrile and methanol in LC-MS/MS methods.8–10 Liquid–liquid extraction using dichloromethane has been shown to recover 75.2–82.1% of nemonoxacin in dog plasma at the concentration range of 0.2–10 μg/mL.7 On the contrary, the recovery of nemonoxacin in human urine (5–800 ng/mL) was quite low using dichloromethane.8 Because an emulsion will likely form during the extraction process using dichloromethane, this may result in low and variable extraction efficiency. Extraction with ethyl acetate gave better but still non-ideal recovery of nemonoxacin in human urine and feces homogenate.8,11 Nemonoxacin can also be extracted from human urine8 and feces homogenate11 using ethyl acetate-isopropanol (3:1, v/v) with absolute recovery of 84.6–89.9% and 48.8–56.3%, respectively. In the present method, ethyl acetate-isopropanol (7:3, v/v) was used as the extraction solvent for plasma samples because it offered high extraction recoveries for both nemonoxacin and gatifloxacin and presented relatively clean chromatograms in rat plasma samples (Figure 4).
As nemonoxacin is actively secreted into bile with biliary concentration about 20 to 40 times higher than plasma concentration, instead of liquid–liquid extraction, simple dilution with the mobile phase buffer was employed for the preparation of bile samples. Nemonoxacin undergoes Phase II conjugation in humans11 and rats (see Section HPLC-FL method development and optimization of chromatography conditions). As the difference in polarity/lipophilicity exists between the conjugated metabolite(s) and nemonoxacin, extracting them simultaneously with a simple process is not without challenge in terms of extraction efficiency.8,11 On the contrary, simple dilution of samples allows simultaneous and quantitative recovery of nemonoxacin and its metabolites from bile.
Selection of Internal Standard
Among the published analytical methods for the determination of nemonoxacin, only one LC-MS/MS method had utilized nemonoxacin-D3 as internal standard.12 While isotopically labeled internal standards are recognized to offer optimal assay performance for LC-MS quantification, these chemical analogs are not readily accessible or financially viable for many laboratories. Hence, other more accessible compounds have been employed as internal standards for nemonoxacin determination in previous studies, including moxifloxacin and gatifloxacin (Table 1).
In this method, gatifloxacin was chosen as the internal standard owing to its commercial availability and possession of native inherent fluorescence. Additionally, gatifloxacin could be extracted from plasma matrices with high recovery by ethyl acetate-isopropanol (7:3, v/v) solution (Table 2). Under the chromatographic conditions in this work, the retention time for gatifloxacin was proper with its peak sufficiently separated from that of nemonoxacin. Because of its side effect of dysglycemia, the oral and intravenous dosage forms of gatifloxacin were withdrawn from the markets around the world; thus, the possibility of encountering interference by gatifloxacin is highly improbable.18
Table 2.
Extraction Recovery of Nemonoxacin from Spiked Plasma Containing Internal Standard Gatifloxacin (Mean ± SD, n = 3)
| Cnominal (ng/mL) | Absolute Recovery (%) | Relative Recovery (%) | |
|---|---|---|---|
| Gatifloxacin | Nemonoxacin | ||
| 5 | 80.5±1.2 | 90.2±0.7 | 112.0±1.4 |
| 250 | 77.8±1.3 | 88.6±1.8 | 113.9±1.3 |
| 2000 | 81.2±2.9 | 89.7±1.2 | 110.6±2.8 |
Abbreviation: Cnominal, nominal concentration.
Assay Validation
Plasma Samples
The calibration curves for nemonoxacin in rat plasma samples displayed excellent linearity across the concentration range of 5 to 2000 ng/mL. The accuracy and precision were thoroughly investigated by replicated analyses of spiked control samples (Table 3). The intra-day and inter-day precision, expressed as coefficient of variation (CV), were within 9.0% across the range studied. Accuracy was within 7.6% deviation from the nominal values for all QC levels. The LLOQ was established to be 5 ng/mL, with intra-day and inter-day precision of 2.2% and 6.4% CV, and error of 6.9% and 4.6%, respectively (Table 3). The extraction efficiencies of both nemonoxacin and gatifloxacin were high and comparable. The mean absolute recoveries of nemonoxacin determined ranged between 88.6% and 90.2%. The mean recovery of gatifloxacin was 77.8% to 81.2% at the concentration used in the assay (Table 2).
Table 3.
Intra-Day and Inter-Day Accuracy and Precision of Quality Control Samples for Quantitation of Nemonoxacin in Rat Plasma and Bile (n = 6)
| Plasma | Intra-day | Inter-day | ||||
|---|---|---|---|---|---|---|
| Cnominal (ng/mL) | Cest (ng/mL) | C.V. (%) | Error (%) | Cest (ng/mL) | C.V. (%) | Error (%) |
| 5 | 5.3 | 2.2 | 6.9 | 5.2 | 6.4 | 4.6 |
| 10 | 10.4 | 5.5 | 4.0 | 10.2 | 7.3 | 1.7 |
| 250 | 259 | 6.0 | 3.6 | 244 | 9.0 | −2.3 |
| 2000 | 2152 | 2.2 | 7.6 | 2136 | 1.9 | 6.8 |
| Bile | Intra-day | Inter-day | ||||
| Cnominal (μg/mL) | Cest (μg/mL) | C.V. (%) | Error (%) | Cest (μg/mL) | C.V. (%) | Error (%) |
| 0.1 | 0.1 | 2.6 | 0.4 | 0.1 | 3.2 | 2.1 |
| 5 | 5.2 | 2.3 | 3.1 | 5.1 | 3.1 | 1.9 |
Abbreviation: Cest, estimated concentration.
Nemonoxacin demonstrated excellent stability under various storage conditions and freeze-thaw cycles examined, as shown in Table 4. The mean concentration for the quality control samples examined was within 15% of nominals for nemonoxacin.
Table 4.
Stability of Nemonoxacin in Spiked Plasma, Bile and Post-Preparative Samples
| Conditions | Plasma- % Remained (mean ± SD, n = 4) | Bile- % Remained (mean ± SD, n = 3) | ||||
|---|---|---|---|---|---|---|
| 5 ng/mL | 10 ng/mL | 250 ng/mL | 2000 ng/mL | 0.1 μg/mL | 5 μg/mL | |
| Bench-top stability (20 °C, 4 h) | 110.8±4.4 | 104.1±1.9 | 110.2±3.9 | 105.5±5.5 | 94.6±4.8 | 98.8±0.6 |
| Short-term stability (4 °C, 24 h) | 102.6±3.3 | 104.4±3.5 | 109.6±2.2 | 105.4±3.8 | 101.0±3.6 | 100.3±0.6 |
| Long-term stability (−20 °C) | ||||||
| 1 Day | 111.4±2.9 | 102.7±3.1 | 109.7±0.6 | 100.7±4.6 | 109.1±7.8 | 100.8±0.2 |
| 4 Days | 106.0±5.4 | 101.7±5.0 | 109.5±2.8 | 102.1±1.4 | 94.5±3.8 | 98.4±1.7 |
| 7 Days | 105.1±7.1 | 98.3±5.2 | 109.4±2.8 | 100.4±3.4 | 99.1±1.5 | 102.8±2.4 |
| 14 Days | 105.2±5.6 | 100.4±2.6 | 102.8±2.2 | 99.0±2.3 | 102.8±6.3 | 99.1±0.6 |
| 28 Days | 97.5±5.4 | 94.3±3.7 | 96.1±0.4 | 104.0±5.3 | 96.0±5.1 | 104.7±2.6 |
| Freeze-thaw stability (−20 °C/20 °C) | ||||||
| Cycle 1 | 107.6±2.6 | 104.6±6.0 | 109.7±0.8 | 106.0±2.4 | 97.6±3.5 | 104.1±3.5 |
| Cycle 2 | 109.0±0.8 | 106.3±5.4 | 110.7±0.9 | 106.7±2.3 | 96.9±3.6 | 102.6±2.7 |
| Cycle 3 | 103.1±7.3 | 99.1±3.9 | 96.9±2.3 | 94.7±2.5 | 108.1±1.8 | 99.6±3.0 |
| Post-preparative stability (−20 °C, 24 h) | 107.9±1.5 | 109.2±2.5 | 109.5±0.5 | 105.9±3.1 | 102.2±2.8 | 94.1±2.6 |
Bile Samples
For bile samples, the calibration curves exhibited good linearity over the range of 0.1 to 20 μg/mL. The intra-day and inter-day precision did not exceed 3.2% CV across the range tested. Accuracy was within 3.1% deviation from nominal concentrations (Table 3). The LLOQ for bile analysis was 0.1 μg/mL, with intra-day and inter-day precision of 2.6% and 3.2% CV, and inaccuracy of 0.4% and 2.1% (Table 3). Nemonoxacin was also stable in bile under different conditions (Table 4).
Pharmacokinetic Study in Rats
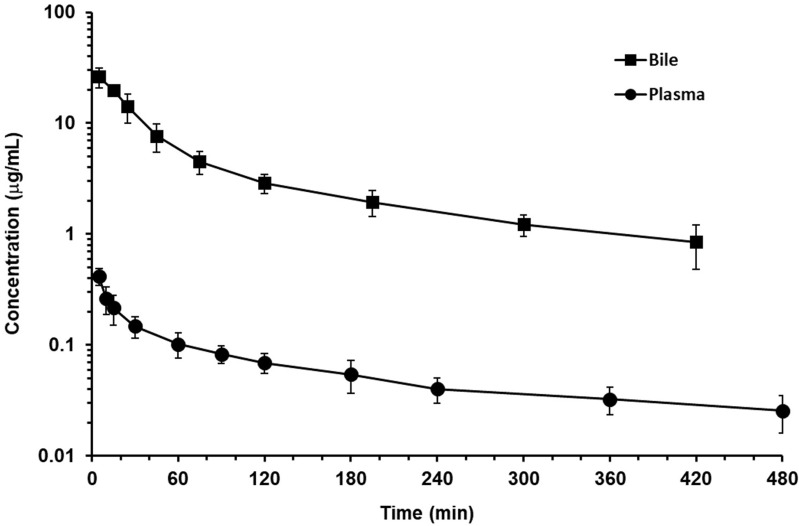
The validated fluorometric HPLC method was successfully applied to a disposition and biliary excretion experiment in male rats (n = 5) after intravenous administration at a dose of 1 mg/kg nemonoxacin. The concentration–time curves in plasma and bile are illustrated in Figure 6. PK analysis was conducted, and the parameters are summarized in Table 5. A two-compartment model was employed to describe the plasma profile, and non-compartmental analysis was used for bile.
Figure 6.
The mean plasma and bile concentration-time profiles of nemonoxacin in SD rats following intravenous bolus (n = 5; dose = 1 mg/kg). Values are expressed as mean ± S.D.
Table 5.
Pharmacokinetic Parameters of Nemonoxacin Following Intravenous (1 mg/kg) Administration
| n=5 | Parameters | Mean±S.D. |
|---|---|---|
| Plasma disposition | T1/2,α (min) | 12.8±7.2 |
| T1/2,β (min) | 238.6±29.5 | |
| CL (mL/min/kg) | 24.6±5.8 | |
| Vss (mL/kg) | 7101.8±1971.2 | |
| AUC0-480 (μg.min/mL) | 29.9±6.6 | |
| Biliary excretion | Ae0-480 (μg) | 23.9±5.3 |
| AUC0-480 (μg.min/mL) | 1505.6±319.6 | |
| AUCbile/plasma | 50.7±6.9 |
Abbreviations: T1/2,α, half-life of alpha phase; T1/2,β, half-life of beta phase; CL, clearance; Vss, volume of distribution; AUC0-480, area under curve of 0–480 min; Ae0-480, cumulative amount excreted in bile over the 480‐min collection interval.
The assay offered sufficient sensitivity to follow nemonoxacin levels in both plasma and bile matrices. The plasma concentration–time profiles with a distribution half-life of 13 ± 7 min and an elimination half-life of 239 ± 30 min were parallel to the bile. The total recovery of bile was only 7.8 ± 1.7%, but the bile concentration was much higher. The bile-to-plasma area under concentration–time curve ratio (AUCbile/plasma) estimated for 0–480 min were 50.7 ± 6.9, which is significantly higher than 1, suggesting that nemonoxacin was actively secreted into bile. The potential effect of transporters on the drug–drug interaction of nemonoxacin is worthy of further study. Similar to the human PK profile, nemonoxacin has a large distribution volume of 7101.8 ± 1971.2 mL/kg in rats, but with a low to medium clearance of 24.6 ± 5.8 mL/min/kg.
Conclusion
In summary, this work successfully developed and validated a simple, rapid and sensitive HPLC FL method for nemonoxacin quantification in small sample volumes of rat plasma and bile. The method demonstrated excellent accuracy, precision and sensitivity to support preliminary PK studies in small animals. The proposed method was successfully applied to study the plasma disposition and biliary excretion kinetics of nemonoxacin in rats. The high bile-to-plasma area under concentration–time curve ratio suggests active secretion into bile that merits further investigation in the potential drug–drug interaction.
Acknowledgments
The authors are grateful to TaiGen Biotechnology Co., Ltd. (Taipei, Taiwan) for providing the nemonoxacin malate hemihydrate standard.
Disclosure
The authors report no conflicts of interest in this work.
References
- 1.Lai CC, Lee KY, Lin SW, et al. Nemonoxacin (TG-873870) for treatment of community-acquired pneumonia. Expert Rev Anti Infect Ther. 2014;12(4):401–417. doi: 10.1586/14787210.2014.894881 [DOI] [PubMed] [Google Scholar]
- 2.Huang CH, Lai CC, Chen YH, Hsueh PR. The potential role of nemonoxacin for treatment of common infections. Expert Opin Pharmacother. 2015;16(2):263–270. doi: 10.1517/14656566.2015.978288 [DOI] [PubMed] [Google Scholar]
- 3.Zhao B, Yu X, Chen R, Zheng R. Efficacy and safety of nemonoxacin in outpatients with community-acquired pneumonia. Infect Drug Resist. 2020;13:2099–2104. doi: 10.2147/IDR.S248092 [DOI] [PMC free article] [PubMed] [Google Scholar]
- 4.Chung DT, Tsai CY, Chen SJ, et al. Multiple-dose safety, tolerability, and pharmacokinetics of oral nemonoxacin (TG-873870) in healthy volunteers. Antimicrob Agents Chemother. 2010;54(1):411–417. doi: 10.1128/AAC.00683-09 [DOI] [PMC free article] [PubMed] [Google Scholar]
- 5.Guo B, Wu X, Zhang Y, et al. Safety and clinical pharmacokinetics of nemonoxacin, a novel non-fluorinated quinolone, in healthy Chinese volunteers following single and multiple oral doses. Clin Drug Investig. 2012;32(7):475–486. doi: 10.2165/11632780-000000000-00000 [DOI] [PubMed] [Google Scholar]
- 6.Lin L, Chang LW, Tsai CY, et al. Dose escalation study of the safety, tolerability, and pharmacokinetics of nemonoxacin (TG-873870), a novel potent broad-spectrum nonfluorinated quinolone, in healthy volunteers. Antimicrob Agents Chemother. 2010;54(1):405–410. doi: 10.1128/AAC.00682-09 [DOI] [PMC free article] [PubMed] [Google Scholar]
- 7.Tang J, Cheng Q, Sun WX, Tian Y, Zhang Y. Determination of nemonoxacin in dog plasma by RP-HPLC. Chin J Antibiot. 2016;41:671–674. In Chinese, English abstract. [Google Scholar]
- 8.Guo B, Zhang J, Yu J, Wu X, Shi Y, Tsai CY. A liquid chromatography-tandem mass spectrometry assay for the determination of nemonoxacin (TG-873870), a novel nonfluorinated quinolone, in human plasma and urine and its application to a single-dose pharmacokinetic study in healthy Chinese volunteers. Biomed Chromatogr. 2012;26(11):1333–1340. doi: 10.1002/bmc.2699 [DOI] [PubMed] [Google Scholar]
- 9.He RR, Wei MJ. Determination of nemonoxacin in human plasma by LC-MS/MS. Chin J Clin Pharmacol. 2013;29:616–618. In Chinese, English abstract. [Google Scholar]
- 10.Zhang YF, Dai XJ, Yang Y, et al. Effects of probenecid and cimetidine on the pharmacokinetics of nemonoxacin in healthy Chinese volunteers. Drug Des Devel Ther. 2016;10:357–370. doi: 10.2147/DDDT.S95934 [DOI] [PMC free article] [PubMed] [Google Scholar]
- 11.He G, Guo B, Yu J, et al. Determination of a novel nonfluorinated quinolone, nemonoxacin, in human feces and its glucuronide conjugate in human urine and feces by high-performance liquid chromatography-triple quadrupole mass spectrometry. Biomed Chromatogr. 2015;29(5):739–748. doi: 10.1002/bmc.3350 [DOI] [PubMed] [Google Scholar]
- 12.Zhao J, Xu X, Zhu Y, et al. A UPLC-MS/MS method for rapid determination of nemonoxacin concentration in human lung tissues, bronchial mucosa and bronchial secretions and its clinical application. Chin J Infect Chemother. 2020;20:146–152. In Chinese, English abstract. [Google Scholar]
- 13.Cheng CL, Lin EG, Chou CH. Rapid and sensitive quantitation of the antiproliferative agent mitoguazone in small volumes of plasma by high-performance liquid chromatography with ultraviolet detection. J Chromatogr B Analyt Technol Biomed Life Sci. 2003;793(2):281–289. doi: 10.1016/s1570-0232(03)00328-3 [DOI] [PubMed] [Google Scholar]
- 14.Cheng CL, Chou CH, Hu OY. Determination of lamotrigine in small volumes of plasma by high-performance liquid chromatography. J Chromatogr B Analyt Technol Biomed Life Sci. 2005;817(2):199–206. doi: 10.1016/j.jchromb.2004.12.004 [DOI] [PubMed] [Google Scholar]
- 15.Cheng CL, Chou CH. Determination of tadalafil in small volumes of plasma by high-performance liquid chromatography with UV detection. J Chromatogr B Analyt Technol Biomed Life Sci. 2005;822(1–2):278–284. doi: 10.1016/j.jchromb.2005.06.017 [DOI] [PubMed] [Google Scholar]
- 16.Cheng CL, Kang GJ, Chou CH. Development and validation of a high-performance liquid chromatographic method using fluorescence detection for the determination of vardenafil in small volumes of rat plasma and bile. J Chromatogr A. 2007;1154(1–2):222–229. doi: 10.1016/j.chroma.2007.03.077 [DOI] [PubMed] [Google Scholar]
- 17.Cheng CL, Chang YW, Chou CH. HPLC-fluorescence assay for measuring mosapride in small volumes of rat plasma. Biomed Chromatogr. 2010;24(3):281–288. doi: 10.1002/bmc.1285 [DOI] [PubMed] [Google Scholar]
- 18.Park-Wyllie LY, Juurlink DN, Kopp A, et al. Outpatient gatifloxacin therapy and dysglycemia in older adults. N Engl J Med. 2006;354(13):1352–1361. doi: 10.1056/NEJMoa055191 [DOI] [PubMed] [Google Scholar]


