Abstract
Early detection of neurological deterioration in serious acute brain injury is seen as an important goal to reduce death and disability, but monitoring for neurological deterioration remains challenging. Routine methods, such as neurological examination and brain imaging, often identify brain injuries only after they have progressed to an irreversible stage. Alternate approaches such as invasive brain monitoring, are complex, costly and carry inherent risks. The optical brain pulse monitor (OBPM) is a novel, non-invasive, safe, and continuous monitoring device designed to provide earlier detection of neurological deterioration and address the limitations of traditional approaches. This review presents the development, technical aspects, and clinical results from past and ongoing trials over the last five years.
Keywords: brain monitor, acute brain injury, oxygen, cerebral blood flow, critical care, stroke
Introduction
Acute neurological deteriorations occur in around 40% of critically ill patients with severe traumatic brain injury (TBI), warranting urgent consideration for surgical intervention.1 Early detection and treatment of neurological deterioration is associated with better patient outcomes,2–4 and is therefore strongly recommended by expert panels, including the Australian Trauma Guidelines and The International Consensus Conference on Monitoring in Neurocritical Care.5–7
Monitoring for signs of neurological deterioration or secondary brain injury however remains problematic, in unconscious patients. Options include clinical examination or invasive forms of brain monitoring. Both have limitations. Clinical examination even when done well may detect brain injury at a late and potentially irreversible stage. Invasive oxygen and intra-cranial pressure (ICP) monitoring, while providing continuous and earlier detection are expensive, and have risks including ventricular infection rates of 9%, mild haemorrhage of 22% and haemorrhage with clinical deterioration of ~ 1% of patients.8
Non-invasive brain monitors have also not demonstrated consistent efficacy in detection of acute neurological deteriorations. Clinical studies found cerebral oximeters were poor at detection of acute stroke, did not improve clinical outcomes in premature infants with hypoxic brain injury and oxygen levels did not correlate with invasive brain oxygen levels in traumatic brain injury.9–11 Brain4care have developed a monitor that detects small variations in skull deformation induced by intracranial pressure changes; the “brain stethoscope” has a similar approach with the signal arising from tympanic membrane pulsations.12–15 Only B4C has published data in brain injured patients and has FDA approval.16,17 Diffuse correlation spectroscopy, and other near infrared spectroscopic (NIRS) non-invasive techniques, capture a pulsatile brain signal, features may be extracted to assess parameters such as cerebral blood flow, cerebral blood volume and ICP.18–22 To date these approaches remain at a research stage.
A major challenge in managing acute brain injury therefore is the development of safe continuous monitoring of the brain to detect neurological deteriorations earlier. The optical brain pulse monitor (OBPM) is an innovative, non-invasive, safe, and continuous monitoring device designed to detect neurological deteriorations earlier without the risks associated with invasive monitoring. This review presents the development, technical aspects and clinical results from past and ongoing trials.
The Optical Brain Pulse Monitor
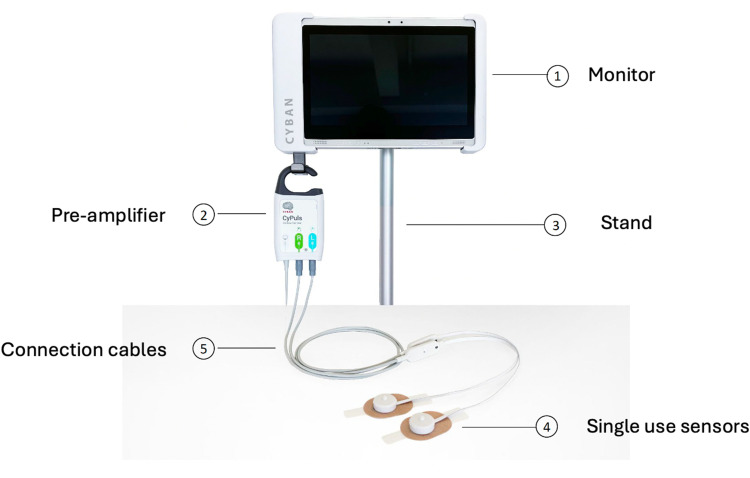
OBPM uses near infra-red (NIR) (660 nm) and red (940 nm) light sources to detect cardiac pulsations and respiratory waves arising from the brain (Figure 1). These represent a combination of blood flow, blood oxygen and brain motion changes associated with the cardiac (brain pulses) and respiratory cycles.23–25
Figure 1.
The Optical brain pulse monitor.
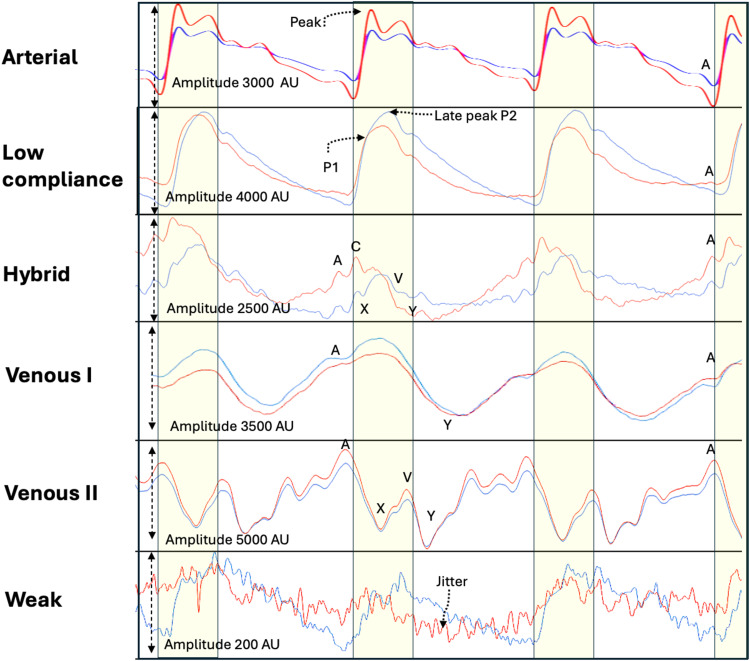
In published and ongoing studies, we have identified several distinct classes of OPBM brain pulses in normal and injured brains (Figure 2). The Arterial brain pulse is seen in normal brains, while in injured brains the pulse classes include the Low compliance brain pulse. This pulse has similar features to invasive ICP monitoring waveforms seen with low brain compliance states or raised ICP;24 the Hybrid brain pulse is associated with low cerebral blood flow, and the Venous I brain and the Venous II brain pulses, both of which are associated with very low or no cerebral blood flow. The Weak brain pulse also represents a very low cerebral blood flow state but does not have central venous features.
Figure 2.
Classes of Brain pulses. The uppermost panel demonstrates a normal Arterial compression brain pulse. The pulse has similar shape to a normal arterial pressure waveform. The next panel demonstrates a Low compliance brain pulse has a shape like an invasively measured low brain compliance or high intra-cranial pressure waveform, with a delayed time to P2 and high P2/P1 ratio, an A wave may be present. It has clear and distinct features consistent with increased blood volume in the pial venules. The Hybrid brain pulse 940 and 660 nm pulse shapes are quite distinct from each other and may also have some venous pressure features including subtle A, X, C, V and Y waves, consistent with reduced arteriole pressure levels. The Venous I brain pulse has somewhat undifferentiated features. Consistent with similar arteriole and central venous pressure levels throughout the cardiac cycle. The start of the pulse may be difficult to determine. Commonly a trough is present in the diastolic phase consistent with a Y wave. The systolic phase of the pulse may have discernible Arterial brain pulse features. The 660 and 940 nm pulses have similar shapes. The Venous II brain pulse is like the Venous I but demonstrates clear central venous waveform features though out the cardiac cycle. The combination of a X wave (in systole) and the Y wave (in diastole) suggest arteriole pressure is lower than the central venous pressure throughout the cardiac cycle. The Weak brain pulse is characterized by a low pulse amplitude < 1000 AU and prominent jitter throughout and is consistent with very low cerebral blood flow. Red brain pulse is 940 nm and blue brain pulse 660 nm. The yellow area represents the systolic phase of the cardiac cycle and the white the diastolic phase.
Non Cardiac Cycle Related Oscillations
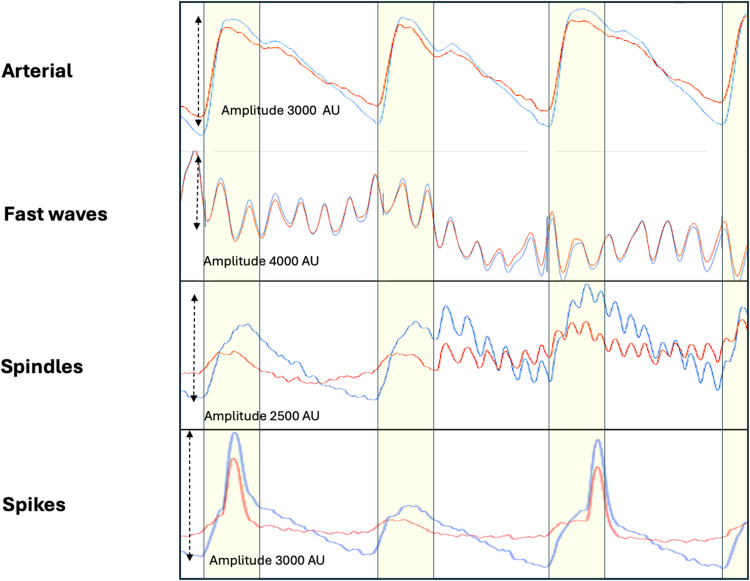
Other classes of oscillations are present in injured brains that appear unrelated to the cardiac or respiratory cycles, such as Fast waves and Spindles which demonstrate high frequency oscillations (7–14 hz), and also spikes (Figure 3).
Figure 3.
Non cardiac cycle related brain oscillations in brain injury. The upper panel demonstrates a normal Arterial brain compression pulse. The next panel Fast waves which oscillate at high frequencies (8–14 hz). The amplitude is typically high > 2000 AU with symmetry of 940 and 660 nm throughout the cardiac cycle. Spindles also oscillate at high frequencies (10 −14 hz), but are typically brief, just a few heart beats in duration and the amplitude lower than Fast waves. Spikes are typically single brief waves. They are usually independent of the cardiac cycle. Red brain pulse is 940 nm and blue brain pulse 660 nm. The yellow area represents the systolic phase of the cardiac cycle and the white the diastolic phase.
Respiratory Waves
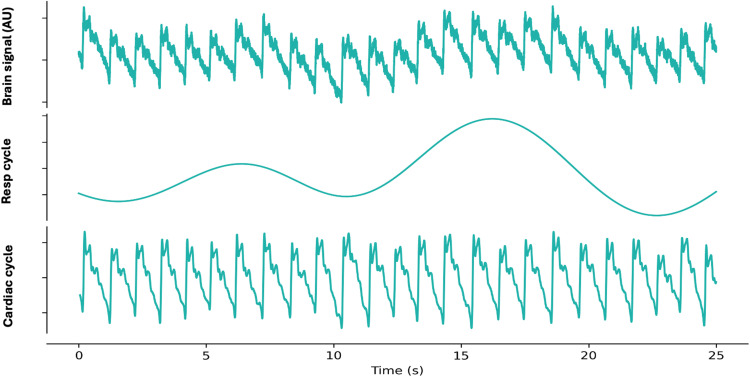
Intra-thoracic pressure oscillations associated with the respiratory cycle have marked influences on both brain venous flows and central spinal fluid (CSF) flows which in turn induce brain motion.26–30 These responses give rise to respiratory waves detectable in the OPBM signal (Figure 4). In cases of brain injury, there may be notable differences in the amplitude of respiratory waves between the hemispheres.
Figure 4.
Separation of the Optical brain pulse signal (upper panel) with signal processing into its components, the respiratory cycle (middle panel) and cardiac cycle (lower panel). Resp: Respiratory, AU: arbitrary units.
Optical Intensity
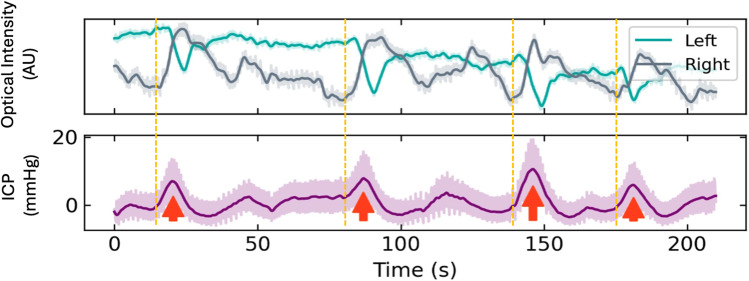
The optical intensity and it’s ratio (OIR) assess responses in 660 nm and 940 nm light absorption levels over longer time frames than the cardiac or respiratory cycles. These include slow oscillations in cerebral blood flow such as Lundberg B waves (Figure 5) or blood volume and brain swelling changes associates with acute stroke and haemorrhage.31,32
Figure 5.
Lundberg B waves. The Optical Intensity (660 nm) demonstrates slow waves over the left and right hemispheres associated with Lundberg B waves present in the invasive intra-cranial pressure (ICP) signal. The right sided changes are a little earlier than the left suggesting increased cerebral blood flow on the that side.
Notes: Adapted from Teo EJ, Petautschnig S, Hellerstedt J, et al. Cerebrovascular Responses in a Patient with Lundberg B Waves Following Subarachnoid Haemorrhage Assessed with a Novel Non-Invasive Brain Pulse Monitor: A Case Report. Med Devices (Auckl). 2024;17:73–87.31
Hardware
The bedside OBPM is comprised of a roll-stand with an enclosure containing the Graphical User Interface (GUI) (a Tablet PC), a power supply for all components. The monitor’s LED and PD are controlled and processed by an Integrated Analog Front End circuit board, which digitizes the received signal from each sensor and sends the data stream to the Tablet PC. The PC receives the sensor data from the Processing Unit, and presents the data on a display, along with patient identifier data to the operator, via a custom software application.
Signal Analysis
For all the studies in this review the data from the OBPM was captured at a rate of 500 hz and stored for subsequent analysis. This analysis was conducted using Python v3.10, SciPy v1.10. Raw data cleaned using an automated pipeline to remove artifacts such as photodetector saturation, temporary disconnection, and motion. The clean data were filtered to highlight specific frequency components relevant to physiological mechanisms for quantitative analyses. The respiratory and cardiac frequency components were isolated using a Butterworth bandpass filter (0.052–0.1 hz) for respiration and a high-pass filter (>0.5 hz) to preserve cardiac and higher-frequency components, both applied with the filtfilt function from the SciPy package. Synchronous recordings were made with the routine intensive care monitoring outputs, such as blood pressure, central venous pressure, ECG, end tidal CO2 and heart rate. The physiological data was exported from the Philips IntelliVue system using ICM+ (Cambridge Enterprise, Cambridge, UK. All components of the OBPM were developed and built by Cyban Pty Ltd in Melbourne, Australia.
Photodetector and Light Emitting Diode
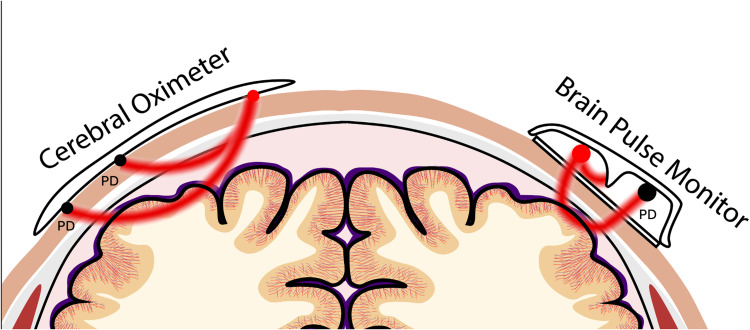
Unlike other NIR monitors, such as cerebral oximeters, the OBPM uses a single photodetector (PD). As with any NIR approach, minimising signal contamination from blood flow in the extra-cranial tissue layers is fundamental to accurately obtaining a brain signal. The relationship of the light emitting diode (LED) and PD’s spatial positions in relation to the skin provides a novel approach to achieve this. Both PD and LED are recessed away from the skin surface, unlike cerebral oximeters that maintain direct contact with the skin (Figure 6).33
Figure 6.
Comparison with cerebral oximeters. The Optical brain pulse monitor has a light emitting diode (LED) and single photodetector (PD) recessed away from the skin with no direct contact. In addition, a shorter separation between the LED and PD.
This design assumes that deeper photons are reflected from the brain back toward the PD over a wider arc as compared to photons reflected from the skin. The PD is strategically positioned within this wider arc to primarily capture the beam of predominately brain-reflected photons. No direct contact of the LED and PD with the skin further reduces the likelihood of skin photons reaching the PD through physical skin distortion by the LED and PD which increases photon scatter within the skin.34
The separation between the LED and PD along the horizontal axis is shorter in the OBPM compared to other NIR approaches, such as cerebral oximeters, which typically have a separation of approximately 40 mm (Figure 6).33,35 Characteristics related to the skull and brain blood flow support this configuration for optical detection of a brain signal. Unlike cerebral oximeters, the OBPM sensor is placed over thinner areas of the skull, similar to the positions used by transcranial Doppler devices.36 The average minimum thickness of adult temporal bone is approximately 1 mm, and the occipital bone 2 mm.37,38 In contrast, the frontal bones over which cerebral oximeters are placed are much thicker.39,40 Consequently, it can be assumed that the scalp surface to cortical distance is relatively short, approximately 12 mm in the OBPM sensor positions.35
Brain Optical Source
A significant proportion of the brain’s blood supply is located on the cortical surface in the pial venules within the sub-arachnoid space. The pial venules act as a blood reservoir.41–43 The blood volume fraction of skin is quite low, between 1–5%,34 while in the upper brain’s dense vasculature of pial vessels, this figure approaches 100%.44 So, while the path length of photons in the skin layer is ~ 20 times more than in the upper brain, there is 20 times more blood present in the brain layer compared to the skin. Thus, a large venous blood volume lays on the surface of the cortex, providing a strong optical signal. Blood oxygenation level dependent (BOLD) functional magnetic resonance imaging studies have also found that pial venous blood has a more dynamic response to physiological changes than the cortical capillary blood, potentially providing greater optical responses to acute deteriorations.41,45,46
Brain Motion
Pulsatile blood volume changes are not the only source of the brain pulse signal. The brain is one of the softest tissues in the human body and deforms under its own weight.47 Cerebral blood flow, CSF dynamics, and breathing all induce brain motion.30,48 Approximately 750 mL of blood enters and exits the brain each minute, giving rise to significant pressure waves across the soft brain tissues, which surprisingly can also induce subtle skull deformation.49–51 In cases of brain injury, distinct brain motions are observed across both hemispheres,48,49,52 which can be detected using the OBPM.
Sensor Placement and Signal Capture
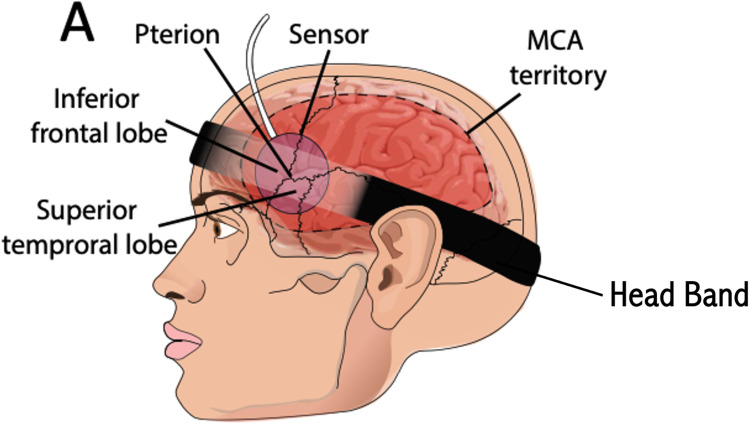
Obtaining an optimal brain pulse signal using the OBPM requires adjustment of the sensor’s position. The adjustment may be necessary due to variations in bone thickness with the need to locate a thin “bony window” (Figure 7).35 In addition, the surface of the cortex has undulating gyri and sulci with distinct geographical blood distributions. The penetrating cortical ascending venules reach the cortical surface on the gyri, while the pial venules largely travel along the sulci to form cortical veins.53 Each gyrus has a dominant vein or veins occupying the centre with abundant arborisations and vast numbers of venules. The venule rich gyri may be an important source of the brain pulse signal, as the relative blood volume is higher compared to other areas.53 There are also described 180 distinct neurovascular regions in the brain that have unique vascular, histological and functional features. There is homogenous blood flow within a region. A high-fidelity brain pulse signal may require light interacting within a neurovascular region.54
Figure 7.
Position of the sensor to obtain a brain pulse signal from the frontal or temporal lobes supplied by the middle cerebral artery.
Notes: Adapted from Teo EJ, Petautschnig S, Hellerstedt J, et al. Cerebrovascular Responses in a Patient with Lundberg B Waves Following Subarachnoid Haemorrhage Assessed with a Novel Non-Invasive Brain Pulse Monitor: A Case Report. Med Devices (Auckl). 2024;17:73–87.31
Positioning the sensor is achieved using a headband to maintain stability (Figure 7). Identifying the distinctive features of the brain pulse signal allows location of a suitable position. Once an appropriate brain signal is identified, the sensor’s skin adhesive is deployed to secure the sensors in fixed position and to minimise movement artefacts.
The sensor is typically placed on the temporal bone behind the orbit. This captures signals from the frontal or temporal lobes, both supplied by middle cerebral arteries (MCA). Other “bony windows” include the posterior temporal bone above the ear, which captures signals from the temporal lobes supplied by the MCA and/or posterior cerebral artery’s (PCA), and the occipital or parietal bones over the occipital lobe.
The headband pressure should be kept modest (< 25 mmHg) to prevent pressure effects on the skin. The skin should be monitored every eight hours, and the headband pressure should be released for 30 minutes periodically. For overnight recordings, where patient movement is more likely, it is important for the headband to be secured with adhesive behind the ears and mid forehead to prevent sensor movement.
OBPM Brain Pulse Classes
Normal Brain Pulse
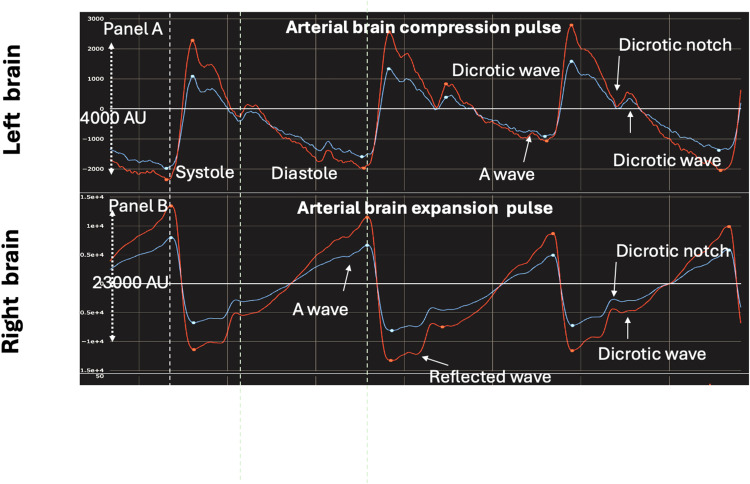
In healthy individuals, the brain pulse shape resembles an arterial pressure wave. There are two subclasses of Arterial brain pulses - the Arterial compression pulse and the Arterial expansion pulse (Figure 8). The terms “compression” and “expansion” refer to the likely blood volume changes in the pial venules during the systolic phase of the cardiac cycle.
Figure 8.
Comparison of normal Arterial brain compression (Panel (A) pulse and Arterial brain expansion pulse (Panel (B) measured simultaneously in the left and right hemispheres. The expansion pulse is likely associated with higher pial venule blood pressure and blood volume than the compression pulse. The expansion pulse is a mirror image of the compression pulse shape but the expansion pulse has high cerebral blood flow features including a higher pulse amplitude, an earlier reflected wave and a clearer A wave. It has clear and distinct pulse features consistent with increased blood volume in the pial venules. Red brain pulse is 940 nm and blue brain pulse 660 nm.
The Arterial compression brain pulse has a sharp increase in light intensity during early systole. The waveform likely reflects the arterial systolic pressure driving an increase in brain volume, which in turn compresses and empties blood from the pial venules, resulting in increased light reaching the PD.30,55–60 The systolic pressure wave in the CSF (ventricles, subarachnoid space and Virchow-Robin perivascular spaces) may also contribute to systolic compression and emptying of pial venules.61–64 During diastole, the cortical brain volume decreases, and the pial venule blood volume increases, corresponding to a fall in the light intensity (Figure 8, panel A).
Of historical interest it was noted in 1925 by Sir Howard Florey, in his microscopic study of cat brain pial blood flow…”that as the arteries expand the veins lessen in diameter, and this occurs synchronously with the heart-beat. This probably exhibits the normal relationship in the vessels, for the brain being enclosed in a rigid case, with the accompanying restrictions of flow by reason of this, as the blood is forced into the arteries the veins are compressed to make way for this increase”.55
MRI studies also demonstrate a fall in venous blood volume during systole.56,62,63 Cardiac pulsations in cortical veins are also observed in MRI studies and are slightly delayed relative to the cardiac pulse in the superior sagittal sinus, which may reflect pressure waves in the CSF compressing the venous sinuses.65 The pulse shape of the 940 nm and 660 nm wavelengths are similar. The equivalent of an A wave (central venous pressure right atrial contraction) may be present in late diastole (Figure 2). Other brain monitors, including invasive ICP monitoring and MRI CSF flow imaging, also detect A waves.66–68
The normal Arterial expansion brain pulse is essentially a mirror image of the compression pulse, demonstrating a negative change in the light intensity during early systole. The arterial character is more prominent, suggesting relatively higher cerebral blood flow. The Arterial expansion pulse may result from pial venules with relatively higher blood pressure that resists compression during systole. It also has clear and distinct pulse features consistent with increased blood volume in the pial venules giving rise to a high-fidelity optical signal (Figure 8, Panel B).69,70
Brain Pial Blood Diastolic Blood Oxygen Levels are Lower Than Systolic
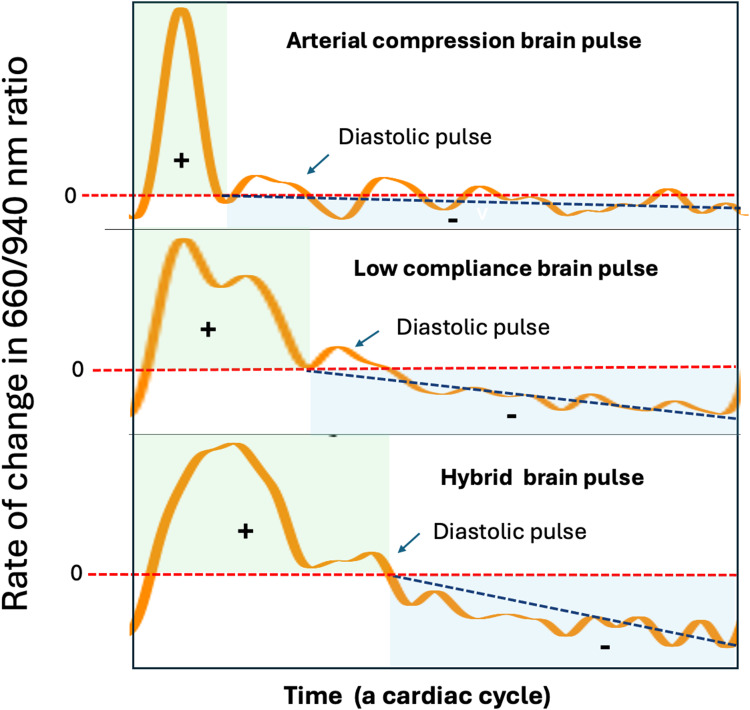
The rate of change in the ratio of 660 nm to 940 nm light levels may provide additional information on the speed and direction of change in blood oxygen levels within a cardiac cycle. Oxygenated haemoglobin has high 940 nm absorption, while deoxygenated haemoglobin high 660 nm absorption. During the cardiac cycle, the brain diastolic oxygen falls compared to the systolic levels, causing the 660/940 ratio to increase during systole and decrease during diastole. The temporal pattern of the rate of change in the 660/940 ratio can be used to identify high, normal and low cerebral blood flow and oxygen states in the brain pulse classes (Figure 9). In a normal Arterial compression brain pulse, the 660/940 ratio increases rapidly in early systole and slowly decreases thereafter. This pattern is consistent with rapid oxygen delivery in early systole with adequate cerebral blood flow throughout the remaining cardiac cycle.
Figure 9.
Classes of brain pulses and the rate of change in the 660/940 nm ratio. The rate of change in the 660/940 nm ratio, may represent the speed and direction of change in blood oxygen levels during a cardiac cycle. The Y axis represents the direction and rate of change. A rate greater than 0 (red serrated line) represents an increase in oxygen levels, while less than 0 a fall in oxygen levels. The duration of increasing oxygen levels is delineated by the green shaded area. The duration of the fall in oxygen levels is delineated by the blue shaded area. For the Arterial brain compression pulse there is a rapid and steep increase in the 660/940 ratio, thereafter there is a long gentle fall. The gentle slope (or rate of fall) is indicated by the black serrated line. In comparison for the Low compliance brain pulse the rate of increase in 660/940 ratio is less steep, and the duration of increase longer, while the rate of fall in diastole is steeper and the duration of fall shorter. In comparison to the Low compliance brain pulse for the Hybrid brain pulse the rate of increase is less steep, and the duration of increase longer, while the rate of fall is steeper and the duration of fall shorter. These findings suggest that compared to the normal arterial brain pulse cerebral blood flow and oxygen levels are lower in the low compliance brain pulse and even lower again in the Hybrid brain pulse. Of note the Diastolic pulse is associated with a brief increase in the 660/940 ratio.
Brain Pulse Classes in Brain Injury
We consider the major cerebrovascular factor influencing the OBPM pulse shapes is the relative arteriole to venous pressure levels acting on the microvascular beds in the injured brain. We found in brain injury and stroke patients, we were able to identify classes of brain pulses exhibiting strong central venous pressure features, including A, C, X, V, and Y waves. These findings suggest that the central venous pressure may become an important determinant of microvascular blood volume oscillations and cerebral blood flow in brain-injured states where arteriolar pressure levels may be similar or lower than venous pressure.
Hybrid Brain Pulse
The 940 nm and 660 nm wavelengths, have pulse shapes that are clearly different from each other. The 660 nm pulse peak and trough are delayed relative to the 940 nm peak and trough (Figure 2). Low cerebral flow with an increased difference between the systolic and diastolic oxygen levels is the likely cause of the distinct pulse shapes of 940 and 660 nm. The pulse shape difference can be graphically assessed using the rate of change in the 660/940 ratio over the cardiac cycle. Compared with the Arterial brain pulse, the 660/940 ratio peaks later in systole, and thereafter levels fall more rapidly over diastole, consistent with reduced cerebral blood flow and oxygen levels (Figure 9).
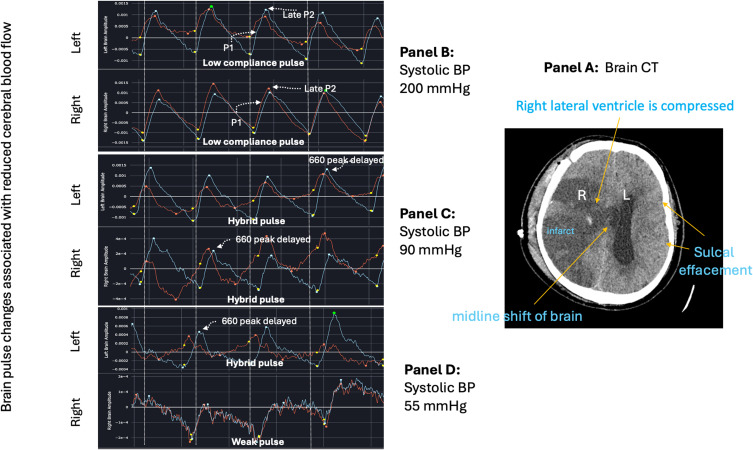
In an ongoing OBPM study of acute stroke patients and also in an animal model of acute MCA stroke, the Hybrid brain pulse was associated with low cerebral blood flows as documented by Computed Tomography (CT) perfusion in the human study and was temporally associated with stroke onset in the animal study.71,72 Figure 10 demonstrates a Hybrid brain pulse in a patient with a large right MCA stroke with a midline shift (Panel A) during an acute fall in arterial pressure (Panels C and D).
Figure 10.
Brain pulse class changes associated with hypotension and an acute fall in cerebral arteriole pressure over 6 minutes in a brain injured patient. Panel (A) Patient with large volume right middle cerebral artery stroke with raised intracranial pressure evidenced by midline shift to the left on computerized tomography (CT). Panel (B) demonstrates low compliance brain pulse over both hemispheres associated with high systolic blood pressure (BP) of 200 mmHg. Panel (C) Systolic BP dropped to 90mmHg. Both hemispheres’ brain pulses have developed Hybrid brain pulse features with delayed pulse peak of 660 nm compared with 940 nm and other differences in the respective pulse shapes. Panel (D) Systolic BP falls further to 55 mmHg. The left brain has Hybrid brain pulse features and the right now has Weak brain pulse features. Red brain pulse is 940 nm and blue brain pulse 660 nm. (R) Right. (L) Left.
Venous I Brain Pulse
The Venous I brain pulse likely reflects a period where arteriole and venous pressure levels are similar. This gives rise to a brain pulse with somewhat undifferentiated features, making the start of the pulse difficult to determine. Typically, a trough is present in the diastolic phase of the cardiac cycle, consistent with a Y wave, which may represent right ventricular relaxation due to increased venous drainage in early diastole. The Y wave suggests arteriole pressure is lower than the central venous pressure during the diastolic period of the cardiac cycle. The systolic phase of the pulse may have discernible Arterial brain pulse features, indicating the systolic arteriole pressure level may exceed or equal the venous pressure. The contours of the Venous I pulse are rounded rather than sharp. The 940 nm and 660 nm pulse shapes are similar (suggesting blood oxygen levels are unchanged over the cardiac cycle) and the pulse amplitude is high (> 2000 AU) (Figure 2). Overall, these features are consistent with very low cerebral blood flow.
Venous II Brain Pulse
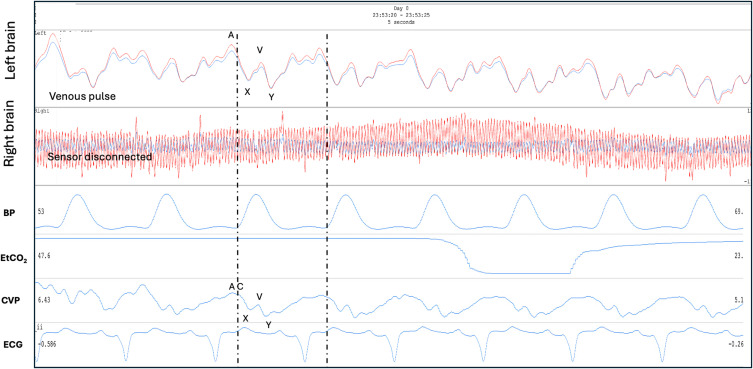
The Venous II brain pulse is like the Venous I but demonstrates clearer central venous waveform features though out the cardiac cycle (Figure 2). The combination of an X wave (in systole) and the Y wave (during diastole) suggest arteriole pressure is lower than the central venous pressure throughout the cardiac cycle and cerebral blood flow is therefore very low and may be reversed with venous flow toward the brain. The 940 nm and 660 nm pulse shapes are also similar. Figure 11 demonstrates a Venous II pulse in a patient following cardiac arrest requiring extra-corporeal membrane oxygenation (ECMO) who subsequently demonstrated severe brain injury with fixed dilated pupils. In this example the central venous pressure trace was also recorded. The pulse shapes are remarkably similar for the Venous II brain pulse and the central venous pressure waves.73 In an ongoing OBPM study of acute stroke patients, we found the Venous I and II brain pulses were associated with large areas of low cerebral blood flows on CT perfusion and were also temporally associated with stroke onset in an animal model of MCA stroke.71,72 Figure 12 demonstrates bilateral Venous II brain pulses in a patient post-thrombectomy for a large left MCA stroke. The patient sustained severe brain injury with a poor clinical outcome.
Figure 11.
Venous II brain pulse. A patient on extra-corporeal membrane oxygenator (ECMO) following prolonged out of hospital cardiac arrest. The left brain demonstrates a Venous II brain pulse with strong central venous pressure features, consistent with the arteriole pressure less than the venous pressure in this area of injured brain. The simultaneous central venous pressure (CVP) trace is demonstrated. The A, C, X, V, Y waves are labelled. The patient had a severe brain injury and subsequently developed fixed dilated pupils. The routine intensive care monitoring is shown BP, EtCO2 and ECG. Red brain pulse is 940 nm and blue brain pulse 660 nm. (the right brain sensor was disconnected).
Figure 12.
Post thrombectomy for large left middle cerebral artery stroke. Venous II brain pulses are present over both hemispheres following thrombectomy for a L middle cerebral artery stroke. The patient developed a severe brain injury with a very poor neurological outcome. The A, C, X, V, Y waves are labelled. The routine intensive care monitoring is shown BP, EtCO2. The Red brain pulse is 940 nm and blue brain pulse 660 nm.
In brain injury, the brain pial venule blood volume increases over time despite reduced cerebral blood flow.55,65,74–76 This may explain the high amplitude of the Venous I and II pulse signals. The similar pulse shape of 940 nm and 660 nm wavelengths suggests oxygen levels are relatively unchanged during systole and diastole, unlike with a Hybrid pulse in which the difference in systolic and diastolic oxygen levels is increased. The brain pulse shape may largely reflect venous pressure oscillation of the microvascular blood volume or movement of the brain itself.
The literature is sparse regarding the influence of the venous circulation on cerebrovascular responses following brain injury. Venous catheterization to measure venous pressure in the upstream sagittal sinus and transverse sinuses, in normal brains demonstrate a waveform with predominately arterial features and with some subtle central venous features. Downstream the venous features are more obvious in the sigmoid sinus and internal jugular veins.77 In settings of brain injury with reduced arterial pressure, the venous waveform features are more prominent.77–79
Doppler studies in severe brain injury have demonstrated upstream or reversed flow in cerebral veins with increased central venous pressure wave features.77–79 A study of 53 brain-dead patients with no arterial flow found 50% had radiotracer within the brain’s superior sagittal sinus following peripheral vein injection. This suggests possible upstream venous flow toward the brain.80 Other studies in brain death also found evidence of upstream flow into the cerebral venous sinuses.81,82 Radiological studies also demonstrate enlarged cortical veins following brain death.76,83 The valveless nature of the vertebral venous plexus which connects the brain with the spinal column veins and drains blood from throughout the body, could provide such a pathway.84
Weak Brain Pulse
The Weak pulse may occur in an early phase of brain injury and is associated with very low cerebral blood flow and likely reduced blood volumes in the pial venous system, giving rise to a indistinct optical signal with a very low pulse amplitude (< 1000 AU). This very weak signal has a background jitter at around 20 hz (Figure 2). The origin of this jitter, whether physiological or artefactual, is not clear. We have noted the Weak pulse in patients following out of hospital cardiac arrest who developed severe brain injury.73 Figure 10 demonstrates a Weak brain pulse (Panel D) associated with an acute fall in arterial pressure in a patient with a pre-existing large right MCA stroke (panel A) and midline shift.
Low Compliance Brain Pulse
The Low compliance brain pulse is similar in shape to invasively measured ICP waveforms with low brain compliance features or raised ICP levels in patients with a brain injury.24,51,85–87 The classic features associated with reduced brain compliance include an increase in the amplitude of P2 relative to P1 and a delayed time to the pulse peak (Figure 2).51,88 We have documented this class of OBPM brain pulse in patients with brain injuries associated with brain swelling including sub-arachnoid haemorrhage, prolonged cardiac arrest and large strokes. Figure 10 demonstrates bilateral Low compliance brain pulses in a patient with a large right MCA stroke and midline shift to the left (Panels A and B).73
The pulse shape demonstrates very clear features, including the pulse start, the systolic peak, the dicrotic notch, and dicrotic peak, with a high amplitude of > 2000 AU. These findings suggest that the pial venule blood volume is increased providing a high-fidelity optical signal, as may be expected with brain swelling and downstream compression of the venous sinuses. Brain swelling negatively impacts on venous drainage through compression of the sagittal and transverse sinuses.89–91
The Low compliance waveform likely results from a mismatch between arterial blood inflow with impaired venous outflow from the brain. The pulse peak is therefore delayed with a dominant P2.92 Studies have demonstrated that augmenting venous drainage resolves these ICP waveform changes.89–91 Assessment of the rate of change in the 660/940 ratio, shows that peak rate of change is reached later in the cardiac cycle and levels fall more rapidly in diastole than is seen with a normal OBPM arterial brain pulse. This is consistent with reduced cerebral blood flow and oxygen levels (Figure 9).
Hyper-Perfusion Brain Pulse
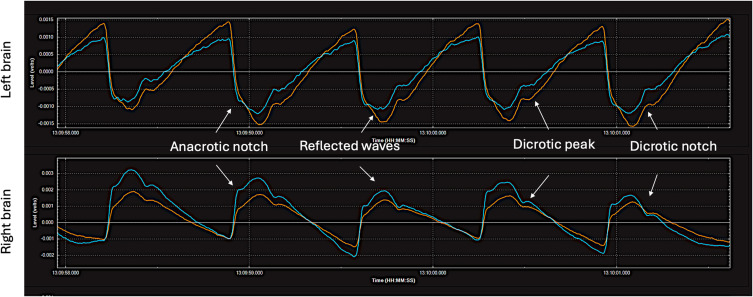
The Hyper-perfusion brain pulse shape resembles peripheral arterial pressure waves with features of vasoconstriction. These include an anacrotic notch due to a reflected wave.93,94 Figure 13 demonstrates a patient with possible late hyperperfusion syndrome of the left and right MCA territories on day 12 following a SAH. The patient’s blood pressure was 180/80 mmHg.
Figure 13.
Hyper-perfusion brain pulses on both hemispheres. A patient with possible cerebral hyper-perfusion syndrome on day 12 following a Grade V sub-arachnoid haemorrhage. The blood pressure was 180/80 mmHg. The patient had a poor neurological outcome. The pulse shape is like that seen in a peripheral arterial pressure trace with vasoconstriction. These features include an anacrotic notch and an early reflected wave. It has clear and distinct pulse features consistent with increased blood volume in the pial venules. Red brain pulse is 940 nm and blue brain pulse 660 nm.
Non Cardiac Pulse Related Oscillations
Other classes of brain waveforms are also present in injured brains that appear unrelated to the cardiac or respiratory cycles.
Fast Waves, Spindles and Spikes
Fast waves and Spindles oscillate at high frequencies (7–14 hz). Fast waves usually have a duration of longer than 20 seconds, while Spindles are brief with a duration of a few cardiac cycles (Figure 3). The underlying cardiac brain pulse usually remains present unless the Fast wave amplitude is very high (> 4000 AU) dominating it. The 660 and 940 nm waves share similar morphology suggesting an oscillation or motion of brain tissue rather than an effect related to high frequency oscillation of oxygen levels. Fast waves typically have a dominant brain side with a lower amplitude signal on the contralateral side. Fast waves and Spindles are seen in injured brains or in settings of brief periods of change in cerebral blood flow, such as onset of acute hypoxia, as demonstrated in a human volunteer study.23 The oscillation may also be triggered in an injured brain by painful stimulation, of the contra-lateral side. We have noted Fast waves in several intensive care unit patients prior to clinical seizure onset or during seizure.
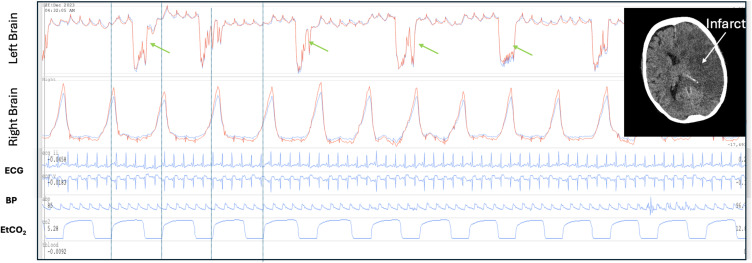
Spikes are typically single very brief waves and are also associated with brain injury (Figure 3). In severe brain injury the spikes may develop more complex or bizarre features. Figure 14 demonstrates bizarre spikes in a patient an acute large left middle cerebral artery infarct with midline shift to the right. In this case the large amplitude spike is followed by a rapid higher frequency low amplitude oscillations. High amplitude respiratory waves are also present over the right hemisphere.
Figure 14.
Spikes and respiratory amplitude changes in a brain injured patient. Patient with established large left middle cerebral artery infarct day 2 following cardiac surgery. Complex large amplitude spikes in the left brain (green arrows). The initial spike is followed by a rapid high frequency lower amplitude oscillations. The spikes are not synchronous with breathing (blue vertical lines demonstrate the respiratory period). There is a low amplitude cardiac pulse. On the right side the optical brain pulse monitor demonstrates a very high respiratory to cardiac amplitude ratio (RCAR). The bizarre spikes on the left are suggestive of severe brain injury triggering abnormal vascular smooth muscle contractions. The high respiratory signal on the right is consistent with swelling or cerebral oedema of the left hemisphere with exaggerated respiratory motion of the right hemisphere. The brain CT (insert) demonstrates the large left sided infarct The patient had a very poor neurological outcome. The routine intensive care monitoring is shown BP, EtCO2 and ECG. Red brain pulse is 940 nm and blue brain pulse 660 nm.
A study in stroke patients assessing brain tissue motions, over a depth of 20 to 80 mm, using a novel transcranial Doppler technique found similar high frequency oscillations and Spikes.52 These findings were consistent with cortical and subcortical brain tissue motions.52 Fast Fourier transformations of invasive ICP waveforms also demonstrate a range of similar frequency oscillations within the ICP waveform, which are associated with increased mortality and raised ICP levels.95–97
We speculate that oscillations of cerebrovascular smooth muscle and transmitted pressure waves through brain tissue may be a mechanism of Fast waves, Spindles and Spikes. The brain is a soft but muscular organ with smooth muscle present on all cerebral arteries, arterioles, capillaries (pericytes), venules and veins.98,99 Autoregulation of brain blood flow depends on smooth muscle mediated control. Smooth muscle is heavily innervated via complex neural pathways that mediate smooth muscle tone.99 Following brain injury, the neural networks may be damaged, causing irritability and autologous smooth muscle spasms.55,100,101 Both arterioles and large cerebral veins possess smooth muscle sphincters and contraction of sphincters could cause large blood volume oscillations.99,102,103
It is also known that the brain has a low amplitude natural resonance of approximately 7–10 Hz.104–106 This natural resonance may result from the interaction of arterial, venous and CSF pressure waves through the soft brain tissues. In settings of reduced brain compliance or increased cerebral blood flow the amplitude of the resonance may be increased, giving rise to Fast waves.
In shivering patients, a waveform similar to Fast waves is present and likely represents movement artefact.107 Spikes could also be due to artefact from sensor movement, coughing, swallowing, teeth grinding, or tension on the sensor cables.
Respiratory Waves
Inspiration increases intra-abdominal pressure with compression of the spinal fluid and causes cranial flow of CSF into the skull. The movement of CSF creates a pressure wave over the cortex moving it slightly away from the skull, the reverse is the case during expiration.48,64,108–113 In addition, venous drainage increases during inspiration and falls during expiration.26–30,112,114,115 Artificial ventilation exerts more complex effects on venous drainage and CSF flows and brain motion.28,116 These physiological responses give rise to the respiratory waves seen with OBPM.
Normal respiratory waves monitored by OBPM are similar in phase and amplitude over both hemispheres (Figure 4). The respiratory to cardiac amplitude ratio (RCAR) can be calculated (the peak to trough of the respiratory wave compared with the peak to trough of the cardiac pulse) to assess the relative increase in the amplitude of the respiratory waves (Figure 15).
Figure 15.
Respiratory amplitude changes in a brain injured patient. Computerized tomography (CT) demonstrates cerebral oedema on the right side following acute infarction due to sub-arachnoid hemorrhage with midline shift to the left. The optical brain pulse monitor demonstrates a high respiratory to cardiac amplitude ratio (RCAR) > 2:1 on the left (black arrows). The right injured brain has a normal respiratory amplitude with a low compliance brain pulse. These features suggest cerebral oedema and swelling of the right hemisphere with exaggerated respiratory motion of the left brain. Red brain pulse is 940 nm and blue brain pulse 660 nm. Invasive intra-cranial pressure (ICP).
Respiratory Waves and Brain Injury
MRI studies assessing brain motion in TBI demonstrate large unilateral hemispheric respiratory motion associated with abnormal CSF flows in the lateral ventricles.48,117 Decompressive craniotomy is associated with major respiratory phase pattern of abnormalities of CSF flow dynamics which can give rise to complications including hydrocephalus and subdural hygromas.118 A MRI study in patients with epilepsy also found increased brain respiratory oscillations.119 Lundberg also found marked respiratory phase changes in the ICP amplitude in patients with TBI.112 Importantly, high abdominal pressure can cause marked respiratory motions of the brain and even brain herniation.91
In brain injury the OBPM respiratory waves may show distinct temporal phase differences between hemispheres and distinct increases in respiratory wave amplitudes whereby a RCAR of over 2:1 is considered abnormal. In patients with predominately unilateral brain injury with swelling on CT an increased respiratory amplitude may be present over the normal hemisphere with a normal respiratory amplitude and a low compliance brain pulse over the swollen hemisphere. This pattern may represent unilateral cerebral oedema with the respiratory flow of CSF diverted to the contralateral (more compliant brain) hemisphere resulting in an exaggerated respiratory motion on that side. Figures 14 and 15 demonstrate such findings in a patient with L MCA infarct and in another patient with a sub-arachnoid haemorrhage.
Optical Intensity
The optical intensity (OI) refers to the raw light levels of 660 and 940 nm over longer time periods than the cardiac and respiratory cycles. OI reflects slower physiological or pathological responses in the brain. The NIR wavelengths used are highly absorbed and scattered by blood, but relatively little by other tissues, such as the skin, skull, muscle and CSF, the OI changes therefore largely reflect blood volume or oxygen changes in the skin or brain, though changes in 940 nm OI are more sensitive to CSF/H2O levels.120
In normal brains the OI and the optical intensity ratio (OIR) (660/940) remain stable, as blood volume and oxygen levels are stable due to intact cerebrovascular autoregulation. The appearances are similar for the right and left hemispheres.
Dark hair, surgical dressings, skin pigmentation or skin haematoma or bruising or variation in skull thickness or the sensor not sitting flat on the skin may also cause a difference in OI between hemispheres. Such mechanical effects are fixed and do not contribute to changes over time. Movement of the sensor due to coughing, or other mechanical forces causes artefactual changes in the OI and change of posture will impact the brain and skin blood volumes and hence the OI.
Optical Intensity and Brain Injury
Pathological causes of OI changes include stroke, cerebral oedema, infarction, cerebral haemorrhage, and cerebral perfusion changes which may result in Lundberg B waves.32,121–124
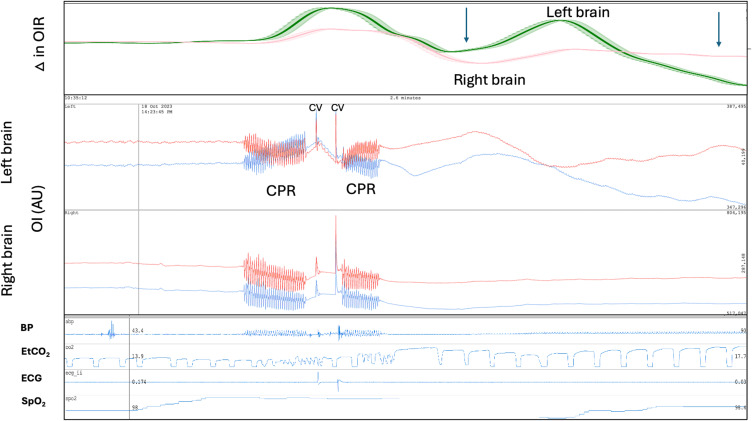
In brain injury the 660 and 940 nm temporal changes in OI may become non-congruent. Figure 16 demonstrates non-congruent changes in the OI and the OI ratio (OIR) immediately following cardioversion from ventricular tachycardia to sinus rhythm in a patient on venous arterial extra-corporeal membrane oxygenation (VA ECMO). The subsequent oscillations and falls in the OIR suggests the possibility of a brain injury such as clot embolization from the heart. Seven hours later the patient developed fixed dilated pupils. A subsequent CT demonstrated diffuse cerebral oedema.73
Figure 16.
Brain optical intensity (OI) and the optical intensity ratio (OIR) 660 nm / 940 nm changes following cardioversion (CV). Patient on venous arterial extra-corporeal membrane oxygenation (VA ECMO) following cardiac arrest. The patient underwent cardiopulmonary resuscitation (CPR) followed by cardioversion to revert long standing ventricular tachycardia to sinus rhythm. Following successful cardioversion acute changes in the OI the ΔOIR occurred particularly in the left brain. The recording covers a 2.6 minute period. The patient subsequently developed fixed dilated pupils 11 hours after sinus rhythm was restored. The falls in the OIR immediately following cardioversion raises the possibility of clot embolization from the heart. BP: blood pressure, AU: arbitrary units. Red brain pulse is 940 nm and blue brain pulse 660 nm.
Lundberg B Waves
Lundberg B waves are typically defined as brief repeating increases in ICP of 10–20 mmHg with a frequency of 0.5–3 waves/min.125 Lundberg B waves are seen in a range of brain injuries and are present normally in sleep.126 Studies using trans-cranial Doppler ultrasound, found Lundberg B waves arise from brief periods of increased middle cerebral artery blood flow due to vasodilation.127,128 In a case report, we found slow oscillations of the OI were observed in both brain hemispheres synchronous with the Lundberg B waves measured with an invasive ICP monitor (Figure 5).31 We also saw slow waves in an animal stroke study < 6 hours following reperfusion of the stroke territory. Other NIRS technologies, such as the NIRO 200, found similar slow oscillations in phase with Lundberg B waves, but the direction of change was the same for both hemispheres.121,122
Potential Artefacts in the OBPM Signal
The skull has a range of muscles attached, such as the temporalis muscle, which are involved in activities such as chewing and swallowing. These muscles can cause movement of the sensor, resulting in signal artefacts. Other sources of sensor movement artefacts include changes in body position, shivering, coughing, head movement, and sensor contact with the patients’ bedding. In addition, tension or movement of the cables attached to the sensors can introduce movement artefacts.
Dark hair poses another challenge, as it has high photon absorption, potentially decreasing the signal quality.129 This issue can be addressed by shaving the hair around the sensor area. A craniectomy, where a portion of the skull is removed, can also lead to sensor movement artefacts due to pulsing brain directly under the skin. Placement of the sensor’s footprint directly on a large, visibly pulsating arteries, such as the temporal artery, may give rise to signals that resemble brain pulses but exhibiting higher amplitude and a distinctly arterial pressure waveform, which is more monotonous in character.
Conclusions
OBPM represents a novel, non-invasive modality capable of detecting cardiac pulsations and respiratory waves originating from the brain. This technology provides critical information on cerebral blood flow, oxygenation states, brain compliance and stages of brain injury through the assessment of pulse classes and other oscillations. Such capabilities hold significant promise for the early identification of neurological deterioration, enabling clinicians to initiate timely interventions and potentially prevent irreversible brain injury.
Moreover, the OBPM addresses key limitations of existing monitoring modalities, such as their reliance on invasive procedures or their inability to provide continuous, real-time data. By facilitating earlier detection of pathological changes, the OBPM offers the potential to enhance clinical decision-making, improve patient outcomes, and optimize resource allocation in critical care settings. As further research and clinical trials validate its efficacy, OBPM has the potential to become an integral component of standard neurological monitoring practices, thereby advancing the management of acute brain injuries and other critical neurological conditions.
Funding Statement
The research was supported by a grant from the Biomedtech Horizons Program and the Targeted Translation Research Accelerator, Diabetes & Cardiovascular Disease Fund part of the Medical Research Future Fund of the Australian Government.
Ethics
This review includes data from these ongoing trials. St Vincent’s Hospital (Melbourne, Australia) Human Research Ethics Committee (HREC) granted ethics committee approval to the Transcutaneous Pulse Oximetry (T-POT) study and the Brain Pulse Monitoring Study. Human Trial Registrations: ACTRN12620000828921 and ACTRN12622001320741. The Sheep Stroke study was approved by the Animal Ethics Committee of the South Australian Health and Medical Research Institute (SAM-21-098).
Author Contributions
All authors made a significant contribution to the work reported, whether that is in the conception, study design, execution, acquisition of data, analysis and interpretation, or in all these areas; took part in drafting, revising or critically reviewing the article; gave final approval of the version to be published; have agreed on the journal to which the article has been submitted; and agree to be accountable for all aspects of the work.
Disclosure
BD is the founder and Chief Scientific Officer of Cyban, Pty Ltd. EJT, JH, SP, JP, and SWC are paid employees of the company. BD and EJT are shareholders of Cyban. BD, SP, JS and JH have a patent US9717446B2 licensed to Cyban, a patent US application 17/619458 licensed to Cyban, a patent Australian application Apparatus system and method for brain monitoring licensed to Cyban. The hospital departments received financial support from Cyban to undertake the study. The authors report no other conflicts of interest in this work.
References
- 1.Maas AI, Murray G, Henney III H. et al. Efficacy and safety of dexanabinol in severe traumatic brain injury: results of a Phase III randomised, placebo-controlled, clinical trial. Lancet Neurol. 2006;5(1):38–45. doi: 10.1016/S1474-4422(05)70253-2 [DOI] [PubMed] [Google Scholar]
- 2.Stiefel MF, Spiotta A, Gracias VH, et al. Reduced mortality rate in patients with severe traumatic brain injury treated with brain tissue oxygen monitoring. J Neurosurg. 2005;103(5):805–811. doi: 10.3171/jns.2005.103.5.0805 [DOI] [PubMed] [Google Scholar]
- 3.Okonkwo DO, Shutter LA, Moore C, et al. Brain Oxygen Optimization in Severe Traumatic Brain Injury Phase-II: a Phase II Randomized Trial. Crit Care Med. 2017;45(11):1907–1914. doi: 10.1097/CCM.0000000000002619 [DOI] [PMC free article] [PubMed] [Google Scholar]
- 4.Xie Q, Wu HB, Yan YF, Liu M, Wang ES. Mortality and Outcome Comparison Between Brain Tissue Oxygen Combined with Intracranial Pressure/Cerebral Perfusion Pressure-Guided Therapy and Intracranial Pressure/Cerebral Perfusion Pressure-Guided Therapy in Traumatic Brain Injury: a Meta-Analysis. World Neurosurg. 2017;100:118–127. doi: 10.1016/j.wneu.2016.12.097 [DOI] [PubMed] [Google Scholar]
- 5.Health NMo. ADULT TRAUMA CLINICAL PRACTICE GUIDELINES Initial Management of Closed Head Injury in Adults. 2nd ed. 2011. [Google Scholar]
- 6.Victoria T Traumatic Brain Injury. Available from: http://trauma.reach.vic.gov.au/guidelines/traumatic-brain-injury/key-messages. Accessed Dec 9, 2024.
- 7.Le Roux P, Menon DK, Citerio G, et al. The International Multidisciplinary Consensus Conference on Multimodality Monitoring in Neurocritical Care: evidentiary tables: a statement for healthcare professionals from the Neurocritical Care Society and the European Society of Intensive Care Medicine. Neurocrit Care. 2014;21(Suppl 2):S297–361. doi: 10.1007/s12028-014-0081-x [DOI] [PMC free article] [PubMed] [Google Scholar]
- 8.Tavakoli S, Peitz G, Ares W, Hafeez S, Grandhi R. Complications of invasive intracranial pressure monitoring devices in neurocritical care. Neurosurg Focus. 2017;43(5):E6. doi: 10.3171/2017.8.FOCUS17450 [DOI] [PubMed] [Google Scholar]
- 9.Hansen ML, Pellicer A, Hyttel-Sorensen S, et al. Cerebral Oximetry Monitoring in Extremely Preterm Infants. N Engl J Med. 2023;388(16):1501–1511. doi: 10.1056/NEJMoa2207554 [DOI] [PubMed] [Google Scholar]
- 10.Leal-Noval SR, Cayuela A, Arellano-Orden V, et al. Invasive and noninvasive assessment of cerebral oxygenation in patients with severe traumatic brain injury. Intensive Care Med. 2010;36(8):1309–1317. doi: 10.1007/s00134-010-1920-7 [DOI] [PubMed] [Google Scholar]
- 11.Hametner C, Stanarcevic P, Stampfl S, Rohde S, Veltkamp R, Bösel J. Noninvasive cerebral oximetry during endovascular therapy for acute ischemic stroke: an observational study. Journal of Cerebral Blood Flow & Metabolism. 2015;35(11):1722–1728. doi: 10.1038/jcbfm.2015.181 [DOI] [PMC free article] [PubMed] [Google Scholar]
- 12.Ballestero MFM, Frigieri G, Cabella BCT, de Oliveira SM, de Oliveira RS. Prediction of intracranial hypertension through noninvasive intracranial pressure waveform analysis in pediatric hydrocephalus. Childs Nerv Syst. 2017;33(9):1517–1524. doi: 10.1007/s00381-017-3475-1 [DOI] [PubMed] [Google Scholar]
- 13.Rossi DM, Bevilaqua-Grossi D, Mascarenhas S, et al. Noninvasive intracranial pressure monitoring in women with migraine. Sci Rep. 2022;12(1):2635. doi: 10.1038/s41598-022-06258-9 [DOI] [PMC free article] [PubMed] [Google Scholar]
- 14.Dhar R, Sandler RH, Manwaring K, Kostick N, Mansy HA. Noninvasive detection of elevated ICP using spontaneous tympanic membrane pulsation. Sci Rep. 2021;11(1):21957. doi: 10.1038/s41598-021-01079-8 [DOI] [PMC free article] [PubMed] [Google Scholar]
- 15.Kostick N, Manwaring K, Dhar R, Sandler R, Mansy H. The “Brain Stethoscope”: a Non-Invasive Method for Detecting Elevated Intracranial Pressure. Cureus. 2021;13(3):e13865. doi: 10.7759/cureus.13865 [DOI] [PMC free article] [PubMed] [Google Scholar]
- 16.Brasil S, Frigieri G, Taccone FS, et al. Noninvasive intracranial pressure waveforms for estimation of intracranial hypertension and outcome prediction in acute brain-injured patients. J Clin Monit Comput. 2022;36(1):1–8. doi: 10.1007/s10877-022-00941-y [DOI] [PMC free article] [PubMed] [Google Scholar]
- 17.Brasil S, Solla DJF, Nogueira RC, Teixeira MJ, Malbouisson LMS, Paiva WDS. A Novel Noninvasive Technique for Intracranial Pressure Waveform Monitoring in Critical Care. J Pers Med. 2021;11(12):1302. doi: 10.3390/jpm11121302 [DOI] [PMC free article] [PubMed] [Google Scholar]
- 18.Ruesch A, Yang J, Schmitt S, Acharya D, Smith MA, Kainerstorfer JM. Estimating intracranial pressure using pulsatile cerebral blood flow measured with diffuse correlation spectroscopy. Biomed Opt Express. 2020;11(3):1462–1476. doi: 10.1364/BOE.386612 [DOI] [PMC free article] [PubMed] [Google Scholar]
- 19.Tabassum S, Ruesch A, Acharya D, et al. Clinical translation of noninvasive intracranial pressure sensing with diffuse correlation spectroscopy. J Neurosurg. 2022;2022:1–10. doi: 10.3171/2022.9.JNS221203 [DOI] [PMC free article] [PubMed] [Google Scholar]
- 20.Fischer JB, Ghouse A, Tagliabue S, et al. Non-Invasive Estimation of Intracranial Pressure by Diffuse Optics: a Proof-of-Concept Study. J Neurotrauma. 2020;37(23):2569–2579. doi: 10.1089/neu.2019.6965 [DOI] [PubMed] [Google Scholar]
- 21.Themelis G, D’Arceuil H, Diamond SG, et al. Near-infrared spectroscopy measurement of the pulsatile component of cerebral blood flow and volume from arterial oscillations. J Biomed Opt. 2007;12(1):014033. doi: 10.1117/1.2710250 [DOI] [PMC free article] [PubMed] [Google Scholar]
- 22.Milej D, Abdalmalak A, Rajaram A, St Lawrence K. Direct assessment of extracerebral signal contamination on optical measurements of cerebral blood flow, oxygenation, and metabolism. Neurophotonics. 2020;7(4):045002. doi: 10.1117/1.NPh.7.4.045002 [DOI] [PMC free article] [PubMed] [Google Scholar]
- 23.Dixon B, MacLeod D. Assessment of a non invasive brain oximeter in volunteers undergoing acute hypoxia. Med Devices. 2020;Volume 13:183–194. doi: 10.2147/MDER.S250102 [DOI] [PMC free article] [PubMed] [Google Scholar]
- 24.Dixon B, Sharkey JM, Teo EJ, et al. Assessment of a Non-Invasive Brain Pulse Monitor to Measure Intra-Cranial Pressure Following Acute Brain Injury. Med Devices. 2023;16:15–26. doi: 10.2147/MDER.S398193 [DOI] [PMC free article] [PubMed] [Google Scholar]
- 25.Dixon B, Turner R, Christou C. Assessment of a Non-Invasive Brain Oximeter in a Sheep Model of Acute Brain Injury. Med Devices. 2019;12:479–487. doi: 10.2147/MDER.S235804 [DOI] [PMC free article] [PubMed] [Google Scholar]
- 26.Dreha-Kulaczewski S, Joseph AA, Merboldt KD, Ludwig HC, Gartner J, Frahm J. Identification of the Upward Movement of Human CSF In Vivo and its Relation to the Brain Venous System. J Neurosci. 2017;37(9):2395–2402. doi: 10.1523/JNEUROSCI.2754-16.2017 [DOI] [PMC free article] [PubMed] [Google Scholar]
- 27.Vinje V, Ringstad G, Lindstrom EK, et al. Respiratory influence on cerebrospinal fluid flow - a computational study based on long-term intracranial pressure measurements. Sci Rep. 2019;9(1):9732. doi: 10.1038/s41598-019-46055-5 [DOI] [PMC free article] [PubMed] [Google Scholar]
- 28.Liu S, Bilston LE, Flores Rodriguez N, et al. Changes in intrathoracic pressure, not arterial pulsations, exert the greatest effect on tracer influx in the spinal cord. Fluids Barriers CNS. 2022;19(1):14. doi: 10.1186/s12987-022-00310-6 [DOI] [PMC free article] [PubMed] [Google Scholar]
- 29.Usubiaga JE, Moya F, Usubiaga LE. Effect of thoracic and abdominal pressure changes on the epidural space pressure. Br J Anaesth. 1967;39(8):612–618. doi: 10.1093/bja/39.8.612 [DOI] [PubMed] [Google Scholar]
- 30.Britt RH, Rossi GT. Quantitative analysis of methods for reducing physiological brain pulsations. J Neurosci Methods. 1982;6(3):219–229. doi: 10.1016/0165-0270(82)90085-1 [DOI] [PubMed] [Google Scholar]
- 31.Teo EJ, Petautschnig S, Hellerstedt J, et al. Cerebrovascular Responses in a Patient with Lundberg B Waves Following Subarachnoid Haemorrhage Assessed with a Novel Non-Invasive Brain Pulse Monitor: a Case Report. Med Devices. 2024;17:73–87. doi: 10.2147/MDER.S452938 [DOI] [PMC free article] [PubMed] [Google Scholar]
- 32.Gopinath SP, Robertson CS, Contant CF, Narayan RK, Grossman RG, Chance B. Early detection of delayed traumatic intracranial hematomas using near-infrared spectroscopy. J Neurosurg. 1995;83(3):438–444. doi: 10.3171/jns.1995.83.3.0438 [DOI] [PubMed] [Google Scholar]
- 33.Davie SN, Grocott HP. Impact of extracranial contamination on regional cerebral oxygen saturation: a comparison of three cerebral oximetry technologies. Anesthesiology. 2012;116(4):834–840. doi: 10.1097/ALN.0b013e31824c00d7 [DOI] [PubMed] [Google Scholar]
- 34.Gajinov Z, Matić M, Prćić S, Đuran V. Optical properties of the human skin / Optičke osobine ljudske kože. Serbian J Dermatol Venereol. 2013;2(4):131–136. doi: 10.2478/v10249-011-0029-5 [DOI] [Google Scholar]
- 35.Haeussinger FB, Heinzel S, Hahn T, Schecklmann M, Ehlis AC, Fallgatter AJ. Simulation of near-infrared light absorption considering individual head and prefrontal cortex anatomy: implications for optical neuroimaging. PLoS One. 2011;6(10):e26377. doi: 10.1371/journal.pone.0026377 [DOI] [PMC free article] [PubMed] [Google Scholar]
- 36.Bathala L, Mehndiratta MM, Sharma VK. Transcranial Doppler: technique and common findings (Part 1). Ann Indian Acad Neurol. 2013;16(2):174–179. doi: 10.4103/0972-2327.112460 [DOI] [PMC free article] [PubMed] [Google Scholar]
- 37.Advani R, Naess H, Kurz MW. The golden hour of acute ischemic stroke. Scand J Trauma Resusc Emerg Med. 2017;25(1):54. doi: 10.1186/s13049-017-0398-5 [DOI] [PMC free article] [PubMed] [Google Scholar]
- 38.Zarghooni K, Boese CK, Siewe J, Rollinghoff M, Eysel P, Scheyerer MJ. Occipital bone thickness: implications on occipital-cervical fusion. A cadaveric study. Acta Orthop Traumatol Turc. 2016;50(6):606–609. doi: 10.1016/j.aott.2016.04.003 [DOI] [PMC free article] [PubMed] [Google Scholar]
- 39.Thulung S, Ranabhat K, Bishokarma S, Gongal DN. Morphometric Measurement of Cranial Vault Thickness: a Tertiary Hospital Based Study. JNMA. 2019;57(215):29–32. doi: 10.31729/jnma.3949 [DOI] [PMC free article] [PubMed] [Google Scholar]
- 40.Voie A, Dirnbacher M, Fisher D, Holscher T. Parametric mapping and quantitative analysis of the human calvarium. Comput Med Imaging Graph. 2014;38(8):675–682. doi: 10.1016/j.compmedimag.2014.06.022 [DOI] [PubMed] [Google Scholar]
- 41.Gagnon L, Sakadzic S, Lesage F, et al. Quantifying the microvascular origin of BOLD-fMRI from first principles with two-photon microscopy and an oxygen-sensitive nanoprobe. J Neurosci. 2015;35(8):3663–3675. doi: 10.1523/JNEUROSCI.3555-14.2015 [DOI] [PMC free article] [PubMed] [Google Scholar]
- 42.Havlicek M, Uludag K. A dynamical model of the laminar BOLD response. Neuroimage. 2020;204:116209. doi: 10.1016/j.neuroimage.2019.116209 [DOI] [PubMed] [Google Scholar]
- 43.Hua J, Liu P, Kim T, et al. MRI techniques to measure arterial and venous cerebral blood volume. Neuroimage. 2019;187:17–31. doi: 10.1016/j.neuroimage.2018.02.027 [DOI] [PMC free article] [PubMed] [Google Scholar]
- 44.Delion M, Mercier P, Brassier G. Arteries and Veins of the Sylvian Fissure and Insula: microsurgical Anatomy. Adv Tech Stand Neurosurg. 2016:(43):185–216. doi: 10.1007/978-3-319-21359-0_7 [DOI] [PubMed] [Google Scholar]
- 45.Schellekens W, Bhogal AA, Roefs EC, Baez-Yanez MG, Siero JC, Petridou N. The many layers of BOLD. The effect of hypercapnic and hyperoxic stimuli on macro- and micro-vascular compartments quantified by CVR, M, and CBV across cortical depth. J Cereb Blood Flow Metab. 2023;43(3):419–432. doi: 10.1177/0271678X221133972 [DOI] [PMC free article] [PubMed] [Google Scholar]
- 46.Weber B, Keller AL, Reichold J, Logothetis NK. The microvascular system of the striate and extrastriate visual cortex of the macaque. Cereb Cortex. 2008;18(10):2318–2330. doi: 10.1093/cercor/bhm259 [DOI] [PubMed] [Google Scholar]
- 47.Weickenmeier J, de Rooij R, Budday S, Ovaert TC, Kuhl E. The mechanical importance of myelination in the central nervous system. J Mech Behav Biomed Mater. 2017;76:119–124. doi: 10.1016/j.jmbbm.2017.04.017 [DOI] [PubMed] [Google Scholar]
- 48.Sloots JJ, Biessels GJ, Amelink GJ, Zwanenburg JJM. Abnormalities in cardiac-induced brain tissue deformations are now detectable with MRI: a case-report of a patient who underwent craniotomy after trauma. Magn Reson Imag. 2023;98:62–65. doi: 10.1016/j.mri.2023.01.003 [DOI] [PubMed] [Google Scholar]
- 49.Ince J, Lecchini-Visintini A, Almudayni A, et al. Brain tissue motion in acute hemorrhagic stroke using amplified MRI (aMRI). Magn Reson Imag. 2022;86:17–19. doi: 10.1016/j.mri.2021.11.002 [DOI] [PubMed] [Google Scholar]
- 50.Brasil S. Intracranial pressure pulse morphology: the missing link? Intensive Care Med. 2022;48(11):1667–1669. doi: 10.1007/s00134-022-06855-2 [DOI] [PMC free article] [PubMed] [Google Scholar]
- 51.Brasil S, Solla DJF, Nogueira RC, Jacobsen Teixeira M, Malbouisson LMS, Paiva WS. Intracranial Compliance Assessed by Intracranial Pressure Pulse Waveform. Brain Sci. 2021;11(8):971. doi: 10.3390/brainsci11080971 [DOI] [PMC free article] [PubMed] [Google Scholar]
- 52.Evensen KB, Eide PK. Measuring intracranial pressure by invasive, less invasive or non-invasive means: limitations and avenues for improvement. Fluids Barriers CNS. 2020;17(1):34. doi: 10.1186/s12987-020-00195-3 [DOI] [PMC free article] [PubMed] [Google Scholar]
- 53.Duvernoy HM. Cortical Veins of the Human Brain. Springer Vienna; 1983:3–38. [Google Scholar]
- 54.Glasser MF, Coalson TS, Robinson EC, et al. A multi-modal parcellation of human cerebral cortex. Nature. 2016;536(7615):171–178. doi: 10.1038/nature18933 [DOI] [PMC free article] [PubMed] [Google Scholar]
- 55.Florey H. Microscopical observations on the circulation of the blood in the cerebral cortex. Brain. 1925;48(1):43–64. doi: 10.1093/brain/48.1.43 [DOI] [Google Scholar]
- 56.Greitz D, Wirestam R, Franck A, Nordell B, Thomsen C, Stahlberg F. Pulsatile brain movement and associated hydrodynamics studied by magnetic resonance phase imaging. The Monro-Kellie doctrine revisited. Neuroradiology. 1992;34(5):370–380. doi: 10.1007/BF00596493 [DOI] [PubMed] [Google Scholar]
- 57.Soellinger M, Ryf S, Boesiger P, Kozerke S. Assessment of human brain motion using CSPAMM. J Magn Reson Imaging Apr. 2007;25(4):709–714. doi: 10.1002/jmri.20882 [DOI] [PubMed] [Google Scholar]
- 58.Koch MJ, Duy PQ, Grannan BL, et al. Angiographic Pulse Wave Coherence in the Human Brain. Front Bioeng Biotechnol. 2022;10:873530. doi: 10.3389/fbioe.2022.873530 [DOI] [PMC free article] [PubMed] [Google Scholar]
- 59.Butler WE, Agarwalla PK, Codd P. CSF in the ventricles of the brain behaves as a relay medium for arteriovenous pulse wave phase coupling. PLoS One. 2017;12(11):e0181025. doi: 10.1371/journal.pone.0181025 [DOI] [PMC free article] [PubMed] [Google Scholar]
- 60.Hirai O, Handa H, Ishikawa M. Intracranial pressure pulse waveform: considerations about its origin and methods of estimating intracranial pressure dynamics. No to Shinkei. 1982;34(11):1059–1065. [PubMed] [Google Scholar]
- 61.Bering Jr EA. Circulation of the cerebrospinal fluid. Demonstration of the choroid plexuses as the generator of the force for flow of fluid and ventricular enlargement. J Neurosurg. 1962;19(5):405–413. doi: 10.3171/jns.1962.19.5.0405 [DOI] [PubMed] [Google Scholar]
- 62.Greitz D. Cerebrospinal fluid circulation and associated intracranial dynamics. A radiologic investigation using MR imaging and radionuclide cisternography. Acta Radiol Suppl. 1993;386:1–23. [PubMed] [Google Scholar]
- 63.Greitz D, Franck A, Nordell B. On the pulsatile nature of intracranial and spinal CSF-circulation demonstrated by MR imaging. Acta Radiol. 1993;34(4):321–328. doi: 10.1177/028418519303400403 [DOI] [PubMed] [Google Scholar]
- 64.Gupta S, Soellinger M, Grzybowski DM, et al. Cerebrospinal fluid dynamics in the human cranial subarachnoid space: an overlooked mediator of cerebral disease. I. Computational model. J R Soc Interface. 2010;7(49):1195–1204. doi: 10.1098/rsif.2010.0033 [DOI] [PMC free article] [PubMed] [Google Scholar]
- 65.Driver ID, Traat M, Fasano F, Wise RG. Most Small Cerebral Cortical Veins Demonstrate Significant Flow Pulsatility: a Human Phase Contrast MRI Study at 7T. Front Neurosci. 2020;14:415. doi: 10.3389/fnins.2020.00415 [DOI] [PMC free article] [PubMed] [Google Scholar]
- 66.Hirai O, Ishikawa M, Handa H. Changes of epidural pulse waveform in increased intracranial pressure: an experimental study (author’s transl). No to Shinkei. 1981;33(12):1235–1242. [PubMed] [Google Scholar]
- 67.Hamer J, Alberti E, Hoyer S, Wiedemann K. Influence of systemic and cerebral vascular factors on the cerebrospinal fluid pulse waves. J Neurosurg. 1977;46(1):36–45. doi: 10.3171/jns.1977.46.1.0036 [DOI] [PubMed] [Google Scholar]
- 68.Sonnabend K, Brinker G, Maintz D, Bunck AC, Weiss K. Cerebrospinal fluid pulse wave velocity measurements: in vitro and in vivo evaluation of a novel multiband cine phase-contrast MRI sequence. Magn Reson Med. 2021;85(1):197–208. doi: 10.1002/mrm.28430 [DOI] [PubMed] [Google Scholar]
- 69.Mayhan WG, Heistad DD. Role of veins and cerebral venous pressure in disruption of the blood-brain barrier. Circ Res. 1986;59(2):216–220. doi: 10.1161/01.res.59.2.216 [DOI] [PubMed] [Google Scholar]
- 70.Lorthois S, Cassot F, Lauwers F. Simulation study of brain blood flow regulation by intra-cortical arterioles in an anatomically accurate large human vascular network. Part II: flow variations induced by global or localized modifications of arteriolar diameters. Neuroimage. 2011;54(4):2840–2853. doi: 10.1016/j.neuroimage.2010.10.040 [DOI] [PubMed] [Google Scholar]
- 71.Petautschnig SM, L. Saunders L, Jhamb A, et al. Continuous non-invasive optical brain pulse monitoring during endovascular treatment for acute ischemic stroke. 2024, Mansucript under preparation. [Google Scholar]
- 72.Sharkey JM, Sung WC, Grace SA, et al. Non-Invasive Detection of Stroke in Sheep with Optical Brain Pulse Monitoring. 2024. [Google Scholar]
- 73.Teo SMP E, Sung WC, Hellerstedt J, et al. Early detection of brain injury following cardiac arrest using optical brain pulse monitoring. 2024, Manuscript under preparation. [Google Scholar]
- 74.Launey Y, Fryer TD, Hong YT, et al. Spatial and Temporal Pattern of Ischemia and Abnormal Vascular Function Following Traumatic Brain Injury. JAMA Neurol. 2020;77(3):339–349. doi: 10.1001/jamaneurol.2019.3854 [DOI] [PMC free article] [PubMed] [Google Scholar]
- 75.Walker AE, Diamond EL, Moseley J. The neuropathological findings in irreversible coma. A critique of the “respirator”. J Neuropathol Exp Neurol. 1975;34(4):295–323. doi: 10.1097/00005072-197507000-00001 [DOI] [PubMed] [Google Scholar]
- 76.Sohn C-H, Lee H-P, Park JB, et al. Imaging Findings of Brain Death on 3-Tesla MRI. Korean J Radiol. 2012;13(5):541–549. doi: 10.3348/kjr.2012.13.5.541 [DOI] [PMC free article] [PubMed] [Google Scholar]
- 77.West JL, Garner RM, Greeneway GP, et al. Venous waveform morphological changes associated with treatment of symptomatic venous sinus stenosis. J Neurointerv Surg. 2018;10(11):1108–1113. doi: 10.1136/neurintsurg-2018-013858 [DOI] [PubMed] [Google Scholar]
- 78.Tanaka K, Sakamoto R, Imamura H, et al. Reversal of blood flow in deep cerebral vein in preterm intraventricular hemorrhage: two case reports. BMC Pediatr. 2020;20(1):517. doi: 10.1186/s12887-020-02414-0 [DOI] [PMC free article] [PubMed] [Google Scholar]
- 79.Dean LM, Taylor GA. The intracranial venous system in infants: normal and abnormal findings on duplex and color Doppler sonography. AJR Am J Roentgenol. 1995;164(1):151–156. doi: 10.2214/ajr.164.1.7998529 [DOI] [PubMed] [Google Scholar]
- 80.Lee VW, Hauck RM, Morrison MC, Peng TT, Fischer E, Carter A. Scintigraphic evaluation of brain death: significance of sagittal sinus visualization. J Nucl Med. 1987;28(8):1279–1283. [PubMed] [Google Scholar]
- 81.Shore RM, Rao BK, Berg OB. Massive jugular and dural sinus reflux associated with cerebral death. Pediatr Radiol. 1988;18(2):164–166. doi: 10.1007/BF02387564 [DOI] [PubMed] [Google Scholar]
- 82.Brill DR, Schwartz JA, Baxter JA. Variant flow patterns in radionuclide cerebral imaging performed for brain death. Clin Nucl Med. 1985;10(5):346–352. doi: 10.1097/00003072-198505000-00007 [DOI] [PubMed] [Google Scholar]
- 83.Desilles JP, Syvannarath V, Di Meglio L, et al. Downstream Microvascular Thrombosis in Cortical Venules Is an Early Response to Proximal Cerebral Arterial Occlusion. J Am Heart Assoc. 2018;7(5):e007804. doi: 10.1161/JAHA.117.007804 [DOI] [PMC free article] [PubMed] [Google Scholar]
- 84.Carpenter K, Decater T, Iwanaga J, et al. Revisiting the Vertebral Venous Plexus-A Comprehensive Review of the Literature. World Neurosurg. 2021;145:381–395. doi: 10.1016/j.wneu.2020.10.004 [DOI] [PubMed] [Google Scholar]
- 85.Cardoso ER, Rowan JO, Galbraith S. Analysis of the cerebrospinal fluid pulse wave in intracranial pressure. J Neurosurg. 1983;59(5):817–821. doi: 10.3171/jns.1983.59.5.0817 [DOI] [PubMed] [Google Scholar]
- 86.Anile C, Bonis PD, Ficola A, Santini P, Mangiola A. An experimental study on artificially induced CSF pulse waveform morphological modifications. Neurol Res. 2011;33(10):1072–1082. doi: 10.1179/1743132811Y.0000000056 [DOI] [PubMed] [Google Scholar]
- 87.Hirai O, Handa H, Ishikawa M, Kim SH. Epidural pulse waveform as an indicator of intracranial pressure dynamics. Surg Neurol. 1984;21(1):67–74. doi: 10.1016/0090-3019(84)90404-X [DOI] [PubMed] [Google Scholar]
- 88.Relander FAJ, Ruesch A, Yang J, et al. Using near-infrared spectroscopy and a random forest regressor to estimate intracranial pressure. Neurophotonics. 2022;9(4):045001. doi: 10.1117/1.NPh.9.4.045001 [DOI] [PMC free article] [PubMed] [Google Scholar]
- 89.Buell T, Ding D, Raper D, et al. Resolution of venous pressure gradient in a patient with idiopathic intracranial hypertension after ventriculoperitoneal shunt placement: a proof of secondary cerebral sinovenous stenosis. Surg Neurol Int. 2021;12:14. doi: 10.25259/SNI_700_2020 [DOI] [PMC free article] [PubMed] [Google Scholar]
- 90.Lazzaro MA, Darkhabani Z, Remler BF, et al. Venous sinus pulsatility and the potential role of dural incompetence in idiopathic intracranial hypertension. Neurosurgery. 2012;71(4):877–883. doi: 10.1227/NEU.0b013e318267a8f9 [DOI] [PubMed] [Google Scholar]
- 91.Wilson MH. Monro-Kellie 2.0: the dynamic vascular and venous pathophysiological components of intracranial pressure. J Cereb Blood Flow Metab. 2016;36(8):1338–1350. doi: 10.1177/0271678X16648711 [DOI] [PMC free article] [PubMed] [Google Scholar]
- 92.Kasprowicz M, Lalou DA, Czosnyka M, Garnett M, Czosnyka Z. Intracranial pressure, its components and cerebrospinal fluid pressure-volume compensation. Acta Neurol Scand. 2016;134(3):168–180. doi: 10.1111/ane.12541 [DOI] [PubMed] [Google Scholar]
- 93.Westerhof BE, Guelen I, Westerhof N, Karemaker JM, Avolio A. Quantification of wave reflection in the human aorta from pressure alone: a proof of principle. Hypertension. 2006;48(4):595–601. doi: 10.1161/01.HYP.0000238330.08894.17 [DOI] [PubMed] [Google Scholar]
- 94.Mynard JP, Kondiboyina A, Kowalski R, Cheung MMH, Smolich JJ. Measurement, Analysis and Interpretation of Pressure/Flow Waves in Blood Vessels. Front Physiol. 2020;11:1085. doi: 10.3389/fphys.2020.01085 [DOI] [PMC free article] [PubMed] [Google Scholar]
- 95.Wagshul ME, Eide PK, Madsen JR. The pulsating brain: a review of experimental and clinical studies of intracranial pulsatility. Fluids Barriers CNS. 2011;8(1):5. doi: 10.1186/2045-8118-8-5 [DOI] [PMC free article] [PubMed] [Google Scholar]
- 96.Kazimierska A, Uryga A, Mataczynski C, et al. Relationship between the shape of intracranial pressure pulse waveform and computed tomography characteristics in patients after traumatic brain injury. Crit Care. 2023;27(1):447. doi: 10.1186/s13054-023-04731-z [DOI] [PMC free article] [PubMed] [Google Scholar]
- 97.Robertson CS, Narayan RK, Contant CF, et al. Clinical experience with a continuous monitor of intracranial compliance. J Neurosurg. 1989;71(5 Pt 1):673–680. doi: 10.3171/jns.1989.71.5.0673 [DOI] [PubMed] [Google Scholar]
- 98.Kaplan L, Chow BW, Gu C. Neuronal regulation of the blood-brain barrier and neurovascular coupling. Nat Rev Neurosci. 2020;21(8):416–432. doi: 10.1038/s41583-020-0322-2 [DOI] [PMC free article] [PubMed] [Google Scholar]
- 99.Uemura MT, Maki T, Ihara M, Lee VMY, Trojanowski JQ. Brain Microvascular Pericytes in Vascular Cognitive Impairment and Dementia. Front Aging Neurosci. 2020;12:80. doi: 10.3389/fnagi.2020.00080 [DOI] [PMC free article] [PubMed] [Google Scholar]
- 100.Schwarting J, Nehrkorn K, Liu H, Plesnila N, Terpolilli NA. Role of Pial Microvasospasms and Leukocyte Plugging for Parenchymal Perfusion after Subarachnoid Hemorrhage Assessed by In Vivo Multi-Photon Microscopy. Int J Mol Sci. 2021;22(16):8444. doi: 10.3390/ijms22168444 [DOI] [PMC free article] [PubMed] [Google Scholar]
- 101.Echlin FA. Spasm of basilar and vertebral arteries caused by experimental subarachnoid hemorrhage. J Neurosurg. 1965;23(1):1–11. doi: 10.3171/jns.1965.23.1.0001 [DOI] [PubMed] [Google Scholar]
- 102.Dagain A, Vignes JR, Dulou R, et al. Junction between the great cerebral vein and the straight sinus: an anatomical, immunohistochemical, and ultrastructural study on 25 human brain cadaveric dissections. Clin Anat. 2008;21(5):389–397. doi: 10.1002/ca.20635 [DOI] [PubMed] [Google Scholar]
- 103.Dagain A, Vignes R, Dulou R, et al. Study of the junction between the cortical bridging veins and basal cranial venous sinus. Neurochirurgie. 2009;55(1):19–24. doi: 10.1016/j.neuchi.2008.10.011 [DOI] [PubMed] [Google Scholar]
- 104.Castillo HT. A cardiac hypothesis for the origin of EEG alpha. IEEE Trans Biomed Eng. 1983;30(12):793–796. doi: 10.1109/TBME.1983.325080 [DOI] [PubMed] [Google Scholar]
- 105.Escarcega JD, Knutsen AK, Okamoto RJ, Pham DL, Bayly PV. Natural oscillatory modes of 3D deformation of the human brain in vivo. J Biomech. 2021;119:110259. doi: 10.1016/j.jbiomech.2021.110259 [DOI] [PMC free article] [PubMed] [Google Scholar]
- 106.Okamoto RJ, Escarcega JD, Alshareef A, et al. Effect of Direction and Frequency of Skull Motion on Mechanical Vulnerability of the Human Brain. J Biomech Eng. 2023;145(11):111005. doi: 10.1115/1.4062937 [DOI] [PMC free article] [PubMed] [Google Scholar]
- 107.Pozos RS, Israel D, McCutcheon R, Wittmers Jr LE, Sessler D. Human studies concerning thermal-induced shivering, postoperative “shivering”, and cold-induced vasodilation. Ann Emerg Med. 1987;16(9):1037–1041. doi: 10.1016/s0196-0644(87)80756-4 [DOI] [PubMed] [Google Scholar]
- 108.Wong LY, Bellomo R, Robbins R, et al. Long-term outcomes after severe drug overdose. Crit Care Resusc. 2016;18(4):247–254. [PubMed] [Google Scholar]
- 109.Puetz V, Gerber JC, Kruger P, Kuhn M, Reichmann H, Schneider H. Cerebral Venous Drainage in Patients With Space-Occupying Middle Cerebral Artery Infarction: effects on Functional Outcome After Hemicraniectomy. Front Neurol. 2018;9:876. doi: 10.3389/fneur.2018.00876 [DOI] [PMC free article] [PubMed] [Google Scholar]
- 110.Pomschar A, Koerte I, Lee S, et al. MRI evidence for altered venous drainage and intracranial compliance in mild traumatic brain injury. PLoS One. 2013;8(2):e55447. doi: 10.1371/journal.pone.0055447 [DOI] [PMC free article] [PubMed] [Google Scholar]
- 111.Beards SC, Yule S, Kassner A, Jackson A. Anatomical variation of cerebral venous drainage: the theoretical effect on jugular bulb blood samples. Anaesthesia. 1998;53(7):627–633. doi: 10.1046/j.1365-2044.1998.409-az0513.x [DOI] [PubMed] [Google Scholar]
- 112.Lundberg N, Troupp H, Lorin H. Continuous recording of the ventricular-fluid pressure in patients with severe acute traumatic brain injury. A preliminary report. J Neurosurg. 1965;22(6):581–590. doi: 10.3171/jns.1965.22.6.0581 [DOI] [PubMed] [Google Scholar]
- 113.Eide PK, Valnes LM, Lindstrom EK, Mardal KA, Ringstad G. Direction and magnitude of cerebrospinal fluid flow vary substantially across central nervous system diseases. Fluids Barriers CNS. 2021;18(1):16. doi: 10.1186/s12987-021-00251-6 [DOI] [PMC free article] [PubMed] [Google Scholar]
- 114.Taylor Z, English C, Cramberg M, Young BA. The influence of spinal venous blood pressure on cerebrospinal fluid pressure. Sci Rep. 2023;13(1):20989. doi: 10.1038/s41598-023-48334-8 [DOI] [PMC free article] [PubMed] [Google Scholar]
- 115.Todd MM, Toutant SM, Shapiro HM. The effects of high-frequency positive-pressure ventilation on intracranial pressure and brain surface movement in cats. Anesthesiology. 1981;54(6):496–504. doi: 10.1097/00000542-198106000-00009 [DOI] [PubMed] [Google Scholar]
- 116.Ozturk B, Koundal S, Al Bizri E, et al. Continuous positive airway pressure increases CSF flow and glymphatic transport. JCI Insight. 2023;8(12):170270. doi: 10.1172/jci.insight.170270 [DOI] [PMC free article] [PubMed] [Google Scholar]
- 117.Kim JH, Im JG, Park SH. Measurement of changes in cerebrospinal fluid pulsation after traumatic brain injury using echo-planar imaging-based functional MRI. NMR Biomed. 2024;37(3):e5061. doi: 10.1002/nbm.5061 [DOI] [PubMed] [Google Scholar]
- 118.Gopalakrishnan MS, Shanbhag NC, Shukla DP, Konar SK, Bhat DI, Devi BI. Complications of Decompressive Craniectomy. Front Neurol. 2018;9:977. doi: 10.3389/fneur.2018.00977 [DOI] [PMC free article] [PubMed] [Google Scholar]
- 119.Kananen J, Helakari H, Korhonen V, et al. Respiratory-related brain pulsations are increased in epilepsy-a two-centre functional MRI study. Brain Commun. 2020;2(2):fcaa076. doi: 10.1093/braincomms/fcaa076 [DOI] [PMC free article] [PubMed] [Google Scholar]
- 120.Alian AAS. Photoplethysmography: analysis of the Pulse Oximeter Waveform. In: Monitoring Technologies in Acute Care Environments. Springer Science; 2014:165–169. [Google Scholar]
- 121.Diedler J, Zweifel C, Budohoski KP, et al. The limitations of near-infrared spectroscopy to assess cerebrovascular reactivity: the role of slow frequency oscillations. Anesth Analg. 2011;113(4):849–857. doi: 10.1213/ANE.0b013e3182285dc0 [DOI] [PubMed] [Google Scholar]
- 122.Weerakkody RA, Czosnyka M, Zweifel C, et al. Slow vasogenic fluctuations of intracranial pressure and cerebral near infrared spectroscopy--an observational study. Acta Neurochir. 2010;152(10):1763–1769. doi: 10.1007/s00701-010-0748-9 [DOI] [PubMed] [Google Scholar]
- 123.Sapire KJ, Gopinath SP, Farhat G, et al. Cerebral oxygenation during warming after cardiopulmonary bypass. Crit Care Med. 1997;25(10):1655–1662. doi: 10.1097/00003246-199710000-00014 [DOI] [PubMed] [Google Scholar]
- 124.Semenova Zh B, Marshintsev AV, Melnikov AV, Meshcheryakov SV, Adayev AR, Lukyanov VI. Infrascanner in the diagnosis of intracranial lesions in children with traumatic brain injuries. Brain Inj. 2016;30(1):18–22. doi: 10.3109/02699052.2014.989401 [DOI] [PubMed] [Google Scholar]
- 125.Martinez-Tejada I, Arum A, Wilhjelm JE, Juhler M, Andresen M. B waves: a systematic review of terminology, characteristics, and analysis methods. Fluids Barriers CNS. 2019;16(1):33. doi: 10.1186/s12987-019-0153-6 [DOI] [PMC free article] [PubMed] [Google Scholar]
- 126.Lemaire JJ, Khalil T, Cervenansky F, et al. Slow pressure waves in the cranial enclosure. Acta Neurochir. 2002;144(3):243–254. doi: 10.1007/s007010200032 [DOI] [PubMed] [Google Scholar]
- 127.Auer LM, Sayama I. Intracranial pressure oscillations (B-waves) caused by oscillations in cerebrovascular volume. Acta Neurochir. 1983;68(1–2):93–100. doi: 10.1007/BF01406205 [DOI] [PubMed] [Google Scholar]
- 128.Lewis PM, Smielewski P, Rosenfeld JV, Pickard JD, Czosnyka M. A continuous correlation between intracranial pressure and cerebral blood flow velocity reflects cerebral autoregulation impairment during intracranial pressure plateau waves. Neurocrit Care. 2014;21(3):514–525. doi: 10.1007/s12028-014-9994-7 [DOI] [PubMed] [Google Scholar]
- 129.Pringle J, Roberts C, Kohl M, Lekeux P. Near infrared spectroscopy in large animals: optical pathlength and influence of hair covering and epidermal pigmentation. Vet J. 1999;158(1):48–52. doi: 10.1053/tvjl.1998.0306 [DOI] [PubMed] [Google Scholar]


