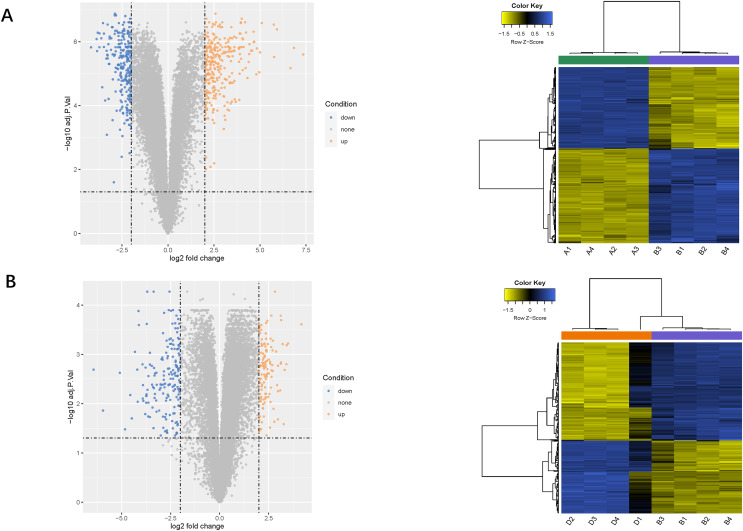
Figure 2. Analysis of DEGs.
(A) Volcano plot and heat map of DEGs between the LPS (group B) and control group (group A). (B) Volcano plot and heat map of DEGs between the LPS + AMD3100 (group D) and LPS group (group B) (n = 4 in each group). DEGs, differentially expressed genes; LPS, lipopolysaccharide.

