Abstract
Background
Tumor is a complex and dynamic ecosystem formed by the interaction of numerous diverse cells types and the microenvironments they inhabit. Determining how cellular states change and develop distinct cellular communities in response to the tumor microenvironment is critical to understanding cancer progression. Tumour-associated macrophages (TAMs) are an important component of the tumour microenvironment and play a crucial role in cancer progression. This study was designed to identify cell-state-specific M2 macrophage markers associated with gastric cancer (GC) prognosis through integrative analysis of single-cell RNA sequencing (scRNA-seq) and bulk RNA-seq data using a machine learning framework named EcoTyper.
Results
The results showed that TAMs were classified into M1 macrophages, M2 macrophages, monocytes, undefined macrophages and dendritic cells, with M2 macrophages predominating. EcoTyper assigned macrophages to different cell states and ecotypes. A total of 168 cell-state-specific M2 macrophage markers were obtained by integrative analysis of scRNA-seq and bulk RNA-seq data. These markers could categorize GC patients into two clusters (clusters A and B) with different survival and M2 macrophages infiltration abundance. Cell adhesion molecules, cytokine-cytokine receptor interaction, JAK/STAT pathway, MAPK pathway were significantly enriched in cluster A, which had worse survival and higher M2 macrophages infiltration.
Conclusion
In conclusion, this study profiles a single-cell atlas of intratumor heterogeneity and defines the cell states and ecotypes of TAMs in GC. Furthermore, we have identified prognostically relevant cell-state-specific M2 macrophage markers. These findings provide novel insights into the tumor ecosystem and cancer progression.
Keywords: Tumor-associated macrophages, Gastric cancer, Ecotype, Cell state, Prognosis
Introduction
Gastric cancer (GC) is one of the most common human malignancies. Globally, GC is the fifth most prevalent cancer and the fourth most leading cause of cancer-related deaths, causing an estimated 769,000 deaths in 2020, according to GLOBOCAN 2020 statistics.1 When patients are diagnosed with early stage GC, current treatment modalities could achieve a better outcome. However, for patients with advanced GC, there is a lack of effective treatment and the prognosis is extremely poor.2 An important factor affecting the ultimate therapeutic outcome is tumor heterogeneity, ie stomach tumors often exhibit a high degree of histological, transcriptomic and genomic variation, resulting in different tumour behaviors and treatment responses. Factoring this heterogeneity into the clinical management of GC and identifying the molecular pathways driving hallmarks of GC variation represent important goals for improving GC patient outcomes.
The dynamic interactions between cancer cells and their microenvironment determine trajectories of tumor growth, immune evasion, invasion, metastasis and therapeutic resistance. The tumor microenvironment (TME), characterized by the lack of nutrients, developing an acidic and hypoxic environment and consisting of cancerous and non-cancerous cells that support tumor survival.3 Tumor-associated macrophages (TAMs) are one of the major immune cells that infiltrate within the tumor and provide an important inflammatory environment for cancer progression. Various stimulating factors in the TME influence the polarization of TAMs into multiple phenotypes, such as M1 and M2.4 During tumor development, the phenotype of TAMs is dynamically changing and is determined by the TME. M1-like macrophages are activated to produce chemokines and cytokines to recruit the CD8+ T and NK cells, which express high levels of IFN-γ and other cytokines to destroy the tumor cells.4 Conversely, M2-like macrophages protect the cancer cells from anti-tumor immune responses and promote their proliferation, angiogenesis and metastasis. M2-like TAMs impede the cytotoxicity of NK cells against cancer cells by secreting TGF-β and restrict the antitumor activity of T cells by expressing programmed cell death ligand 1 (PD-L1).5,6 Furthermore, previous studies have shown that a high level of TAMs infiltration is associated with the invasive characteristics of GC and is an independent adverse prognostic factor for GC patients.7,8 These findings suggest that the number and distribution of TAMs is an important factor influencing the co-evolution of cancer cells and TAMs.
Tumor is a complex and dynamic ecosystem defined by the interplay of many different types of cells and the microenvironment in which they reside. Determining how the state of cells varies with their microenvironment and form distinct cellular communities is critical to understanding cancer progression. EcoTyper, a new machine learning framework, first introduced by Luca et al,9 for large-scale identification and validation of cell states and ecosystems from single-cell, bulk and spatially-resolved gene expression data, providing insight into the cellular background and community structure of human cancers. In the current study, we constructed the single-cell landscape of intratumoral heterogeneity in GC, analyzed the cellular states and ecosystems of TAMs, and identified cell-state-specific M2 macrophage markers associated with prognosis based on single-cell RNA-sequencing (scRNA-seq) data from the GEO database and bulk RNA-seq data from the TCGA database.
Methods
Source and Processing of scRNA-Seq Data
scRNA-seq data of three primary tumor samples (PT; PT 1, PT 2 and PT 3), two liver metastasis samples (Li; Li 1 and Li 2), two lymph nodes metastasis samples (LN; LN 1 and LN 2) and one peritoneal metastasis sample (P; P 1) in the GSE163558 dataset were sourced from the GEO database (https://www.ncbi.nlm.nih.gov/geo/). The enrolled patients did not receive anticancer treatment such as chemotherapy, radiotherapy, and targeted therapy prior to specimen collection. Seurat package was used to analyze the scRNA-seq data.10 Genes and low-quality cells were first filtered using the criteria: genes expressed in < 3 cells and unique genes expressed within a cell < 200. Then genes and cells were further excluded with the following cutoffs: the number of genes detected in each cell (nFeature_RNA) ≤ 2% or ≥ 98%, the total number of molecules detected within a cell (nCount_RNA) ≥ 95% and the percentage of reads mapped to the mitochondrial genome (percent.mt) ≥ 20%. After cell filtering, the high quality scRNA-seq data were normalized by SCTransform function in the Seurat package and used for principle component analysis (PCA).11 Cell clustering was then performed on selected principle components (PCs) using t-SNE algorithm.11 Next, the annotation of cell type in different cell clusters were performed using markers from previously reported the literature, as shown in Table S1.12 In addition, monocyte/macrophage cells were further clustered into different subpopulations, and the cellular subpopulations were annotated by markers from previously reported the literature, as shown in Table S2.12
Identification of Cellular States and Ecotypes
In the current study, cellular states and ecotypes of monocyte/macrophage cell populations were analyzed by the EcoTyper method following the steps depicted in the work of Luca et al,9 including (i) cell state discovery, rank selection and cell state quality control based on variants of unsupervised and supervised non-negative matrix factorization (NMF) statistical learning algorithms to identify and quantify cell-type-specific transcriptional states and (ii) ecotype discovery to co-assign cell states into multicellular communities (ecotypes).
Identification of Specific Genes Associated with the Cell States of M2 Macrophages
Next, differentially expressed genes (DEGs) between M1 and M2 macrophages under different cell states and ecotypes were identified by “limma” R package. Those DEGs were crossed with signature genes from different cell states identified by EcoTyper to obtain cell-state-specific DEGs between M1 and M2 macrophages. The function of the cell-state-specific DEGs were then analyzed by GSVA (gene set variation analysis) using hallmark gene sets as reference.13 The correlations among the cell-state-specific DEGs were analyzed by Spearman method. To get more robust genes related to M2 macrophages, the bulk RNA-seq data of GC patients were downloaded from TCGA database (https://portal.gdc.cancer.gov/). First, the proportions of M2 macrophages were calculated by CIBERSORTx algorithm, followed by the division of TCGA-STAD cohort into low- and high-M2 macrophage groups.14 Survival curves for the low- and high-M2 macrophage groups were plotted by Kaplan-Meier, and differences were compared by Log rank test to detect whether M2 macrophages were associated with prognosis in GC patients. Then, WGCNA (weighted gene co-expression network analysis) was performed to screen module genes associated with M2 macrophages.15 Finally, cell-state-specific marker genes of M2 macrophages were obtained by overlapping the module genes with cell-state-specific DEGs between M1 and M2 macrophages for the downstream analysis.
Consensus Clustering Analysis
In order to investigate the function of cell-state-specific M2 macrophage marker genes in GC, “ConsensusClusterPlus” R package was applied to divide TCGA-STAD cohort into different clusters based on K-means consensus clustering. The PCA was used to determine the performance of consensus clustering. Expression of cell-state-specific M2 macrophage marker genes in different clusters was visualized in the heatmap. Survival between different clusters was analyzed by Kaplan-Meier curves and Log rank test. Thereafter, the CIBERSORTx algorithm was employed to calculate the proportions of M2 macrophages in different clusters. Moreover, GSEA method was applied to investigate the KEGG pathways significantly enriched in different clusters. KEGG pathways with FDR <0.05 were considered as significantly enriched.16
Results
Single-Cell Landscape Reveals the Cellular Heterogeneity of GC
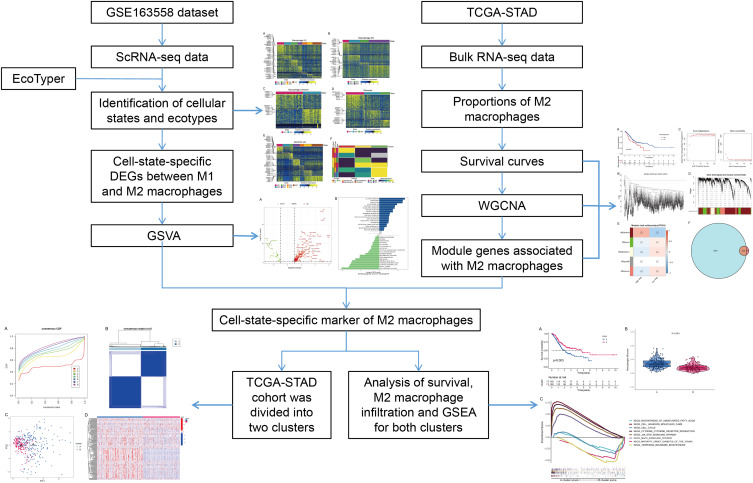
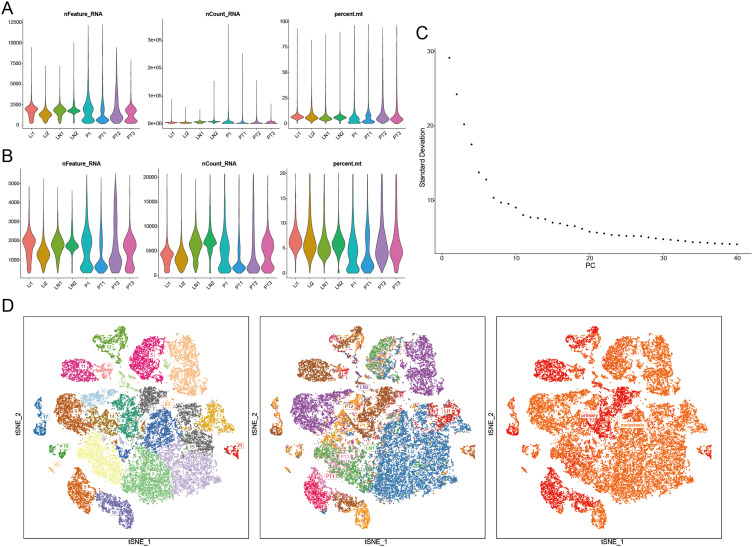
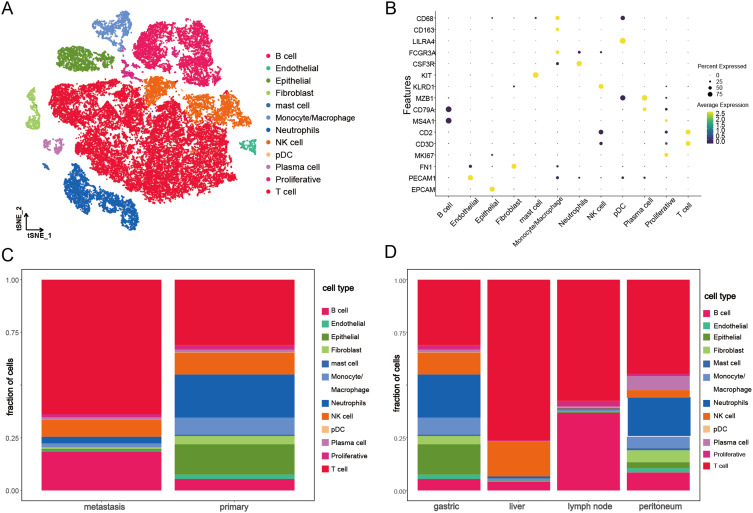
In this study, the scRNA-seq and bulk RNA-seq data of GC samples from public databases were included for subsequent analyses. The flowchart of the study design is shown in Figure 1. After removing genes expressed in < 3 cells and cells with the unique genes expressed < 200, a total of 25,366 genes within 45,388 cells were obtained. The number of genes measured per cell (nFeature_RNA), the number of gene counts measured per cell (nCount_RNA) and the percentage of mitochondrial genes (percent.mt) were shown in Vlnplots (Figure 2A). After further quality control on nFeature_RNA, nCount_RNA and percent.mt, a total of 20,752 genes within 38,148 cells were used for the downstream analysis (Figure 2B). Forty PCs were identified (Figure 2C), and the top 36 PCs were selected for the following t-SNE analysis. By t-SNE and clustering, we identified 23 cell populations from primary and metastasis samples (Figure 2D). Further cell annotation revealed that those cell populations were composed of 20,535 T cells, 5555 B cells, 3329 NK cells, 3219 neutrophils, 1853 epithelial cells, 1358 monocytes/macrophages, 695 fibroblasts, 617 proliferative cells, 446 plasma cells, 363 endothelial cells, 129 mast cells and 49 pDCs (Figure 3A and B). Interestingly, we noticed that the proportion of each cell type varied greatly between primary and metastatic samples (Figure 3C) and among metastatic samples from different tissues (Figure 3D), indicating a high level of cellular heterogeneity in GC. For monocytes/macrophages, higher proportion was observed in primary samples compared with metastasis samples (Figure 3C); and in metastasis samples, more monocytes/macrophages were detected in peritoneum tissues compared with liver and lymph node tissues (Figure 3D).
Figure 1.
Design and workflow of this study.
Figure 2.
Quality control, normalization, principal component analysis (PCA) and cluster analysis of single-cell RNA-seq data for gastric cancer. (A) Vlnplots of the number of genes measured per cell (nFeature), the number of gene counts measured per cell (nCount) and the percentage of mitochondrial genes (percent.mt) before quality control. (B) Vlnplots of the nFeature, the nCount and the percent.mt after quality control. (C) Scree plot for PCA. (D) Cell clusters distribution of the single-cell of primary and metastatic gastric cancer.
Figure 3.
Cellular heterogeneity in gastric cancer based on single-cell RNA-seq data. (A) Single-cell tSNE map of primary and metastatic gastric cancer. (B) Bubble plot of marker gene labeling for different cell types. (C) Proportions of different cell types in primary and metastatic gastric cancer samples. (D) Proportions of different cell types in primary and different metastatic sites samples of gastric cancer.
M2 Macrophages Constitute a Main Subpopulation of TAMs in GC
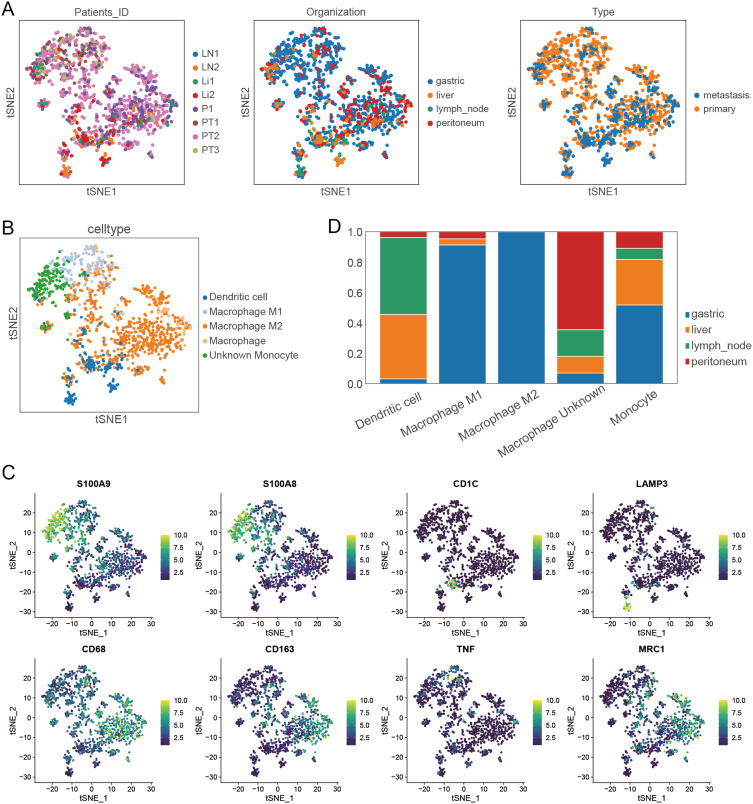
Thereafter, we extracted monocyte/macrophage cell populations from the whole cellular landscape of GC (Figure 4A). By using markers in Table S2, those monocyte/macrophage populations were further classified into 738 M2 macrophages, 189 dendritic cells, 183 M1 macrophages, 181 monocytes and 67 undefined macrophages (Figure 4B and C). Specifically, dendritic cells were mainly in liver and lymph node metastasis tissues, M1 macrophages were mainly in primary tissues, M2 macrophage were mainly in primary and peritoneum metastasis tissues, monocytes were mainly in liver tissues, and undefined macrophages were only in peritoneum metastasis tissues (Figure 4D).
Figure 4.
Distribution of different monocyte/macrophage subpopulations in primary and metastatic gastric cancer. (A) Distribution of different monocyte/macrophage cell clusters in primary and metastatic gastric cancer. (B) Single-cell tSNE map of monocyte/macrophage subpopulations in primary and metastatic gastric cancer. (C) Distribution of different monocyte/macrophage subpopulations labeled by marker genes. (D) Proportions of different Monocyte/macrophage subpopulations in tumor samples from different sites.
Two Hundred and Thirteen DEGs Were Identified Between M1 and M2 Macrophages Under Different Cell States and Ecotypes
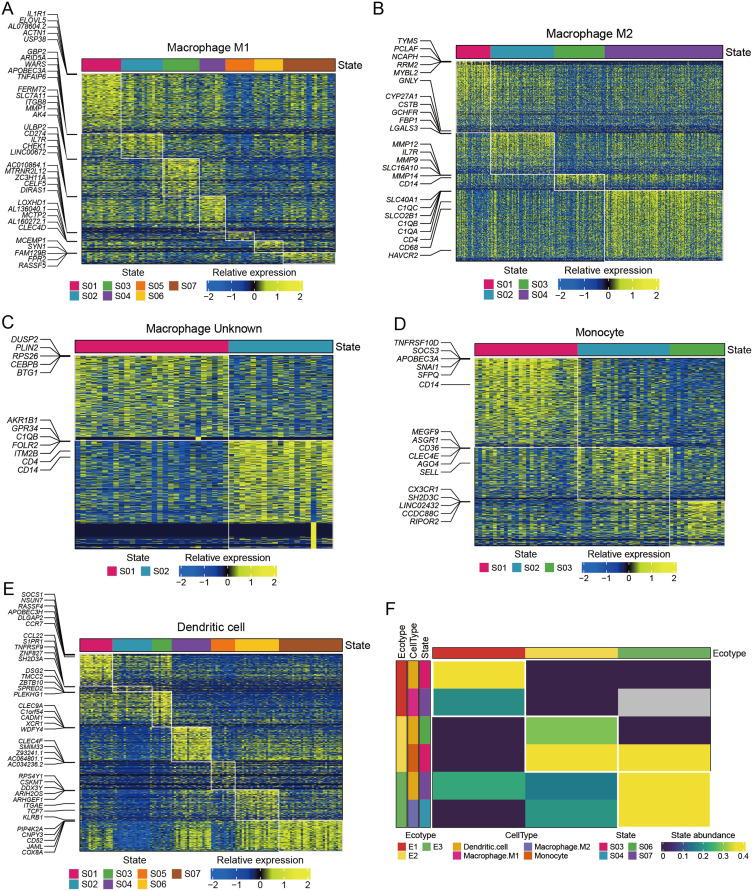
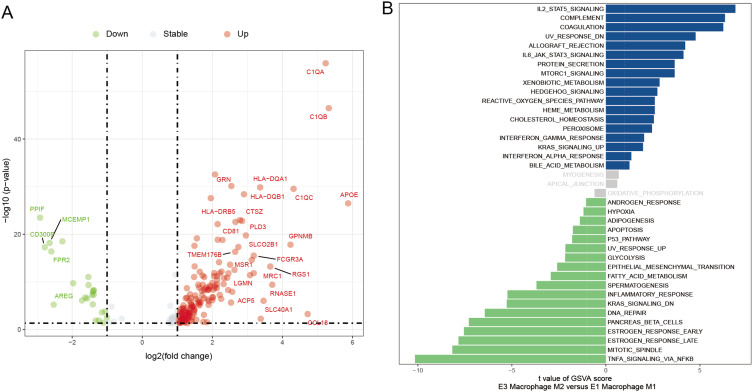
Next, M1 macrophages, M2 macrophages, undefined macrophages, monocytes and dendritic cells were divided into 7, 4, 2, 3 and 7 cellular states, respectively, by Ecotyper, as shown in Figure 5A–E. Further analysis by EcoTyper assigned M1 macrophages at cell state 7 (S07) and M2 macrophages at cell state 4 (S04) into ecotype 1 (E1) and ecotype 3 (E3), respectively (Figure 5F). A total of 528 DEGs were then identified between M1 macrophages at E1-S07 and M2 macrophages E3-S04 (Table S3). Subsequently, 213 cell-state-specific DEGs between M1 and M2 macrophages, including 185 up-regulated and 28 down-regulated genes, were obtained by overlapping the 528 DEGs with 409 signature genes from the S07 and S04 states (Figure 6A and Table S4). By GSVA analysis on those 213 cell-state-specific DEGs between E1-M1 and E3-M2 macrophages, we observed that E3-M2 macrophages were mainly involved in hallmarks of IL2-STAT5 signaling, complement and coagulation, and E1-M1 macrophages were mainly related to hallmarks of TGFα signaling via NFκB, mitotic spindle and estrogen response late (Figure 6B). Moreover, we found a strong correlation between the expression of 31 pairs of cell-state-specific DEGs, such as C1QA and MCEMP1 (cor = −0.861), C1QB and MCEMP1 (cor = −0.844), C1QA and FPR2 (cor = −0.812), C1QC and MCEMP1 (cor = −0.806), HLA-DRA and HLA-DRB1 (cor = 0.8), GPNMB and GRN (cor = 0.801), HLA-A and B2M (cor = 0.806), CD81 and APOE (cor = 0.808), HLA-DQA1 and HLA-DPB1 (cor = 0.818), C1QA and APOE (cor = 0.829), GRN and CTSZ (cor = 0.83), C1QB and HLA-DQA1 (cor = 0.831), etc. (Table S5).
Figure 5.
Heat maps of cell states and ecotypes of different monocyte/macrophage subpopulations obtained by Ecotyper machine learning framework. (A-E) Heat maps of cell states of M1 macrophages, M2 macrophages, undefined macrophages, monocytes and dendritic cells in Ecotyper. (F) Heat map of cell states and ecotypes of M1 macrophages, M2 macrophages, monocytes and dendritic cells in Ecotyper.
Figure 6.
Cell-state-specific differentially expressed genes between M1 and M2 macrophages. (A) Volcano plot of cell-state-specific differentially expressed genes between M1 and M2 macrophages. (B) Bar graph for GSVA analysis of cell-state-specific differentially expressed genes between M1 and M2 macrophages.
One Hundred and Sixty-Eight Cell-State-Specific Marker Genes of M2 Macrophages Were Related to GC Prognosis
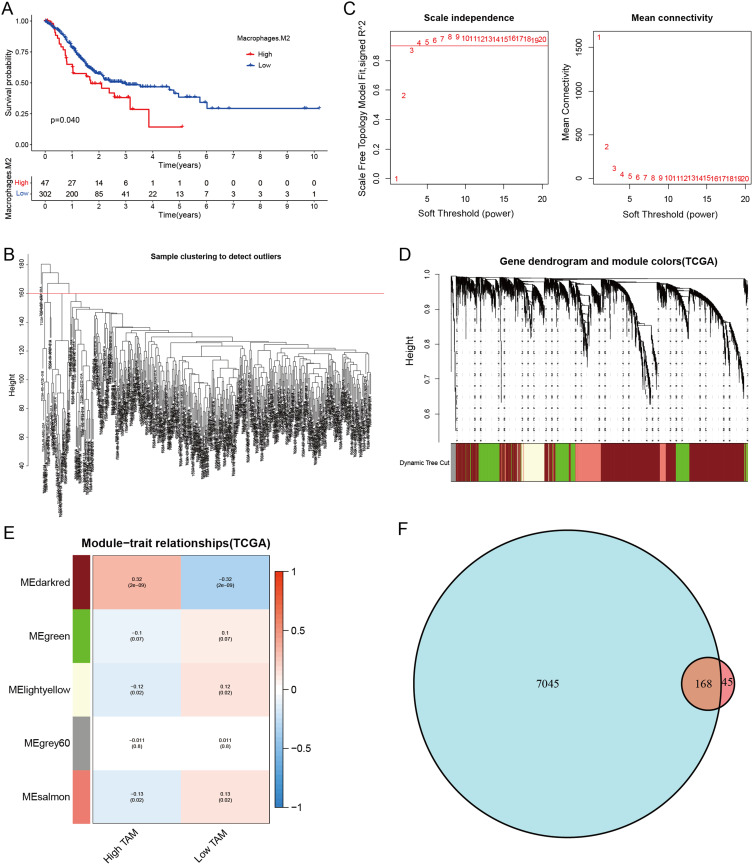
Next, the proportion of TAMs was calculated by the CIBERSORTx using the bulk RNA-seq data from GC samples. Consistently, M2 macrophages were the major TAMs in the TCGA-STAD cohort (Additional file 1). We then divided GC patients into low and high M2 macrophage groups. Kaplan-Meier analysis showed that patients in the low M2 macrophage group had better survival (Figure 7A), indicating that M2 macrophage is related to prognosis in GC. To obtain the genes related to M2 macrophages, we performed WGCNA analysis. Figure 7B showed that no outliers were detected in TCGA-STAD. Figure 7C showed that 3 was the optimal soft threshold power with an R2 of about 0.9. Five modules were then identified by WGCNA (Figure 7D). According to the correlation analysis between modules and M2 macrophages, we observed that darkred module had the relatively strongest correlation with M2 macrophages (cor = 0.32, p < 0.01) (Figure 7E). By intersecting 7213 genes in the darkred module with 213 cell-state-specific DEGs between E1-M1 and E3-M2 macrophages, 168 genes were identified as cell-state-specific M2 macrophage markers (Figure 7F and Additional file 2).
Figure 7.
Screening for TAMs-related module genes by WGCNA. (A) Survival curves of TCGA-STAD cohort between high and low abundance of M2 macrophages. (B) Clustering analysis of TCGA-STAD samples. (C) Scatterplots of soft thresholds. (D) Network diagram of module co-expression. (E) Heat map of correlation between TAMs and modules. (F) Venn diagram for intersection of darkred module genes obtained by WGCNA with cell-state-specific differentially expressed genes between M1 and M2 macrophages.
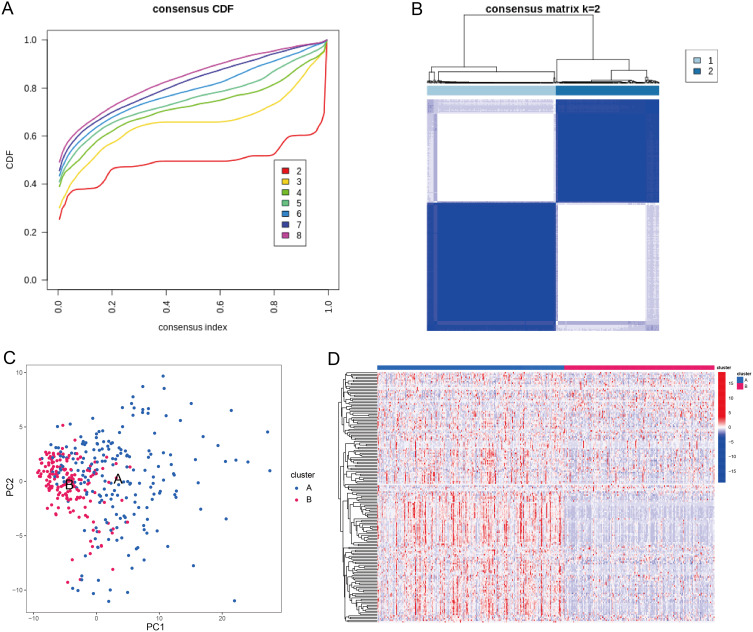
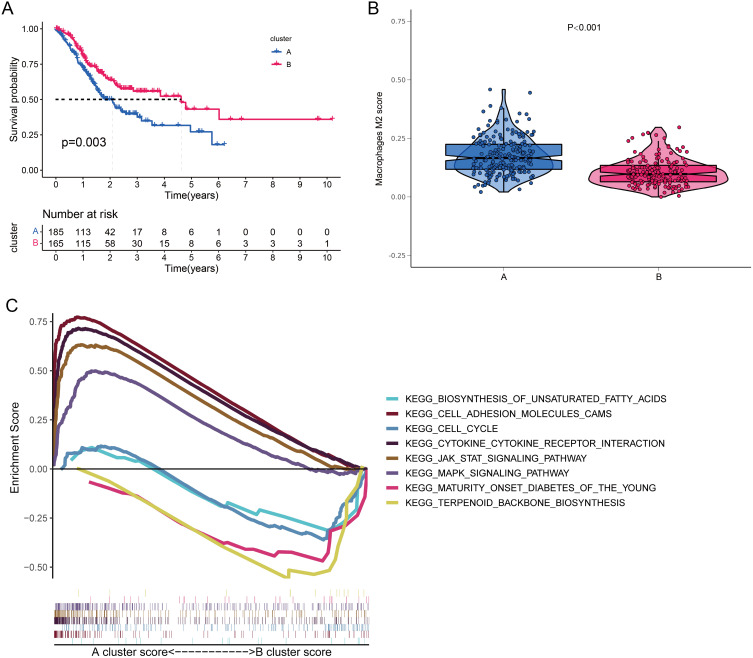
Subsequently, we divided the TCGA-STAD cohort into two clusters (cluster A and cluster B) based on the expressions of 168 cell-state-specific M2 macrophage marker genes (Figure 8A and B). PCA plot showed that samples in cluster A and samples in cluster B were in two distinct groups (Figure 8C). The expressions of cell-state-specific M2 macrophage markers were much higher in cluster A compared with cluster B (Figure 8D). Moreover, we observed that patients in cluster B had significantly better survival (Figure 9A) and lower proportions of M2 macrophages (Figure 9B). GSEA analysis showed that cell adhesion molecules, cytokine-cytokine receptor interaction, JAK/STAT signaling pathway and MAPK signaling pathway were significantly enriched in cluster A, and biosynthesis of unsaturated fatty acids, cell cycle, maturity onset diabetes of the young and terpenoid backbone biosynthesis were remarkably enriched in cluster B (Figure 9C).
Figure 8.
TCGA-STAD cohort was divided into two clusters based on cell-state-specific M2 macrophage markers. (A) The relative change in the area under the cumulative distribution function (CDF) curve for the TCGA-STAD dataset. The number of clusters k varies from 2 to 8. k = 2 resulted in less increase in CDF difference after the consensus index and was therefore selected as the optimal number of cluster. (B) Consensus matrix heatmap of the optimal number of cluster k = 2 for the TCGA-STAD dataset. (C) Visualization of distribution of the two TCGA-STAD clusters (cluster A and cluster (B) using PCA method. (D) Heat map for the expression of cell-state-specific M2 macrophage marker genes between the two clusters.
Figure 9.
Analysis of survival, M2 macrophage infiltration and GSEA for both clusters. (A) Kaplan-Meier survival curves for both clusters. (B) Infiltration abundance of M2 macrophages in samples from both clusters. (C) GSEA analysis of the KEGG pathways for both clusters.
Discussion
TAMs are the most abundant population of immune cells in the TME and are strongly associated with tumorigenesis and tumor progression. Therefore, it is valuable to identify the cellular states and ecotypes of TAMs in tumors for the development of new targets. In this study, we characterised the single-cell profiling in primary and metastatic GC, mined the cell states and ecosystems of TAMs in GC using a new machine learning framework, EcoTypers, and identified cell-state-specific TAMs-related genes based on scRNA-seq data. We found that TAMs in GC were classified into M1 macrophages, M2 macrophages, monocytes, undefined macrophages, and dendritic cells, with M2 macrophages predominating. EcoTyper data analysis revealed that M2 macrophages were distributed to four cell states (S01-S04) and M2 macrophages in S04 were further incorporated into ecotype 3 (E3). A total of 528 DEGs were identified between M1 macrophages of E1-S07 and M2 macrophages of E3-S04. Subsequently, a comprehensive analysis of scRNA-seq and bulk RNA-seq data from GC yielded 168 cell-state-specific M2 macrophage markers. Furthermore, GSEA analysis showed that cell adhesion molecules, cytokine-cytokine receptor interaction, JAK/STAT signaling pathway, and MAPK signaling pathway were significantly enriched in cluster A, which had significantly poorer survival and higher infiltration of M2 macrophages.
M2 macrophages play pivotal roles in the malignant progression of GC. Yamaguchi et al7 showed that M2 macrophages were strongly associated with peritoneal spread in GC patients and acted as a pro-metastatic role. Zheng et al17,18 showed that M2 polarized macrophage-derived exosomes activated the PI3K/AKT signaling pathway, were involved in mediating resistance to cisplatin, and promoted the invasiveness of GC cells. Li et al19 showed that GC-derived mesenchymal stromal cells promoted M2 macrophage polarization in GC tissues through massive secretion of IL-6 and IL-8, which promoted EMT of GC cells and thus contributed to GC metastasis. In the present study, we identified M2 macrophages as the major subpopulation of TAMs in GC by analysing scRNA-seq and bulk RNA-seq data. M2 macrophages were then classified into four cell states by EcoTyper, and cell state 4 was included in ecotype 3. Compared with M1 macrophages included in ecotype 1, M2 macrophages were mainly associated with IL2-STAT5 signaling pathway, complement and coagulation. Activation of IL2-STAT5 signaling pathway was reported to lead to proliferation, migration, invasion and survival of GC cells.20 Complement is thought to play a key role in the pathogenesis of human cancers, including GC.21 Yuan et al22 reported that overexpression of complement C3 could activate the JAK2/STAT3 pathway and was associated with the progression of GC. The interaction of coagulation and immune infiltrating cells in the tumor microenvironment is involved in tumorigenesis and tumor progression.23 Ma et al24 showed that macrophages treated with coagulation factors behaved as TAMs with M2 characteristics, secreted high levels of IL-4, IL-10, transforming growth factor (TGF)-β, and tumor necrosis factor (TNF)-α, and activated TAMs induced expression of vascular endothelial growth factor/MMP-9, thereby promoting GC cells migration and invasion.
Next, we acquired a total of 168 cell-state-specific M2 macrophage marker genes by integration of scRNA-seq and bulk RNA-seq data, which were able to classify GC patients into two subtypes with significantly different survival. Furthermore, there was a significant difference in M2 macrophage infiltration between these two subtypes with differential survival, indicating that the cell-state-specific M2 macrophage marker genes affect the prognosis of GC patients. These results further suggest that M2 macrophages play important roles in GC progression. Finally, we performed GSEA analysis to further explore the potential molecular mechanisms by which cell-state-specific M2 macrophage marker genes affect the prognosis of GC patients. GSEA analysis revealed that cell adhesion molecules, cytokine-cytokine receptor interaction, JAK/STAT signaling pathway, MAPK signaling pathway were significantly enriched in cluster A, while biosynthesis of unsaturated fatty acids, cell cycle, maturity onset diabetes of the young and terpenoid backbone biosynthesis were remarkably enriched in cluster B. The pathways enriched to cluster A are involved in human tumorigenesis and tumor progression. For example, Ju et al25 showed that infiltrating TAMs released the pro-inflammatory cytokines TNF-ɑ and IL-6, which activated the NF-kB and STAT3 signaling pathways, thereby inducing PD-L1 expression in tumor cells and thus promoting GC cell proliferation. Li et al26 showed that the JAK/STAT pathway mediated the pro-inflammatory response of H. pylori to the gastric mucosa and increased PD-L1 expression, allowing immune surveillance to be blocked, thereby leading to gastric carcinogenesis.
The diverse states and ecotypes of TAMs underscore their remarkable plasticity and diversity. Chemotherapy, radiotherapy, targeted therapy, and immunotherapy profoundly affect the functions of TAMs. Antitumor treatments can modulate the function and marker expression of TAMs by directly influencing their behavior or by altering the components and signaling of the TME.27–31 These therapies exhibit a dual role in that they not only enhance treatment efficacy by regulating TAMs polarization, but also convert TAMs into M2 macrophages with an immunosuppressive phenotype, thereby facilitating tumor recurrence.31,32 Furthermore, during tumor relapse, M2 macrophages adapt to the new TME, displaying unique marker expression patterns and evolving into more aggressive phenotypes, thus further supporting cancer recurrence.33–35 Despite advancements, numerous uncertainties remain in this field. Future studies should investigate the long-term effects of various treatments on M2 macrophages to improve personalised medicine and prognostic assessment. Such insights are crucial for the development of more effective therapeutic strategies.
Limitations of the Study
This study revealed for the first time prognostically relevant cell-state-specific M2 macrophage markers in GC using scRNA-seq and bulk RNA-seq data. However, there are still several limitations that need to be raised. First, the data for this study were only derived from public databases and lacked the inclusion of clinical samples. Second, we did not validate the expression of cell-state-specific M2 macrophage marker genes in GC tissues. Finally, we did not perform cellular and animal experiments to investigate the effect of these marker genes on the biological behaviour of GC in vivo and in vitro. Therefore, further experimental designs are needed to investigate the role and mechanism of cell-state-specific M2 macrophage markers in GC progression. Although the current study has not been validated in vivo and in vitro, the markers we identified provide direction for subsequent experimental studies and lay the foundation for potential therapeutic targets and new clinical intervention strategies in gastric cancer.
Conclusions
In conclusion, the present study presents a single-cell atlas of intratumoral heterogeneity in GC, and provides insight into the cell landscape and community structure in the GC microenvironment by identifying different cell states and and ecotypes of TAMs. Furthermore, this study identifies cell-state-specific M2 macrophage markers, and investigates their impact on GC prognosis as well as the underlying molecular mechanisms. These findings provide novel insights into the tumor ecosystem and offer clues for further exploration of the pathogenesis and progression of GC as well as identification of new therapeutic targets.
Funding Statement
This study was supported by the Zhejiang Provincial Natural Science Foundation of China (No. LGF19H290004).
Data Sharing Statement
The datasets used and/or analysed during the current study are available from the corresponding author on reasonable request.
Ethics Approval and Consent to Participate
All relevant ethical regulations were followed the original study of the datasets and the authors of the source studies had also obtained informed consent from participants. Ethical approval for this study was exempted by the Second Affiliated hospital, Zhejiang University School of Medicine, as the data were obtained from public sources.
Author Contributions
All authors made a significant contribution to the work reported, whether that is in the conception, study design, execution, acquisition of data, analysis and interpretation, or in all these areas; took part in drafting, revising or critically reviewing the article; gave final approval of the version to be published; have agreed on the journal to which the article has been submitted; and agree to be accountable for all aspects of the work.
Disclosure
The authors declare that they have no competing interests in this work.
References
- 1.Sung H, Ferlay J, Siegel RL. et al. Global Cancer Statistics 2020: GLOBOCAN estimates of incidence and mortality worldwide for 36 cancers in 185 countries. CA Cancer J Clin. 2021;71(3):209–249. doi: 10.3322/caac.21660 [DOI] [PubMed] [Google Scholar]
- 2.Noone AM, Cronin KA, Altekruse SF, et al. Cancer incidence and survival trends by subtype using data from the surveillance epidemiology and end results program, 1992-2013. Cancer Epidemiol Biomarkers Prev. 2017;26(4):632–641. doi: 10.1158/1055-9965.EPI-16-0520 [DOI] [PMC free article] [PubMed] [Google Scholar]
- 3.Goswami KK, Ghosh T, Ghosh S, Sarkar M, Bose A, Baral R. Tumor promoting role of anti-tumor macrophages in tumor microenvironment. Cell Immunol. 2017;316:1–10. doi: 10.1016/j.cellimm.2017.04.005 [DOI] [PubMed] [Google Scholar]
- 4.Mosser DM, Edwards JP. Exploring the full spectrum of macrophage activation. Nat Rev Immunol. 2008;8(12):958–969. doi: 10.1038/nri2448 [DOI] [PMC free article] [PubMed] [Google Scholar]
- 5.Sumitomo R, Hirai T, Fujita M, Murakami H, Otake Y, Huang CL. PD-L1 expression on tumor-infiltrating immune cells is highly associated with M2 TAM and aggressive malignant potential in patients with resected non-small cell lung cancer. Lung Cancer. 2019;136:136–144. doi: 10.1016/j.lungcan.2019.08.023 [DOI] [PubMed] [Google Scholar]
- 6.Ruffell B, Coussens LM. Macrophages and therapeutic resistance in cancer. Cancer Cell. 2015;27(4):462–472. doi: 10.1016/j.ccell.2015.02.015 [DOI] [PMC free article] [PubMed] [Google Scholar]
- 7.Yamaguchi T, Fushida S, Yamamoto Y, et al. Tumor-associated macrophages of the M2 phenotype contribute to progression in gastric cancer with peritoneal dissemination. Gastric Cancer. 2016;19(4):1052–1065. doi: 10.1007/s10120-015-0579-8 [DOI] [PMC free article] [PubMed] [Google Scholar]
- 8.Wang J, Mi S, Ding M, Li X, Yuan S. Metabolism and polarization regulation of macrophages in the tumor microenvironment. Cancer Lett. 2022;543:215766. doi: 10.1016/j.canlet.2022.215766 [DOI] [PubMed] [Google Scholar]
- 9.Luca BA, Steen CB, Matusiak M, et al. Atlas of clinically distinct cell states and ecosystems across human solid tumors. Cell. 2021;184(21):5482–5496.e28. doi: 10.1016/j.cell.2021.09.014 [DOI] [PMC free article] [PubMed] [Google Scholar]
- 10.Butler A, Hoffman P, Smibert P, Papalexi E, Satija R. Integrating single-cell transcriptomic data across different conditions, technologies, and species. Nat Biotechnol. 2018;36(5):411–420. doi: 10.1038/nbt.4096 [DOI] [PMC free article] [PubMed] [Google Scholar]
- 11.Lall S, Sinha D, Bandyopadhyay S, Sengupta D. Structure-aware principal component analysis for single-cell RNA-seq data. J Comput Biol. 2018;25(12):1365–1373. doi: 10.1089/cmb.2018.0027 [DOI] [PubMed] [Google Scholar]
- 12.Kim J, Park C, Kim KH, et al. Single-cell analysis of gastric pre-cancerous and cancer lesions reveals cell lineage diversity and intratumoral heterogeneity. NPJ Precis Oncol. 2022;6(1):9. doi: 10.1038/s41698-022-00251-1 [DOI] [PMC free article] [PubMed] [Google Scholar]
- 13.Hänzelmann S, Castelo R, Guinney J. GSVA: gene set variation analysis for microarray and RNA-seq data. BMC Bioinf. 2013;14(1):7. doi: 10.1186/1471-2105-14-7 [DOI] [PMC free article] [PubMed] [Google Scholar]
- 14.Chen B, Khodadoust MS, Liu CL, Newman AM, Alizadeh AA. Profiling Tumor Infiltrating Immune Cells with CIBERSORT. Methods Mol Biol. 2018;1711:243–259. doi: 10.1007/978-1-4939-7493-1_12 [DOI] [PMC free article] [PubMed] [Google Scholar]
- 15.Langfelder P, Horvath S. WGCNA: an R package for weighted correlation network analysis. BMC Bioinf. 2008;9(1):559. doi: 10.1186/1471-2105-9-559 [DOI] [PMC free article] [PubMed] [Google Scholar]
- 16.Subramanian A, Tamayo P, Mootha VK, et al. Gene set enrichment analysis: a knowledge-based approach for interpreting genome-wide expression profiles. Proc Natl Acad Sci U S A. 2005;102(43):15545–15550. doi: 10.1073/pnas.0506580102 [DOI] [PMC free article] [PubMed] [Google Scholar]
- 17.Zheng P, Chen L, Yuan X, et al. Exosomal transfer of tumor-associated macrophage-derived miR-21 confers cisplatin resistance in gastric cancer cells. J Exp Clin Cancer Res. 2017;36(1):53. doi: 10.1186/s13046-017-0528-y [DOI] [PMC free article] [PubMed] [Google Scholar]
- 18.Zheng P, Luo Q, Wang W, et al. Tumor-associated macrophages-derived exosomes promote the migration of gastric cancer cells by transfer of functional Apolipoprotein E. Cell Death Dis. 2018;9(4):434. doi: 10.1038/s41419-018-0465-5 [DOI] [PMC free article] [PubMed] [Google Scholar]
- 19.Li W, Zhang X, Wu F, et al. Gastric cancer-derived mesenchymal stromal cells trigger M2 macrophage polarization that promotes metastasis and EMT in gastric cancer. Cell Death Dis. 2019;10(12):918. doi: 10.1038/s41419-019-2131-y [DOI] [PMC free article] [PubMed] [Google Scholar]
- 20.Wang M, Chen L, Chen Y, et al. Intracellular matrix Gla protein promotes tumor progression by activating JAK2/STAT5 signaling in gastric cancer. Mol Oncol. 2020;14(5):1045–1058. doi: 10.1002/1878-0261.12652 [DOI] [PMC free article] [PubMed] [Google Scholar]
- 21.Chen J, Li GQ, Zhang L, et al. Complement C5a/C5aR pathway potentiates the pathogenesis of gastric cancer by down-regulating p21 expression. Cancer Lett. 2018;412:30–36. doi: 10.1016/j.canlet.2017.10.003 [DOI] [PubMed] [Google Scholar]
- 22.Yuan K, Ye J, Liu Z, et al. Complement C3 overexpression activates JAK2/STAT3 pathway and correlates with gastric cancer progression. J Exp Clin Cancer Res. 2020;39(1):9. doi: 10.1186/s13046-019-1514-3 [DOI] [PMC free article] [PubMed] [Google Scholar]
- 23.Singh AK, Malviya R. Coagulation and inflammation in cancer: limitations and prospects for treatment. Biochim Biophys Acta Rev Cancer. 2022;1877(3):188727. doi: 10.1016/j.bbcan.2022.188727 [DOI] [PubMed] [Google Scholar]
- 24.Ma YY, He XJ, Wang HJ, et al. Interaction of coagulation factors and tumor-associated macrophages mediates migration and invasion of gastric cancer. Cancer Sci. 2011;102(2):336–342. doi: 10.1111/j.1349-7006.2010.01795.x [DOI] [PubMed] [Google Scholar]
- 25.Ju X, Zhang H, Zhou Z, Chen M, Wang Q. Tumor-associated macrophages induce PD-L1 expression in gastric cancer cells through IL-6 and TNF-ɑ signaling. Exp Cell Res. 2020;396(2):112315. doi: 10.1016/j.yexcr.2020.112315 [DOI] [PubMed] [Google Scholar]
- 26.Li X, Pan K, Vieth M, Gerhard M, Li W, Mejías-Luque R. JAK-STAT1 signaling pathway is an early response to helicobacter pylori infection and contributes to immune escape and gastric carcinogenesis. Int J Mol Sci. 2022;23(8):4147. doi: 10.3390/ijms23084147 [DOI] [PMC free article] [PubMed] [Google Scholar]
- 27.Dijkgraaf EM, Heusinkveld M, Tummers B, et al. Chemotherapy alters monocyte differentiation to favor generation of cancer-supporting M2 macrophages in the tumor microenvironment. Cancer Res. 2013;73(8):2480–2492. doi: 10.1158/0008-5472.CAN-12-3542 [DOI] [PubMed] [Google Scholar]
- 28.De Palma M, Lewis CE. Macrophage regulation of tumor responses to anticancer therapies. Cancer Cell. 2013;23(3):277–286. doi: 10.1016/j.ccr.2013.02.013 [DOI] [PubMed] [Google Scholar]
- 29.Sprinzl MF, Reisinger F, Puschnik A, et al. Sorafenib perpetuates cellular anticancer effector functions by modulating the crosstalk between macrophages and natural killer cells. Hepatology. 2013;57(6):2358–2368. doi: 10.1002/hep.26328 [DOI] [PubMed] [Google Scholar]
- 30.Selby MJ, Engelhardt JJ, Quigley M, et al. Anti-CTLA-4 antibodies of IgG2a isotype enhance antitumor activity through reduction of intratumoral regulatory T cells. Cancer Immunol Res. 2013;1(1):32–42. doi: 10.1158/2326-6066.CIR-13-0013 [DOI] [PubMed] [Google Scholar]
- 31.Genard G, Lucas S, Michiels C. Reprogramming of tumor-associated macrophages with anticancer therapies: radiotherapy versus chemo- and immunotherapies. Front Immunol. 2017;8:828. doi: 10.3389/fimmu.2017.00828 [DOI] [PMC free article] [PubMed] [Google Scholar]
- 32.Mantovani A, Allavena P. The interaction of anticancer therapies with tumor-associated macrophages. J Exp Med. 2015;212(4):435–445. doi: 10.1084/jem.20150295 [DOI] [PMC free article] [PubMed] [Google Scholar]
- 33.You G, Zheng Z, Huang Y, et al. scRNA-seq and proteomics reveal the distinction of M2-like macrophages between primary and recurrent malignant glioma and its critical role in the recurrence. CNS Neurosci Ther. 2023;29(11):3391–3405. doi: 10.1111/cns.14269 [DOI] [PMC free article] [PubMed] [Google Scholar]
- 34.Xu H, Chai H, Chen M, et al. Single-cell RNA sequencing identifies a subtype of FN1 + tumor-associated macrophages associated with glioma recurrence and as a biomarker for immunotherapy. Biomark Res. 2024;12(1):114. doi: 10.1186/s40364-024-00662-1 [DOI] [PMC free article] [PubMed] [Google Scholar]
- 35.Zhang X, Guo L, Tian W, et al. CD36+ pro-inflammatory macrophages interact with ZCCHC12+ tumor cells in papillary thyroid cancer promoting tumor progression and recurrence. Cancer Immunol Res. 2024;12(11):1621–1639. doi: 10.1158/2326-6066.CIR-23-1047 [DOI] [PubMed] [Google Scholar]
Associated Data
This section collects any data citations, data availability statements, or supplementary materials included in this article.
Data Availability Statement
The datasets used and/or analysed during the current study are available from the corresponding author on reasonable request.


