

Abstract
N-methyl-D-Aspartate receptors (NMDARs) are calcium-permeable ion channels that are ubiquitously expressed within the glutamatergic postsynaptic density. Phosphorylation of NMDAR subunits defines receptor conductance and surface localization, two alterations that can modulate overall channel activity. Modulation of NMDAR phosphorylation by kinases and phosphatases regulates the amount of calcium entering the cell and subsequent activation of calcium-dependent processes. The dendritic spine enriched protein, spinophilin, is the major synaptic protein phosphatase 1 (PP1) targeting protein. Depending on the substrate, spinophilin can act as either a PP1 targeting protein, to permit substrate dephosphorylation, or a PP1 inhibitory protein, to enhance substrate phosphorylation. Spinophilin limits NMDAR function in a PP1-dependent manner. Specifically, we have previously shown that spinophilin sequesters PP1 away from the GluN2B subunit of the NMDAR, which results in increased phosphorylation of Ser-1284 on GluN2B. However, how spinophilin modifies NMDAR function is unclear. Herein, we utilize a Neuro2A cell line to detail that Ser-1284 phosphorylation increases calcium influx via GluN2B-containing NMDARs. Moreover, overexpression of spinophilin decreases GluN2B-containing NMDAR activity by decreasing its surface expression, an effect that is independent of Ser-1284 phosphorylation. In hippocampal neurons isolated from spinophilin knockout animals there is an increase in cleaved caspase-3 levels, a marker of calcium-associated apoptosis, compared to wildtype mice. Taken together, our data demonstrate that spinophilin regulates GluN2B containing NMDAR phosphorylation, channel function, and trafficking and that loss of spinophilin enhances neuronal cleaved caspase-3 expression.
Keywords: Phosphatase, Signal transduction, Hippocampus, Glutamatergic synapse, Calcium
Graphical Abstract.
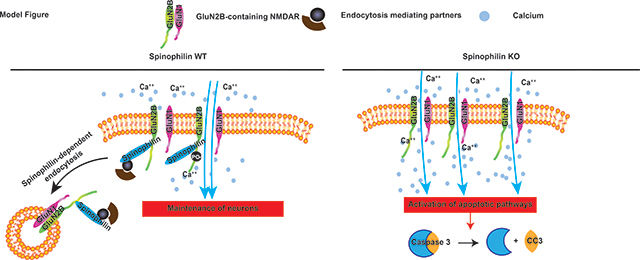
We found that spinophilin limits GluN2B surface expression independent of its ability to regulate Ser-1284 phosphorylation. Moreover, global spinophilin knockout mice had decreased total synaptic and NMDAR protein levels, but an increase in GluN2B surface expression in the residual NMDAR pool. Moreover, loss of spinophilin increases cleaved caspase expression in hippocampal neurons.
INTRODUCTION
Postsynaptic ionotropic glutamate receptors such as N-methyl-D-aspartate receptors (NMDARs) are required for calcium influx into the postsynapse to activate signaling cascades that respond to presynaptic glutamate release. The abundance and/or calcium permeability of NMDARs at the postsynaptic membrane help to dictate the responsivity of the neuron to this presynaptic glutamate by modulating the amount of calcium entering the cell. The NMDAR is made up of 2 obligate GluN1 subunits and 2 GluN2 or GluN3 subunits. There are multiple different GluN2 subunits, with GluN2A and GluN2B having prominence in the forebrain (Paoletti, Bellone, & Zhou, 2013). There are developmental and brain-region differences in isoform expression, with the GluN2B isoform being predominant at younger ages (Paoletti et al., 2013). GluN2B is highly expressed in the hippocampus of young (~P0-P14) mice. GluN2B has a slower decay time compared to GluN2A-containing NMDARs (Paoletti et al., 2013), permitting more calcium influx into the cell. Therefore, modulation of GluN2B receptor function can robustly increase or limit calcium influx and subsequently regulate activation of signaling cascades within the postsynapse. While increases in calcium via GluN2B-containing NMDARs are critical for activation of signaling molecules such as calcium/calmodulin-dependent protein kinase II (Tavalin & Colbran, 2017), too much calcium influx can activate cleavage of apoptotic factors such as caspase-3 (Affaticati et al., 2011; Sanelli, Ge, Leystra-Lantz, & Strong, 2007). Therefore, an appropriate balance of GluN2B-containing NMDAR receptor expression and activity at the postsynapse is critical for normal neuronal function and imbalances in the functionality of this receptor can lead to pathologies, such as activation of apoptotic pathways.
GluN2B-containing NMDAR channel activity and subcellular localization is enhanced by phosphorylation of the channel at Ser-1166 or Ser-1303 (Liao, Wagner, Hsu, & Leonard, 2001; Murphy et al., 2014; Tavalin & Colbran, 2017; Tu et al., 2010). Conversely, dephosphorylation of GluN2B at Ser-1480 by protein phosphatase 1 (PP1) causes translocation of the NMDAR to the synaptic fraction from the extrasynaptic fraction (Chiu et al., 2019). Therefore, multiple phosphorylation sites and mechanisms can modify GluN2B-containing NMDAR function. Spinophilin has been shown to decrease the activity of both NMDARs and another class of ionotropic glutamate receptors, the α-amino-5-mehtyl-4-isoxazolepropionic acid receptors (AMPARs) (Allen et al., 2006; Feng et al., 2000); however, the mechanisms by which spinophilin decreases NMDAR activity is unclear. Recently, we found that PP1 can associate with the GluN2B-subunit of the NMDAR and dephosphorylate GluN2B at Ser-1284 (Salek, Edler, McBride, & Baucum, 2019). Moreover, we found that the major synaptic PP1-tageting subunit, spinophilin, limits PP1 binding to GluN2B and promotes Ser-1284 phosphorylation (Salek et al., 2019); however, functional and downstream implications of spinophilin-dependent regulation of GluN2B-containing NMDARs is lacking.
Herein, we report that phosphorylation at the spinophilin sensitive GluN2B site, Ser-1284, promotes GluN2B function. GluN2B function can be regulated by multiple changes: specifically, expression of the receptor at the surface membrane or the amount of calcium influx per individual receptor (e.g. channel conductance). We found that spinophilin decreases GluN2B surface expression independent of its ability to promote Ser-1284 phosphorylation. Suggesting both Ser-1284 dependent and independent regulation of GluN2B-containing NDMAR function. Moreover, in hippocampal slices, we observed a decrease in GluN2B expression in a membrane associated, non-postsynaptic density (PSD) fraction in spinophilin KO compared to WT mice. While spinophilin has multiple actions on GluN2B, loss of spinophilin enhances GluN2B surface expression in hippocampal slices and increases caspase-3 cleavage in hippocampal neuron cultures, suggesting spinophilin may normally act to limit caspase-3 cleavage and downstream apoptosis.
Materials and Methods
Reagents
All custom materials will be shared upon reasonable request. Experiments were approved by the institutional biosafety committee (IBC-1594 and IN-1000).
cDNAs:
Expression vectors used in this study including human WT and phenylalanine (phe:F) to alananine (ala:A) (F451A) mutant spinophilin and the C-terminal tail of GluN2B, were previously described (Hiday et al., 2017; Salek et al., 2019). Human, full-length GluN2B (BC113618; Transomic Technologies, Huntsville, AL, USA) or mouse GluN1 cDNA (BC039157; Transomic Techologies) were shuttled into an expression vector with an N-terminal myc or V5 tag, respectively. GCaMP6s expression vector was obtained from Addgene (#40753, Watertown, MA, USA).
Transfection Reagent:
Polyjet (SignaGen Laboratories, Rockville, MD, USA) was used for transfections. GluN2B mutagenesis was performed using previously described approaches (Salek et al., 2019) and vectors were sequence verified (Genewiz Inc, South Plainfield, NJ, USA) for the mutations. Any cDNAs will be shared upon request.
Antibodies:
Antibodies used for IPs and/or primary blotting are listed in Table S1.
Other reagents:
D-AP5 (D-145, Alomone, Jerusalem, Israel) or (14539, Cayman Chemicals, Ann Arbor, MI, USA), BSA (A9647–100G, Sigma-Aldrich, St Louis, MO, USA), Leibovitz’s L-15 media ( 21083027, Gibco by Life Technologies, ThermoFisher Scientific, Waltham, MA, USA), Papain (P4762–500MG, Sigma-Aldrich), Modified Eagle’s Medium (MEM) (51200038, Gibco by Life Technologies, ThermoFisher Scientific), Fetal Bovine Serum (FBS) (16140063, Gibco by Life Technologies, ThermoFisher Scientific), Horse serum (26050070, Gibco by Life Technologies, ThermoFisher Scientific), L-Glutamine (35050–061, Gibco by Life Technologies, ThermoFisher Scientific), Penicillin/Streptomycin (Pen/Strep) (15140–122, Gibco by Life Technologies, ThermoFisher Scientific), Glucose (G5767, Sigma Aldrich), Insulin/Selenite/Transferrin (IST) (I1884, Sigma-Aldrich), Neurobasal Media (12349015, Gibco by Life Technologies, ThermoFisher Scientific), B27 Supplement (17504044, Gibco by Life Technologies, ThermoFisher Scientific), Gentamycin reagent (15750–060, Gibco by Life Technologies, ThermoFisher Scientific). Sulfo-NHS-SS-Biotin (325143-98-4, A8005, APExBIO Technology LLC, Houston, Texas, USA), Neutravidin beads (29201, ThermoFisher Scientific), Protease inhibitor cocktail (Thermo-Fisher Scientific or Bimake, Houston, TX, USA), Glutamate (G2834, L-Glutamic acid, monosodium, Salt monohydrate, 98%, Molecular weight:187.13 (GA)), 12 mm coverslips (1254582, ThermoFisher Scientific), and Cytosine β-D-arabinofuranoside (Ara-C) (C1768, Sigma-Aldrich), Ponceau S (P3504, Sigma-Aldrich), Revert 520 protein stain (926–10011, Li-Cor Biosciences, Lincoln, NE).
All other utilized reagents were of highest purity obtained from ThermoFisher Scientific, Sigma-Aldrich, or Gibco.
Animals
Experiments were approved by the School of Science Institutional Animal Care and Use Committee (SC270R, SC310R) and performed in accordance with the Guide for the Care and Use of Laboratory Animals and under the oversight of Indiana University-Purdue University, Indianapolis (IUPUI). Both male and female mice were used and, as they were below the age of sexual maturity, data from both sexes were pooled together. Animals were provided food and water ad libitum. Mice were maintained on a normal 12-hour light (7 am - 7 pm) / dark (7 pm - 7 am) cycle. Spinophilin KO mice were initially purchased from Jackson Laboratories (Bar Harbor, ME, USA; Stock #018609; RRID: MMRRC_049172-UCD) and a breeding colony has been maintained at IUPUI. Male or female, WT, C57Bl6, (Jackson laboratories) or spinophilin knockout mouse brains were dissected at Postnatal day 28–32 (P28). Animals were group housed and WT and KO littermates were used (WT and KO animals were from heterozygote x heterozygote breeding pairs). Animals were weaned ~ P21. For generation of neuronal cultures, mice were weaned at P0. For biochemical analyses and generation of neuronal cultures, animals were euthanized by decapitation without anesthesia.
Mammalian protein expression
Neuro2a cells were used for mammalian protein expression. Cells were purchased and split into passage 9 and frozen down. The cells were used up to passage 22. After thawing, cells were incubated with MEM recovery media containing 20% FBS, 1% Pen/strep and 1% Sodium Pyruvate. The cell culture and incubation after recovery was performed in MEM containing: 10% FBS, 1% Pen/Strep, and 1% Sodium Pyruvate. 6- and 12-well plates were placed in a tissue culture incubator (Panasonic Healthcare; Secaucus, NJ, USA) at 37°C and 5% CO2. Cells were counted and the density was adjusted to 70,000 – 100,000 cells/mL. 6-well and 12-well plates received 2 mL or 1 mL, respectively, of cell containing media. Cells were transfected the next day at approximately 50–60% confluency. Confluency was measured by estimating cell coverage on the bottom of the flask. For 6-well plates, DNA (0.5–2 μg per DNA vector) was added to 250 μL of serum-free MEM in a 1.7 mL microcentrifuge tube. In a separate microfuge tube, transfection reagent was added to 250 μL of serum-free MEM. Polyjet was used in a 3:1 volume: mass ratio (e.g. 9 μL of Polyjet was used with 3 μg DNA). For each well, DNA concentrations were equalized using an empty DNA vector, so that each condition in the same experiment had an equal mass of DNA and transfection reagent (all the volumes were cut in half for 12-well plate studies). The Polyjet containing MEM was then added to the tube containing DNA and incubated at room temperature for 15 min. The DNA-Polyjet mixture was then added to each well very slowly as the plate was being gently shaken on a horizontal axis to mix the DNA mixture with the media. The wells transfected with full-length GluN1 and full-length GluN2B expression vectors were then treated with 0.25 μg/mL of AP5. 3 μg of AP5 was dissolved in 600 μL of MEM. 100 μL of this mixture was then added to each well of a 6-well plate containing 2 mL of cell media. The cells were then placed in the incubator overnight and were processed the next day. If the cells were cultured for imaging, they were imaged the next day prior to lysis. If not, the cells were processed the next day as follows: MEM was removed, and cells were washed with 2 mL of cold phosphate-buffered saline (PBS). PBS was aspirated off and cells were lysed in 0.75 mL KCl lysis buffer (150 mM KCl, 1 mM dithiothreitol (DTT), 2 mM EDTA, 50 mM Tris-HCl pH 7.5, 1% (v/v) Triton X-100, 20 mM β-glycerophosphate, 20 mM sodium fluoride, 10 mM sodium pyrophosphate, 20 mM sodium orthovanadate, 1X protease inhibitor cocktail) then transferred into 2 mL microcentrifuge tubes. Cells were sonicated at 25% amplitude for 15 s at 4°C using a probe sonicator (Thermo-Fisher Scientific) and centrifuged (4°C for 10 min at 16,900 × g).
Calcium imaging in Neuro2a cells
To image the changes in intracellular calcium levels, Neuro2a cells were plated in 6 or 12-well plates as noted in Figure legends and were transfected with 0.5 μg each of V5-GluN1, Myc-GluN2B, the genetically-encoded calcium indicator protein, GcAMP6s, a modified green-fluorescent protein that only fluoresces in the presence of calcium (Chen et al., 2013), and/or 1 μg WT or F451A mutant HA-spinophilin. In a normal neuronal context, NMDARs require glutamate and glycine binding as well as depolarization of the neuron which leads to release of the magnesium ion that is found within the channel. Following the binding of agonist (glutamate) and co-agonist (glycine), along with neuronal depolarization, calcium enters the neuron. However, this is not the same in a heterologous cell line such as Neuro2A cells. While agonist and co-agonist binding is required (normal cellular media contain these) as cell lines are not hyperpolarized there is no magnesium block. Therefore, each well received a final concentration of 2.5 μg/mL AP5 after the transfection to limit calcium influx. The next day, AP5-containing MEM was aspirated off and replaced with 1 mL of calcium-free 1X PBS at room temperature. The cells were immediately placed in the Cytation 3 (Biotek, Winooski, Vermont, U.S.A.) cell imaging multi-mode reader. The reader was temperature and gas controlled and was set at 35–37°C and 5% CO2. Changes in fluorescence were measured for 5 minutes at 9 s intervals, resulting in a total of 34 readings. To measure fluorescence, the excitation and emission wavelengths were set at 488 nm and 528 nm, respectively, reading from the bottom of the plate. For conditions where cells were plated in 6-well plates, a user defined gain of 10 was employed in the software for data collection. This 5-minute incubation with calcium-free PBS, was used to minimize background fluorescence by decreasing intracellular calcium and concomitant GCaMP6s fluorescence. After the incubation, each well received CaCl2 (3–6 mM final concentration) via a built-in dispenser and briefly received an orbital shake for 2 s to uniformly mix the CaCl2 with the media. The plate was read at the same wavelengths mentioned above for another 5 minutes. After the reading was completed, the media was aspirated from the cells. The cells were then lysed and processed as above in 350 μL RIPA/PI lysis buffer (1 mM EDTA, 150 mM NaCl, 20 mM Tris-HCl, 1X protease inhibitor cocktail, 20 mM β- glycerophosphate, 20 mM sodium fluoride, 10 mM sodium pyrophosphate, 20 mM sodium orthovanadate, 0.01% NP-40, 0.01% deoxycholate). All the fluorescence reading values at each time point were normalized back to the baseline by subtracting each value from the fluorescence value at the 0-time point of the corresponding well. The data was then used to plot a graph and the area under the curve (AUC) was quantified.
Biotinylation in Neuro2a cells
Neuro2a cell biotinylation was based on a previously published protocol (Cao et al., 2007) and optimized for a 6-well cell culture plate. This procedure uses a membrane impermeant biotin to label all surface expressed proteins which can then be isolated with Neutravidin beads to separate out a membrane fraction. Neuro2a cells were washed 3 times in 1 mL of “B buffer” (0.5 mM CaCl2, 0.5 mM MgCl2-6H2O in 1X PBS). Following the wash, 1 mL of 0.5 mg/mL Sulfo-NHS-SS-Biotin in B buffer was added to each well and allowed to incubate at room temperature for 5 minutes. The free biotin was then quenched by washing the cells twice with 1 mL of biotin quenching buffer (100 mM Glycine in B buffer). Following the quenching step, the cells were lysed in 750 μL of RIPA/PI buffer. The samples were then centrifuged at 14,000 × g at 4°C for 15 minutes. To create the input, 150 μL of the lysate supernatant was mixed with 50 μL of 4X SDS containing sample buffer with DTT. 500 μL of the supernatant was mixed with 40 μL of a 50% slurry of Neutravidin beads and incubated with rotating at 4°C overnight. The next day, the beads were washed 3X by centrifuging the samples at 2000 × g for 1 minute and replacing the supernatant with 500 μL RIPA/PI buffer and allowing to rock for 5 minutes at 4°C. Following the last wash, 60 μL of 2X SDS containing sample buffer with DTT was added to the beads. The beads were thoroughly vortexed and placed at −20°C for western blotting.
Biotinylation in brain slices
The protocol used for brain slice biotinylation is modified from a previous study (Gabriel, Wu, & Melikian, 2014). Room temperature, 1X artificial cerebrospinal fluid (aCSF; 125 mM NaCl, 2.5 mM KCl, 1.2 mM NaH2PO4, 1.2 mM MgCl2-6H2O, 2.4 mM CaCl2, 26 mM NaHCO3, 11 mM Glucose) and ice-cold high sucrose solution (HSS) (250 mM Sucrose, 2.5 mM KCl, 1.2 mM NaH2PO4, 2.4 mM CaCl2, 26 mM NaHCO3, 11mM Glucose) were prepared and bubbled with carbogen (95% O2 and 5% CO2) for a minimum of 20 minutes. Animals were decapitated and the brains were dissected on ice. The brains were quickly transferred to ice-cold HSS and 300 μM slices were generated using a VT1200-S vibrating microtome (Leica Biosystems, Buffalo Grove, IL). Four hippocampi containing whole brain slices were generated from each brain. The slices were then transferred into a slice chamber and were recovered at 31°C in circulating, carbogenated, 1x aCSF for 40 minutes. The following procedures were performed on ice unless otherwise stated. After the 40-minute recovery, the slices were transferred into an ice-cold, 24-well plate and were incubated with 750 μL of 1 mg/mL of Sulfo-NHS-SS-Biotin dissolved in ice-cold carbogenated 1X aCSF for 45 minutes followed by a 3X wash with 750 μL of ice-cold 1X aCSF. After the last wash, the slices were incubated with 750 μL of ice-cold 1X aCSF for 10 minutes followed by 3 washes with 750 μL of ice-cold biotin quenching buffer (100 mM Glycine in 1X aCSF). Following the last wash, the slices were incubated with 750 μL of ice-cold biotin quenching buffer for 25 mins. The slices were then washed 3 times with ice-cold 1X aCSF. After the last wash, the hippocampi were dissected from the slices and were transferred into a homogenizer containing 1200 μL of RIPA/PI buffer. The slices were homogenized using 18–20 up-and-down movements of a pestle in a 2-mL tight-fitting glass homogenizer. The homogenate was then sonicated once for 15 seconds at 25% amplitude followed by centrifugation for 15 minutes at 14,000 × g at 4°C. 150 μL of the lysate supernatant was mixed with 50 μL of 4X SDS sample buffer and used as the input. 500 μL of the supernatant was mixed with 60 μL of pre-washed Neutravidin beads and rotated at 4°C overnight to pulldown (PD) biotinylated proteins. The next day, the PD samples were washed three times using 500 μL of ice-cold RIPA/PI buffer. The samples were centrifuged for 1 minute at 2,000 × g, then the supernatant was aspirated off and replaced with 500 μL of ice-cold RIPA/PI. The tubes were then replaced on the rotator and were allowed to rotate at 4°C for 5 minutes. This wash procedure was repeated 3 times. Following the last wash, the supernatant was removed and 60 μL of 2X SDS sample buffer+DTT was added to the beads, the tubes were briefly vortexed and placed at −20°C and saved for SDS-PAGE. The inputs and biotinylated PDs were separated by SDS-PAGE and immunoblotted. The intensity of the PD band of the protein of interest was divided by the intensity of the input band of the same protein, to normalize for any differences in protein expression. Finally, the ratio for each protein of interest in the KO samples was additionally normalized to the WT sample on the same gel.
Subcellular fractionation
Male and female P28-P32 Spinophilin WT and KO mice were decapitated without anesthesia, brains were removed, the hippocampi were rapidly dissected, frozen in liquid nitrogen, and stored at −80 °C. The two whole frozen mouse hippocampi from each animal were pooled and fractionated as previously described (Baucum, Brown, & Colbran, 2013; Gustin et al., 2011) and shown in Figure S1. The homogenization buffer was an isotonic buffer (150 mM KCl, 50 mM Tris-HCl, 1 mM DTT, 2 mM EDTA, 1X protease cocktail, 20 mM sodium fluoride, 20 mM sodium orhtovanadate, 20 mM β-glycerophosphate, 20mM sodium pyrophosphate) either without detergent (initial homogenization) or containing 1 % Triton X-100 (for resuspending the S1 pellet), or 1% Triton X-100, 1% sodium deoxycholate (for resuspending the S2 pellet to generate the S3/P3 “PSD” fraction) as outlined in Figure S1. Immunoblotting was performed as previously described and the intensity of the band of the protein of interest was divided by the total amount of protein in the sample measured by Ponceau S stain using ImageJ. This value in the KOs was divided by that of the WT in the same trial to generate a normalized ratio.
Hippocampal primary neuronal cultures
Hippocampal primary neurons were dissociated and cultured using a previously published protocol (Bansal et al., 2019). In short, hippocampi were dissected from P0 mice in harvest media (0.02% BSA in Leibovitz’s L-15 media). The hippocampi were then transferred to a 15 mL conical containing 0.5 mL dissociation media (0.038% papain in previously made in 0.02% BSA/L15), carbogenated, recovered in a 37°C water bath for 10 minutes, incubated in M5–5 media (5% FBS, 5% Horse serum, 0.2% L-Glutamine, 1% Pen/Strep, 1% Glucose, 0.25% IST in MEM), and dissociated by pipetting 30 times using three different sizes of sterile, fire-polished, pasture pipets. After each round of pipetting the supernatant containing the dissociated cells was collected and pooled in a sterile 15 mL conical centrifuge tube. After the last round, the supernatant was centrifuged at 800 × g for 5 minutes at room temperature. The supernatant was removed, and the pellet was dissolved in 3 mL of M5–5 media. Then, 1 mL of the cell mixture was added to each well of a 24-well plate containing a 12 mm coverslip previously coated with 0.5 mg/mL Poly-Lysine and placed in 5% CO2, 37°C cell culture incubator. After 48 hours, 0.5 mL of the M5–5 media was replaced with 1 mL of B27 supplement media (2% B27 Supplement, 0.25% L-Glutamine, 0.25% IST, 0.1% Gentamycin reagent and 15 μL cytosin arabinoside (Ara-C) in Neurobasal media, mixed and sterile filtered using 0.2 μm filter syringe). The plate was then placed back in the incubator until the day of the experiment (14–24 days in vitro; DIV).
Hippocampal neuron stress paradigm
Primary hippocampal cultures were assayed between 14–24 DIV. On the test day, the culture media was collected from the wells into a sterile 15 ml conical centrifuge tube to generate the conditioned Neurobasal (cNB) media. Each of the spinophilin WT and KO wells received 1 mL of fresh neurobasal media alone, media with 100 μM glutamate, or media with 100 μM glutamate + 2.5 μg/ml AP5. The cells were incubated with the media for 30 minutes in a 37°C tissue culture incubator. During incubation, the cNB media was sterile filtered using 0.2 μm filters and the volume was adjusted by adding fresh Neurobasal media (no more than 10% of the total media volume) and placed in a 37°C water bath. After 30 minutes, the vehicle, glutamate, or glutamate +AP5-containing media was removed from the wells and replaced with 1.5 mL cNB media and incubated in a cell culture incubator for 90 minutes to recover. Following the recovery step, the neurons were lysed and processed as follows: the media was removed from the wells and 300 μL of ice cold low ionic lysis buffer (2 mM Tris pH 7.5, 2 mM EDTA, 1 mM DTT, 1x Protease Inhibitor, 20 mM sodium fluoride, 20 mM sodium orthovanadate, 10 mM sodium pyrophosphate, 20 mM β-glycerophosphate, 1% Triton) was added to the cells. The cells were lysed by trituration until all the cells were detached from the bottom of the wells. The lysate was then transferred into 1.7 mL microcentrifuge tubes and sonicated for 15 seconds at 25% amplitude with a probe sonicator followed by centrifugation at 4°C for 15 minutes at 14,000 × g. 150 μL of the lysate supernatant was transferred into a new tube and mixed with 4X SDS sample buffer containing DTT. The samples were then placed at −20°C until processed.
Streptavidin pulldowns and Western Blotting
Cell lysate inputs and/or PD samples were used for western blotting. All samples were heated at 70°C for 10 min prior to loading on the gel. PD samples were briefly vortexed and centrifuged at 1000 × g for 2 minutes to precipitate the Neutravidin agarose beads and separate them from the suspension prior to loading on the gel. 10–35 μL of input or 20–30 μL of PD sample were loaded onto a 1.00 mm hand-cast 10% polyacrylamide gel. Gel electrophoresis, ponceau staining, and immunoblotting was performed as previously described (Salek et al., 2019) using either an Odyssey or Odyssey M (Li-Cor Biosciences). Revert staining was performed following manufacturer’s instructions and imaged on the Odyssey M in the 520 channel as previously described. We have previously shown linearity of fluorescence intensity using these conditions for multiple proteins and antibody pairs (Edler et al., 2018; C. W. Morris, Watkins, Salek, Edler, & Baucum, 2018).
Statistical inference and data plotting
All statistical analyses were performed in Graphpad Prism (ver 9). The tests used for statistical analysis were One-sample Student’s T-test, One-way ANOVA, or Two-way ANOVA. For multiple comparison analysis, Tukey or Sidak tests were used depending on the experimental design. ANOVA values and specific post-hoc tests are designated in the figure legends. Individual data points are indicated in all graphs (except time-course GcAMP6 studies) with mean and standard error of the mean (SEM) shown. For slice biotinylation studies, 2 samples were removed from the analysis due to the presence of smeary bands on the immunoblots and difficulties with quantitation. An additional two animals were not evaluated due to them being blind at the time of sacrifice. For fractionation studies, 1 data point was removed due to being a significant outlier by Grubb’s test.
RESULTS
Spinophilin decreases NMDAR-dependent calcium influx in Neuro2a cells independent of Ser-1284 phosphorylation.
The mechanisms by which spinophilin stabilizes NMDAR currents by preventing current rundown, which is a decrease in measured current over time, are unclear (Allen et al., 2006; Feng et al., 2000). To determine how spinophilin impacts GluN2B-containing NMDARs, specifically, we transfected a Neuro2A heterologous cell line with functional, GluN2B-containing NMDARs, spinophilin, and a calcium reporter (GcAMP6s) (Figures 1A and 1B). This cell line has been previously shown to contain ionotropic glutamate receptors such as GluA1 and GluA2 and trafficking machinery (Maekawa, Tsuboi, Fukuda, & Pellerin, 2009; Priya, Johar, Nair, & Wong-Riley, 2014). To limit excessive calcium influx that leads to death upon transfection of a functional channel containing GluN1 and GluN2 subunits (Anegawa, Lynch, Verdoorn, & Pritchett, 1995; Collett & Collingridge, 2004), we maintained the competitive NMDAR antagonist, AP5, in the culture media. We observed a significant decrease in GCaMP6s fluorescence in the presence, compared to the absence, of overexpressed, WT spinophilin, suggesting that spinophilin decreases calcium influx through GluN2B-containing NMDARs (Figure 1C1, 1C2). As a control, we transfected cells with only GCaMP6s in the presence or absence of spinophilin, but not NMDARs and we observed no significant increase in fluorescence upon addition of CaCl2 when the NMDAR was not transfected compared to the presence of the NMDAR. This suggests that our observation in Figure 1C is NMDAR dependent. To ensure that the effect is not due to autofluorescence, NMDAR subunits were expressed with and without spinophilin in the absence of GCaMP6s overexpression. The results show no significant change in the fluorescence level in these conditions suggesting that the observed result is not due to changes in autofluorescence (Figure 1C). As an additional control, the cells were treated with CaCl2 or vehicle. Consistent with a specific effect of extracellular calcium, our results demonstrate that the changes in the fluorescence level are solely present upon addition of extracellular CaCl2 (Figure S2A plotted with data from 1C). Moreover, immediately upon washout of AP5, when no calcium is added to the cells, we actually observe a decrease in GcAMP fluorescence, further suggesting that the increased GcAMP6s changes is due to influx of extracellular calcium (Figure S2B). However, we cannot rule out that extracellular calcium influx via NMDARs is the only source of calcium. For instance, extracellular calcium influx could trigger release of calcium from intracellular endoplasmic reticulum stores. Together, these results indicate that spinophilin significantly decreases calcium influx through GluN2B-containing NMDARs.
Figure 1. Spinophilin decreases NMDAR-dependent calcium influx in Neuro2a cells.
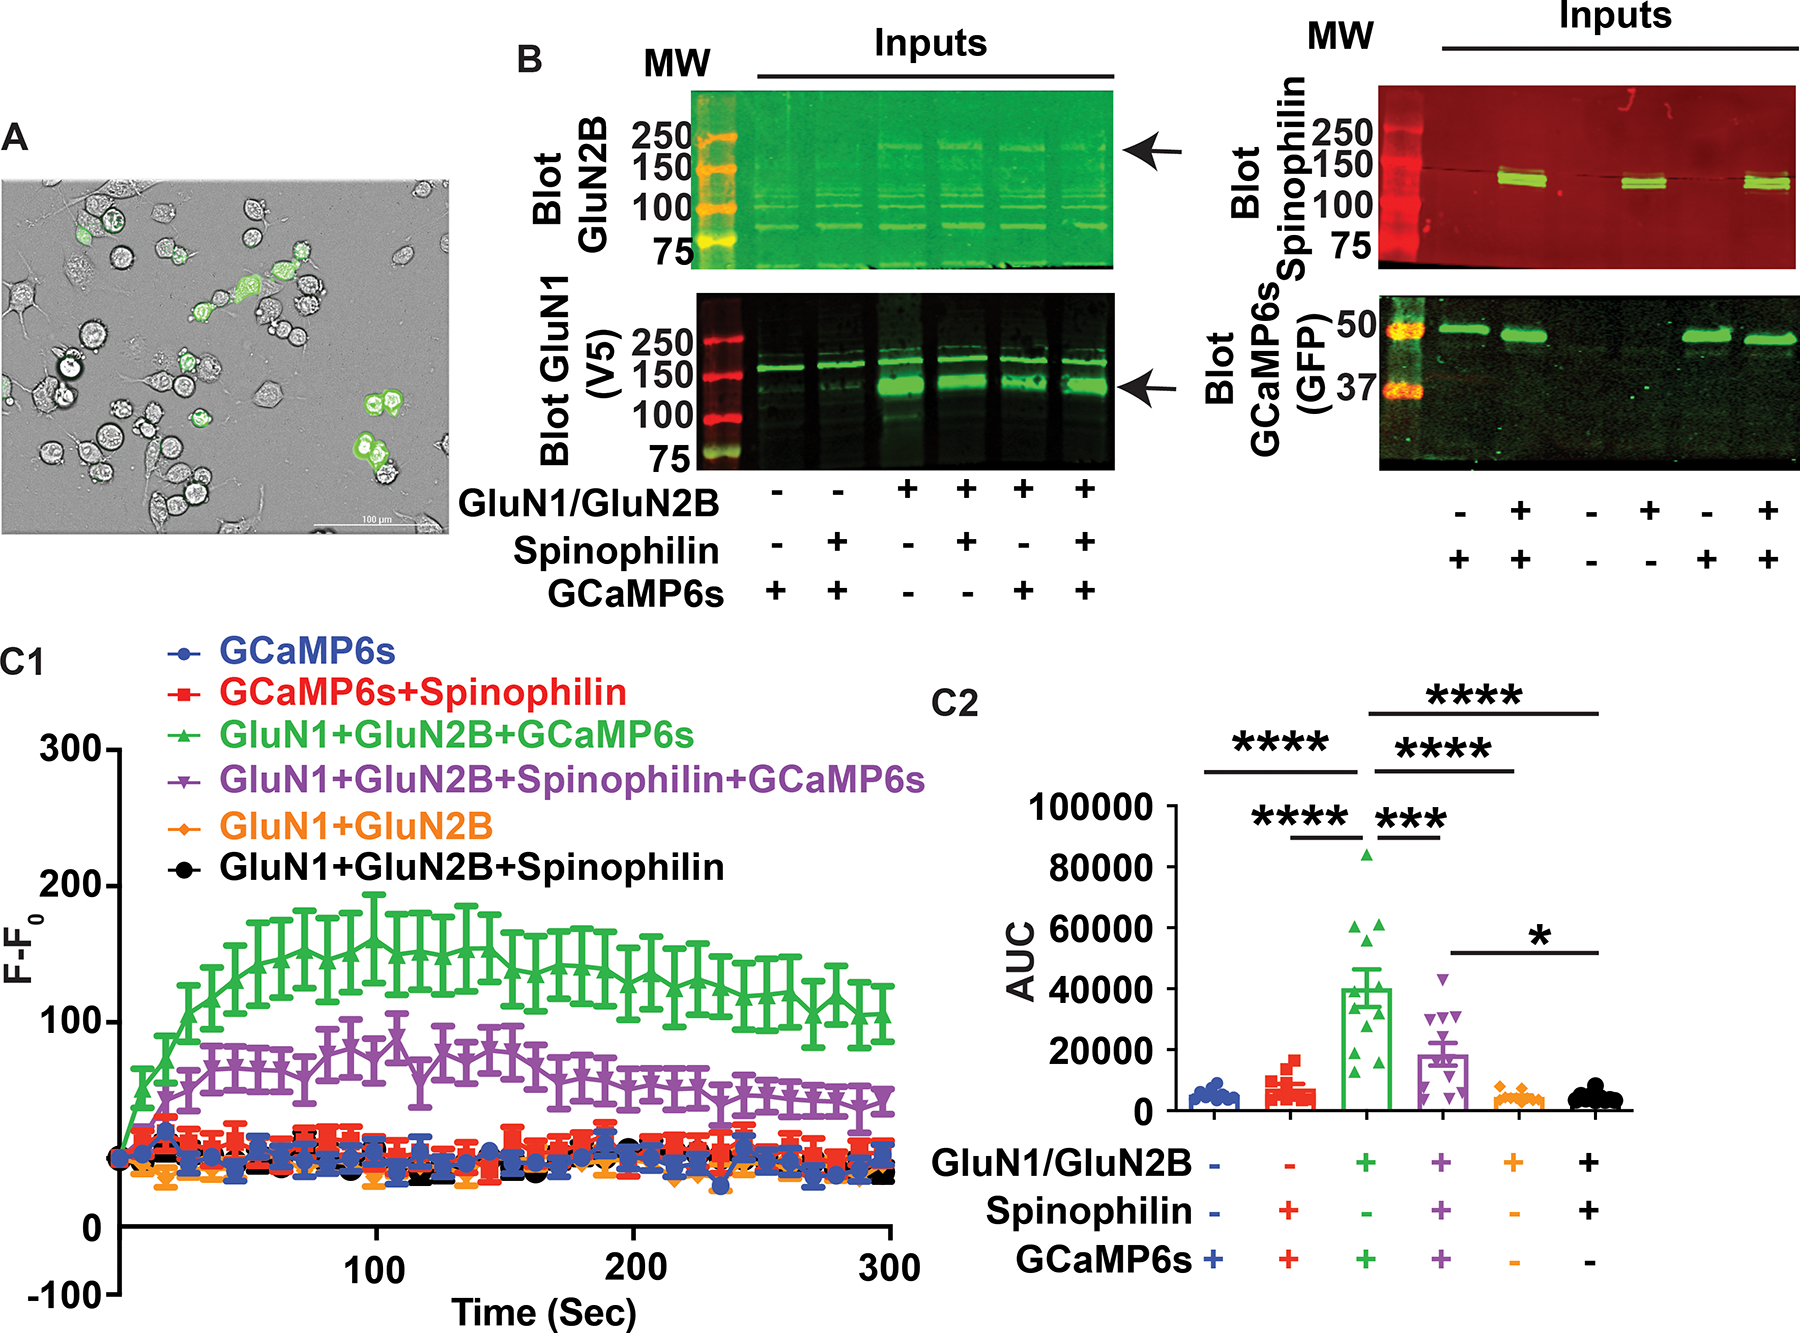
A: Brightfield and fluorescence imaging of Neuro2a cells transfected with the fluorescent calcium indicator protein, GCaMP6s, along with GluN1 and GluN2B subunits of the N-methyl-D-aspartate receptor (NMDAR). B: Representative western blotting results indicating the transfection conditions and efficiency in the Neuro2a cells. C1: The fluorescence intensity at each time point (F) was subtracted from the fluorescence intensity at time zero (F0). This F−F0 value was plotted before, and at 9 second (sec) intervals following, addition of CaCl2 to the transfected Neuro2a cells. C2 Quantified area under the curve (AUC) calculated from data in Figure 1C1 indicating the total changes in the fluorescence level in each condition. No gain amplification was used, and cells were plated in a 12-well plate. n=12 sets of transfections. ANOVA, F (5, 58) = 18.61, P<0.0001. All graphs represent mean±standard error of the mean (SEM); *p<0.05, **P<0.01, ***p < 0.001, ****p<0.0001 post-hoc comparisons. All the other comparisons are nonsignificant.
Next, we investigated whether spinophilin-dependent decreases in calcium influx via GluN2B-containing NMDARs is due to PP1 binding to spinophilin. To study this, we utilized a mutant spinophilin that has the phenylalanine (Phe) at amino acid 451 mutated to an alanine (ala) (F451A) that we and others have shown reduces its binding to PP1 (Guo et al., 2019; Hsieh-Wilson, Allen, Watanabe, Nairn, & Greengard, 1999; C. W. Morris et al., 2018; Ragusa et al., 2010; Salek et al., 2019; Yan et al., 1999). Here, we transfected cells with GluN1, GluN2B, and GCaMP6s in the presence of wildtype (WT) or F451A mutant spinophilin. The change in GCaMP6s fluorescence upon overexpression of F451A mutant spinophilin was similar to the condition with no spinophilin overexpression (Figure 2). This suggests that the spinophilin-dependent changes in calcium influx via GluN2B-containing NMDARs require PP1 binding to spinophilin.
Figure 2. F451A PP1 binding-deficient mutant spinophilin does not impact calcium influx via GluN2B-containing NMDARs in Neuro2a cells.
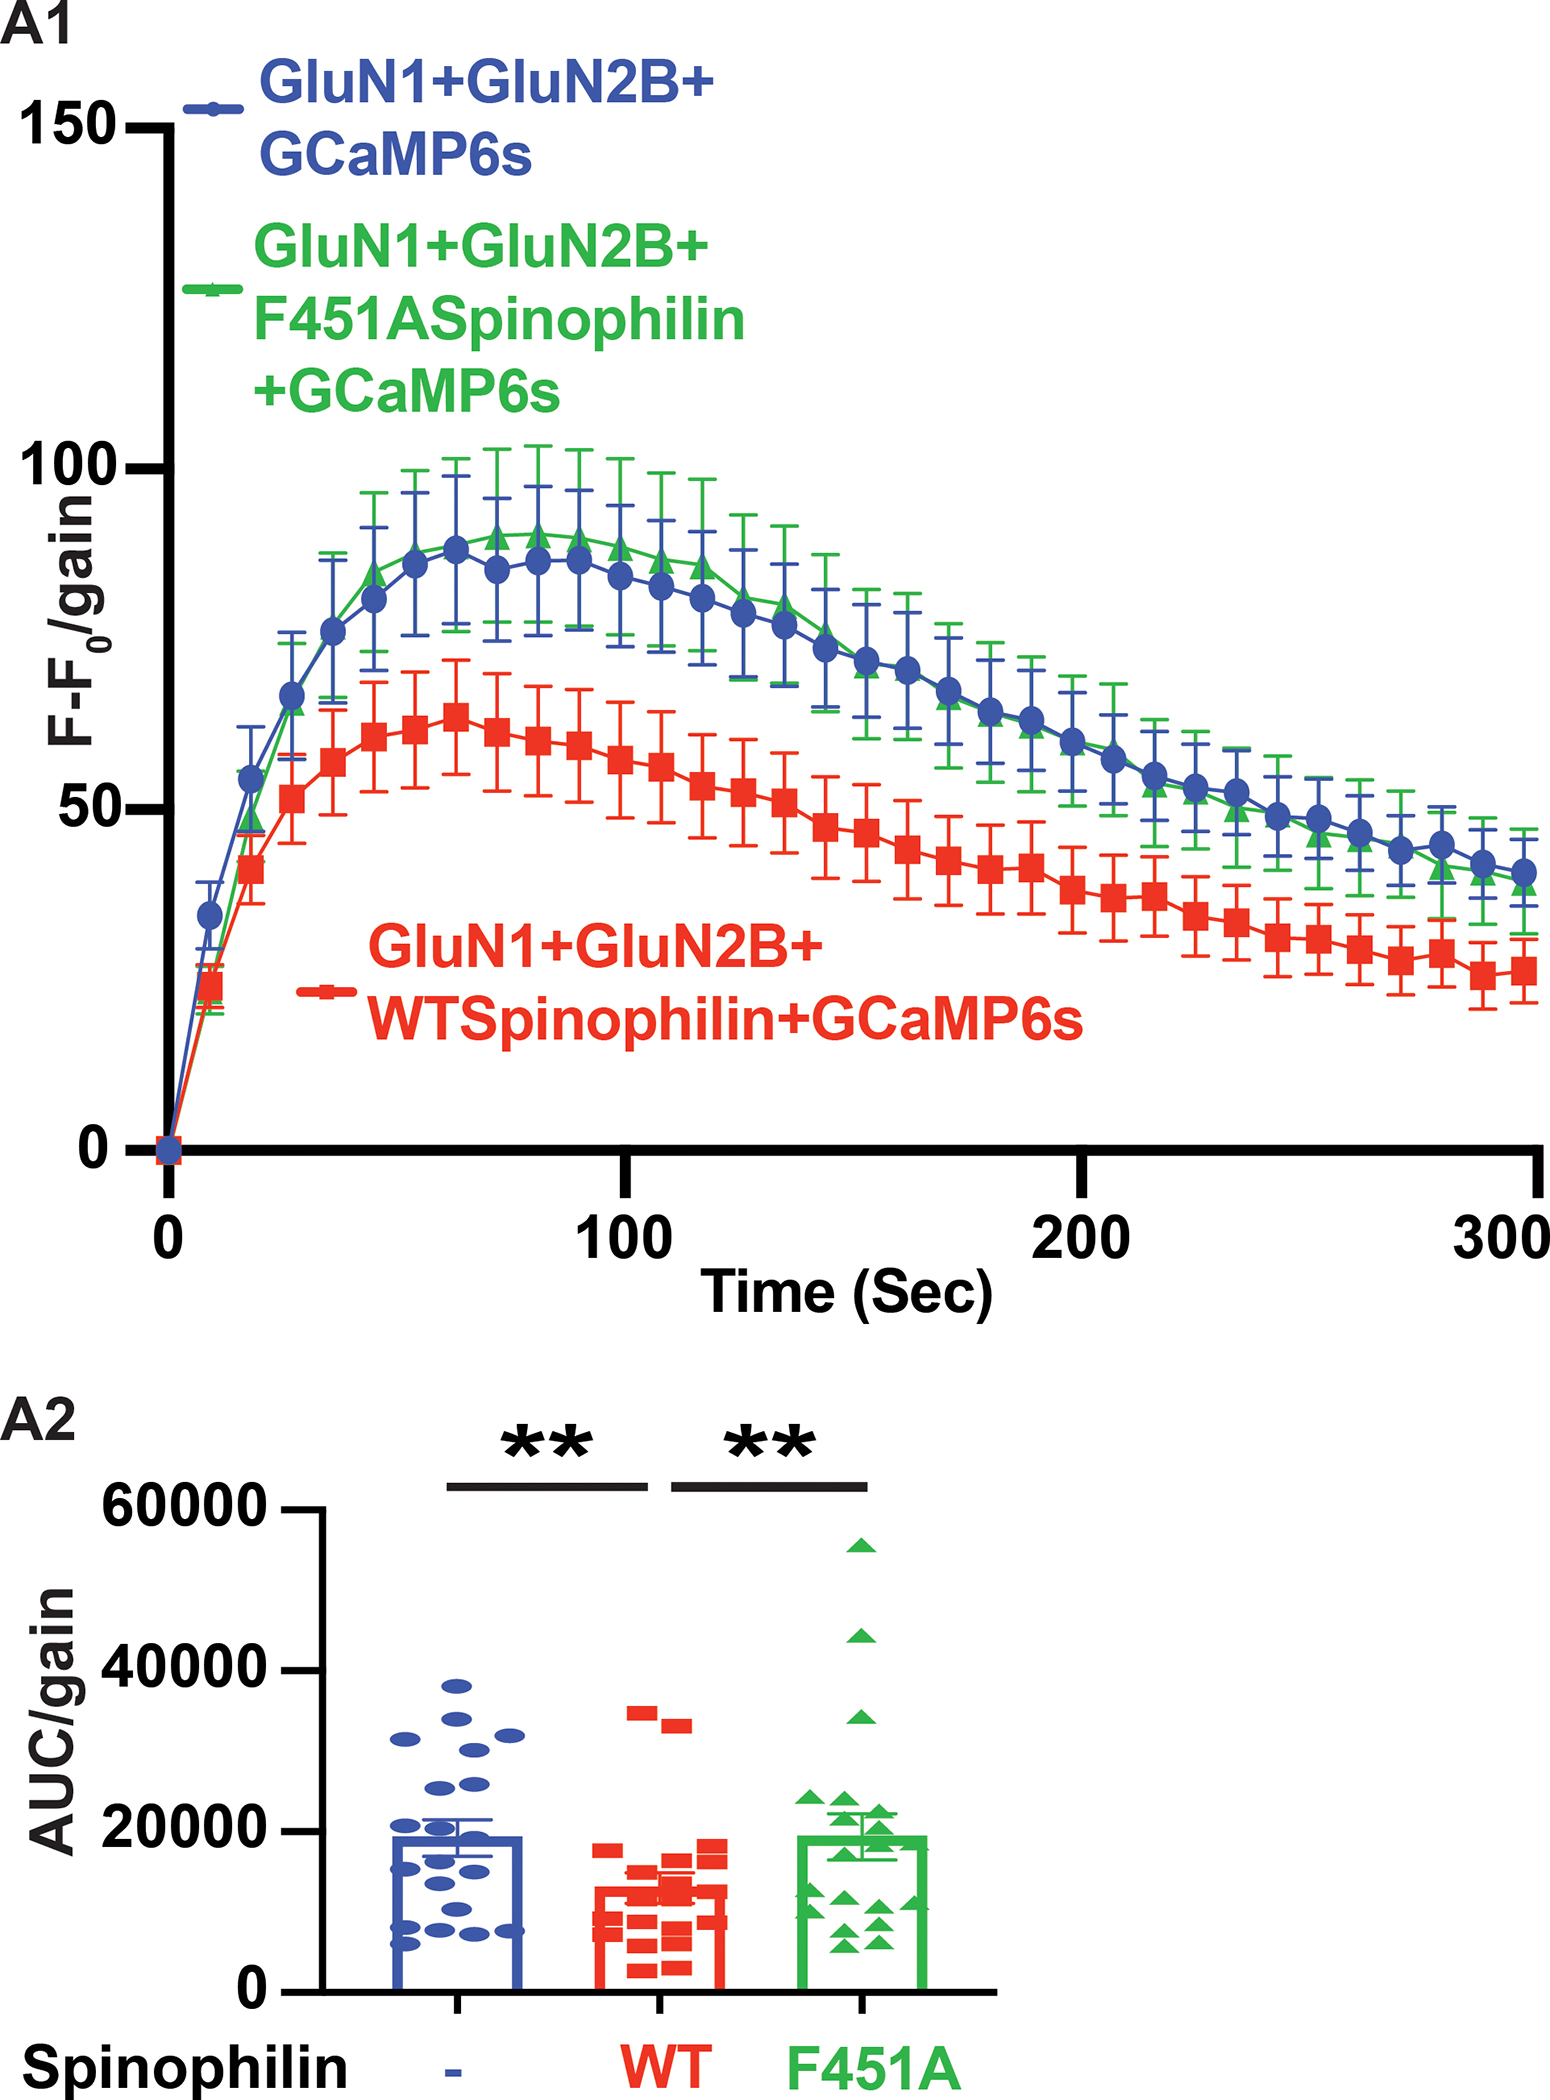
A1: The fluorescence intensity at each time point (F) was subtracted from the fluorescence intensity at time zero (F0). This F−F0 value was divided by the gain and this value was plotted before, and at 9 second (sec) intervals following, addition of CaCl2 to the transfected Neuro2a cells (6-well plate) in the absence of spinophilin or the presence of wildtype (WT) or Phe451Ala (F451A) mutant spinophilin. A2: The quantified area under the curve (AUC) of the traces in Figure 3A1 are plotted indicating the total changes in the fluorescence level in each condition. A user-defined gain of 10 was set for collection of these fluorescence intensities and cells were plated in a 6-well plate. N=20 sets of transfections. A matched (repeated measures) ANOVA was performed to compare samples from the same plate; F (1.372, 26.07) = 5.813; P=0.0154. Tukey Post-hoc tests were performed. All graphs represent mean± standard error of the mean (SEM); * **P<0.01, ***p < 0.001, post-hoc comparisons. All the other comparisons are nonsignificant.
We have previously shown that spinophilin enhances Ser-1284 phosphorylation on the GluN2B subunit of NMDARs by sequestering PP1 from the receptor (Salek et al., 2019). As a result, we were interested in investigating whether spinophilin-dependent phosphorylation of Ser-1284 on GluN2B is responsible for the spinophilin-dependent decrease in calcium influx through the channel. For this purpose, we generated a non-phosphorylateable form of the protein at Ser-1284 by mutating the serine (ser:S) residue to an alanine (ala:A) at this site. Additionally, we generated a mutant containing a charged residue, aspartate (asp:D) that mimics a phosphorylation at this site. We investigated the calcium influx through the mutant isoforms in the presence or absence of WT spinophilin. For this purpose, Neuro2a cells were transfected with GluN1, GCaMP6s, and either WT, S1284A, or S1284D GluN2B point mutants in the presence or absence of WT spinophilin (Figure 3A). In the absence of spinophilin, calcium influx was increased by the S1284D phosphomimetic mutation but unchanged by the S1284A non-phosphorylateable mutation. This suggests that phosphorylation of GluN2B at Ser-1284 increases the amount of calcium in the cell (Figure 3B). However, overexpression of spinophilin in all conditions led to decreases in calcium influx (Figure 3B). Our previous studies found that spinophilin may act to enhance Ser-1284 phosphorylation (Salek et al., 2019); however, this phosphorylation increased calcium in the cytosol (Figure 3B2); therefore, given that spinophilin overexpression decreased calcium levels irrespective of Ser-1284 phosphorylation status, spinophilin is acting to decrease cytosolic calcium through a pathway independent of its ability to regulate Ser-1284 phosphorylation.
Figure 3. Spinophilin-dependent decreases in calcium influx via GluN2B-containing NMDARs in Neuro2a cells is independent of Ser-1284 phosphorylation.
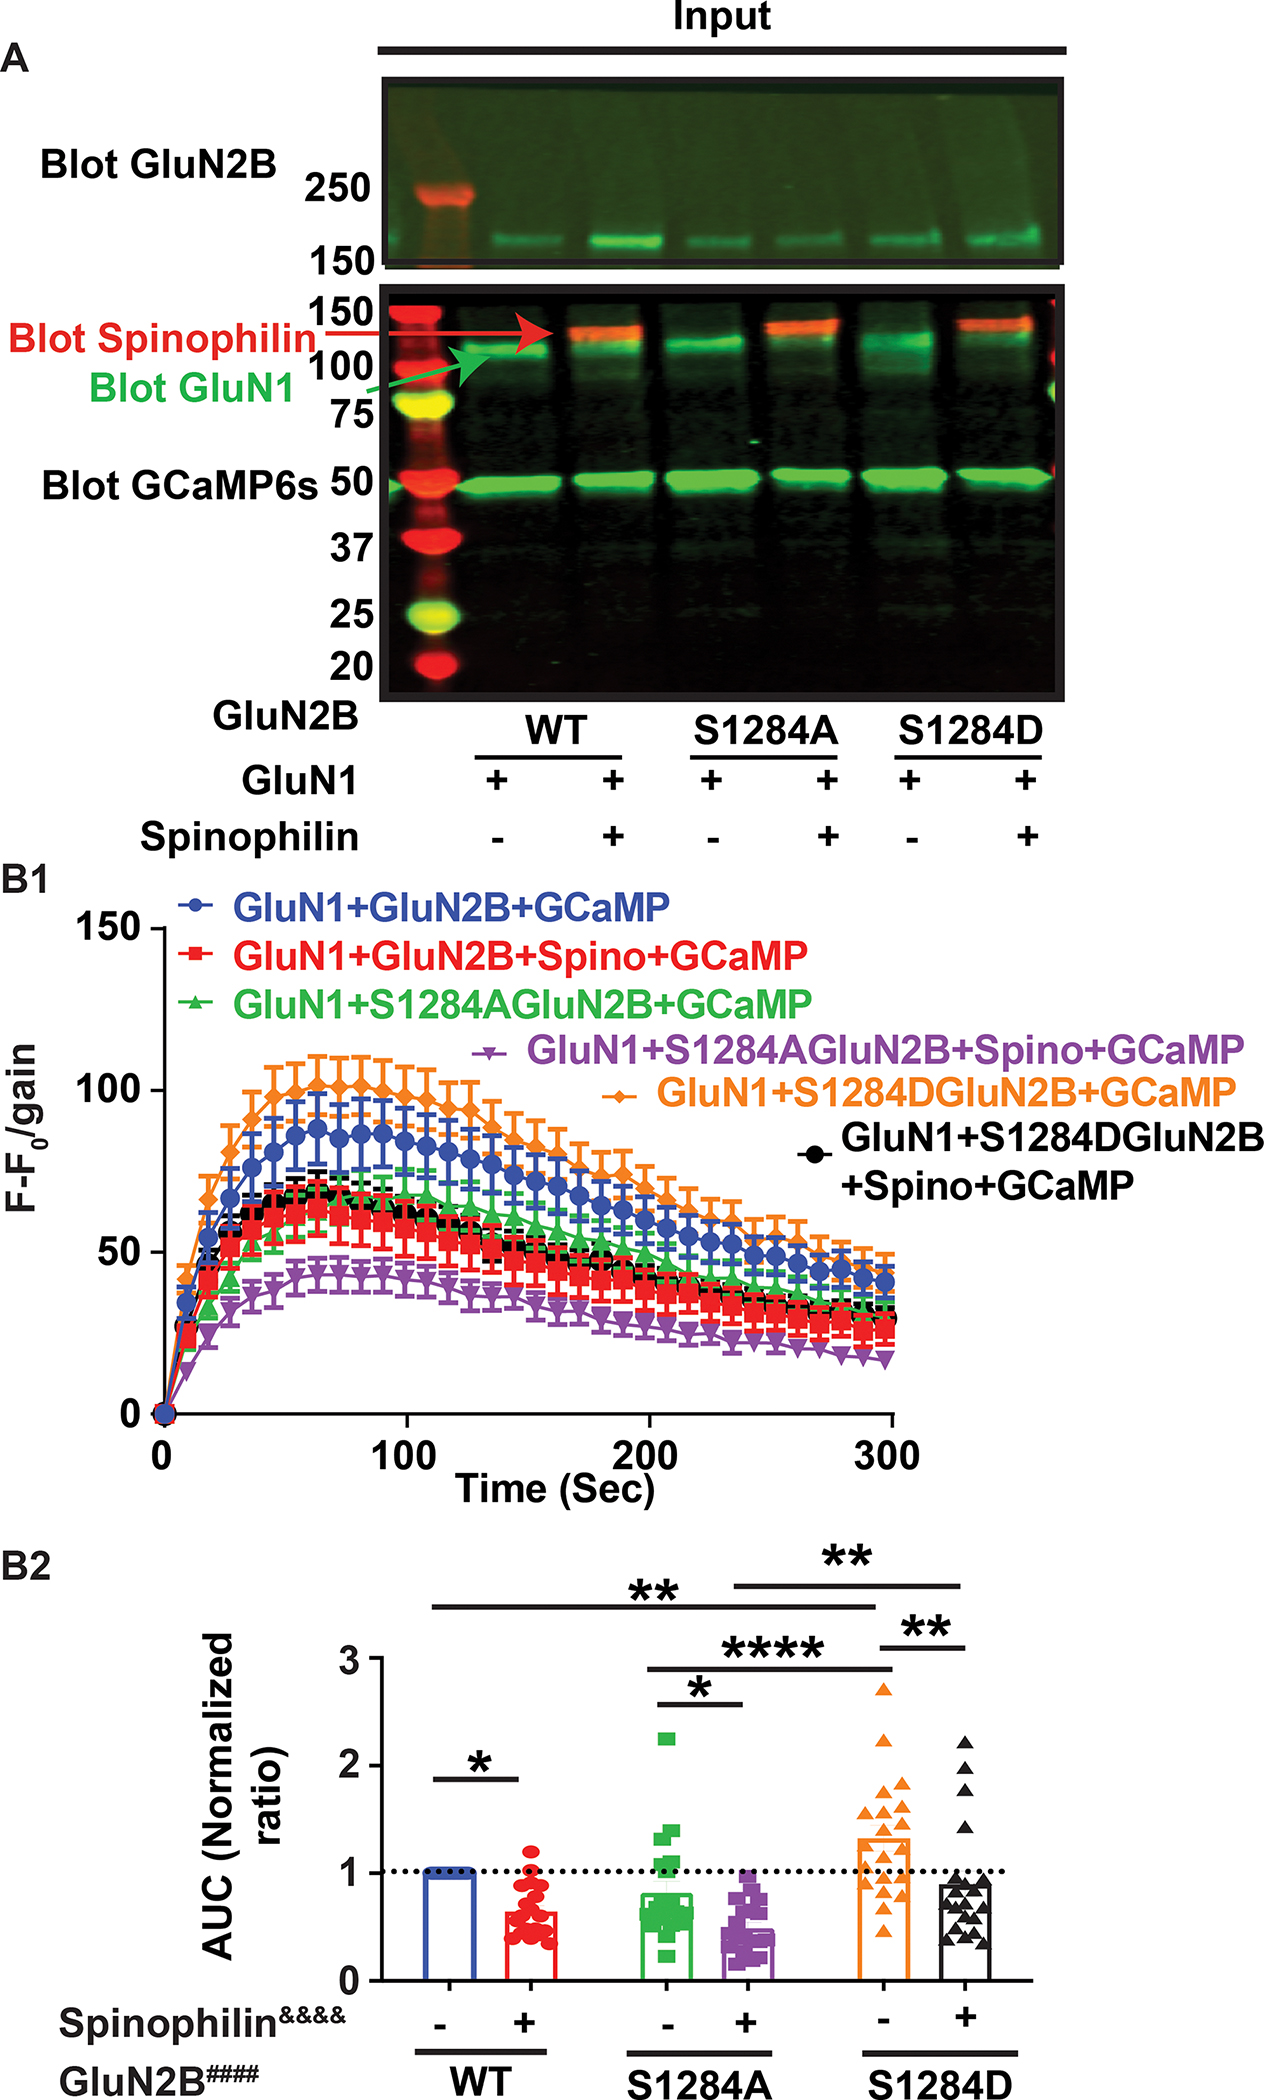
A: Representative western blot indicating the transfection conditions and efficiency in the Neuro2a cells transfected with wildtype (WT), or Ser1284Ala (S1284A) or Ser1284Asp (S1284D) mutants, of the GluN2B subunit of the N-methyl-D-Aspartate receptor (NMDAR) in the presence and absence of WT-spinophilin overexpression. Red arrow highlighting spinophilin expression, green arrow highlighting GluN1 expression. B1: The fluorescence intensity at each time point (F) was subtracted from the fluorescence intensity at time zero (F0). This F−F0 value was divided by the gain and this value was plotted before, and at 9 second (sec) intervals following, addition of CaCl2 to the Neuro2a cells transfected with different genotypes of GluN2B along with GluN1 in the absence and presence of WT-spinophilin. B2: The quantified area under the curve (AUC) of the traces in Figure 4B1 are plotted indicating the total changes in the fluorescence level in each condition. A user-defined gain of 10 was set for collection of these fluorescence intensities and cells were plated in a 6-well plate. N=20 sets of transfections. WT data are normalized and replotted from Figure 2. The normalized ratio of 1 is referenced by a dashed line. Two-Way ANOVA; spinophilin expression (F (1, 111) = 25.92, P<0.0001&&&&); GluN2B mutation (F (2, 111) = 13.65, P<0.0001####), Interaction (F (2, 111) = 0.1553, P=0.8564). Sidak post-hoc test for spinophilin expression and Tukey post-hoc test for GluN2B mutation were performed separately. All graphs represent mean±standard error of the mean (SEM); *p<0.05, **P<0.01, ****p < 0.0001 post-hoc comparisons. All the other comparisons are nonsignificant.
Spinophilin decreases GluN2B-containing NMDAR surface expression
To detail mechanisms by which spinophilin limits GluN2B-dependent calcium influx, surface biotinylation of Neuro2A cells was performed to measure the surface expression of GluN1 and GluN2B subunits of the NMDAR in the presence or absence of spinophilin. To validate this approach, non-transfected cells were biotinylated and immunoblotted for the known Neuro2A surface protein, GluA2 (Priya et al., 2014). GluA2 signal was observed in both the input and pulldown; however, while both β-tubulin and GAPDH were observed in the input, neither was observed in the pulldown (Figure 4A). Representative total protein (Ponceau) stains and immunoblots are shown in Figure 4B. Overexpression of spinophilin had no significant effect on the surface expression of the GluN1 subunit (Figure 4C), but significantly decreased surface expression of the GluN2B subunit (Figure 4D). These experiments were performed without GCaMP6s overexpression. To ensure that changes observed in the calcium imaging experiments were not due to potential buffering or modulation of calcium binding to GCaMP6s, we repeated this study with GcAMP6s co-transfection. As above, spinophilin overexpression had no effect on GluN1 surface expression (Figure 4E), but decreased the surface expression of GluN2B (Figure 4F). As there may be differences in transfection efficiency across cells and within individual cells across conditions, individual protein expression was not normalized to total protein stain; however, as shown in the representative image, ponceau staining was even across samples. Therefore, surface levels of the receptor were normalized to total levels of the receptor to account for any differences in transfection efficiency or total protein stability. Moreover, as we ran independent experiments on each gel, we generated a normalized ratio to the no spinophilin condition. Overall, our results suggest that spinophilin overexpression may decrease surface expression of GluN2B and that this may, in part by a mechanism by which spinophilin is decreasing calcium influx; however, other mechanisms such as channel conductance may also be playing a role.
Figure 4. Spinophilin-dependent changes in GluN1 and GluN2B surface expression.
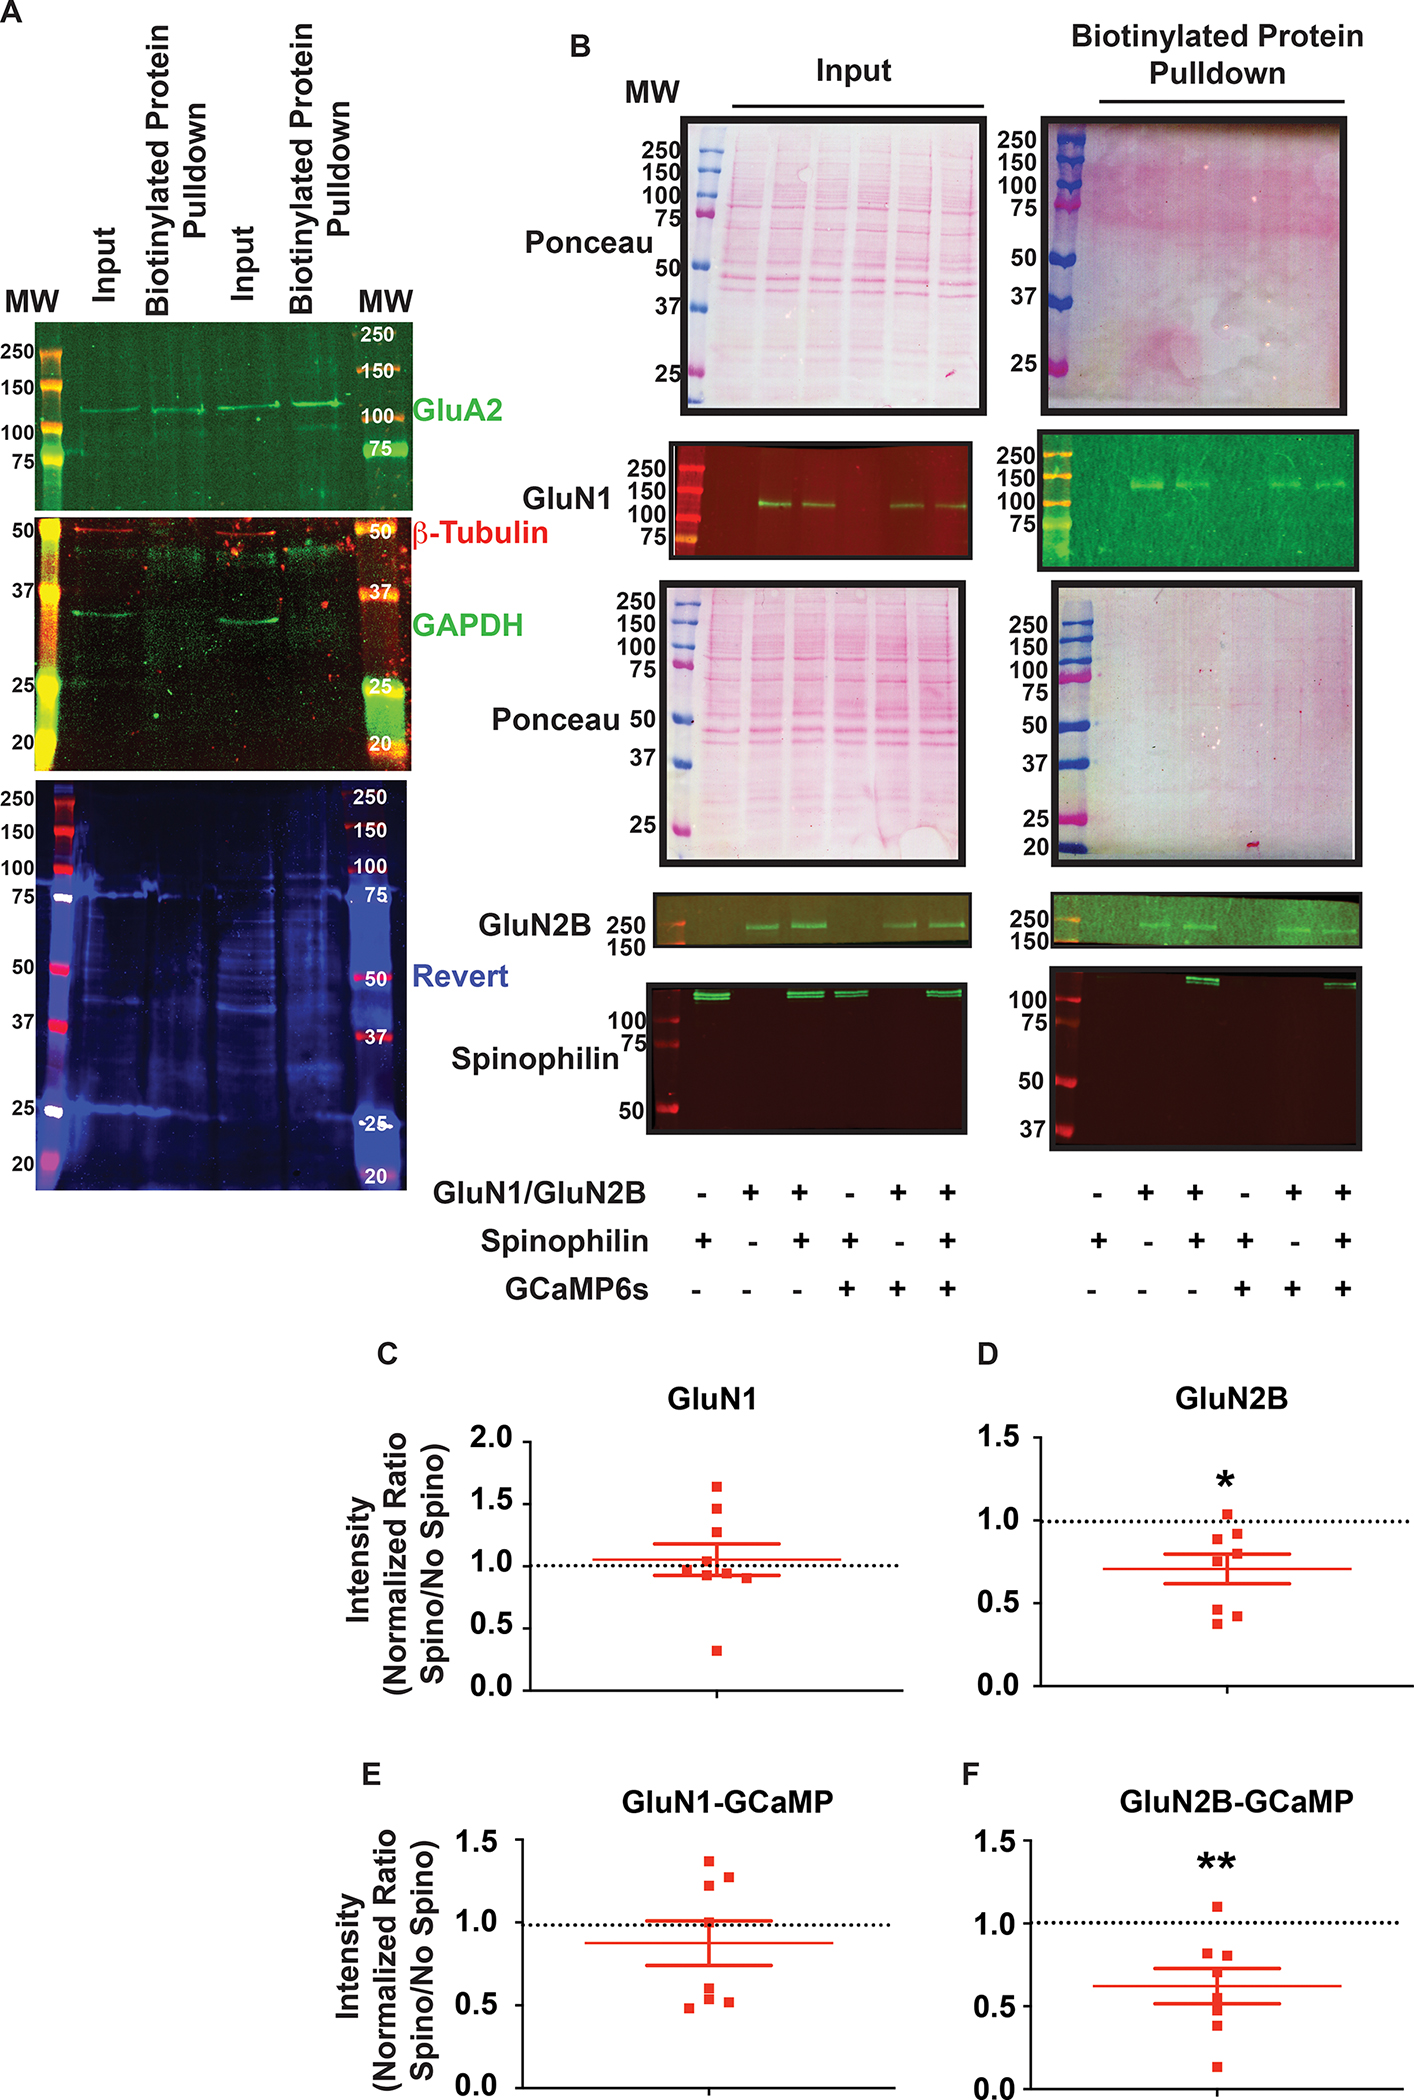
A: Inputs and biotinylated protein pulldown from two separate wells of a 6-well plate containing non-transfected Neuro2A cells were immunoblotted for GluA2, β-tubulin, and GAPDH and stained for total protein (Revert). B: Representative ponceau stains and western blots indicting the transfection conditions and biotinylation efficiency in the Neuro2a cells. The total lysate that was used for biotinylation (input) and the biotinylated protein fraction that was isolated from the input (biotinylated protein pulldown) that represent surface proteins labelled with biotin are shown. C: Quantified data of the surface expression of the GluN1 subunit of the N-methyl-D-Aspartate receptor (NMDAR) in the presence of WT-spinophilin overexpression, normalized to no spinophilin condition, with no GCaMP6s overexpression throughout the conditions. One-column t-test vs theoretical value of 1; P=0.6759. D: Quantified data of the surface expression of the GluN2B subunit of the N-methyl-D-Aspartate receptor (NMDAR) in the presence of wildtype (WT)-spinophilin overexpression, normalized to no spinophilin condition, with no GcaMP6s overexpression throughout the conditions. One-column t-test vs theoretical value of 1; *P=0.0135. E: Quantified data of the surface expression of the GluN1 subunit of the N-methyl-D-Aspartate receptor (NMDAR) in the presence of WT-spinophilin overexpression, normalized to no spinophilin condition, with GCaMP6s overexpression throughout the conditions. One-column t-test vs theoretical value of 1; P=0.3847. F: Quantified data of the surface expression of the GluN2B subunit of the N-methyl-D-Aspartate receptor (NMDAR) in the presence of WT-spinophilin overexpression, normalized to no spinophilin condition, while GCaMP6s was overexpressed throughout the conditions. One-column t-test vs theoretical value of 1; **P=0.0092. n=8–9 sets of transfections. All graphs represent mean±standard error of the mean (SEM). The normalized ratio of 1 is referenced by a dashed line.
Ser-1284 phosphorylation regulates GluN2B surface expression in an activity-dependent manner.
To detail if Ser-1284 phosphorylation-dependent increases in calcium-influx via GluN2B-containing NMDARs are due to increases in GluN2B surface expression, Neuro2a cells were transfected with WT, S1284A, or S1284D mutant GluN2B DNA constructs along with WT GluN1 in the presence or absence of WT-spinophilin (Figure 5A). Overall, there was a significant decrease in GluN2B surface expression in the presence, compared to absence, of spinophilin. There were no significant individual effects of spinophilin genotype on GluN1 surface expression (Figure 6D). We did not detect any significant changes in the surface expression of S1284A compared to WT-GluN2B (Figure 5B). In contrast to the increased GcAMP fluorescence in the S1284D mutant compared to the WT GluN2B, there was a significant decrease in the surface expression of S1284D mutant (Figure 5B), suggesting that the increased calcium fluorescence observed in the S1284D mutant transfections is not due to an increase in surface expression. To determine if the decreased surface expression of the S1284D mutant requires calcium influx via the NMDARs, we maintained AP-5 throughout the biotinylation procedures. In contrast to the significant decrease in GluN2B surface expression in S1284D compared to WT GluN2B-containing NMDARs when no AP-5 was present in the media (Figure 5B), there was no change in the surface expression of S1284D compared to WT GluN2B when AP5 was present throughout the experiment (Figure 5D, E One sample t-test, p=0.9089). Together, these results suggest that Ser-1284 phosphorylation can decrease the surface expression of GluN2B-containing NMDARs in an activity-dependent manner.
Figure 5. Surface expression of WT, S1284A and S1284D mutant GluN2B containing NMDA receptors.
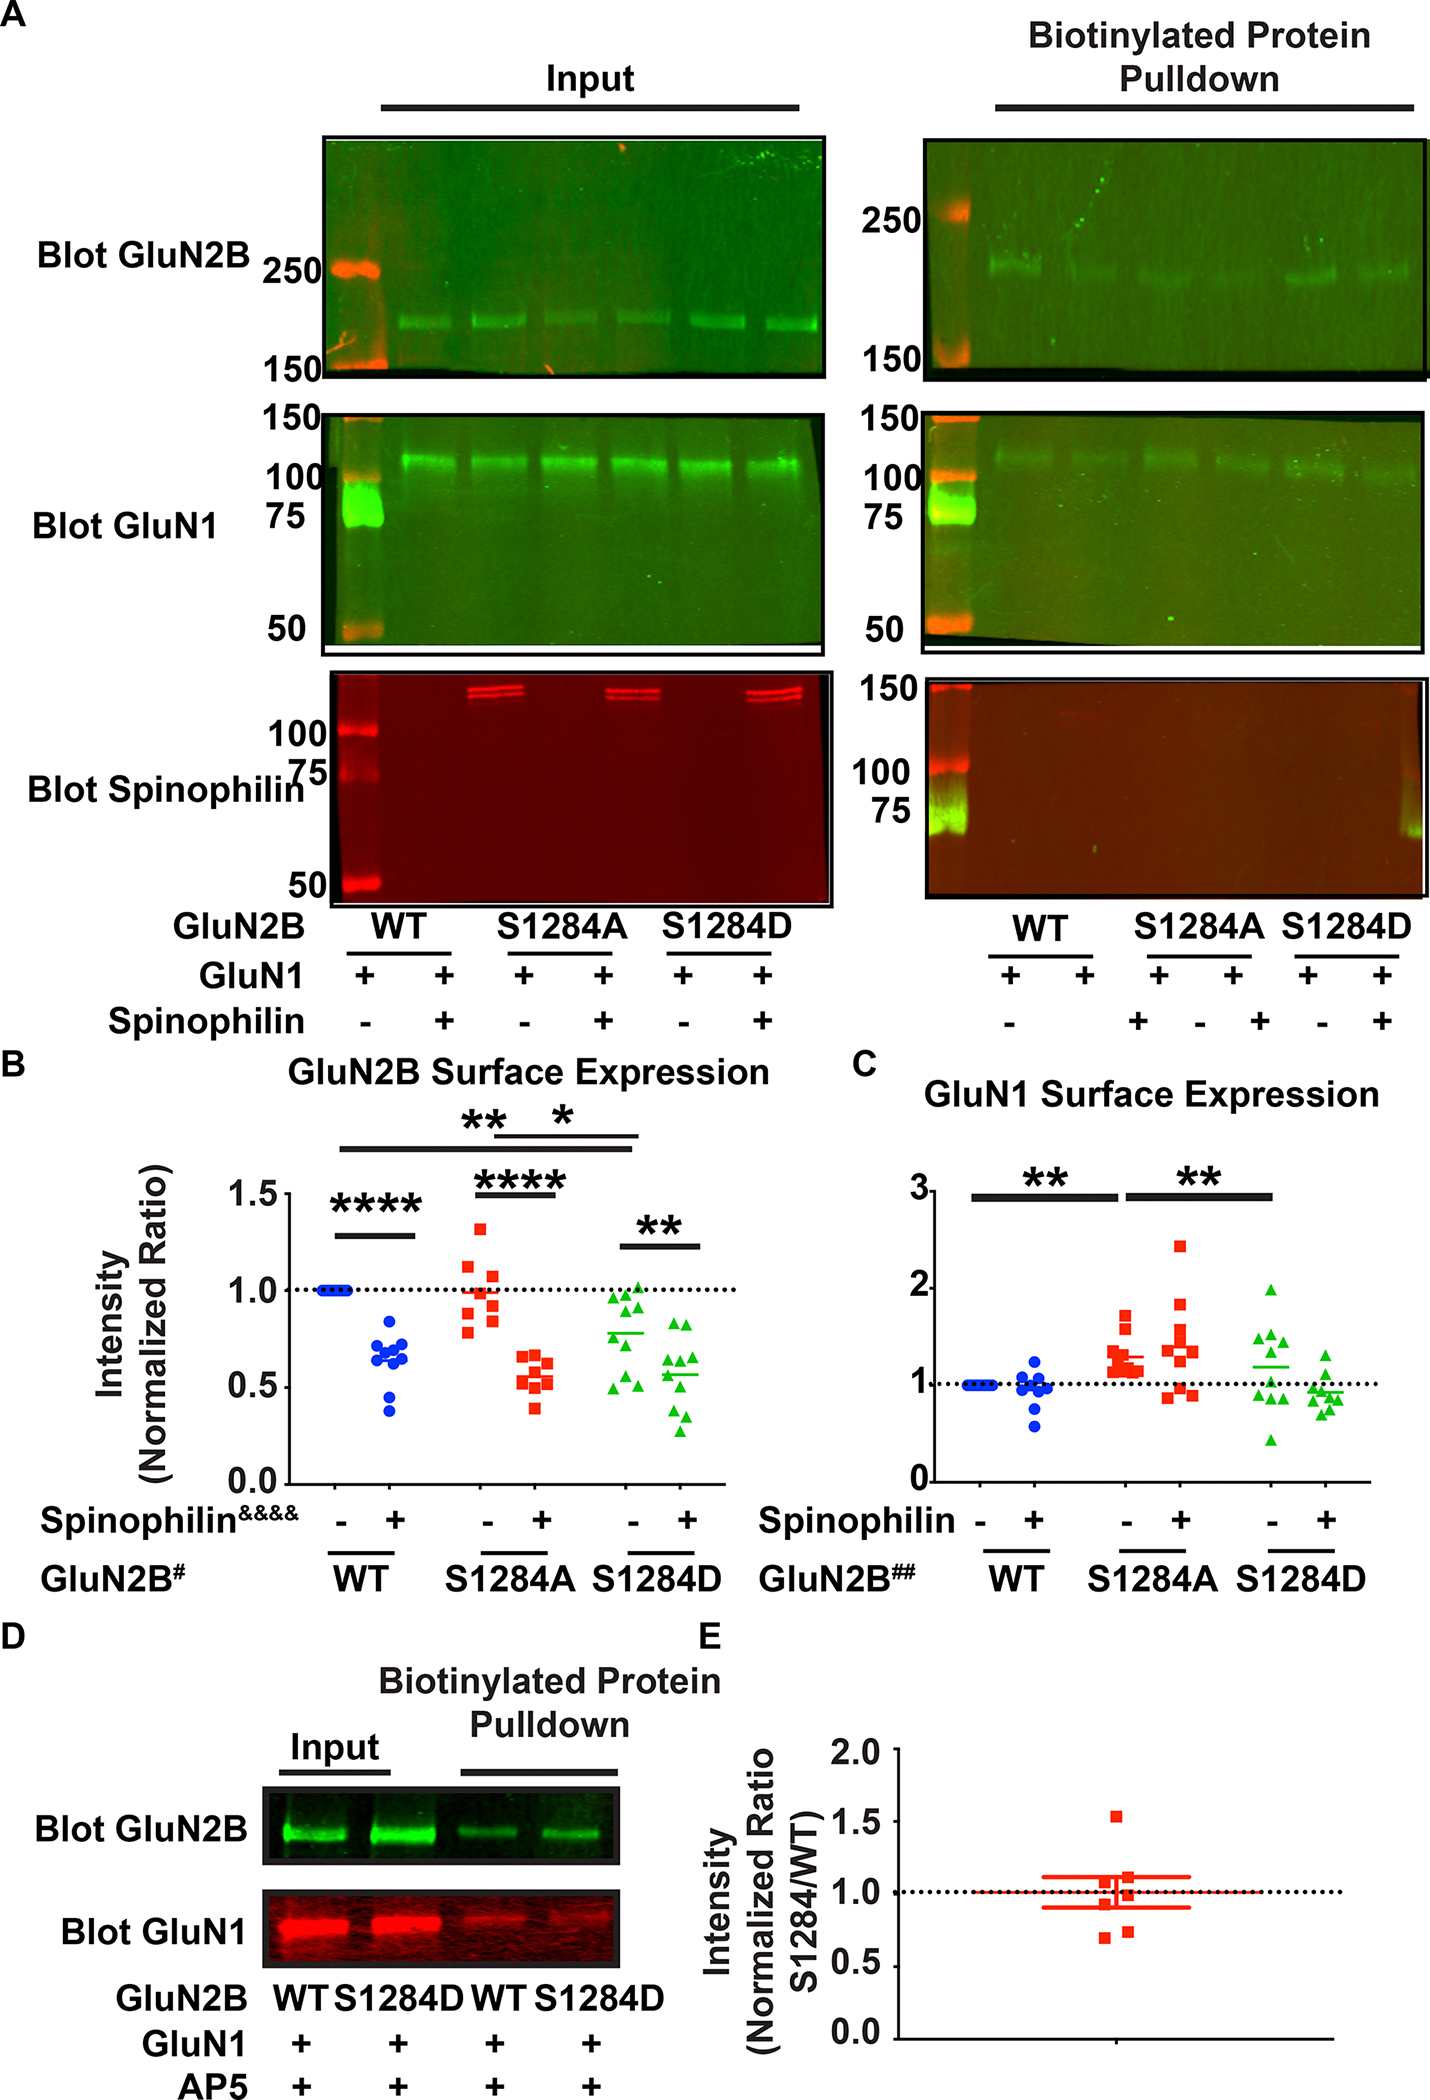
A: Representative western blots indicating the transfections and biotinylation conditions and efficiency. The total lysate that was used for biotinylation (input) and the biotinylated protein fraction that was isolated from the input (biotinylated protein pulldown) that represent surface proteins labelled with biotin are shown. Cells were transfected with wildtype (WT) GluN1 subunit of the subunit of the N-methyl-D-Aspartate receptor (NMDAR), and WT or Ser1284Ala (S1284A) or Ser1284Asp (S1284D) mutant forms of the GluN2B subunit of the NMDAR. Transfections were performed in the absence or presence of transfected WT-spinophilin B: Quantified data indicating the surface expression of WT, S1284A, and S1284D mutant GluN2B, in the presence or absence of overexpressed WT-spinophilin. n=10 sets of transfections. Two-way ANOVA spinophilin expression (F (1, 50) = 69.23, P<0.0001&&&&); GluN2B mutation (F (2, 50) = 4.874, P=0.0116#); Interaction (F (2, 50) = 2.548, P=0.0884). Sidak post-hoc test for spinophilin expression and Tukey post-hoc test for GluN2B mutation were performed separately. C: Quantified data indicating the surface expression of GluN1 when co-expressed with WT, S1284A and S1284D mutant GluN2B, in the presence and absence of overexpressed WT-spinophilin. n=10 sets of transfections. Two-way ANOVA; Spinophilin expression - F (1, 52) = 0.7167, P=0.4011), GluN2B mutation - F (2, 52) = 7.875, P=0.0010, Interaction – F (2, 54) = 1.755, P=0.1830. Tukey post-hoc test for GluN2B mutation were performed. D: Representative western blots indicating the transfection and biotinylation efficiency of WT and/or S1284D GluN2B in the presence and absence of AP5 application throughout the biotinylation procedure. n=7 sets of transfections. E: Quantified data of the surface expression of S1284D mutant GluN2B, in the presence of AP5 application during biotinylation, normalized to WT n=7. One-column t-test vs theoretical value of 1; P=0.9089. All graphs represent mean±standard error of the mean (SEM); *p<0.05, **P<0.01, ***p < 0.001, **** p <0.0001 post-hoc comparisons. All the other comparisons are nonsignificant. The normalized ratio of 1 is referenced by a dashed line.
Figure 6. Surface expression of GluN2B subunit of NMDARs and GluA2 of AMPARs is altered in the hippocampus of spinophilin KO mouse brain.
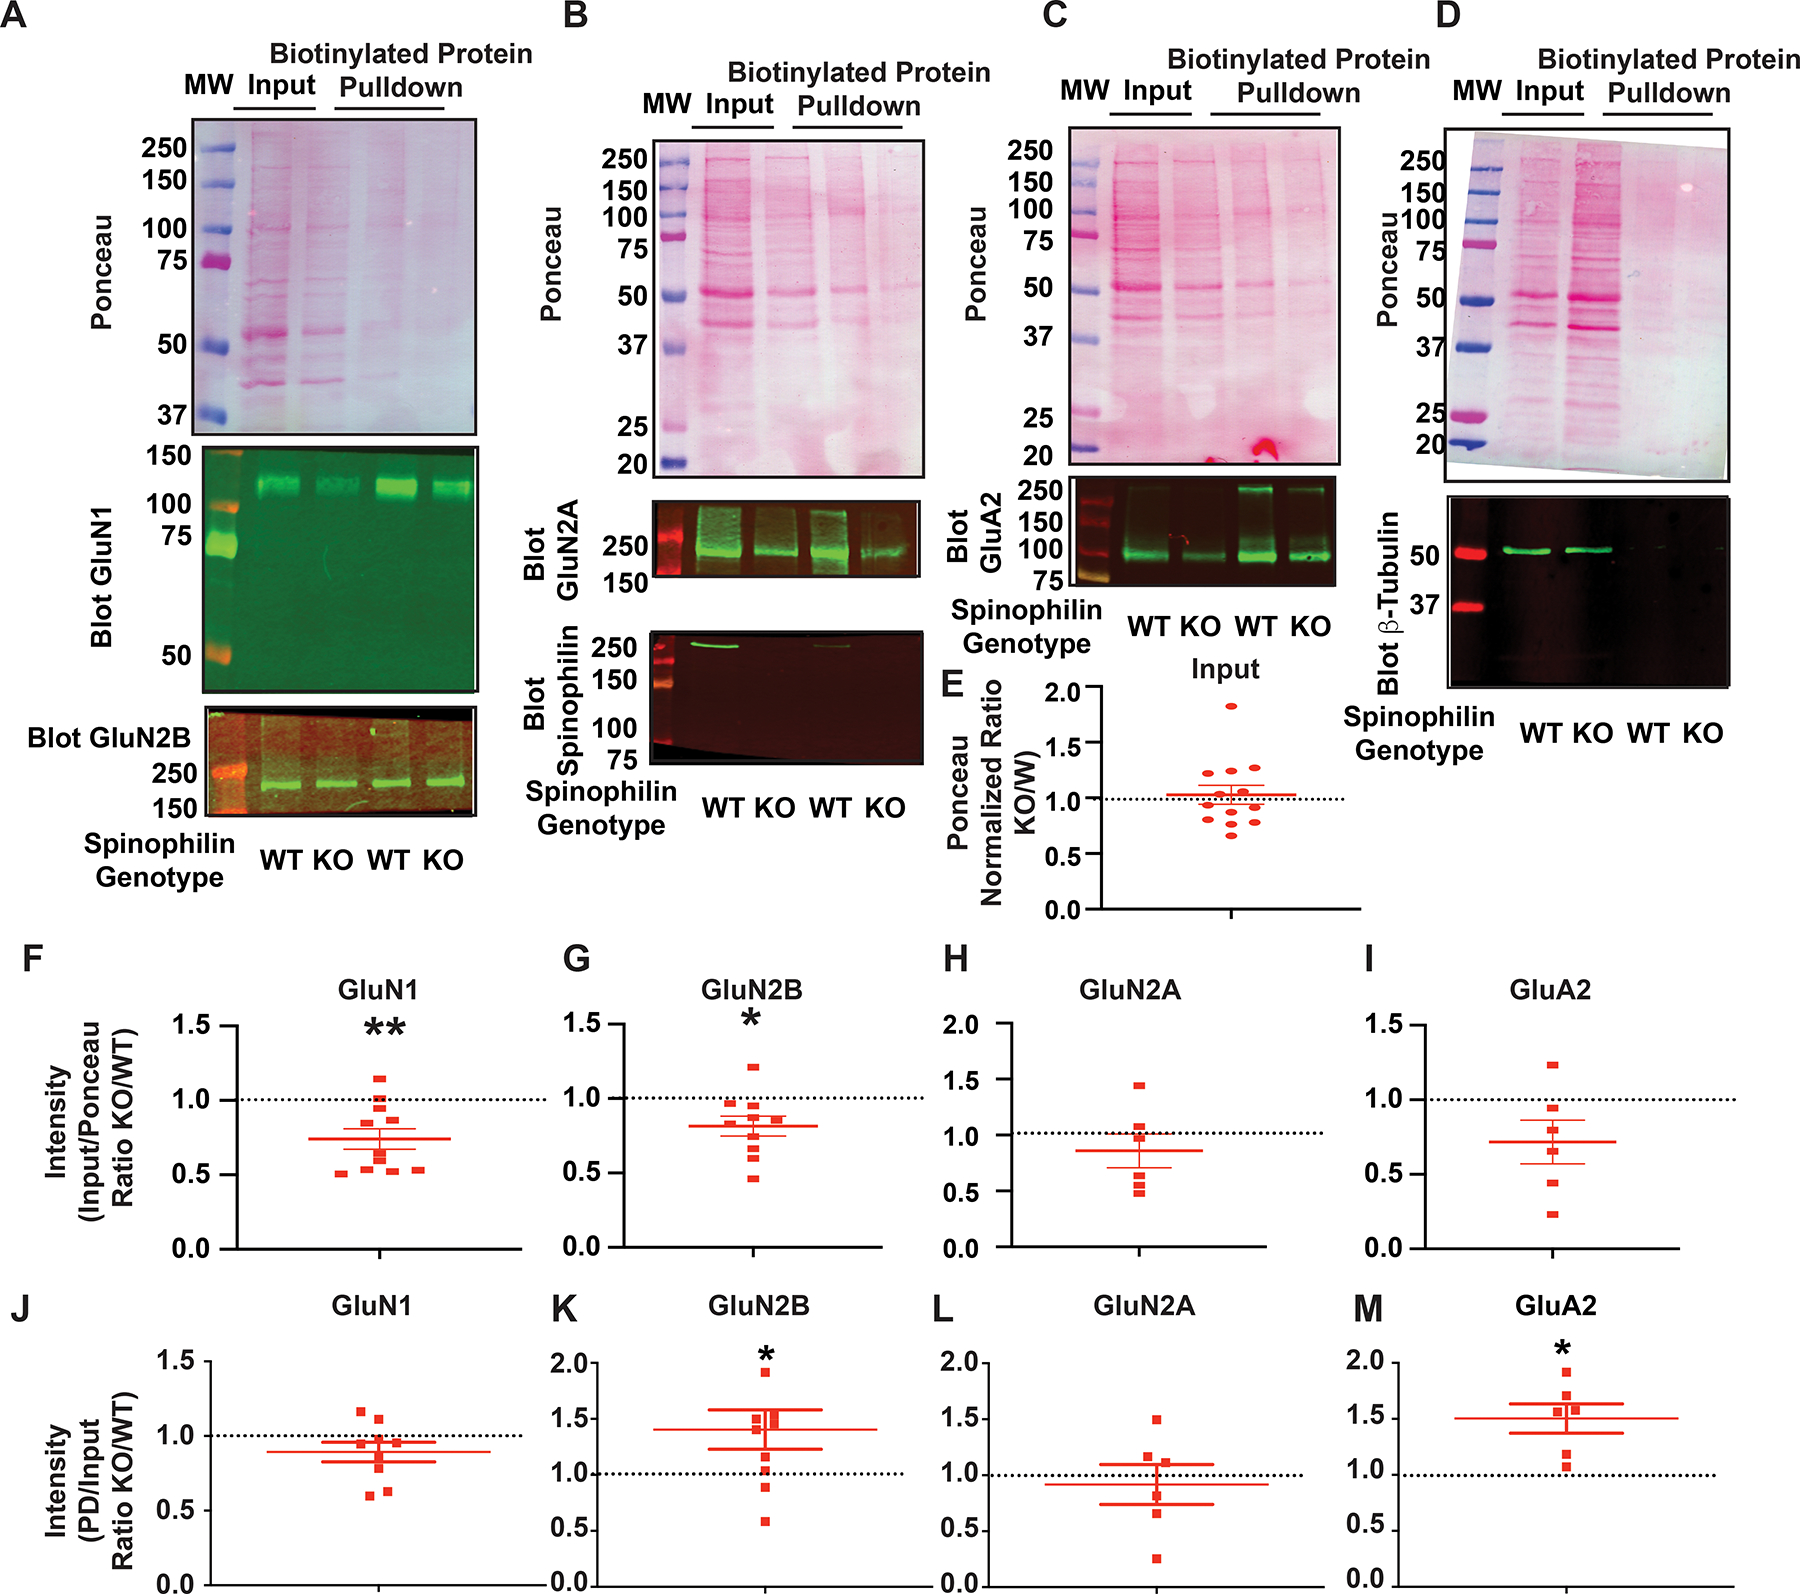
A-D: Ponceau staining and immunoblotting of inputs and biotinylated pulldowns for GluN1 and GluN2B (A), GluN2A and Spinophilin (B), GluA2 (C), and β-tubulin (D). E: Quantification of the ratio (KO/WT) of the total ponceau stain in the inputs. One-column t-test vs theoretical value of 1; P=0.7502. F-I: Quantification of the ratio (KO/WT) of the inputs normalized to ponceau stain for F: GluN1 subunit of the N-methyl-D-Aspartate receptor (NMDAR). n=11. One-column t-test vs theoretical value of 1; P=0.0038; G: GluN2A subunit of the NMDAR. n=6. One-column t-test vs theoretical value of 1; P=0.3931. H: GluN2B subunit of the NMDAR. n=10 . One-column t-test vs theoretical value of 1; *P=0.0219. I: GluA2 subunit of the a-amino-3-hydroxy-5-methyl-4-isoxazolepropionic acid receptor (AMPAR). n=6. One-column t-test vs theoretical value of 1; P=0.1105. Quantification of the ratio (KO/WT) of the biotinylated pulldowns (PDs) normalized to the input for J: GluN1 subunit of the N-methyl-D-Aspartate receptor (NMDAR). n=9. One-column t-test vs theoretical value of 1; P=0.1371. K: GluN2A subunit of the NMDAR. n=6. One-column t-test vs theoretical value of 1; P=0.6610. L: GluN2B subunit of the NMDAR. n=9. One-column t-test vs theoretical value of 1; *P=0.0371. M: GluA2 subunit of the a-amino-3-hydroxy-5-methyl-4-isoxazolepropionic acid receptor (AMPAR). n=6. One-column t-test vs theoretical value of 1; *P=0.119. All graphs represent mean±standard error of the mean (SEM). The normalized ratio of 1 is referenced by a dashed line.
Surface expression of GluN2B subunit of NMDARs and GluA2 subunit of AMPARs is altered in the hippocampus of P28 spinophilin KO animals.
We next investigated total and surface expression of NMDAR subunits in the hippocampus of WT and spinophilin KO mice. Surface biotinylation was performed on hippocampal slices generated from WT and global spinophilin KO animals. Ponceau stain and representative immunoblots are shown for GluN1 and GluN2B (Figure 6A), GluN2A and spinophilin (Figure 6B), GluA2 (Figure 6C) and β-tubulin (Figure 6D). The total protein expression as measured using a ponceau stain was quantified and a ratio of the KO/WT was plotted. There was no significant difference in total protein expression from the hippocampus dissected from the coronal slices (Figure 6E). Both total protein expression normalized to total protein stains and surface protein expression were measured and a KO/WT ratio generated. We observed a global decrease in expression of normalized GluN1 (Figure 6F) and GluN2B (Figure 6G), with no significant changes in GluN2A (Figure 6H) or GluA2 (Figure 6I) protein expression. When looking at surface expression, there was a significant increase in the surface expression of the GluN2B subunit of the NMDAR (Figure 6K) with no significant changes in GluN1 (Figure 6J) or GluN2A (Figure 6L) in spinophilin KO, compared to WT, mice. Moreover, we also investigated surface expression of the calcium-impermeable GluA2 subunit of the AMPAR (Man, 2011) given its role in regulating calcium permeability and trafficking of AMPARs. Interestingly, our results show a significant increase in the surface expression of GluA2 in the spinophilin KO hippocampi (Figure 6M) suggesting a potential role of spinophilin in regulating both AMPAR and NMDAR trafficking. Future studies will need to further follow-up on these results for the AMPAR subunits.
The subcellular localization of NMDAR subunits is modified in P28 spinophilin global KO mouse hippocampus.
To detail if loss of spinophilin impacts NMDAR subcellular localization, we used a crude fractionation protocol (Figure S1) to evaluate the levels of GluN1, GluN2A, and GluN2B subunit of NMDARs in S2 (membrane-associated non-PSD) and S3 (Synaptic, PSD) fraction of postnatal day (P) 28 hippocampus of spinophilin WT and KO mice. S1 (cytosolic) refers to proteins not tethered or inserted into a membrane, S2 refers to proteins that are integral membrane proteins or are associated with membrane proteins, including all cellular membranes such as the ER, Golgi, intracellular vesicles, and other intracellular membranes, but not at the PSD, the electron-dense region localized to the tips of dendritic spines, and S3 is enriched in PSD proteins. To validate this crude fractionation, we blotted our samples for PSD95 (Figure 7A), an S3 marker, GAPDH (Figure 7B), an S1 (cytosolic) marker, and mGluR5 (Figure 7B), an S2 marker. As a portion of the total protein loaded (Ponceau S stain), we observe a significant and ~8.5-fold enrichment for PSD95 when normalized to total protein in the ponceau stain. We have characterized this approach previously (Baucum et al., 2013); however, it is important to note that this is a crude fractionation and we are not purifying pure PSDs. In validated spinophilin KO mice (Figure 7C). We also immunoblotted for GluN1 (Figure 7D) GluN2A (Figure 7E) and GluN2B (Figure 7F). Global spinophilin KO mice have been previously shown to have decreased hippocampal protein and smaller hippocampi (Feng et al., 2000). While we did not observe decreased total protein using ponceau stain in hippocampi dissected from coronal slices (Figure 6E), we observed a 19% and 43% decrease in total protein expression in the S2 and S3 fractions (Figure 7G). When evaluating NMDARs within the different fractions, our results show a significant decrease of GluN1 in the S2 fraction when normalized to ponceau stain as well as the S3 fraction when not normalized to ponceau stain. However, there was no significant change in the S3 fraction when normalized to ponceau stain. (Figure 7H). GluN2A results show no significant change in the S2 fraction when normalized to poncau stain, but a significant decrease in the S3 fraction when not normalized to ponceau stain but a significant increase in the S3 fraction normalized to ponceau stain S3 fraction (Figure 7I). Like GluN1, GluN2B expression was decreased in the S2 fraction when normalized to ponceau stain as well as the S3 fraction when not normalized to ponceau stain and no significant change in the S3 fraction when normalized to ponceau stain (Figure 7J). These results suggest that global KO of spinophilin decreases overall synaptic protein expression, but alters the subcellular localization of the remaining NMDAR subunits in P28 mouse hippocampus. Furthermore, GluN2B-containing NMDARs are less associated with the S2 fraction; however, it is unclear to which subcellular domain this corresponds. In contrast, GluN2A-containing NMDARs are more associated with the S3 fraction. Taken together with data in Figure 6, this suggests a greater proportion of GluN2B-containing NMDARs on the surface, and equal GluN2A-containing NMDARs on the surface, but a redistribution of those receptors to the synaptic fraction in spinophilin KO mice.
Figure 7. The subcellular localization of NMDAR subunits is modified in P28 spinophilin global KO mouse hippocampus.
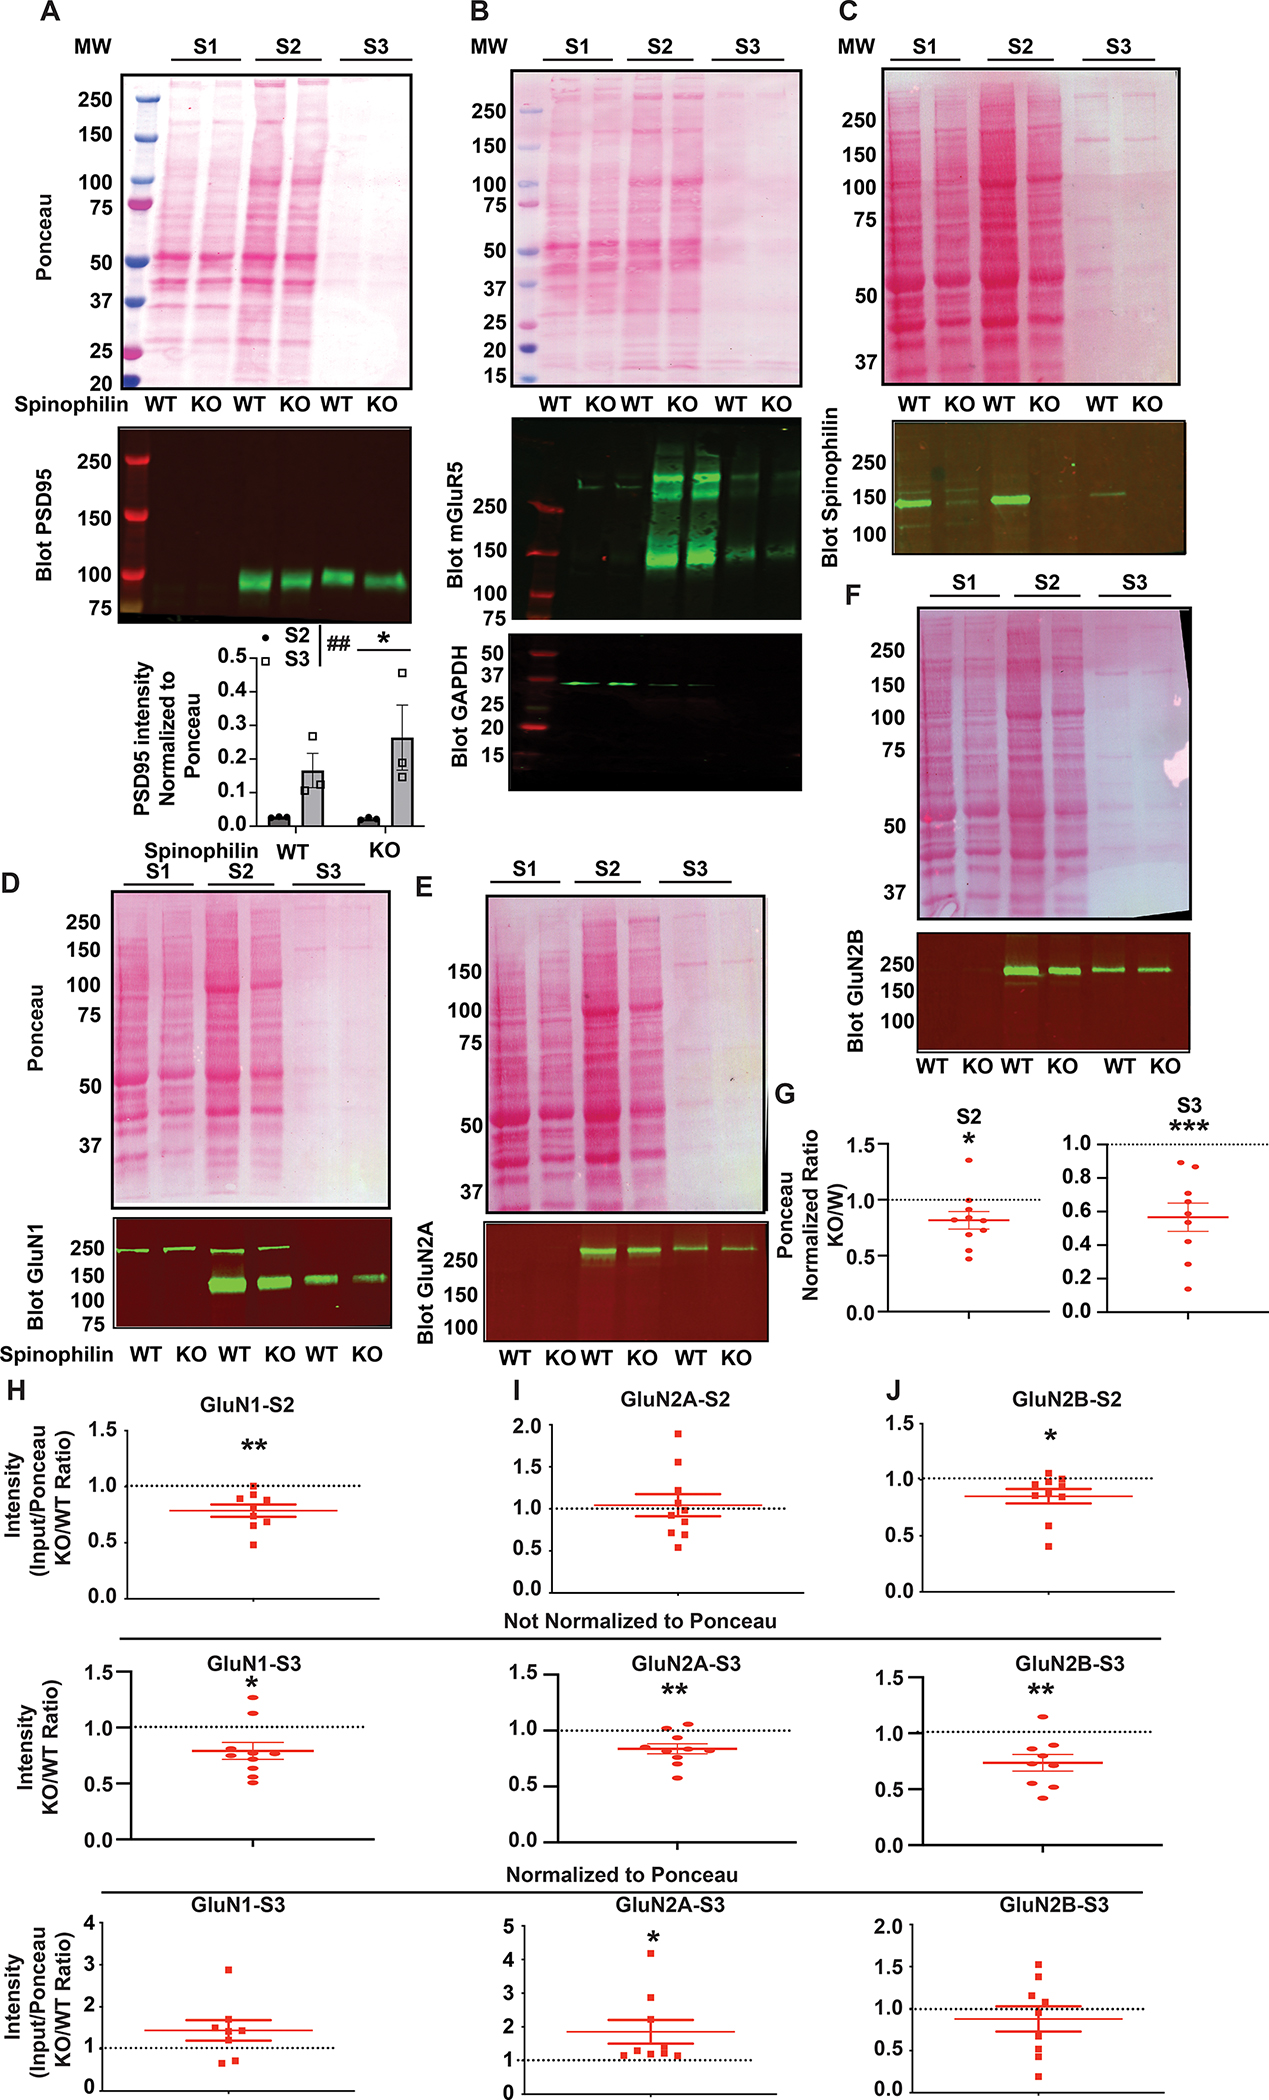
Ponceau stain and immunoblotting of marker proteins A. PSD-95, B. mGluR5, C. Spinophilin and NMDAR subunits D. GluN1, E. GluN2A, and F. GluN2B in cytosolic (S1), membrane associated-non postsynaptic density (S2), and postsynaptic density-enriched (S3) crude subcellular fractions. S2 and S3 fractions were quantified for A. PSD 95. Two-Way ANOVA showed a significant fraction effect (F(1,8) = 12.02, P=0.0085. Sidak post-hoc test showed a significant individual difference in the KO P=0.0285. Quantifications are N of 3 samples run on the same gel. G: Quantification of a normalized ratio KO/WT of ponceau stains from the S2 and S3 fraction. S2 - One-column t-test vs theoretical value of 1; *P=0.0429, S3 - One-column t-test vs theoretical value of 1; ***P=0.0009. H: Quantified data showing the level of subcellular localization of the GluN1 subunit of the N-methyl-D-Aspartate receptor (NMDAR) in the S2 fraction normalized to ponceau (top), S3 fraction not normalized to ponceau (middle) and S3 fraction normalized to ponceau (bottom) fraction. n=8–9. One-column t-test vs theoretical value of 1; **P=0.0044 (S2), *P=0.0214 (S3 not normalized), P=0.1130 (S3 normalized). I: Quantified data showing the level of subcellular localization of GluN2A subunit of the NMDAR in the S2 fraction normalized to ponceau (top), S3 fraction not normalized to ponceau (middle) and S3 fraction normalized to ponceau (bottom) fraction. n=9–10. One-column t-test vs theoretical value of 1; P=0.7438 (S2), **P=0.0058 (S3 not normalized),*P=0.0413 (S3 normalized). J: Quantified data showing the level of subcellular localization of GluN2B subunit of the NMDAR in the S2 fraction normalized to ponceau (top), S3 fraction not normalized to ponceau (middle) and S3 fraction normalized to ponceau (bottom) fraction. n=9–10. One-column t-test vs theoretical value of 1; *P=0.0493 (S2) ), **P=0.0074 (S3 not normalized), P=0.4403 (S3 normalized). All graphs represent mean±standard error of the mean (SEM). The normalized ratio of 1 is referenced by a dashed line.
Spinophilin KO hippocampal cultures are more susceptible to activation of apoptotic pathways.
Our studies above demonstrate spinophilin-dependent decreases in calcium influx via GluN2B containing NMDARs, as well as increases in surface levels of the GluN2B-containing NMDARs in spinophilin KO mice. Moreover, previous studies have found that spinophilin KO mice have smaller hippocampi (Feng et al., 2000). Therefore, we hypothesized that spinophilin may normally act to limit activation of calcium-dependent processes, such as caspase cleavage. To test this hypothesis, we cultured hippocampal primary neurons from global spinophilin WT and KO P0 (day of birth) mouse pups. Following 14–24 days of culturing in vitro, the conditioned neurobasal media was replaced with neurobasal media containing 100 μM glutamate for 30 minutes. Following this time, the original conditioned media was replaced, and cells were incubated for 90 minutes and immunoblotted for cleaved caspase 3 (CC3). We found that the CC3 to caspase 3 (C3) ratio was three times higher in the spinophilin KO neurons compared to the WT cells (Figure 8A). Previous studies show low spinophilin expression in embryonic and early postnatal days (P) cortical lysates with spinophilin expression increasing starting at P11 and levels peaking around P26 and decreasing slightly into adulthood (Allen, Ouimet, & Greengard, 1997). However, cultured neurons do not fully recapitulate synaptic protein expression and this is consistent with the low efficiency and background staining for spinophilin observed in hippocampal neuronal cultures. To detail if these changes were due to glutamate addition per se over that short 30-minute time frame or were due to changes occurring during neuronal culturing, we performed the media change in the absence of glutamate or in the presence of glutamate and AP5. Interestingly, neither NMDAR activation nor glutamate per se was required for the greater caspase activation observed in the spinophilin KO mice, suggesting that caspase cleavage induced by this assay is due to either the stress induced by removal of the conditioned media and replacement with non-conditioned media or basal differences in caspase cleavage between WT and KO cells. Irrespective of mechanism, spinophilin limits caspase cleavage as there was a global significant increase in the spinophilin KO compared to WT mice (Figures 8B). These results suggest that spinophilin KO neurons have more CC3 compared to WT neurons; however, the NMDAR-dependence and the specific mechanism(s) of this difference need to be further evaluated.
Figure 8. Spinophilin KO hippocampal cultures are more susceptible to activation of apoptotic pathways independent of acute calcium influx via NMDARs.
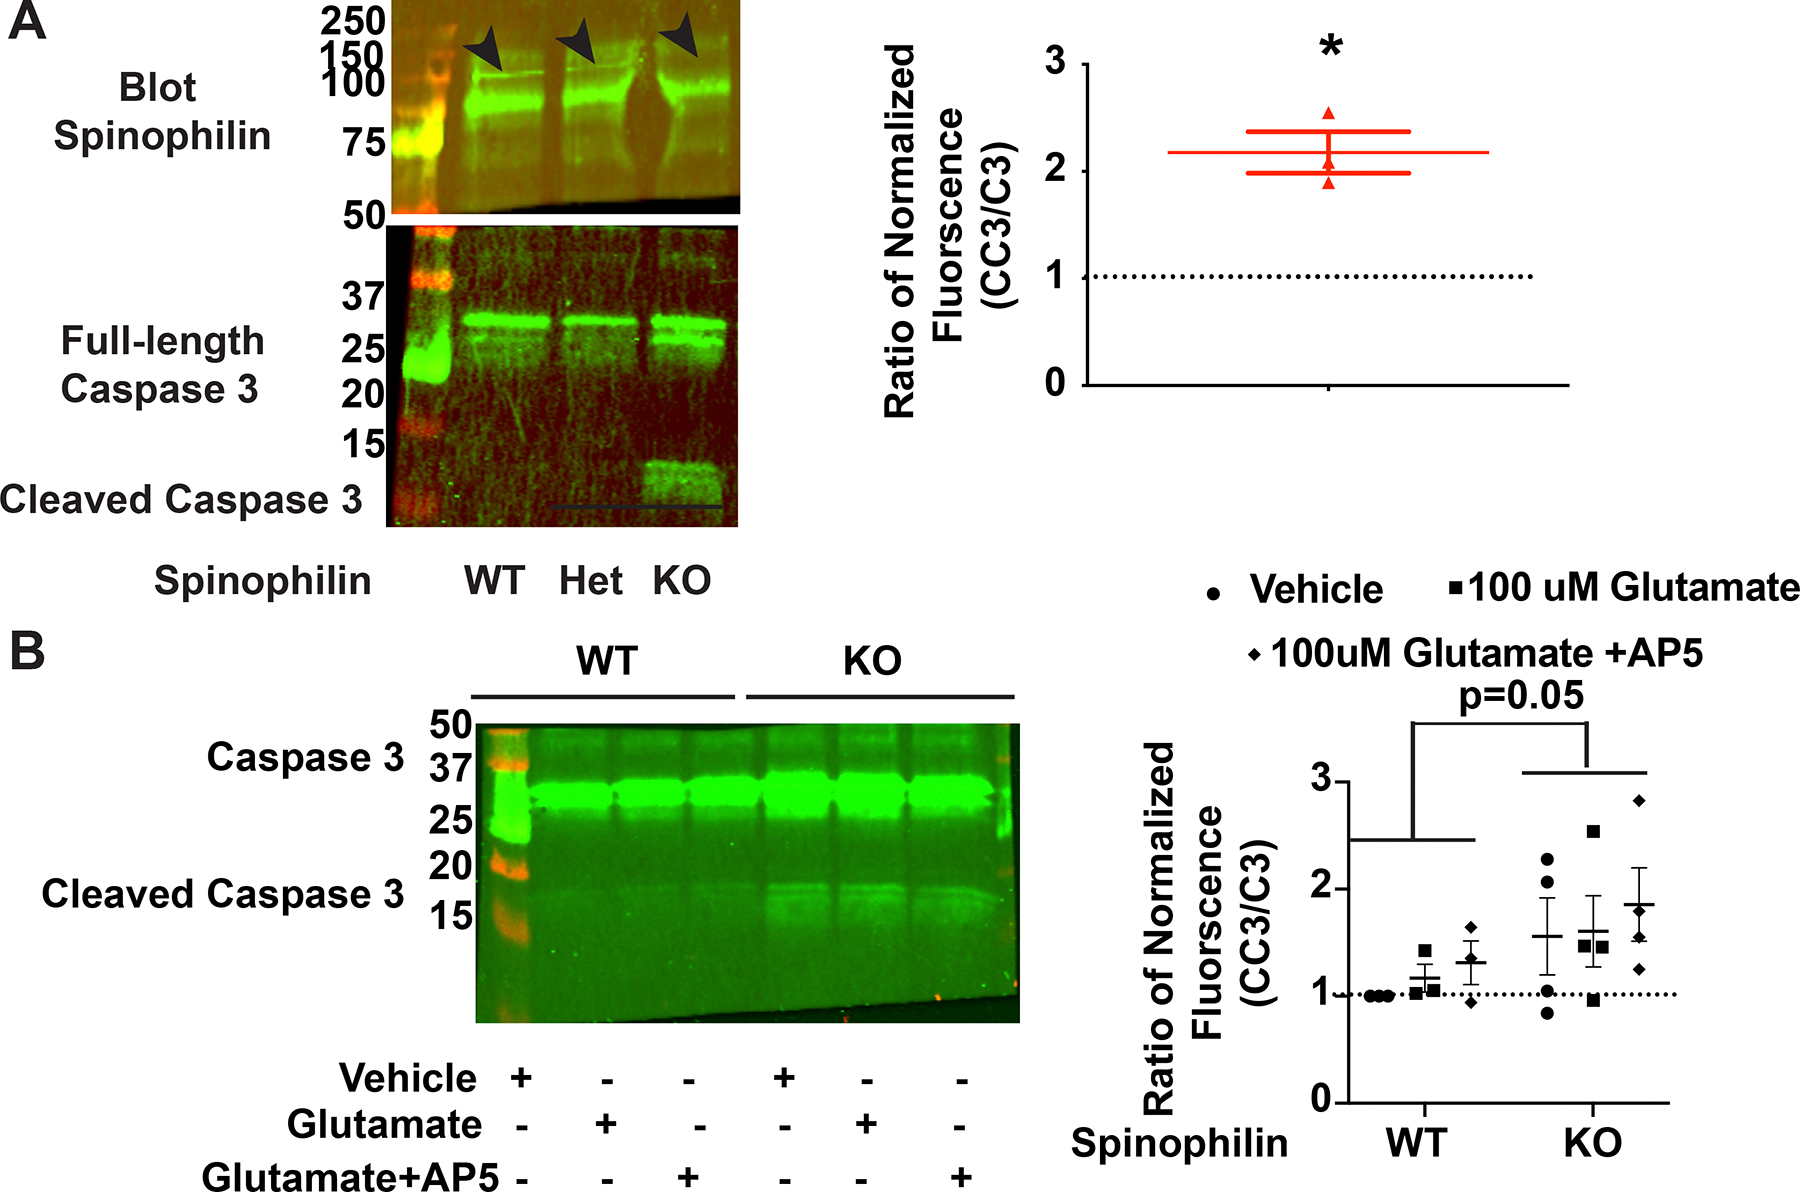
A: Western blot data showing spinophilin and caspase 3 (C3) and cleaved caspase 3 (CC3) bands in the spinophilin WT, heterozygous, and KO hippocampal cultures. A ratio of the KO/WT data were plotted and show a significant increase in the CC3/C3 ratio in the KOs compared to the WT cells. N=3. One-column t-test vs theoretical value of 1; *P=0.0260. B: Western blot data showing C3 and CC3 bands in the spinophilin WT and KO hippocampal cultures treated with vehicle, NMDA, or NMDA and AP5. Quantified data indicating a significant increase in the CC3/C3 ratio in the KOs compared to the WT cells. N=3–4. Two-way ANOVA; Spinophilin expression - F (1, 15) = 4.380, P=0.0538), Treatment - F (2, 15) = 0.5305, P=0.5989, Interaction – F (2, 15) = 0.02395, P=0.9764. No post-hoc differences. All graphs represent mean±standard error of the mean (SEM). The normalized ratio of 1 is referenced by a dashed line.
DISCUSSION
Spinophilin is the most abundant PP1 binding protein in the PSD (Allen et al., 1997; Colbran et al., 1997). Through this interaction, spinophilin can modulate the phosphorylation state of various proteins by either targeting PP1 activity towards, or inhibiting PP1 activity at, various substrates. We have found multiple subunits of the NMDA receptor in spinophilin immunoprecipitates (Baucum et al., 2013; Hiday et al., 2017; Watkins, True, Mosley, & Baucum, 2018) and demonstrated that spinophilin interacts with the intracellular tail region of the GluN2B subunit of the NMDAR (Salek et al., 2019). Spinophilin has been shown to modulate the activity of NMDARs such that inhibition of PP1 in the presence, but not absence, of spinophilin increases NMDAR currents (Feng et al., 2000). Previous studies investigating the effect of spinophilin on NMDAR function, have not fully evaluated the mechanisms by which spinophilin impacts channel function. Our data indicate that spinophilin decreases calcium influx via GluN2B-containing NMDARs in Neuro2a cells. This observation can be explained in two possible ways: 1) spinophilin decreases the amount of calcium entering per channel and/or 2) spinophilin decreases the number of functional channels on the surface membrane. To test the latter, receptor surface expression was quantified in presence or absence of spinophilin. Surface biotinylation reveals that spinophilin overexpression significantly decreases the surface expression of GluN2B, but not GluN1, in Neuro2A cells. As GluN1 and GluN2B form a functional tetramer, it may be surprising that GluN1 was unchanged. In overexpression systems, while GluN1 homomeric channels may exist at the membrane (Green, Rogers, Contractor, & Heinemann, 2002; Williams, Russell, Shen, & Molinoff, 1993), they lack the glutamate binding site that is present in the heteromeric channel (Furukawa, Singh, Mancusso, & Gouaux, 2005) and therefore do not conduct ions. Moreover, we cannot say that GluN1 is solely complexing with GluN2B and a small portion may interact with a different endogenous GluN subunit, similar to observations in Xenopus oocytes transfected exclusively with GluN1 (Soloviev & Barnard, 1997). Therefore, our data suggest that spinophilin does not regulate GluN1-containing homomers. While there was no signal for intracellular proteins in our non-transfected Neuro2A biotinylation studies, overexpression of the NMDARs may enhance the leakiness of the membranes for some cells. While we observed minimal, but some, staining of spinophilin in our biotinylation studies from NMDAR-transfected Neuro2A cells, we cannot completely rule out that the biotinylation in the context of overexpressed NMDARs is labeling GluN1 that is associated with the ER and not at the membrane surface. If this is the case, it may suggest a greater expression of GluN1 than GluN2B such that a pool of non GluN2B-bound GluN1 is aggregating intracellularly. Alternatively, as GluN1 makes up 50% of the GluN1/GluN2B heteromers, spinophilin may enhance homomeric GluN1 membrane trafficking and this increase may “wash out” the decrease trafficking observed in the heteromeric GluN1/GluN2B channel. Future studies will need to evaluate if spinophilin can regulate GluN1/GluN2A or other functional NMDA receptor subunits or if these effects are specific to GluN2B-containing NMDA receptors. In addition to the in vitro effects of spinophilin, we observed increased surface expression of GluN2B in hippocampal slices isolated from global spinophilin KO animals compared to their WT control littermates. Moreover, consistent with a specific role for spinophilin on GluN2B-containing NMDAR surface expression, we observed no significant difference in GluN1 or GluN2A surface expression. Together, these data suggest that the spinophilin-dependent decrease in the GluN2B-mediated increase in intracellular calcium is, in part, due to spinophilin decreasing receptor surface expression. However, as stated above, we cannot rule out the possibility of spinophilin modifying channel conductance to calcium and future electrophysiological studies will need to address this.
Spinophilin may modify GluN2B channel function independent of its ability to regulate GluN2B-phophsorylation and trafficking. We have previously shown that spinophilin promotes phosphorylation of Ser-1284 on GluN2B by decreasing PP1 association with GluN2B both in vitro and in vivo (Salek et al., 2019). We found that the S1284D phosphorylation mutant enhanced calcium influx in the GluN2B-containing NMDAR transfected cells. This increased calcium influx was not due to greater surface expression as this mutant had decreased surface expression compared to the WT construct. These data suggest that our previously reported spinophilin-dependent increases in Ser-1284 phosphorylation are not responsible for the spinophilin-dependent decreases in GluN2B surface expression but may promote channel function. Consistent with this, overexpression of spinophilin decreases calcium influx to a similar extent across the WT, S1284A, and S1284D GluN2B genotypes as measured by GcAMP6s fluorescence. Moreover, as S1284D enhances calcium influx concurrent with decreased GluN2B surface expression, these data suggest that Ser-1284 phosphorylation enhances the amount of calcium influx per receptor (e.g. possibly increased conductance). Given that the S1284D mutation had decreased surface expression, it may be that this mutation is driving an activity-dependent internalization. In fact, when AP5 was maintained throughout the experiment until harvesting, there was no difference in surface expression between WT and the S1284D mutant. Together, these data suggest that spinophilin can bidirectionally modulate calcium influx through NMDARs by 1) enhancing Ser-1284 phosphorylation which increases calcium influx through GluN2B-containing NMDARs independent of surface expression and 2) decreasing the GluN2B-NMDAR dependent calcium influx by decreasing surface expression of the channel through an unknown, Ser-1284 phosphorylation-independent, pathway.
Mechanistically, how spinophilin decreases surface expression could involve clathrin-mediated endocytosis given that we have previously observed clathrin in spinophilin co-IPs (Watkins, True, Mosley, & Baucum, 2019) and GluN2B-containing NMDA receptors undergo clathrin-mediated endocytosis (Wu, Chen, Yang, Jiao, & Qiu, 2017). Moreover, alterations in vesicle trafficking could involve the motor protein, myosin-Va, since we have previously found that both spinophilin and GluN2B interact with Myosin-Va (Baucum et al., 2013; Hiday et al., 2017; Salek et al., 2019; Watkins et al., 2018) and others have shown that myosin-Va associates with vesicles and is critical in AMPA receptor trafficking and function (Correia et al., 2008; Rudolf, Bittins, & Gerdes, 2011). Furthermore, in our previous study, we observed a decreased interaction of GluN2B with myosin-Va in hippocampus of spinophilin KO mice (Salek et al., 2019), which, when taken together with decreases in GluN2B in the S2 fraction, may suggest decreased association of GluN2B with synaptic vesicle membranes in spinophilin KO mice. While we previously found that PP1 association with GluN2B was increased and phosphorylation at Ser-1284 was decreased in spinophilin KO mice; however, other sites on GluN2B, such as Ser-929/930, Ser-1050, and Ser-1303 were not regulated by PP1 and spinophilin (Salek et al., 2019). However, additional sites on GluN2B could modulate interactions with vesicle trafficking proteins. For instance, previous studies have found that phosphorylation at Ser-1323 on GluN2B can enhance NMDA currents; however, if it modulates NMDA receptor trafficking is unclear (Liao et al., 2001). Additionally, Ser-1480 which is a PP1 site within the PDZ ligand and maintains GluN2B at extrasynaptic sites in the membrane (Chiu et al., 2019), may modulate interactions with vesicle trafficking proteins. However, if and/or how loss of spinophilin impacts Ser-1323 or Ser-1480 phosphorylation is unknown. It is unclear why global spinophilin KO mice have increased relative (to protein abundance) surface expression of GluN2B and GluA2, but not GluN1 or GluN2A. As GluN1 is an obligate subunit of the NMDAR, one may expect any increases in GluN2B surface expression to show increases in GluN1 as well. However, at the age tested (~4 weeks postnatal) the switch from GluN2B to GluN2A is nearly complete (McKay et al., 2018), suggesting more GluN2A than GluN2B at this age. Additionally, other GluN2 subunits such as GluN2C and GluN2D may be present. Therefore, we may observe increased GluN2B without a change in GluN1 levels. In addition to GluN2B, spinophilin may impact vesicle trafficking and protein phosphorylation which could modulate how these proteins interact with GluN2B. Therefore, future studies need to delineate if spinophilin specifically modulates GluN2B targeting to endocytic vesicles and the mechanisms by which it does this.
The first studies of global spinophilin knockout mice suggested that global loss of spinophilin decreased hippocampal size (Feng et al., 2000). Moreover, previous studies demonstrated that global spinophilin knockout mice do not undergo hippocampal long-term depression synaptic plasticity (LTD) but had normal hippocampal long-term potentiation synaptic plasticity (LTP) (Feng et al., 2000). Moreover, in the striatum of young (P15) mice, there was an increase in spine density in the spinophilin KO mice (Feng et al., 2000). However, other studies using cultured hippocampal knockdown of spinophilin showed a decrease in dendritic spine density (Evans, Robinson, Shi, & Webb, 2015). Therefore, spinophilin may have actions on spine density and synaptic protein expression. Consistent with this, we show that global spinophilin knockout mice have a slight, but significant (~18%) decreased protein expression in the membrane-associated (S2) fraction and a robust (~43%) decreased protein expression in the synaptic fraction without a change in total protein expression. These data, taken together suggest that loss of spinophilin may decrease hippocampal size by decreasing synaptic and potentially membrane-associated protein expression. Moreover, we observed decreases in NMDAR subunits in the S3 fraction of spinophilin KO compared to WT mice when not normalizing to the total protein stain. However, these decreases were lost when normalizing to total protein again suggesting a decrease in global synaptic protein expression in the spinophilin KO mice. It is important to note that while ponceau stain is linear, its dynamic range is not as robust as immunoblotting using infrared dyes (Gustin et al., 2011). This caveat should be considered when evaluating the normalization of individual proteins to ponceau stain in the S3 fraction. Therefore, global loss of spinophilin decreases synaptic protein expression globally, but may slightly increase the ratio of GluN2A compared to GluN2B within this fraction. Interestingly, as GluN2B is expressed early in postnatal development, GluN2B-containing synapses are thought to be more immature(Acutain et al., 2021; Pousinha et al., 2017), and our data demonstrating decreased synaptic protein expression in spinophilin KO mice are consistent with this immature state. In our studies, we have found that loss of spinophilin may enhance GluN2B-containing NMDAR function. NMDAR-dependent hippocampal LTP and LTD require increased or decreased AMPAR insertion, respectively (Sumi & Harada, 2020). One may posit that loss of spinophilin may maintain GluN2B-containing NMDARs at the cell surface which promotes their activity and limits the internalization of AMPARs, thus decreasing LTD. While we found that spinophilin binding to PP1 was required for decreased GluN2B-containing NMDAR activity in Neuro2A cells, previous studies have found that spinophilin targeting of PP1 may not be required for hippocampal plasticity. Of note, Xia and colleagues found that overexpression of a PP1 binding-deficient mutant of spinophilin in cultured hippocampal neurons, did not impact LTD (Gao, Hu, Yang, & Xia, 2018). However, the overexpression of the spinophilin homologue, neurabin, did impact hippocampal LTD. While these data may suggest that spinophilin targeting of PP1 in the hippocampus may be dispensable for LTD, it is important to note that these studies utilized overexpression and cultured neurons and that the in vivo regulation of NMDAR-dependent LTD may be different and require PP1 targeting by spinophilin or other aspects of spinophilin that are independent of PP1 function (such as actin bundling) may be responsible for modulating GluN2B localization in vivo. Moreover, global spinophilin knockout impacts loss of spinophilin from birth, therefore future studies will need to leverage our recently generated and validated conditional spinophilin knockout mice (Cameron W. Morris et al.) to delineate if loss of spinophilin specifically in the hippocampus post-development impacts hippocampal LTD or if rescue of WT or PP1 binding-deficient spinophilin in the hippocampus restores LTD will help answer some of these questions.
Excessive calcium influx through GluN2B-containing NMDARs during glutamate toxicity plays an important role in activation of apoptotic pathways. Given that 1) excessive calcium influx can activate caspase cleavage and links to apoptosis (Affaticati et al., 2011; Sanelli et al., 2007), 2) GluN2B-containing NMDARs in general (Li, Shao, Vanden Hoek, & Brorson, 2007; Liu et al., 2007; Wei, Fiskum, Rosenthal, & Perry, 1997; Werling, Jacocks, Rosenthal, & Fiskum, 1993) 3) and Ser-1284 phosphorylation, specifically, are associated with pathological changes that lead to activation of apoptotic pathways and/or cellular toxicity (Ai et al., 2017; Li et al., 2007; Lu et al., 2015; Wei et al., 1997; Werling et al., 1993), 4) that spinophilin can decrease the GluN2B containing-NMDAR surface expression, and 5) that previous studies have linked spinophilin expression to neuroprotection and maintenance of hippocampal size (Allen et al., 1997; Barui et al., 2020; Feng et al., 2000), we hypothesized that spinophilin may play a neuroprotective role. We observed greater caspase 3 cleavage in stressed hippocampal cultures isolated from spinophilin KO compared to WT mice. This effect was not due to acute activation of glutamate receptors as addition of glutamate to the stressor did not increase the activation of caspase-3, nor did AP5 block the effect. Therefore, mechanistically, it is unclear why spinophilin KO mice are more susceptible to these perturbations. It is important to note that spinophilin was only weakly detected and had high levels of non-specific binding in the hippocampal cultures, consistent with a low level of expression during embryonic and early postnatal development, at least in cortex (Allen et al., 1997), which may also explain why loss of spinophilin does not dramatically increase the levels of cleaved caspase. The subcellular localization of NMDAR subunits, specifically the GluN2B subunit, plays an important role in defining the downstream signaling pathways upon activation of NMDA receptor. Specifically, activation of synaptic GluN2B-containing NMDARs is tied to pro-survival pathways while activation of extrasynaptic GluN2B NMDARs is more linked to pro-death pathways (Forder & Tymianski, 2009; Hardingham & Bading, 2002, 2010; Hardingham, Fukunaga, & Bading, 2002); therefore, regulation of glutamate receptor activity may induce complex changes depending on where the receptors are localized, which may activate both pro and anti-apoptotic pathways. It is unclear how spinophilin modulates NMDAR subcellular localization and if these changes directly link to the observed increases in caspase-3 cleavage. In our crude subcellular fractionation results, we found that there is a decrease in the localization of GluN2B in the S2 fraction which may include the extrasynaptic and/or vesicle fraction, with no significant change in the synaptic fraction. In contrast we observed increases in GluN2A in the synaptic fraction. Activation of extrasynaptic NMDARs is associated with pro-survival pathways, which is the opposite of our observations with the caspase data which show that the spinophilin KO hippocampal cultures are more susceptible to caspase 3 cleavage, a marker of apoptosis. However, as we performed a crude fractionation, this fraction also may include synaptic vesicle membranes and therefore, this decrease may be due to decreases in glutamate receptors on internalized vesicles rather than extrasynaptic GluN2B receptors. Future studies will require more sensitive high-resolution microscopy or biochemical analyses to detail how spinophilin regulates GluN2B and other NMDAR subunit localization in specific subcellular fractions. However, these data are the first to demonstrate that hippocampal cultures isolated from spinophilin KO mice have more caspase-3 cleavage, potentially explaining why these animals have smaller hippocampi compared to WT animals (Allen et al., 1997; Feng et al., 2000). Future studies will need to determine if spinophilin-dependent regulation of GluN2B containing NMDARs is sufficient to promote the increases in caspase-3 cleavage observed in the neuronal cultures as well as measure other markers of apoptosis and other forms of toxicity such as necrosis. We observed increased GluA2 in slice biotinylation studies from spinophilin KO mice. It is unclear if there is any unique regulation of the surface expression of the edited or unedited form of GluA2. As GluA2 in its unedited (i.e. calcium-permeable) form is toxic (Mahajan & Ziff, 2007), it is possible that the spinophilin-dependent increase in surface GluA2 may enhance activity-dependent apoptosis/cellular death if a component of that increased surface GluA2 is the unedited form and future studies will need to evaluate how loss of spinophilin impacts GluA2 and other AMPA receptors specifically.
Supplementary Material
Acknowledgements:
We thank Dr. Brady Atwood, Department of Pharmacology and Toxicology, Indiana University School of Medicine for critical evaluation of an early version of the manuscript.
Funding Statement:
Support for these studies comes from R33DA041876 and Department of Biology/School of Science at IUPUI, Department of Pharmacology and Toxicology Startup Funds, Strategic Research Initiative Funds (Indiana University School of Medicine and Stark Neurosciences Research Institute) (AJB). These studies were also supported by Stark Neurosciences Research Institute, Eli Lilly and Company, and by the Indiana Clinical and Translational Sciences Institute via a Pre-doctoral fellowship to ABS, funded in part by grant # UL1TR001108 from the National Institutes of Health, National Center for Advancing Translational Sciences.
Footnotes
Conflict of interest: The Author’s declare no conflicts of interest associated with these studies. The content is solely the responsibility of the authors and does not necessarily represent the official views of the National Institutes of Health.
Data Availability:
The data that support the findings of this study are available from the corresponding author upon reasonable request.
REFERENCES
- Acutain MF, Griebler Luft J, Vazquez CA, Popik B, Cercato MC, Epstein A, . . . Baez MV (2021). Reduced Expression of Hippocampal GluN2A-NMDAR Increases Seizure Susceptibility and Causes Deficits in Contextual Memory. Front Neurosci, 15, 644100. doi: 10.3389/fnins.2021.644100 [DOI] [PMC free article] [PubMed] [Google Scholar]
- Affaticati P, Mignen O, Jambou F, Potier MC, Klingel-Schmitt I, Degrouard J, . . . Cohen-Kaminsky S (2011). Sustained calcium signalling and caspase-3 activation involve NMDA receptors in thymocytes in contact with dendritic cells. Cell Death Differ, 18(1), 99–108. doi: 10.1038/cdd.2010.79 [DOI] [PMC free article] [PubMed] [Google Scholar]
- Ai H, Shi XF, Hu XP, Fang WQ, Zhang B, & Lu W (2017). Acute stress regulates phosphorylation of N-methyl-d-aspartate receptor GluN2B at S1284 in hippocampus. Neuroscience, 351, 24–35. doi: 10.1016/j.neuroscience.2017.03.029 [DOI] [PubMed] [Google Scholar]
- Allen PB, Ouimet CC, & Greengard P (1997). Spinophilin, a novel protein phosphatase 1 binding protein localized to dendritic spines. Proc Natl Acad Sci U S A, 94(18), 9956–9961. [DOI] [PMC free article] [PubMed] [Google Scholar]
- Allen PB, Zachariou V, Svenningsson P, Lepore AC, Centonze D, Costa C, . . . Greengard P (2006). Distinct roles for spinophilin and neurabin in dopamine-mediated plasticity. Neuroscience, 140(3), 897–911. [DOI] [PubMed] [Google Scholar]
- Anegawa NJ, Lynch DR, Verdoorn TA, & Pritchett DB (1995). Transfection of N-methyl-D-aspartate receptors in a nonneuronal cell line leads to cell death. J Neurochem, 64(5), 2004–2012. doi: 10.1046/j.1471-4159.1995.64052004.x [DOI] [PubMed] [Google Scholar]
- Bansal R, Engle SE, Antonellis PJ, Whitehouse LS, Baucum AJ 2nd, Cummins TR, . . . Berbari NF (2019). Hedgehog Pathway Activation Alters Ciliary Signaling in Primary Hypothalamic Cultures. Front Cell Neurosci, 13, 266. doi: 10.3389/fncel.2019.00266 [DOI] [PMC free article] [PubMed] [Google Scholar]
- Barui AK, Jhelum P, Nethi SK, Das T, Bhattacharya D, B V, . . . Patra CR (2020). Potential Therapeutic Application of Zinc Oxide Nanoflowers in the Cerebral Ischemia Rat Model through Neuritogenic and Neuroprotective Properties. Bioconjug Chem, 31(3), 895–906. doi: 10.1021/acs.bioconjchem.0c00030 [DOI] [PubMed] [Google Scholar]
- Baucum AJ 2nd, Brown AM, & Colbran RJ (2013). Differential association of postsynaptic signaling protein complexes in striatum and hippocampus. J Neurochem, 124(4), 490–501. doi: 10.1111/jnc.12101 [DOI] [PMC free article] [PubMed] [Google Scholar]
- Cao M, Xu J, Shen C, Kam C, Huganir RL, & Xia J (2007). PICK1-ICA69 heteromeric BAR domain complex regulates synaptic targeting and surface expression of AMPA receptors. J Neurosci, 27(47), 12945–12956. doi: 10.1523/JNEUROSCI.2040-07.2007 [DOI] [PMC free article] [PubMed] [Google Scholar]
- Chen TW, Wardill TJ, Sun Y, Pulver SR, Renninger SL, Baohan A, . . . Kim DS (2013). Ultrasensitive fluorescent proteins for imaging neuronal activity. Nature, 499(7458), 295–300. doi: 10.1038/nature12354 [DOI] [PMC free article] [PubMed] [Google Scholar]
- Chiu AM, Wang J, Fiske MP, Hubalkova P, Barse L, Gray JA, & Sanz-Clemente A (2019). NMDAR-Activated PP1 Dephosphorylates GluN2B to Modulate NMDAR Synaptic Content. Cell Rep, 28(2), 332–341 e335. doi: 10.1016/j.celrep.2019.06.030 [DOI] [PMC free article] [PubMed] [Google Scholar]
- Colbran RJ, Bass MA, McNeill RB, Bollen M, Zhao S, Wadzinski BE, & Strack S (1997). Association of brain protein phosphatase 1 with cytoskeletal targeting/regulatory subunits. J Neurochem, 69(3), 920–929. [DOI] [PubMed] [Google Scholar]
- Collett VJ, & Collingridge GL (2004). Interactions between NMDA receptors and mGlu5 receptors expressed in HEK293 cells. Br J Pharmacol, 142(6), 991–1001. doi: 10.1038/sj.bjp.0705861 [DOI] [PMC free article] [PubMed] [Google Scholar]
- Correia SS, Bassani S, Brown TC, Lise MF, Backos DS, El-Husseini A, . . . Esteban JA (2008). Motor protein-dependent transport of AMPA receptors into spines during long-term potentiation. Nat Neurosci, 11(4), 457–466. doi: 10.1038/nn2063 [DOI] [PubMed] [Google Scholar]
- Edler MC, Salek AB, Watkins DS, Kaur H, Morris CW, Yamamoto BK, & Baucum AJ 2nd (2018). Mechanisms Regulating the Association of Protein Phosphatase 1 with Spinophilin and Neurabin. ACS Chem Neurosci, 9(11), 2701–2712. doi: 10.1021/acschemneuro.8b00144 [DOI] [PMC free article] [PubMed] [Google Scholar]
- Evans JC, Robinson CM, Shi M, & Webb DJ (2015). The guanine nucleotide exchange factor (GEF) Asef2 promotes dendritic spine formation via Rac activation and spinophilin-dependent targeting. J Biol Chem, 290(16), 10295–10308. doi: 10.1074/jbc.M114.605543 [DOI] [PMC free article] [PubMed] [Google Scholar]
- Feng J, Yan Z, Ferreira A, Tomizawa K, Liauw JA, Zhuo M, . . . Greengard P (2000). Spinophilin regulates the formation and function of dendritic spines. Proc Natl Acad Sci U S A, 97(16), 9287–9292. [DOI] [PMC free article] [PubMed] [Google Scholar]
- Forder JP, & Tymianski M (2009). Postsynaptic mechanisms of excitotoxicity: Involvement of postsynaptic density proteins, radicals, and oxidant molecules. Neuroscience, 158(1), 293–300. doi: 10.1016/j.neuroscience.2008.10.021 [DOI] [PubMed] [Google Scholar]
- Furukawa H, Singh SK, Mancusso R, & Gouaux E (2005). Subunit arrangement and function in NMDA receptors. Nature, 438(7065), 185–192. doi: 10.1038/nature04089 [DOI] [PubMed] [Google Scholar]
- Gabriel LR, Wu S, & Melikian HE (2014). Brain slice biotinylation: an ex vivo approach to measure region-specific plasma membrane protein trafficking in adult neurons. J Vis Exp(86). doi: 10.3791/51240 [DOI] [PMC free article] [PubMed] [Google Scholar]
- Gao J, Hu XD, Yang H, & Xia H (2018). Distinct Roles of Protein Phosphatase 1 Bound on Neurabin and Spinophilin and Its Regulation in AMPA Receptor Trafficking and LTD Induction. Mol Neurobiol, 55(9), 7179–7186. doi: 10.1007/s12035-018-0886-2 [DOI] [PMC free article] [PubMed] [Google Scholar]
- Green T, Rogers CA, Contractor A, & Heinemann SF (2002). NMDA receptors formed by NR1 in Xenopus laevis oocytes do not contain the endogenous subunit XenU1. Mol Pharmacol, 61(2), 326–333. doi: 10.1124/mol.61.2.326 [DOI] [PubMed] [Google Scholar]
- Guo Z, Li HL, Cao Z, Suo ZW, Yang X, & Hu XD (2019). Spinophilin negatively controlled the function of transient receptor potential vanilloid 1 in dorsal root ganglia neurons of mice. Eur J Pharmacol, 863, 172700. doi: 10.1016/j.ejphar.2019.172700 [DOI] [PubMed] [Google Scholar]
- Gustin RM, Shonesy BC, Robinson SL, Rentz TJ, Baucum AJ 2nd, Jalan-Sakrikar N, . . . Colbran RJ (2011). Loss of Thr286 phosphorylation disrupts synaptic CaMKIIalpha targeting, NMDAR activity and behavior in pre-adolescent mice. Mol Cell Neurosci, 47(4), 286–292. doi:S1044-7431(11)00112-6 [pii] 10.1016/j.mcn.2011.05.006 [DOI] [PMC free article] [PubMed] [Google Scholar]
- Hardingham GE, & Bading H (2002). Coupling of extrasynaptic NMDA receptors to a CREB shut-off pathway is developmentally regulated. Biochim Biophys Acta, 1600(1–2), 148–153. doi: 10.1016/s1570-9639(02)00455-7 [DOI] [PubMed] [Google Scholar]
- Hardingham GE, & Bading H (2010). Synaptic versus extrasynaptic NMDA receptor signalling: implications for neurodegenerative disorders. Nat Rev Neurosci, 11(10), 682–696. doi: 10.1038/nrn2911 [DOI] [PMC free article] [PubMed] [Google Scholar]
- Hardingham GE, Fukunaga Y, & Bading H (2002). Extrasynaptic NMDARs oppose synaptic NMDARs by triggering CREB shut-off and cell death pathways. Nat Neurosci, 5(5), 405–414. doi: 10.1038/nn835 [DOI] [PubMed] [Google Scholar]
- Hiday AC, Edler MC, Salek AB, Morris CW, Thang M, Rentz TJ, . . . Baucum AJ 2nd (2017). Mechanisms and Consequences of Dopamine Depletion-Induced Attenuation of the Spinophilin/Neurofilament Medium Interaction. Neural Plast, 2017, 4153076. doi: 10.1155/2017/4153076 [DOI] [PMC free article] [PubMed] [Google Scholar]
- Hsieh-Wilson LC, Allen PB, Watanabe T, Nairn AC, & Greengard P (1999). Characterization of the neuronal targeting protein spinophilin and its interactions with protein phosphatase-1. Biochemistry, 38(14), 4365–4373. [DOI] [PubMed] [Google Scholar]
- Li D, Shao Z, Vanden Hoek TL, & Brorson JR (2007). Reperfusion accelerates acute neuronal death induced by simulated ischemia. Exp Neurol, 206(2), 280–287. doi: 10.1016/j.expneurol.2007.05.017 [DOI] [PMC free article] [PubMed] [Google Scholar]
- Liao GY, Wagner DA, Hsu MH, & Leonard JP (2001). Evidence for direct protein kinase-C mediated modulation of N-methyl-D-aspartate receptor current. Mol Pharmacol, 59(5), 960–964. doi: 10.1124/mol.59.5.960 [DOI] [PubMed] [Google Scholar]
- Liu Y, Wong TP, Aarts M, Rooyakkers A, Liu L, Lai TW, . . . Wang YT (2007). NMDA receptor subunits have differential roles in mediating excitotoxic neuronal death both in vitro and in vivo. J Neurosci, 27(11), 2846–2857. doi: 10.1523/JNEUROSCI.0116-07.2007 [DOI] [PMC free article] [PubMed] [Google Scholar]
- Lu W, Ai H, Peng L, Wang JJ, Zhang B, Liu X, & Luo JH (2015). A novel phosphorylation site of N-methyl-D-aspartate receptor GluN2B at S1284 is regulated by Cdk5 in neuronal ischemia. Exp Neurol, 271, 251–258. doi: 10.1016/j.expneurol.2015.06.016 [DOI] [PubMed] [Google Scholar]
- Maekawa F, Tsuboi T, Fukuda M, & Pellerin L (2009). Regulation of the intracellular distribution, cell surface expression, and protein levels of AMPA receptor GluR2 subunits by the monocarboxylate transporter MCT2 in neuronal cells. J Neurochem, 109(6), 1767–1778. doi: 10.1111/j.1471-4159.2009.06100.x [DOI] [PubMed] [Google Scholar]
- Mahajan SS, & Ziff EB (2007). Novel toxicity of the unedited GluR2 AMPA receptor subunit dependent on surface trafficking and increased Ca2+-permeability. Mol Cell Neurosci, 35(3), 470–481. doi: 10.1016/j.mcn.2007.04.006 [DOI] [PMC free article] [PubMed] [Google Scholar]
- Man HY (2011). GluA2-lacking, calcium-permeable AMPA receptors--inducers of plasticity? Curr Opin Neurobiol, 21(2), 291–298. doi: 10.1016/j.conb.2011.01.001 [DOI] [PMC free article] [PubMed] [Google Scholar]
- McKay S, Ryan TJ, McQueen J, Indersmitten T, Marwick KFM, Hasel P, . . . Komiyama NH (2018). The Developmental Shift of NMDA Receptor Composition Proceeds Independently of GluN2 Subunit-Specific GluN2 C-Terminal Sequences. Cell Rep, 25(4), 841–851 e844. doi: 10.1016/j.celrep.2018.09.089 [DOI] [PMC free article] [PubMed] [Google Scholar]
- Morris CW, Watkins DS, Salek AB, Edler MC, & Baucum AJ 2nd (2018). The association of spinophilin with disks large-associated protein 3 (SAPAP3) is regulated by metabotropic glutamate receptor (mGluR) 5. Mol Cell Neurosci, 90, 60–69. doi: 10.1016/j.mcn.2018.06.001 [DOI] [PMC free article] [PubMed] [Google Scholar]
- Morris CW, Watkins DS, Shah NR, Pennington T, Hens B, Qi G, . . . Baucum AJ II. Spinophilin limits metabotropic glutamate receptor 5 scaffolding to the postsynaptic density and cell type-specifically mediates excessive grooming. Biol Psychiatry. doi: 10.1016/j.biopsych.2022.12.008 [DOI] [PMC free article] [PubMed] [Google Scholar]
- Murphy JA, Stein IS, Lau CG, Peixoto RT, Aman TK, Kaneko N, . . . Zukin RS (2014). Phosphorylation of Ser1166 on GluN2B by PKA is critical to synaptic NMDA receptor function and Ca2+ signaling in spines. J Neurosci, 34(3), 869–879. doi: 10.1523/JNEUROSCI.4538-13.2014 [DOI] [PMC free article] [PubMed] [Google Scholar]
- Paoletti P, Bellone C, & Zhou Q (2013). NMDA receptor subunit diversity: impact on receptor properties, synaptic plasticity and disease. Nat Rev Neurosci, 14(6), 383–400. doi: 10.1038/nrn3504 [DOI] [PubMed] [Google Scholar]
- Pousinha PA, Mouska X, Raymond EF, Gwizdek C, Dhib G, Poupon G, . . . Marie H (2017). Physiological and pathophysiological control of synaptic GluN2B-NMDA receptors by the C-terminal domain of amyloid precursor protein. Elife, 6. doi: 10.7554/eLife.25659 [DOI] [PMC free article] [PubMed] [Google Scholar]
- Priya A, Johar K, Nair B, & Wong-Riley MT (2014). Nuclear respiratory factor 2 regulates the transcription of AMPA receptor subunit GluA2 (Gria2). Biochim Biophys Acta, 1843(12), 3018–3028. doi: 10.1016/j.bbamcr.2014.09.006 [DOI] [PMC free article] [PubMed] [Google Scholar]
- Ragusa MJ, Dancheck B, Critton DA, Nairn AC, Page R, & Peti W (2010). Spinophilin directs protein phosphatase 1 specificity by blocking substrate binding sites. Nat Struct Mol Biol, 17(4), 459–464. doi:nsmb.1786 [pii] 10.1038/nsmb.1786 [DOI] [PMC free article] [PubMed] [Google Scholar]
- Rudolf R, Bittins CM, & Gerdes HH (2011). The role of myosin V in exocytosis and synaptic plasticity. J Neurochem, 116(2), 177–191. doi: 10.1111/j.1471-4159.2010.07110.x [DOI] [PubMed] [Google Scholar]
- Salek AB, Edler MC, McBride JP, & Baucum AJ 2nd (2019). Spinophilin regulates phosphorylation and interactions of the GluN2B subunit of the N-methyl-d-aspartate receptor. J Neurochem, 151(2), 185–203. doi: 10.1111/jnc.14831 [DOI] [PMC free article] [PubMed] [Google Scholar]
- Sanelli T, Ge W, Leystra-Lantz C, & Strong MJ (2007). Calcium mediated excitotoxicity in neurofilament aggregate-bearing neurons in vitro is NMDA receptor dependant. J Neurol Sci, 256(1–2), 39–51. doi: 10.1016/j.jns.2007.02.018 [DOI] [PubMed] [Google Scholar]
- Soloviev MM, & Barnard EA (1997). Xenopus oocytes express a unitary glutamate receptor endogenously. J Mol Biol, 273(1), 14–18. doi: 10.1006/jmbi.1997.1272 [DOI] [PubMed] [Google Scholar]
- Sumi T, & Harada K (2020). Mechanism underlying hippocampal long-term potentiation and depression based on competition between endocytosis and exocytosis of AMPA receptors. Sci Rep, 10(1), 14711. doi: 10.1038/s41598-020-71528-3 [DOI] [PMC free article] [PubMed] [Google Scholar]
- Tavalin SJ, & Colbran RJ (2017). CaMKII-mediated phosphorylation of GluN2B regulates recombinant NMDA receptor currents in a chloride-dependent manner. Mol Cell Neurosci, 79, 45–52. doi: 10.1016/j.mcn.2016.12.002 [DOI] [PMC free article] [PubMed] [Google Scholar]
- Tu W, Xu X, Peng L, Zhong X, Zhang W, Soundarapandian MM, . . . Lu Y (2010). DAPK1 interaction with NMDA receptor NR2B subunits mediates brain damage in stroke. Cell, 140(2), 222–234. doi: 10.1016/j.cell.2009.12.055 [DOI] [PMC free article] [PubMed] [Google Scholar]
- Watkins DS, True JD, Mosley AL, & Baucum AJ (2019). Correction: Baucum II, Anthony J. et al. Proteomic Analysis of the Spinophilin Interactome in Rodent Striatum Following Psychostimulant Sensitization. Proteomes 2018, 6, 53. Proteomes, 7(1). doi: 10.3390/proteomes7010007 [DOI] [PMC free article] [PubMed] [Google Scholar]
- Watkins DS, True JD, Mosley AL, & Baucum AJ 2nd (2018). Proteomic Analysis of the Spinophilin Interactome in Rodent Striatum Following Psychostimulant Sensitization. Proteomes, 6(4). doi: 10.3390/proteomes6040053 [DOI] [PMC free article] [PubMed] [Google Scholar]
- Wei H, Fiskum G, Rosenthal RE, & Perry DC (1997). Global cerebral ischemia and reperfusion alters NMDA receptor binding in canine brain. Mol Chem Neuropathol, 30(1–2), 25–39. doi: 10.1007/BF02815148 [DOI] [PubMed] [Google Scholar]
- Werling LL, Jacocks HM 3rd, Rosenthal RE, & Fiskum G (1993). Dopamine release from canine striatum following global cerebral ischemia/reperfusion. Brain Res, 606(1), 99–105. doi: 10.1016/0006-8993(93)91575-d [DOI] [PubMed] [Google Scholar]
- Williams K, Russell SL, Shen YM, & Molinoff PB (1993). Developmental switch in the expression of NMDA receptors occurs in vivo and in vitro. Neuron, 10(2), 267–278. doi: 10.1016/0896-6273(93)90317-k [DOI] [PubMed] [Google Scholar]
- Wu Y, Chen C, Yang Q, Jiao M, & Qiu S (2017). Endocytosis of GluN2B-containing NMDA receptors mediates NMDA-induced excitotoxicity. Mol Pain, 13, 1744806917701921. doi: 10.1177/1744806917701921 [DOI] [PMC free article] [PubMed] [Google Scholar]
- Yan Z, Hsieh-Wilson L, Feng J, Tomizawa K, Allen PB, Fienberg AA, . . . Greengard P (1999). Protein phosphatase 1 modulation of neostriatal AMPA channels: regulation by DARPP-32 and spinophilin. Nat Neurosci, 2(1), 13–17. [DOI] [PubMed] [Google Scholar]
Associated Data
This section collects any data citations, data availability statements, or supplementary materials included in this article.
Supplementary Materials
Data Availability Statement
The data that support the findings of this study are available from the corresponding author upon reasonable request.