

Abstract
Osteoarthritis (OA) is a degenerative joint disease characterized by changes in cartilage and subchondral bone. To date, there are no available drugs that can counteract the progression of OA, partly due to the inadequacy of current models to recapitulate the relevant cellular complexity. In this study, an osteochondral microfluidic model is developed using human primary cells to mimic an OA‐like microenvironment and this study validates it as a drug testing platform. In the model, the cartilage compartment is created by embedding articular chondrocytes in fibrin hydrogel while the bone compartment is obtained by embedding osteoblasts, osteoclasts, endothelial cells, and mesenchymal stem cells in a fibrin hydrogel enriched with calcium phosphate nanoparticles. After developing and characterizing the model, Interleukin‐1β is applied to induce OA‐like conditions. Subsequently, the model potential is evaluated as a drug testing platform by assessing the effect of two anti‐inflammatory drugs (Interleukin‐1 Receptor antagonist and Celecoxib) on the regulation of inflammation‐ and matrix degradation‐related markers. The model responded to inflammation and demonstrated differences in drug efficacy. Finally, it compares the behavior of the “Cartilage” and “Cartilage+Bone” models, emphasizing the necessity of incorporating both cartilage and bone compartments to capture the complex pathophysiology of OA.
Keywords: drug testing, inflammation, microfluidics, osteoarthritis, osteochondral
This study describes the creation of an osteochondral microfluidic model using primary human cells to investigate osteoarthritis (OA). The model features distinct cartilage and bone compartments, where OA‐like conditions are induced by Interleukin‐1β. The platform is validated by testing two anti‐inflammatory drugs, Interleukin‐1 Receptor antagonist and Celecoxib, as a promising tool for drug testing and OA research.
![]()
1. Introduction
Osteoarthritis (OA) stands as a prevalent and incapacitating joint disease, imposing substantial socioeconomic burdens worldwide. While OA was traditionally regarded as a degenerative condition primarily driven by cartilage wear, emerging evidence of changes in other joint components has led to a broader understanding of it as a multifaceted inflammatory disease. In addition, extensive evidence supports the notion of active communication between cartilage and the underlying bone,[ 1 ] which is now recognized as a central player in OA development.[ 2 ] This communication extends beyond passive diffusion, becoming more pronounced under osteoarthritic conditions due to increased vascularity and the presence of micro‐cracks in the cartilage.[ 3 ]
Existing treatments mainly target symptoms rather than halting disease progression, partly due to limitations in preclinical models. While tissue explants and simplified in vitro systems have advanced our understanding of OA, they often fail to replicate multi‐tissue interactions.[ 4 , 5 ] Animal models, though used, struggle to translate to human conditions and raise ethical concerns.
In response to these challenges, relevant models that reflect the interplay between multiple tissues are needed to explore OA dynamics and test innovative therapeutics as outlined in multiple reviews.[ 6 , 7 ] Miniaturized 3D models, such as organ‐on‐chips, have emerged as a promising solution to culture multiple cell types within a 3D matrix, offering a means to develop complex models of the articular microenvironment in terms of biological and physical aspects.[ 8 ] These platforms offer improved simulation of the dynamic biomechanical and biochemical conditions present in osteoarthritic joints, thus providing a more accurate representation of the disease state and its progression.[ 7 , 9 ] Within this field, osteochondral models have centered either on the differentiation of bone marrow mesenchymal stem cells (BMSCs) into osteoblasts and chondrocytes within a single hydrogel[ 10 ] or on reconstructing the architecture of the osteochondral unit.[ 11 , 12 ] While oriented toward tissue engineering applications, these models do not extend to the realm of OA modeling and drug testing. Other in vitro osteochondral models, focused on OA‐related processes, exhibit a deficiency in cellular complexity as they mainly lack osteoclasts and endothelial cells.[ 13 , 14 , 15 , 16 , 17 , 18 ] The inclusion of osteoclasts and endothelial cells within the bone compartment is paramount due to their pivotal roles in bone remodeling and the need to recapitulate the vascularized characteristics of bone. Despite their significance, the integration of these cells in in vitro models has been underestimated, primarily due to the complexity associated with their use.
Herein, we employed a microfluidic device which allows generating two adjacent hydrogel‐based compartments in direct contact.[ 19 ] Our osteochondral model includes a cartilage compartment incorporating primary human articular chondrocytes embedded in fibrin hydrogel, and a bone compartment incorporating primary human osteoblasts and osteoclasts embedded in fibrin hydrogel enriched with calcium phosphate nanoparticles (CaPn) along with endothelial cells and undifferentiated BMSCs.[ 20 ] Following optimization and characterization, the osteochondral model was used to assess the effects of Interleukin‐1β (IL1β) from various perspectives, including inflammation and matrix degradation processes. The model was further validated as a potential platform for drug testing for OA by evaluating its response to Interleukin‐1 Receptor antagonist (IL1Ra) and Celecoxib.
2. Results
2.1. Model Development
The microfluidic device used in the present study[ 19 ] consists of two layers (Figure 1a) and allows the sequential injection of two hydrogels with a continuous interface without any intervening structure. As depicted in Figure 1b, while half of the channel is blocked with the bottom layer, the cartilage compartment (chondrocytes in fibrin hydrogel) is injected into the accessible portion of the channel. After fibrin polymerization, the bottom layer is removed, and the top layer is transferred onto a glass cover slip. The other half of the channel, now accessible, is filled with the bone compartment (osteoblasts, osteoclasts, endothelial cells, and BMSCs in fibrin hydrogel enriched with CaPn). After bone polymerization, the lateral channels are filled with culture medium.
Figure 1.

Generation of the osteochondral model. a) Pictures of the microfluidic chip. Images of top layer, bottom layer, and aligned under stereomicroscope. b) Schematic methodology showing the steps to inject the channels and obtain the model incorporating different cell types.
The continuous interface generated between cartilage and bone compartments is shown in Figure 2a, while the distribution of the different cell populations is displayed in Figure 2b.
Figure 2.

Model characterization. a) Phase contrast photo of the cartilage and bone interface on day 1. b) Immunofluorescence image of the complete model on day 14 showing the different cell types stained in different colors. c) Collagen II expression in the cartilage compartment comparing DMEM‐based chondrogenic medium composition and EGM2‐based chondrogenic composition. d) Expression of the transcriptional factor SOX9 in chondrocytes in the presence of DMEM‐based chondrogenic medium. e) RANK expression in osteoclasts in the presence and in the absence of MCSF and RANKL. f) RANKL expression in the bone compartment. g) BMSCs and osteoblasts contributing to RANKL expression. h) TRAP and ALP enzymatic assays showing osteoclasts and osteoblasts activity in the selected bone medium composition. i) Undifferentiated BMSCs supporting the MVN (arrow 1) or committed to osteogenic lineage (arrow 2). j) Osteocalcin expression by differentiated BMSCs (arrow 1) and pre‐embedded osteoblasts (arrow 2).
During the model optimization phase, special attention was given to the selection of appropriate chondrocyte density and medium composition for cartilage and bone compartments. Initially, we started with a chondrocyte density of 50 × 106 cells mL−1 in the cartilage compartment, which led to immediate remodeling of the fibrin hydrogel. To address this, we attempted to add the gel remodeling inhibitor aminocaproic acid to the culture medium. However, this compound was found to be toxic to the endothelial cells. Endothelial cells require the ability to remodel the gel to connect with each other and form a microvascular network (MVN). Consequently, the use of a remodeling inhibitor was not feasible. Instead, we opted to reduce the chondrocyte density to slow down the gel remodeling rate. After several adjustments, we determined that a concentration of 12.5 × 10⁶ cells mL−1 maintained the chondrocytes within the hydrogel without excessive remodeling while allowing the endothelial cells to survive, remodel the gel, and form an interconnected MVN as demonstrated in Figure S1 (Supporting Information).
Next, we focused on the composition of culture media for bone and cartilage compartments.
All experiments utilized Endothelial Cell Growth Medium‐2 (EGM2) for the first 4 days in both channels, as preliminary trials showed that, thanks to its formulation rich in Vascular Endothelial Growth Factor (VEGF), it promotes the first and crucial phase in which endothelial cells assemble into a MVN. This step is favored when using 100% EGM2 in comparison to DMEM‐based formulations or mixtures of DMEM‐based medium and EGM2 (data not shown). From day 4 to day 14, compartment‐specific medium formulations were tested and applied. For cartilage, we compared DMEM‐based and EGM2‐based chondrogenic medium. MVN features were comparable in both formulations as indicated in Figure S2 (Supporting Information). For what concerns the presence of ECM markers, we found that Collagen II expression was stronger in DMEM‐based chondrogenic medium. Of note, the use of EGM2 in the first 4 days of culture did not compromise the ability of chondrocytes to express Collagen II upon stimulation with chondrogenic factors. Additionally, the intranuclear signal of the chondrogenic transcriptional factor SOX9 was detected in the vast majority of chondrocytes, indicating their chondrogenic phenotype (Figure 2d). Therefore, DMEM‐based chondrogenic medium was used in subsequent experiments.
Regarding the bone compartment, we used a medium containing osteogenic factors to maintain osteoblast phenotype, and we verified if Macrophage Colony‐Stimulating Factor (MCSF) and Receptor Activator of Nuclear Factor‐κB Ligand (RANKL) could be excluded from the medium without compromising osteoclast phenotype. The system proved to be self‐sustaining, as osteoclasts expressed RANK and displayed similar morphology in either condition (Figure 2e). Therefore, osteogenic medium without MCSF and RANKL was used in subsequent experiments. Notably, RANKL exhibited significant expression within the bone compartment (Figure 2f), with cells displaying morphology indicative of either osteoblasts or BMSCs committed to the osteogenic lineage. By labeling BMSCs with a cell tracker, we observed that RANKL‐expressing cells consist of BMSCs (arrow 1) and unstained cells representing osteoblasts (arrow 2), as shown in Figure 2g.
The assessment of the enzymatic activities of Tartrate‐Resistant Acid Phosphatase (TRAP) and Alkaline Phosphatase (ALP) confirmed that osteoclasts and osteoblasts are functionally active in this specific bone medium composition (Figure 2h). As expected, the signals for ALP and TRAP were detected only in the bone compartment.
Experiments where undifferentiated BMSCs were stained with a cell tracker (Figure 2i) showed that some BMSCs aligned with vessel structures (arrow 1), akin to mural cells supporting the MVN, while others (arrow 2) differentiated toward the osteogenic lineage. Indeed, the expression of Osteocalcin (OCN) by some BMSCs (Figure 2j) demonstrated their commitment to the osteogenic lineage (arrow 1), influenced by the bone medium. Notably, the OCN signal was also observed in cells not colocalized with the white signal (arrow 2), indicating the presence and functionality of osteoblasts. Due to the high density of the images related to RANKL and OCN, separate fluorescence channels are presented individually in Figure S3 (Supporting Information) for clarity.
To take a deeper look at the formation and characterization of the MVN, we tracked the self‐assembly of endothelial cells into an MVN over time, as shown in Figure 3a. A 3D render illustrating the presence and stability of an interconnected MVN until day 14 is presented in Figure 3b. PECAM‐1 staining was performed to visualize MVN morphology, highlighting the endothelial cell organization within the MVN (Figure 3c). The presence of supporting cells resembling smooth muscle cells, primarily derived from BMSCs and contributing to the structural integrity of the MVN, was demonstrated by αSMA expression (Figure 3d). Collagen IV staining allowed for the visualization of the basement membrane surrounding the MVN, crucial for maintaining vascular integrity and function as depicted in Figure 3e. Moreover, Collagen I, a typical component of bone matrix was found to increase as the model matured. Interestingly, by day 7, Collagen I deposition was notable around the MVN, and its enrichment within the entire bone compartment was evident by day 14 (Figure 3f), suggesting ongoing maturation and remodeling processes within the model. Although the signal for Collagen I specifically at day 14 might appear blurry and diffuse, it is consistent with expectations for ECM markers within a 3D hydrogel matrix.[ 21 , 22 ] Collagen I is abundantly present in the ECM, leading to extensive antibody binding and a widespread staining pattern. The differences in staining intensity between day 1 and day 14 further confirms that the staining reflects the dense presence of Collagen I within the matrix rather than background noise.
Figure 3.

MVN formation and characterization. a) Self‐assembly of the endothelial cells and formation of MVN over the course of 14 days. b) A 3D render of the MVN on day 14. c) PECAM‐1 staining and its colocalization with GFP‐Human Umbilical Vein Endothelial cells (GFP‐EC) on day 14. d) Expression of αSMA by MVN supporting cells on day 14. e) Collagen IV expression around the MVN on day 14. f) Expression of Collagen I in the model at different time points.
2.2. Model Response to IL1β
To establish an OA microenvironment, we challenged the model with IL1β, a key cytokine implicated in OA pathogenesis and progression. We subsequently examined the expression of MMP9 and MMP13, two pivotal matrix metalloproteinases (MMPs) associated with OA. A baseline expression of both markers was evident in the control group (CTRL), primarily localized within the osteoclasts, in the complete system (Figure 4 ). Following IL1β treatment, not only did bone cells exhibit upregulation of MMP9 and MMP13, but chondrocytes also displayed increased expression of these markers. Upon removing osteoclasts from the system (No OCs), MMP9 was undetectable in control conditions, while MMP13 was still detectable in the other bone cells. We also examined MMP expression upon osteoblast removal (No OBs). Our observations revealed that not only did fewer osteoclasts express MMPs, but the signal intensity was also diminished compared to the complete system both in control and in IL1β conditions.
Figure 4.

Expression of MMP9 and MMP13 in control (CTRL) or IL1β condition. The staining was conducted in the Complete model as well as in models without osteoclasts (No OCs) or osteoblasts (No OBs) to highlight the roles of these cells in the expression of MMPs. The white dotted line represents the interface between cartilage and bone compartments with the cartilage being the upper side.
2.3. Drug Testing
To evaluate the potential of the model for drug testing, we analyzed the system response to IL1β and to two drug treatments. IL1Ra was selected as the antagonist of IL1β receptor and Celecoxib as a selective COX‐2 inhibitor. Upon IL1β treatment, all the examined inflammation‐related genes were significantly upregulated compared to the control group (Figure 5 ). More in detail, IL1β upregulated COX2, IL1B, TNFα, and IL6, and the chemokines CXCL8 (IL8), CCL2, CCL3, and CCL5. IL1Ra showed a pronounced efficacy in attenuating the expression of all the analyzed genes, significantly downregulating COX2, IL1B, IL6 and CXCL8. Celecoxib also attenuated the expression of some genes, such as IL1B, IL6 and CXCL8, but none of the observed differences were statistically significant.
Figure 5.

Transcriptional expression profiles observed at day 14 under various treatmentsInizio modulo. a) inflammation‐related genes (n = 5) and b) chemokine genes (n = 4) in models maintained in control condition (CTRL), stimulated with IL1β (IL1β) or stimulated with IL1β and simultaneously treated with drugs (IL1β+IL1Ra and IL1β+Cel). Data are represented as mean + SD with data from independent experiments shown as black dots (*p < 0.05, **p < 0.01, and ***p < 0.001).
Subsequently, we examined genes indicative of chondrocyte phenotype, including SOX9, ACAN, and PRG4, as depicted in Figure 6a. Within our system, IL1β significantly downregulated the chondrogenic transcription factor SOX9 and matrix‐related genes, such as ACAN and PRG4. Concurrently, IL1β triggered a significant increase in COL10A1, which is associated to chondrocyte hypertrophy. Remarkably, none of the drug treatments was able to significantly counteract the impact of IL1β on chondrocyte phenotype, although some recovery was observed with IL1Ra treatment for ACAN and PRG4. Differently, the expression of COL10A1 was substantially restored by IL1Ra, whereas Celecoxib showed no effect in mitigating the hypertrophic effects of IL1β on chondrocytes.
Figure 6.

Transcriptional expression profiles observed at day 14 under various treatmentsInizio modulo. a) genes related to cartilage phenotype and hypertrophy (n = 5). b) genes related to matrix degradation enzymes and their inhibitors (n = 5) in models maintained in control condition (CTRL), stimulated with IL1β (IL1β) or stimulated with IL1β and treated with drugs (IL1β+IL1Ra and IL1β+Cel). Data are represented as mean + SD with data from independent experiments shown as black dots (*p < 0.05, **p < 0.01, and ***p < 0.001).
Turning to genes associated with matrix degradation (Figure 6b), IL1β treatment induced a significant increase in the expression of all the tested MMPs and of the aggrecanase ADAMTS5. Conversely, the expression of MMP inhibitors, namely TIMP1 and TIMP3, was downregulated by IL1β. The expression of MMP3, MMP13, and TIMP3 was restored by IL1Ra, as indicated by significant differences compared to the IL1β group. While IL1Ra also had a dampening effect on the expression of MMP1and ADAMTS5, these effects were not significantly different. Celecoxib also displayed efficacy in reducing the expression of matrix degrading enzymes, although these reductions were not statistically significant and generally were less evident compared to the effect of IL1Ra.
Subsequently, we looked into the changes of the MVN in response to IL1β and drug treatment. The width of MVN in all groups decreased from day 7 to day 14. On day 14, the MVN in the control group remained wider while IL1β‐treated samples exhibited narrower vessels. Notably, administering IL1Ra resulted in wider vessels compared to the IL1β‐treated group. Conversely, Celecoxib was not able to counteract the thinning effect of IL1β on MVN. We also quantitatively analyzed images of the MVN to corroborate these findings. The MVN area was the largest in the control group, diminishing significantly with IL1β treatment, and being partially rescued by IL1Ra. Interestingly, Celecoxib did not yield any notable change, with the MVN area remaining as low as in IL1β samples (Figure 7a).
Figure 7.
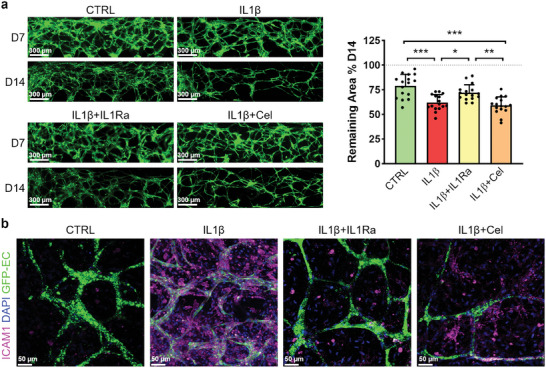
Changes of MVN upon different treatments. a) MVN morphology at day 7 and 14 and quantification of MVN area at day 14. The MVN area for each chip is normalized on its area measured at day 7 set at 100% (n = 16, 4 chips from four independent experiments were selected). Data are represented as mean + SD with data from each chip shown as a black dot (*p < 0.05, **p < 0.01, ***p < 0.001). b, Expression of ICAM‐1 in the bone compartment on day 14.
Since excessive macrophage infiltration in the synovial membrane can affect OA progression, we investigated the expression of ICAM‐1 as one of the key proteins regulating monocyte adhesion to the endothelial barrier during extravasation. In our model, IL1β substantially upregulated ICAM‐1 expression, as shown in Figure 7b. IL1Ra strongly downregulated ICAM‐1, resulting in a condition similar to that of the control group. Once again, the treatment with Celecoxib showed a milder effect, as evidenced by the presence of ICAM‐1 in endothelial cells and other bone cells.
To recapitulate, the model exhibited essential cellular responses that align with OA hallmarks, encompassing inflammation, imbalanced catabolism/anabolism, the emergence of a hypertrophic chondrocyte phenotype and changes in the vascular compartment.
2.4. Response to Inflammation and Drug Treatment in Simplified and Complete Model
To evaluate whether a simplified version of the model (Cartilage) would yield results comparable to the complete model (Cartilage+Bone), we assessed the expression of a selected group of genes in both scenarios. Our aim was to investigate whether excluding bone cells and the crosstalk between cartilage and bone would influence gene regulation under different treatments. As illustrated in Figure 8 , cartilage‐specific genes, such as SOX9 and ACAN, exhibited comparable expression levels in the Cartilage and Cartilage+Bone models, suggesting that chondrocytes in both conditions maintained a similar phenotype. Concerning the expression of genes associated with inflammation, such as COX2, IL6, and CXCL8, the general upregulation of these genes upon IL1β treatment was notably higher when the bone compartment was present. This disparity was statistically significant in the case of IL6, as indicated by additional symbols on each column. Additionally, ICAM‐1 and MMP9 expression was significantly higher in the Cartilage+Bone system, both in control and in treated groups, indicating that a substantial portion of their expression originates from bone cells. To summarize, the aim of this part was to analyze the contribution of the bone compartment to the model response to inflammation and drug treatment. While the overall trend in Cartilage and Cartilage+Bone models was similar for most of the analyzed genes, the expression of other genes was significantly linked to the presence of the bone compartment, proving that some crucial factors related to OA development show altered regulation when the bone compartment is absent.
Figure 8.

Comparing Cartilage with Cartilage+Bone (complete system) models. The significant differences between different treatments in each group is shown using asterisks. The significant differences between a condition in Cartilage group and the corresponding treatment in the Cartilage+Bone group is denoted on the Cartilage+Bone bar with additional symbol #. *p < 0.05, **p < 0.01, #P < 0.05 comparing Cartilage with Cartilage+Bone corresponding treatments. (n = 4).
3. Discussion
Osteoarthritis (OA) necessitates novel approaches to drug development and testing. Organ‐on‐a‐Chip systems offer a solution by replicating intricate joint tissue interactions in vitro. These systems provide precise control, reproducibility, and the capability to simulate multi‐tissue interactions at the microscale.[ 6 ]
In this study, we focused on the crosstalk between cartilage and bone by developing a microfluidic model of the osteochondral unit, consisting of a cartilage compartment in direct contact with a vascularized bone compartment. By cell crosstalk we refer to the communication and interaction that occurs between different cell types within a biological system through direct cell‐to‐cell contact or indirectly through the release of signaling molecules, such as cytokines, growth factors, and extracellular vesicles, into the surrounding environment. To create such unit, we utilized a microfluidic device with a bi‐layer construction that enables the formation of two tissues in direct contact without the need for a physical barrier, thereby enhancing cellular communication and avoiding possible edge effects. Although the device is designed to facilitate the creation of any two tissues, it is crucial to carefully optimize culture conditions tailored to the specific cell types in each tissue. In our model, this involved the precise selection of cell densities and medium composition to support the co‐culture of five primary human cell types, ensuring their viability and functionality. Unlike simpler in vitro bone models, which typically include only osteoblasts and/or BMSCs, our model incorporates osteoclasts and endothelial cells, which add significant biological complexity to the model and require specific culture conditions.
The fibrin hydrogel used in the cartilage compartment not only showcased the ability to resist during the injection phase and the subsequent layer detachment, but also supported the phenotype of chondrocytes, as evidenced by the expression of markers like Collagen II and SOX9. In the bone compartment, fibrin was combined with CaPn to mimic the mineral matrix of bone, a concept also employed in previous studies.[ 20 , 23 ] Although the amount of calcium phosphate in the model was not directly comparable to that found in native bone, it provided osteoblasts and osteoclasts with a biomimetic microenvironment, in line with previous studies demonstrating that the presence of CaPn enhances osteoblast and osteoclast activity, when compared to plain hydrogels.[ 8 ] In the bone compartment, endothelial cells self‐assembled into a stable MVN, supported by the presence of BMSCs differentiating into pericyte‐like cells[ 24 , 25 , 26 , 27 ] and facilitated by the intrinsic property of fibrin to undergo remodeling and gradual replacement by extracellular matrix produced by embedded cells, in line with previous findings. In fact, in our model Collagen I enrichment initiated around MVN, likely produced by both vascular supporting cells such as BMSCs and osteoblasts, and gradually extended through the bone compartment. These findings, along with fibrin structural advantages and ease‐of‐use, supported its use in our 3D microfluidic model. Indeed, while hydrogels such as fibrin may fall short in replicating the mechanical properties of cartilage or bone, their versatility, tunability, biocompatibility, and ability to be reinforced with other materials make them invaluable tools for in vitro modeling, especially in microfluidic settings. This is why they have been extensively used in creating in vitro cartilage and bone models.[ 10 , 11 , 28 , 29 , 30 , 31 , 32 , 33 , 34 , 35 ]
Regarding the bone medium, osteogenic factors like β‐Glycerophosphate, Ascorbic Acid, and Vitamin D3 were incorporated into EGM2 to ensure the functionality of osteoblasts within the model, while dexamethasone, an anti‐inflammatory molecule usually included in osteogenic medium, was removed to avoid interference with IL1β and Celecoxib.[ 36 ] The osteoinductive function of the bone medium was confirmed by the expression of OCN in osteoblasts and BMSCs within the model. Moreover, the system exhibited self‐sustainability in supporting osteoclasts with essential factors, as osteoclasts expressed RANK and TRAP activity also in the absence of MCSF and RANKL, showcasing the microenvironment capacity to support osteoclast differentiation and maturation. This is likely due to the presence of RANKL‐expressing cells in the bone compartment. Although we were unable to detect calcium deposition or phosphate release likely due to the small size of hydrogel constructs and the low cell‐to‐medium ratio in our experimental setup, TRAP and ALP staining showed that osteoclasts and osteoblasts are enzymatically active and functional in the model. On the other hand, in a previous study performed in our laboratory[ 20 ] where a larger device was used to create a similar 3D bone remodeling model, it was shown that not only osteoblasts and osteoclasts are respectively able to induce the deposition of calcium and the release of phosphate from the 3D hydrogel‐based matrix, but also that their activity increased in co‐culture with endothelial cells and BMSCs.
To induce conditions akin to OA within the model, we introduced IL1β as this is a pro‐inflammatory stimulus frequently used to induce OA‐like conditions in other in vitro models.[ 37 , 38 , 39 ] Initially, MMP9 and MMP13 were selected as markers of interest since they are upregulated in OA conditions. MMP9 is an enzyme that degrades the ECM components such as collagen, fibronectin and laminin and it was found to be strongly related to the severity of OA symptomatology.[ 40 ] MMP13 is a highly specific enzyme responsible of Collagen II degradation and, therefore, is particularly relevant in the process of cartilage matrix degradation typical of OA joints.[ 41 , 42 , 43 ] When exposed to IL1β, chondrocytes exhibited an upregulation of both MMP9 and MMP13, with MMP13 showing a more intense signal. This observation aligns with the gene expression data, where the transcriptional upregulation of MMP13 significantly surpassed that of the control group. Interestingly, MMP9 and MMP13 protein expression was primarily observed within osteoclasts in the control condition. This finding is in line with previous studies demonstrating that osteoclasts constitutively express different MMPs,[ 44 , 45 , 46 ] among which MMP9 has been acknowledged as a marker of mature and active osteoclasts, playing a key role in bone remodeling.[ 47 , 48 ] These findings clearly indicate that MMP9 expression, in the absence of inflammatory stimulation, mainly relies on the bone compartment, and specifically on the presence of osteoclasts, demonstrating that the bone compartment is crucial to mimic the in vivo environment in an unstimulated set‐up. The specificity of MMP9 to osteoclasts aligns with its established role in osteoclast‐mediated bone resorption. MMP9 is the most abundant MMP and participates in osteoclast migration as well as the cleavage of several proteins.[ 49 ] In contrast, MMP13 exhibits a broader expression profile, being expressed by osteoblasts, osteoclasts, and bone marrow stromal cells.[ 49 , 50 ] Therefore, the presence of MMP9 signals exclusively in osteoclasts in control condition and the broader expression of MMP13 across multiple cell types in our model reflects their specific roles in bone tissue. Interestingly, the model was also able to capture the induction of MMP9 in chondrocytes in response to inflammatory conditions.
An essential factor contributing to OA is an imbalance in inflammatory cytokines, such as IL1β, TNFα, and IL6, which activate multiple signaling pathways leading to joint tissue deterioration.[ 51 ] IL1β, upon binding to its receptor, initiates a cascade of catabolic processes by activating MAPK and NF‐κB. These signaling pathways lead to increased production of MMPs, aggrecanases, COX‐2, iNOS, PGE‐2, and NO, contributing to disease progression.[ 52 , 53 ] Our study aligns with this concept, demonstrating the role of IL1β in upregulating pro‐inflammatory cytokines like TNFα and IL6, while also increasing its own transcriptional levels, and thus creating a positive feedback loop that amplifies the inflammatory response. Furthermore, IL1β in our system induced the production of chemokines like CXCL8, CCL2, CCL3, and CCL5, which are known to exacerbate joint inflammation by attracting additional immune cells.[ 51 , 54 ] Finally, our model was able to capture the IL1β‐induced increase matrix degrading enzymes and the reduction in their inhibitors, recapitulating the formation of a catabolic microenvironment where cartilage degradation is favored, similarly to what happens in OA joints.[ 55 ]
Regarding cartilage‐related genes, we examined the transcriptional factor SOX9 which promotes the expression of cartilage‐specific genes, such as ACAN and PRG4,[ 56 ] finding that IL1β downregulates all these genes, similarly to what happens in OA‐affected joints.[ 57 ] We also found that IL1β upregulates COL10A1 which is related to chondrocytes hypertrophy in OA conditions.[ 58 , 59 ] Noteworthy, in a previous study where OA was mimicked on a cartilage‐on‐a‐chip model, the increase in COL10A1 transcriptional expression was only detected in the hyperphysiological compression scenario, but not in the IL1β‐based model.[ 34 ] In contrast, our model managed to capture the IL1β‐induced increase in COL10A1 expression, indicative of chondrocyte hypertrophy. While defining the exact source of these differences is challenging, one plausible explanation might be that factors released from bone cells contributed to the upregulation of hypertrophic markers in chondrocytes. This hypothesis is in line with literature data showing that sclerotic osteoblasts can trigger a shift in chondrocyte phenotype toward hypertrophic differentiation, followed by subsequent matrix mineralization.[ 60 ]
Next, we employed IL1Ra and Celecoxib to assess the model suitability as a drug testing platform, employing drug concentrations consistent with those utilized in prior studies.[ 34 , 61 ] Celecoxib is a selective COX‐2 inhibitor, known for its anti‐inflammatory properties and effective in relieving OA symptoms.[ 62 ] COX‐2 is an enzyme upregulated in OA joints that promotes pain and tissue impairment through prostaglandin production and can be targeted to manage OA.[ 63 ] On the other hand, IL1Ra was tested to model the inhibition of the IL1β‐dependent signaling pathway, which represents an intriguing approach for addressing inflammation‐related OA processes.[ 64 , 65 , 66 ]
Our analysis aimed at illuminating various facets of OA during drug testing. In our experiments, while IL1Ra was able to downregulate COL10A1 expression, it was not able to restore chondrocytes specific genes. Celecoxib did not show any effect on chondrocyte phenotype, in line with previous findings.[ 67 ] Moreover, IL1Ra exhibited a more pronounced inhibitory effects on inflammatory cytokines, chemokines, and matrix‐degrading factors compared to Celecoxib. In fact, IL1Ra was able to significantly reduce the transcription of IL1β, TNFα, IL6, IL8, effectively counteracting the inflammation rising from the IL1β pathway. Additionally, IL1Ra significantly downregulated MMP3, which targets Collagen II and proteoglycans, beyond being responsible of the activation of other MMPs.[ 68 ] Additionally, IL1Ra rescued the expression of TIMP3, a wide‐spectrum inhibitor targeting several MMPs and ADAMTSs.[ 69 ] In general, Celecoxib showed a milder but still notable efficacy in reducing IL1β, IL6, IL8, CCL5, MMP1, and MMP3, as also reported in previous studies.[ 70 , 71 , 72 , 73 ] The different efficacy of IL1Ra and Celecoxib is not surprising and can be explained by their mechanism of action. As mentioned before, Celecoxib acts by inhibiting the activity of COX‐2 activity, while IL1Ra operates by interrupting the cascade of IL1β right from the outset, thus directly hindering the upregulation of all genes induced by the IL1β signaling pathway and any subsequent effects. Conversely, the mechanism of action of Celecoxib occurs downstream of the IL1β pathway and hence cannot completely counteract the effects induced by IL1β.
To acknowledge the interaction between cartilage and bone and underscore the significance of the bone compartment, we compared the expression of selected genes in both presence and absence of this compartment. While IL1β generally upregulated inflammation‐ and matrix degradation‐related genes and downregulated cartilage‐specific genes in both scenarios, expression levels varied notably when the bone compartment was absent. Moreover, differences were observed in the expression of MMP9 and ICAM‐1. Understanding the regulation of MMP9 is crucial, as it serves as a potential biomarker for OA.[ 74 ] Our model was able to capture the key role of bone cells in contributing to MMP9 expression and thus in sustaining the vicious cycle of matrix degradation in OA conditions. It is important to bear in mind that even though the total cell numbers may differ between the Cartilage and the Cartilage+Bone models, the normalization process against the housekeeping gene in real‐time PCR analysis effectively captures the relative expression levels of the markers. This method accounts for differences in total cell number and allows for a meaningful comparison of gene expression between the different model conditions. In line with our findings, the role of bone compartment in exacerbating inflammation has been shown by Lin and colleagues,[ 37 ] who demonstrated that treating bone compartment with IL1β led to a robust catabolic response in the chondral compartment, highlighting an active communication between the two tissues. These findings were confirmed in another study by the same group,[ 75 ] where subjecting the entire osteochondral model to IL1β resulted in a higher induction of inflammatory and catabolic genes, when compared to cartilage‐only models. For what concerns ICAM‐1, in a previous study,[ 76 ] it has been showcased how pro‐inflammatory cytokines prompt endothelial activation and ICAM‐1 expression. This activation amplifies monocyte capture, leading to increased extravasation. Herein, we observed a strong upregulation of ICAM‐1 in response to IL1β in the complete model at both gene and protein levels, likely due to the presence of endothelial cells and osteoclasts in the bone compartment, as proved by immunofluorescence analysis. Such IL1β‐dependent induction of ICAM‐1 was not observed in a previous bone model lacking these cellular components.[ 17 ] Hence, thanks to the presence of a vascularized bone tissue, our model offered the opportunity to explore not just cartilage and bone interactions, but also the impact of inflammation and drugs on the vascular compartment. This aspect, often overlooked, is crucial as vascular alterations play a significant role in observed OA‐related changes and immune cell recruitment.[ 77 ] Indeed, despite endothelial cells have been included in a number of in vitro bone models,[ 78 , 79 ] to the best of our knowledge, this is the first osteochondral model including a bone compartment embedding endothelial cells along with osteoblasts and osteoclasts.
It is undeniable that the model also has certain limitations. For instance, although OA is characterized by increased angiogenesis and even by the invasion of new vessels into cartilage, we did not observe any angiogenic effect of IL1β in our model. While it is challenging to pinpoint the exact reason for this, the absence of this effect could be attributed to the high levels of VEGF present in the EGM2 medium, which ranges from 1 to 5 ng mL−1, being significantly higher than the picogram per milliliter concentrations typically found in healthy or OA synovial fluid.[ 80 , 81 ] The excessive VEGF in the medium could saturate VEGF receptors on cells, not reflecting the natural gradients found in vivo and potentially masking the effect of IL1β on angiogenesis. Nonetheless, the use of this specific medium is essential to maintain the endothelial cells survival and function in vitro.
Moreover, the miniaturized size of the microfluidic chip is a double‐edged sword, while it benefits us by reducing cell and reagent consumption, it simultaneously limits our ability to perform certain analyses. For example, extracting intact hydrogel from the chip is challenging due to the extremely small tissue size, which complicates handling and impedes to perform a thorough histological analysis of ECM composition. Additionally, the disproportionate ratio between the large volume of medium and the small volume of cell‐laden hydrogel resulted in background‐level noise in analyses of medium. Attempts to reduce the medium volume negatively impacted cell viability. Therefore, larger models are needed to achieve a more balanced medium‐to‐cell volume ratio, allowing for more accurate analysis of the release of matrix components and proteins. Another limitation is the technical constraint preventing the permanent bonding of the chip to the underlying glass coverslip, which exclude the possibility of attachment of a pump to create fluid flow. In future iterations, we aim to address this by designing a continuous lip between the two compartments, partially blocking the height of the channel. This design modification will enable the creation of a continuous interface without interruptions from single pillars, allowing for both the injection of separate half‐channels and the establishment of a seamless interface. Consequently, the temporary bottom layer will become unnecessary, enabling permanent bonding of the chip to the glass. This improvement will facilitate the attachment of a pump to create fluid flow, thereby allowing us to develop a more physiologically relevant model. Another consideration is that OA is recognized as a disease affecting the entire joint, including the synovial membrane, which becomes inflamed under OA conditions. While incorporating an additional compartment to mimic the synovial membrane could create a more physiologically relevant environment, it is important to consider that overly complex models can hinder the reliability and reproducibility of the system. In this context, applying a step‐by‐step process to go from a simplified to a more complex model is advantageous. Therefore, after creating and characterizing the osteochondral model, we are now working on a new design for a similar chip that includes an additional channel for the synovial membrane and an intervening channel for synovial fluid, allowing us to account for the effects of the synovial membrane in the model.
In conclusion, we have developed an osteochondral model recapitulating key OA‐related processes. Employing this model to evaluate the efficacy of two drugs produced promising results, capturing differences in their mechanism of actions. This suggests its viability as a tool for drug testing of potential drug candidates. Remarkably, our model aligns with the principles of Replacement, Reduction, and Refinement (3R), addressing the need to find ethical alternatives to accelerate the discovery of effective drugs for OA treatment.
4. Experimental Section
Microfluidic Device
The chip fabrication process was followed as detailed in the referenced paper.[ 19 ] Two PDMS layers were produced using standard lithography techniques (Figure S4, Supporting Information). The top layer features a central channel measuring 1300 µm in width, 6000 µm in length, and 200 µm in height, along with two lateral channels for the culture medium. A temporary bottom layer, measuring 650 µm in width and 6000 µm in length, was used during the first hydrogel injection to block half of the central channel of the top layer. Before aligning the layers, the bottom layer was passivated by coating it with 3% Bovine Serum Albumin (BSA) in PBS for 30 min. This passivation step was crucial as it prevents gel disruption during the detachment of the two layers, ensuring that the hydrogel adheres firmly to the top layer. The alignment process, injection procedure, and layer detachment are demonstrated in a video provided in,[ 19 ] which illustrates the injections using colored hydrogel and highlights the two‐layer process.
Chondrocytes
Healthy human primary chondrocytes were purchased from Cell Application (Cat. No. 402‐05a) at passage 2. Chondrocytes were then seeded at 6 × 10³ cells cm−2 and cultured in DMEM‐based Complete Medium containing 10% fetal bovine serum (FBS, Hyclone), 4.5 mg mL−1 D‐glucose, 1 mm sodium pyruvate, 100 mm HEPES buffer, 100 U mL−1/100 µg mL−1 penicillin/streptomycin and 0.29 mg mL−1 L‐glutamine (all from Gibco, Life Technologies). The medium was further supplemented with 0.1 mm non‐essential amino acids (Gibco), 1 ng mL−1 of transforming growth factor‐β1 (TGFβ1, Peprotech) and 5 ng mL−1 of fibroblast growth factor‐2 (b‐FGF, Peprotech).[ 34 ] Cells were expanded until passage 4 and then frozen and stored in liquid nitrogen. Four days before the experiment, cells were thawed and seeded at 6 × 10³ cells cm−2. At the moment of use, cells were detached using 0.05% trypsin/0.053 mm EDTA (Life Technologies) and live cells were counted with Trypan Blue.
Bone Marrow Mesenchymal Stem Cells
Undifferentiated BMSCs were used in the model to support endothelial cells in MVN formation.[ 20 , 24 , 25 , 26 , 27 ] Healthy human primary BMSCs were purchased from Lonza (Cat. No. PT‐2501) at passage 2. The cells were expanded in α‐minimal essential medium (α‐MEM, Life Technologies), 10% FBS, 2 mm L‐glutamine, 1 mm sodium pyruvate, 10 mm HEPES, 1 U mL−1/1 µg mL−1 penicillin/streptomycin, and 5 ng mL−1 b‐FGF, and frozen at passage 4 for further experiments. Seven days before the experiment, cells were thawed and seeded at 5 × 10³ cells cm−2. At the moment of use, cells were detached using 0.05% trypsin/0.053 mm EDTA and live cells were counted with Trypan Blue.
Osteoblasts
Osteoblasts were pre‐differentiated starting from human primary BMSCs purchased from Lonza (Cat. No. PT‐2501) expanded and frozen at passage 4, as described above. Seven days before the experiment, BMSC at passage 4 were thawed and seeded at 10 × 103 cells cm−2 in osteogenic medium, composed of Complete Medium supplemented with 0.01 µm dexamethasone, 10 mm β‐glycerophosphate, 10 nm cholecalciferol, 150 µm L‐Ascorbic acid 2‐phosphate (all from Sigma–Aldrich) to differentiate toward osteoblastic lineage.[ 20 ] At the moment of use, cells were detached using 0.05% trypsin/0.053 mM EDTA and live cells were counted with Trypan Blue.
Osteoclasts
Osteoclasts were differentiated from peripheral blood mononuclear cells (PBMCs). PBMCs were isolated from buffy coats obtained from healthy human donors through local blood banks. The blood was diluted 1:2 with PBS, and PBMCs were extracted via gradient centrifugation utilizing Ficoll‐Hypaque (GE Healthcare). After centrifugation, PBMCs located at the Ficoll‐plasma interface were collected and counted. As the yield of PBMCs from one single donor was not enough to conduct all experimental campaign, PBMCs of three different donors were pooled.[ 82 ] Seven days before the experiment, PBMCs were thawed and plated at 6 × 10⁵ cells cm−2 in α‐MEM containing 10% FBS, 2 mm L‐glutamine, 1 mm sodium pyruvate, 10 mm HEPES, 1 U mL−1/1 µg mL−1 penicillin/streptomycin. The medium was supplemented with 25 ng mL−1 MCSF (Peprotech) and after 1 day 50 ng mL−1 RANKL (Peprotech) was added to induce osteoclastogenesis.[ 83 ] At the moment of use, adherent cells were harvested using enzyme‐free Cell Dissociation Buffer (Life Technologies) and cell scraper and live cells were counted using Trypan Blue.
Cell Staining
To track the cells under the fluorescence microscope during the experiments, Vybrant DiD or Dil Cell‐Labeling Solution (Thermo Fisher Scientific) for cell staining was used. The cells were resuspended in their respective media at a concentration of 2 × 10⁶ cells mL−1 and 5 µL mL−1 of the Vybrant solution was added. The cells were incubated with the staining solution for 10 min, followed by two washing steps with medium to remove any excess dye. After staining, the cells were re‐counted to ensure accurate cell density for subsequent experiments.
Endothelial Cells
To generate a vascularized bone compartment in the model, Green Fluorescent Protein‐Transduced Human Umbilical Vein Endothelial Cells (GFP‐HUVECs, indicated as GFP‐EC on the Figures) were purchased from Angio Proteomie (Cat. No. cAP‐0001GFP). GFP‐HUVECs were expanded in Endothelial Growth Medium (EGM2, Lonza) and stored in liquid nitrogen at passage 6. Three days prior to use, cells were seeded at 6.6 × 10³ cells cm−2 in EGM2. At the moment of use, cells were detached using 0.05% trypsin/0.053 mm EDTA and live cells were counted with Trypan Blue.
Cartilage Compartment
A 20 mg mL−1 fibrin gel was used as the scaffold for the cartilage compartment. To generate 4 UI mL−1 thrombin, 500 UI mL−1 thrombin (Tisseel, Baxter) was diluted in 40 mM CaCl2 and mixed at 1:1 ratio with 40 mg mL−1 human fibrinogen (Sigma–Aldrich). Chondrocytes were embedded at 12.5 × 10⁶ cells mL−1 in the fibrin hydrogel. The concentration of chondrocytes has been selected based on preliminary experiments as explained.
Bone Compartment
The bone compartment was formulated using a 5 mg mL−1 fibrin matrix, enriched with 0.625 mg mL−1 CaPn. The synthesis of CaPn followed a previously established protocol.[ 20 , 84 ] To be used in the bone compartment hydrogel, CaPn were added to 4 UI mL−1 thrombin diluted in EGM2. The thrombin‐CaPn solution was mixed with fibrinogen at a ratio of 1:1, with the fibrinogen concentration at 10 mg mL−1 to obtain a final fibrin concentration at 5 mg mL−1.
The bone compartment included endothelial cells, BMSCs, osteoblasts, and osteoclasts mixed at a 10:1:1:2 ratio.[ 20 ] The final concentrations within the fibrin hydrogel were: endothelial cells at 6×10⁶ cells mL−1, BMSCs at 0.6 × 10⁶ cells mL−1, osteoblasts at 0.6 × 10⁶ cells mL−1, and osteoclasts at 1.2 × 10⁶ cells mL−1. The concentration of endothelial cells has been determined based on preliminary experiments to ensure the formation of an interconnected MVN which also remain stable for 14 days of culture. Subsequently the concentration of other cells types in the model was calculated by maintaining the above‐mentioned ratio between the cells according to other previously in vitro bone models.
Optimization of Cartilage and Bone Medium Composition
For the cartilage compartment two chondrogenic medium compositions were compared. The first medium composition (DMEM‐based chondrogenic medium) comprised DMEM HG (4.5 mg mL−1 D‐glucose), 2% FBS, 1 mm sodium pyruvate, 100 mm HEPES buffer, 100 U mL−1 /100 µg mL−1 penicillin/streptomycin and 0.29 mg mL−1 L‐glutamine, 1% NEAA (non‐essential amino acids), 0.1 mm L‐Ascorbic acid, 10 µg mL−1 Insulin (Sigma–Aldrich), 10 ng mL−1 TGFβ3 (Peprotech).[ 34 ] Considering the sensitivity of endothelial cells to culture conditions, it also examined the chondrocyte phenotype under conditions where the cartilage medium consisted of 10 ng mL−1 TGFβ3 added to EGM2 (EGM2‐based chondrogenic medium).
In the selection of bone medium composition, it started from the medium previously used to develop a vascular bone model.[ 20 ] This medium incorporated crucial factors for both osteoblasts (10 mm β‐glycerophosphate, 10 nm cholecalciferol, 150 µm L‐Ascorbic acid 2‐phosphate) and osteoclasts (25 ng mL−1 MCSF and 50 ng mL−1 RANKL) in EGM2. However, recognizing that in native tissues, MCSF and RANKL were sourced from osteoblasts, this study aimed to investigate if excluding these factors from the bone medium osteoclasts could mature and differentiate relying on the osteoblasts present in the system.
Creating an OA‐Like Microenvironment and Drug Testing
The inflammatory cytokine Interleukin‐1β (IL1β) was introduced at a concentration of 1 ng mL−1 into both the cartilage and bone medium channels, aiming to induce an OA‐like phenotype over a 7‐day period. Following a 7‐day maturation period of the model, IL1Ra (500 ng mL−1) and Celecoxib (10 µM) were introduced into both cartilage and bone media, while a concentration of 1 ng mL−1 of IL1β was maintained. After 7 days of treatment, the samples were fixed for immunofluorescence staining or collected for RT‐qPCR analysis.
Microvascular Network Analysis
Fluorescence microscopy (Olympus IX71) was used for monitoring MVN formation. Pictures were taken on the day of injection (day 0), day 4, 7, and 14. The quantification of the area covered by the MVN was done using ImageJ software after applying a constant threshold to each fluorescence image and analyzing the resulting binary photo. To ensure consistency, a standard ROI on each chip was selected for analysis.
Immunofluorescence Staining
After 14 days of culture, samples were fixed by 2% paraformaldehyde (ChemoCruz). Cells were permeabilized using 0.1% Triton X‐100 (Sigma–Aldrich) and FcR blocking reagent (Miltenyi Biotec) for 10 min. FcR Blocking Reagent (Miltenyi Biotec) was used to block nonspecific antibody binding to FcR‐expressing cells, such as osteoclasts Subsequently, 1% BSA in PBS was added to the chips for 1 h. Then primary antibodies were diluted in 1% BSA in PBS, added to the chips and incubated at 4 °C overnight. The following antibodies were used: Collagen II (ab34712, Abcam, 1:100), Collagen I (C2456, Sigma–Aldrich, 1:200), OCN (MAB1419, R&D System, 1:100), RANKL (ab62516, Abcam, 1:1000), αSMA (ab7817, Abcam, 1:200), Collagen IV (14987182, ThermoFisher Scientific, 1:200), PECAM‐1 (sc‐376764), SOX9 (sc‐166505), ICAM‐1 (sc‐18853), MMP9 (sc‐21773), MMP13 (sc‐515284) (all from Santacruz Biotechnology, 1:100). After incubation, samples were washed and incubated for 2 h at room temperature with secondary antibodies: goat anti‐mouse AlexaFluor‐647 (A21235, 1:1000, ThermoFisher Scientific) or goat anti‐rabbit AlexaFluor‐647 (A21244, 1:500, ThermoFisher Scientific). Nuclei were stained with 300 nm DAPI and images were acquired by confocal microscopy (Leica SP8) and processed with IMARIS software. To facilitate the detection of released proteins, Brefeldin‐A X‐1000 (Abcam) was added to the culture medium of the chips 4 h prior to fixation. Afterwards, samples were fixed and stained as previously described.
TRAP and ALP Enzymatic Activity
TRAP and ALP enzymatic activity were assessed to characterize osteoclast and osteoblast functionality using the ELF 97 Endogenous Phosphatase Detection Kit (Invitrogen). For both TRAP and ALP assays, samples were fixed by incubation with 2% paraformaldehyde in PBS. The TRAP was assessed through a modified ELF‐97 assay, using a substrate solution composed of 110 mm Sodium Acetate (pH 5.2), 1.1 mm Sodium Nitrite, 7.4 mm Tartrate, 200 µm ELF‐97.[ 85 ] To assess ALP activity, the ELF‐97 assay was conducted following the manufacturer's instructions. After adding 100 µL of ELF‐97 substrate solution to the medium channels and incubating the samples 30 min at room temperature in the dark, chips were washed with PBS and counterstained with DAPI (Abcam). Images were acquired by confocal microscopy (Leica SP8).
Quantitative RT‐PCR
On day 14, samples were digested using a solution containing 5 mg mL−1 Collagenase 1 (Worthington Biochemical Corp.), 5 mg mL−1 Collagenase 2 (Worthington Biochemical Corp.) and 1000 U mL−1 of the fermented soybean extract named Nattokinase (Japan Bio Science Laboratory Co. Ltd) in PBS for 15 min at 37 °C and the cells were collected for subsequent RNA extraction. To obtain sufficient RNA, cells extracted from 6 chips from each group (Ctrl, IL1β, IL1β+IL1Ra and IL1β+Celecoxib) were pooled together. RNA extraction was performed using the ReliaPrep miRNA Cell Miniprep System (Promega) and cDNA synthesis was done using the QuantiTect Reverse Transcription Kit (Qiagen) following the manufacturer's protocols. RT‐qPCR was performed according to standard protocols, using 30 ng of cDNA for each gene of interest in duplicate. The expression level of the genes of interest was detected using TaqMan primers and the TaqMan Universal PCR Master Mix (Applied Biosystems): SOX9 (Hs00165814_m1), ACAN (Hs00153936_m1), PRG4 (Hs00981633_m1), COL10A1 (Hs00166657_m1), MMP1 (Hs00899658_m1), MMP3 (Hs00968305_m1), MMP9 (Hs00233992_m1), MMP13 (Hs00233992_m1), ADAMTS5 (Hs01095518_m1), TIMP1 (Hs00171558_m1), TIMP3 (Hs00165949_m1), COX2 (Hs00153133_m1), IL1β (Hs01555410_m1), TNFα (Hs00174128_m1), CCL2 (Hs00234140_m1), CCL3 (Hs00234142_m1), CCL5 (Hs00982282_m1), IL6 (Hs00985639_m1), IL8 (Hs00174103_m1), ICAM1 (Hs00164932_m1). The housekeeping gene glyceraldehyde 3‐phosphate dehydrogenase (GAPDH) was used as the reference (Hs02758991_m1) and relative gene expression was calculated using the 2−ΔCt method. The normalization against the housekeeping gene allowed adjusting for variations in total cell number between the Cartilage and Cartilage+Bone models, thus ensuring the possibility to compare relative expression levels of the analyzed markers.
Statistical Analysis
Statistical analyses were performed using GraphPad Prism 8. The results of RT‐qPCR among different treatment groups (Healthy Ctrl, IL1β, IL1β+IL1Ra, and IL1β+Celecoxib) were compared using non‐parametric Friedman test for paired data, followed by the Dunn post‐hoc test. For comparing each condition from Cartilage with corresponding Cartilage+Bone groups, two‐tailed t‐tests for non‐parametric data were performed. The comparison between MVN area was performed by One‐Way ANOVA for normally distributed data with Tukey's multiple comparison post‐hoc test. Statistical significance was indicated as *p < 0.05, **p < 0.01, and ***p < 0.001.
Conflict of Interest
The authors declare no conflict of interest.
Supporting information
Supporting Information
Acknowledgements
This work was supported by the Italian Ministry of Health ‐ “Ricerca Corrente”.
Open access funding provided by BIBLIOSAN.
Salehi S., Brambilla S., Rasponi M., Lopa S., Moretti M., Development of a Microfluidic Vascularized Osteochondral Model as a Drug Testing Platform for Osteoarthritis. Adv. Healthcare Mater. 2024, 13, 2402350. 10.1002/adhm.202402350
Contributor Information
Silvia Lopa, Email: silvia.lopa@grupposandonato.it.
Matteo Moretti, Email: matteo.moretti@grupposandonato.it.
Data availability statement
The data that support the findings of this study are openly available in Open Science Framework at http://doi.org.10.17605/OSF.IO/N4JWZ, reference number 86.
References
- 1. Sharma A. R., Jagga S., Lee S. S., Nam J. S., Int. J. Mol. Sci. 2013, 14, 19805. [DOI] [PMC free article] [PubMed] [Google Scholar]
- 2. Yuan X. L., Meng H. Y., Wang Y. C., Peng J., Guo Q. Y., Wang A. Y., Lu S. B., Osteoarthritis Cartilage 2014, 22, 1077. [DOI] [PubMed] [Google Scholar]
- 3. Fan X., Wu X., Crawford R., Xiao Y., Prasadam I., Front. Cell. Dev. Biol. 2021, 9, 659654. [DOI] [PMC free article] [PubMed] [Google Scholar]
- 4. Samvelyan H. J., Hughes D., Stevens C., Staines K. A., Calcif. Tissue Int. 2021, 109, 243. [DOI] [PMC free article] [PubMed] [Google Scholar]
- 5. Makarczyk M. J., Gao Q., He Y., Li Z., Gold M. S., Hochberg M. C., Bunnell B. A., Tuan R. S., Goodman S. B., Lin H., Tissue Eng. Part C Methods 2021, 27, 124. [DOI] [PMC free article] [PubMed] [Google Scholar]
- 6. Banh L., Cheung K. K., Chan M. W. Y., Young E. W. K., Viswanathan S., Osteoarthritis Cartilage 2022, 30, 1050. [DOI] [PubMed] [Google Scholar]
- 7. Zou Z., Luo X., Chen Z., Zhang Y. S., Wen C., Theranostics 2022, 12, 891. [DOI] [PMC free article] [PubMed] [Google Scholar]
- 8. Ingber D. E., Nat. Rev. Genet. 2022, 23, 467. [DOI] [PMC free article] [PubMed] [Google Scholar]
- 9. Paggi C. A., Teixeira L. M., Gac S. L., Karperien M., Nat. Rev. Rheumatol. 2022, 18, 217. [DOI] [PubMed] [Google Scholar]
- 10. Shi X., Zhou J., Zhao Y., Li L., Wu H., Adv. Healthcare Mater. 2013, 2, 846. [DOI] [PubMed] [Google Scholar]
- 11. Kilian D., Ahlfeld T., Akkineni A. R., Bernhardt A., Gelinsky M., Lode A., Sci. Rep. 2020, 10, 8277. [DOI] [PMC free article] [PubMed] [Google Scholar]
- 12. Idaszek J., Costantini M., Karlsen T. A., Jaroszewicz J., Colosi C., Testa S., Fornetti E., Bernardini S., Seta M., Kasarełło K., Wrzesień R., Cannata S., Barbetta A., Gargioli C., Brinchman J. E., Świȩszkowski W., Biofabrication 2019, 11, 044101. [DOI] [PubMed] [Google Scholar]
- 13. Lin Z., Li Z., Li E. N., Li X., Del Duke C. J., Shen H., Hao T., O'Donnell B., Bunnell B. A., Goodman S. B., Alexander P. G., Tuan R. S., Lin H., Front. Bioeng. Biotechnol. 2019, 7, 411. [DOI] [PMC free article] [PubMed] [Google Scholar]
- 14. Scalzone A., Cerqueni G., Wang X., Ferreira‐Duarte A., Dalgarno K., Mattioli‐Belmonte M., Gentile P., Adv. Healthcare Mater. 2023, 12, 2202030. [DOI] [PMC free article] [PubMed] [Google Scholar]
- 15. Tuerlings M., Boone I., Eslami Amirabadi H., Vis M., Suchiman E., van der Linden E., Hofmann S., Nelissen R., den Toonder J., Ramos Y., Meulenbelt I., Adv. Mater. Technol. 2022, 7, 2101310. [Google Scholar]
- 16. Jun L., Ong Y., Sun A. R., Wang Z., Lee J., Prasadam I., Toh Y.‐C., Ong L. J. Y., Sun A. R., Wang Z., Lee J., Prasadam I., Toh Y.‐C., Adv. Funct. Mater. 2024, 34, 2315608. [Google Scholar]
- 17. Li Z., Lin Z., Liu S., Yagi H., Zhang X., Yocum L., Romero‐Lopez M., Rhee C., Makarcyzk M. J., Yu I., Li E. N., Fritch M. R., Gao Q., Goh K. B., O'Donnell B., Hao T., Alexander P. G., Mahadik B., Fisher J. P., Goodman S. B., Bunnell B. A., Tuan R. S., Lin H., Adv. Sci. 2022, 9. [DOI] [PMC free article] [PubMed] [Google Scholar]
- 18. Hu Y., Zhang H., Wang S., Cao L., Zhou F., Jing Y., Su J., Bioact. Mater. 2023, 25, 29. [DOI] [PMC free article] [PubMed] [Google Scholar]
- 19. Ugolini G. S., Visone R., Redaelli A., Moretti M., Rasponi M., Adv. Healthcare Mater. 2017, 6, 1601170. [DOI] [PubMed] [Google Scholar]
- 20. Bongio M., Lopa S., Gilardi M., Bersini S., Moretti M., Nanomedicine 2016, 11, 1073. [DOI] [PubMed] [Google Scholar]
- 21. Brooks E. A., Gencoglu M. F., Corbett D. C., Stevens K. R., Peyton S. R., APL Bioeng. 2020, 3, 026106. [DOI] [PMC free article] [PubMed] [Google Scholar]
- 22. Mujeeb A., Miller A. F., Saiani A., Gough J. E., Acta Biomater. 2013, 9, 4609. [DOI] [PubMed] [Google Scholar]
- 23. Bongio M., van den Beucken J. J. J. P., Nejadnik M. R., Leeuwenburgh S. C. G., Kinard L. A., Kasper F. K., Mikos A. G., Jansen J. A., Eur. Cell Mater. 2011, 22, 359. [DOI] [PubMed] [Google Scholar]
- 24. Warren E., Gerecht S., Vascular Biol. 2023, 5, 4609. [DOI] [PMC free article] [PubMed] [Google Scholar]
- 25. Pill K., Hofmann S., Redl H., Holnthoner W., Cell Regeneration 2015, 4, 4:8. [DOI] [PMC free article] [PubMed] [Google Scholar]
- 26. Verseijden F., Posthumus‐Van Sluijs S. J., Pavljasevic P., Hofer S. O. P., Van Osch G. J. V. M., Farrell E., Tissue Eng. Part A. 2010, 16, 101. [DOI] [PubMed] [Google Scholar]
- 27. Rohringer S., Hofbauer P., Schneider K. H., Husa A. M., Feichtinger G., Peterbauer‐Scherb A., Redl H., Holnthoner W., Angiogenesis 2014, 17, 921. [DOI] [PubMed] [Google Scholar]
- 28. Pirosa A., Mainardi A., Occhetta P., Tankus E., Erhbar M., Martin I., Rasponi M., Barbero A., Osteoarthritis Cartilage 2021, 29, S126. [Google Scholar]
- 29. Alamán‐Díez P., García‐Gareta E., Arruebo M., Pérez M. Á., J. Biomed. Mater. Res. A 2023, 111, 88. [DOI] [PMC free article] [PubMed] [Google Scholar]
- 30. Bersini S., Jeon J. S., Dubini G., Arrigoni C., Chung S., Charest J. L., Moretti M., Kamm R. D., Biomaterials 2014, 35, 2454. [DOI] [PMC free article] [PubMed] [Google Scholar]
- 31. Crippa M., Talò G., Lamouline A., Bolis S., Arrigoni C., Bersini S., Moretti M., Mater. Today Bio. 2022, 17, 100460. [DOI] [PMC free article] [PubMed] [Google Scholar]
- 32. Rosser J., Bachmann B., Jordan C., Ribitsch I., Haltmayer E., Gueltekin S., Junttila S., Galik B., Gyenesei A., Haddadi B., Harasek M., Egerbacher M., Ertl P., Jenner F., Mater. Today Bio. 2019, 4, 100023. [DOI] [PMC free article] [PubMed] [Google Scholar]
- 33. Bersini S., Miermont A., Pavesi A., Kamm R. D., Thiery J. P., Moretti M., Adriani G., Oncotarget 2018, 9, 36110. [DOI] [PMC free article] [PubMed] [Google Scholar]
- 34. Occhetta P., Mainardi A., Votta E., Vallmajo‐Martin Q., Ehrbar M., Martin I., Barbero A., Rasponi M., Nat. Biomed. Eng. 2019, 3, 545. [DOI] [PubMed] [Google Scholar]
- 35. Nasello G., Cóndor M., Vaughan T., Schiavi J., Appl. Sci. 2021, 11, 4495. [Google Scholar]
- 36. Formica F. A., Barreto G., Zenobi‐Wong M., J. Controlled Release 2019, 295, 118. [DOI] [PubMed] [Google Scholar]
- 37. Lin H., Lozito T. P., Alexander P. G., Gottardi R., Tuan R. S., Mol. Pharm. 2014, 11, 2203. [DOI] [PMC free article] [PubMed] [Google Scholar]
- 38. Lozito T. P., Alexander P. G., Lin H., Gottardi R., Cheng A. W. M., Tuan R. S., Stem Cell Res. Ther. 2013, 4, S6. [DOI] [PMC free article] [PubMed] [Google Scholar]
- 39. Johnson C. I., Argyle D. J., Clements D. N., Veterinary J. 2016, 209, 40. [DOI] [PubMed] [Google Scholar]
- 40. Bollmann M., Pinno K., Ehnold L. I., Pap T., St C., Lohmann C. H., Bertrand J., Osteoarthritis Cartilage 2020, 40, 280. [DOI] [PubMed] [Google Scholar]
- 41. Hu Q., Ecker M., Int. J. Mol. Sci. 2021, 22, 1742. [DOI] [PMC free article] [PubMed] [Google Scholar]
- 42. Young D. A., Barter M. J., Wilkinson D. J., F1000Research 2019, 8, 17471. [DOI] [PMC free article] [PubMed] [Google Scholar]
- 43. Yamamoto K., Wilkinson D., Bou‐Gharios G., Calcif. Tissue Int. 2021, 109, 277. [DOI] [PMC free article] [PubMed] [Google Scholar]
- 44. Zhu L., Tang Y., Li X. Y., Keller E. T., Yang J., Cho J. S., Feinberg T. Y., Weiss S. J., Sci. Transl. Med. 2020, 12, eaaw6143. [DOI] [PMC free article] [PubMed] [Google Scholar]
- 45. Andersen T. L., Del Carmen Ovejero M., Kirkegaard T., Lenhard T., Foged N. T., Delaissé J. M., Bone 2004, 35, 1107. [DOI] [PubMed] [Google Scholar]
- 46. Fanjul‐Fernández M., Folgueras A. R., Cabrera S., López‐Otín C., Biochim. Biophys. Acta Mol. Cell Res. 2010, 1803, 3. [DOI] [PubMed] [Google Scholar]
- 47. Takeshita S., Kaji K., Kudo A., J. Bone Miner. Res. 2000, 15, 1477. [DOI] [PubMed] [Google Scholar]
- 48. Zhu L., Tang Y., Li X. Y., Keller E. T., Yang J., Cho J. S., Feinberg T. Y., Weiss S. J., Sci. Transl. Med. 2020, 12, 6143. [DOI] [PMC free article] [PubMed] [Google Scholar]
- 49. Paiva K. B. S., Granjeiro J. M., Prog. Mol. Biol. Transl. Sci. 2017, 148, 203. [DOI] [PubMed] [Google Scholar]
- 50. Väänänen H. K., Zhao H., Principles Bone Biol. 2008, 1, 193. [Google Scholar]
- 51. Kapoor M., Martel‐Pelletier J., Lajeunesse D., Pelletier J. P., Fahmi H., Nat. Rev. Rheumatol. 2011, 7, 33. [DOI] [PubMed] [Google Scholar]
- 52. Choi M. C., Jo J., Park J., Kang H. K., Park Y., Cells 2019, 8, 734.31319599 [Google Scholar]
- 53. Lepetsos P., Papavassiliou K. A., Papavassiliou A. G., Free Radic. Biol. Med. 2019, 132, 90. [DOI] [PubMed] [Google Scholar]
- 54. Jenei‐Lanzl Z., Meurer A., Zaucke F., Cell Signal 2019, 53, 212. [DOI] [PubMed] [Google Scholar]
- 55. Okada Y., Okada Y., Modern Rheumatol. 2000, 10, 121. [DOI] [PubMed] [Google Scholar]
- 56. Haseeb A., Kc R., Angelozzi M., de Charleroy C., Rux D., Tower R. J., Yao L., da Silva R. P., Pacifici M., Qin L., Lefebvre V., Proc. Natl. Acad. Sci. 2021, 118, e2019152118. [DOI] [PMC free article] [PubMed] [Google Scholar]
- 57. Zhong L., Huang X., Karperien M., Post J. N., Int. J. Mol. Sci. 2016, 17, 1126. [DOI] [PMC free article] [PubMed] [Google Scholar]
- 58. Van der Kraan P. M., Osteoarthritis Cartilage 2012, 20, 1126. [DOI] [PubMed] [Google Scholar]
- 59. Lian C., Wang X., Qiu X., Wu Z., Gao B., Liu L., Liang G., Zhou H., Yang X., Peng Y., Liang A., Xu C., Huang D., Su P., Bone Res. 2019, 7, 8. [DOI] [PMC free article] [PubMed] [Google Scholar]
- 60. Sanchez C., Deberg M. A., Piccardi N., Msika P., Reginster J. Y. L., Henrotin Y. E., Osteoarthritis Cartilage 2005, 13, 988. [DOI] [PubMed] [Google Scholar]
- 61. Lin Z., Li Z., Li E. N., Li X., Del Duke C. J., Shen H., Hao T., O'Donnell B., Bunnell B. A., Goodman S. B., Alexander P. G., Tuan R. S., Lin H., Front. Bioeng. Biotechnol. 2019, 7, 411. [DOI] [PMC free article] [PubMed] [Google Scholar]
- 62. Deeks J. J., Smith L. A., Bradley M. D., Br. Med. J. 2002, 325, 619. [DOI] [PMC free article] [PubMed] [Google Scholar]
- 63. Mao L., Wu W., Wang M., Guo J., Li H., Zhang S., Xu J., Zou J., Drug Deliv. 2021, 28, 1861. [DOI] [PMC free article] [PubMed] [Google Scholar]
- 64. Yu L., Luo R., Qin G., Zhang Q., Liang W., J Orthop Surg Res. 2023, 18, 1861. [DOI] [PMC free article] [PubMed] [Google Scholar]
- 65. Uebelhoer M., Lambert C., Grisart J., Guse K., Plutizki S., Henrotin Y., Front. Med. 2023, 10, 1148623. [DOI] [PMC free article] [PubMed] [Google Scholar]
- 66. Tonutti A., Granata V., Marrella V., Sobacchi C., Ragusa R., Sconza C., Rani N., Di Matteo B., Ceribelli A., Front. Aging 2023, 4, 1201019. [DOI] [PMC free article] [PubMed] [Google Scholar]
- 67. Nakamura H., Masuko K., Yudoh K., Kato T., Nishioka K., Clin. Exp. Rheumatol. 2007, 25, 11. [PubMed] [Google Scholar]
- 68. Wan J., Zhang G., Li X., Qiu X., Ouyang J., Dai J., Min S., Front. Physiol. 2021, 12, 663978. [DOI] [PMC free article] [PubMed] [Google Scholar]
- 69. Fan D., Kassiri Z., Front. Physiol. 2020, 11, 546314. [DOI] [PMC free article] [PubMed] [Google Scholar]
- 70. Tsutsumi R., Ito H., Hiramitsu T., Nishitani K., Akiyoshi M., Kitaori T., Yasuda T., Nakamura T., Rheumatol. Int. 2008, 28, 727. [DOI] [PubMed] [Google Scholar]
- 71. Su S. C., Tanimoto K., Tanne Y., Kunimatsu R., Hirose N., Mitsuyoshi T., Okamoto Y., Tanne K., Osteoarthritis Cartilage 2014, 22, 845. [DOI] [PubMed] [Google Scholar]
- 72. Sanchez C., Mateus M. M., Defresne M. P., Crielaard J. M. R., Reginster J. Y. L., Henrotin Y. E., J. Rheumatol. 2002, 29, 772. [PubMed] [Google Scholar]
- 73. Álvarez‐Soria M. A., Herrero‐Beaumont G., Moreno‐Rubio J., Calvo E., Santillana J., Egido J., Largo R., Osteoarthritis Cartilage 2008, 16, 1484. [DOI] [PubMed] [Google Scholar]
- 74. Li S., Wang H., Zhang Y., Qiao R., Xia P., Kong Z., Zhao H., Yin L., Front. Genet. 2021, 12, 721258. [DOI] [PMC free article] [PubMed] [Google Scholar]
- 75. Lin Z., Li Z., Li E. N., Li X., Del Duke C. J., Shen H., Hao T., O'Donnell B., Bunnell B. A., Goodman S. B., Alexander P. G., Tuan R. S., Lin H., Front. Bioeng. Biotechnol. 2019, 7, 411. [DOI] [PMC free article] [PubMed] [Google Scholar]
- 76. Mondadori C., Palombella S., Salehi S., Talo G., Visone R., Rasponi M., Redaelli A., Sansone V., Moretti M., Lopa S., Biofabrication 2021, 13, 045001. [DOI] [PubMed] [Google Scholar]
- 77. Pirosa A., Gottardi R., Alexander P. G., Tuan R. S., Stem Cell Res. Ther. 2018, 9, 112. [DOI] [PMC free article] [PubMed] [Google Scholar]
- 78. Bersini S., Jeon J. S., Dubini G., Arrigoni C., Chung S., Charest J. L., Moretti M., Kamm R. D., Biomaterials 2014, 35, 2454. [DOI] [PMC free article] [PubMed] [Google Scholar]
- 79. Pirosa A., Tankus E. B., Mainardi A., Occhetta P., Dönges L., Baum C., Rasponi M., Martin I., Barbero A., Int. J. Mol. Sci. 2021, 22, 9581. [DOI] [PMC free article] [PubMed] [Google Scholar]
- 80. Wang X. W., Fang W., Li Y. J., Long X., Cai H. X., British J. Oral Maxillofacial Surgery 2021, 59, 64. [DOI] [PubMed] [Google Scholar]
- 81. Lee S. S., Joo Y. S., Kim W. U., Min D. J., Min J. K., Park S. H., Cho C. S., Kim H. Y., Clin. Exp. Rheumatol. 2001, 19, 321. [PubMed] [Google Scholar]
- 82. Wieczorek L., Brown B. K., DelSarto Macedo C., Wesberry‐Schmierer M., Ngauy V., Rosa Borges A., Michael N. L., Marovich M. A., Montefiori D. C., Polonis V. R., Virology 2013, 447, 240. [DOI] [PubMed] [Google Scholar]
- 83. Arai F., Miyamoto T., Ohneda O., Inada T., Sudo T., Brasel K., Miyata T., Anderson D. M., Suda T., J. Exp. Med. 1999, 190, 1741. [DOI] [PMC free article] [PubMed] [Google Scholar]
- 84. Bongio M., van den Beucken J. J. J. P., Nejadnik M. R., Leeuwenburgh S. C. G., Kinard L. A., Kasper F. K., Mikos A. G., Jansen J. A., Eur. Cell Mater. 2011, 22, 359. [DOI] [PubMed] [Google Scholar]
- 85. Filgueira L., J. Histochem. Cytochem. 2004, 52, 411. [DOI] [PubMed] [Google Scholar]
Associated Data
This section collects any data citations, data availability statements, or supplementary materials included in this article.
Supplementary Materials
Supporting Information
Data Availability Statement
The data that support the findings of this study are openly available in Open Science Framework at http://doi.org.10.17605/OSF.IO/N4JWZ, reference number 86.