

Abstract
New rhodanine–thiazole clubbed compounds (7a–7l) were synthesised and characterised with various spectroscopy methods. The synthesised hybrids underwent in vitro HPA, HLAG inhibition, and peroxisome proliferator-activated receptor-gamma (PPAR-γ) expression assays. Through the biological study, compound 7f showed promising inhibitory activity against HPA with an IC50 value of 27.13 ± 1.02 μM and 7l exhibited better inhibition against HLAG with an IC50 value of 24.21 ± 1.12 μM. In addition, Lineweaver–Burk plot analysis suggested that 7l and 7f behaved as a mixed type of HLAG and HPA inhibitor and further, compound 7f showed significant PPAR-γ expression as compared to controls in a dose dependent manner; the expression can be attributed to its mapped pharmacophoric features with a phase screen score of 1.28 and vector score of 0.62. The proteins modulated by compounds include AMY2A, PPAR, and GAA proteins via MAPK, PPAR signalling pathways identified by cluster analysis and justified by molecular docking studies and MD trajectory analysis to evaluate the binding orientation and stability of the molecules, and the energy profiles of the molecules, both in complex with the protein, were assessed using MM/GBSA and DFT calculations, respectively. Finally, the pharmacokinetic profile was determined using ADMET analysis. Thus, from the above findings, it may demonstrate that rhodanine–thiazole hybrids constitute promising candidates in the pursuit of developing newer oral antidiabetic agents.
New rhodanine–thiazole clubbed compounds (7a–7l) were synthesised and characterised with various spectroscopy methods.
Introduction
Diabetes mellitus (DM), a chronic metabolic disorder characterized by hyperglycemia, continues to pose a significant global health challenge.1 As per the International Diabetes Federation (IDF) report, it is estimated that 537 million adults are living with diabetes and 6.7 million deaths were reported in 2021. It is predicted that diabetes cases will rise to 643 million by 2030 and 783 million by 2045.2 In particular type II diabetes mellitus belongs to a class of metabolic disorders, characterised by hyperglycemia, insufficient secretion, insulin resistance, and post-prandial hyperglycemia.3 Thus the available marketed drugs like pioglitazone, metformin, and glibenclamide are often prescribed with agents like miglitol, voglibose, and acarbose that are capable of managing the postprandial spiking of blood glucose levels; moreover these agents act by inhibiting the human pancreatic α-amylase (HPA) and human lysosomal acid-α-glucosidase (HLAG) enzyme, which plays a key role in catalysis, by breaking down polysaccharides into monosaccharides like glucose units;4 as a result of insufficient insulin release or resistance, this glucose is spiked in plasma, causing the hyperglycaemic state.5,6 Another key strategy for managing type II diabetes involves activating the PPAR-γ receptor. This activation enhances the expression and translocation of the glucose transporters GLUT1 and GLUT4 to the cell surface, increasing glucose uptake in adipocytes and muscle cells. Consequently, this process helps lower blood glucose levels.7
Recent literature reports suggest that not only the molecules with polyhydroxy compounds,8 but other heterocyclic molecules like thiazoles, thiazolidinedione's,9 rhodanine, oxadiazole, benzimidazole, quinazoline, quinolines, coumarins10 and carbolines11 have been reported to possess effects like inhibition of postprandial hyperglycemia and enhancement of insulin sensitivity by in vitro and in vivo models.12,13 It was observed from the SAR of these previously reported molecules that a Schiff base or azine linkage, i.e. (–CH N–) in heterocyclic molecules, often formed by condensation of aromatic or aliphatic aldehydes with amines.14 The hetero molecules with imine or azomethine connections are capable of hydrogen bond interaction affecting cellular processes,15 because of the unshared pair of electrons on the sp2 hybridized nitrogen atom, thus molecules with imine connections have increasingly gained attention for their diverse activities such as anticancer, antitubercular, antimalarial, antioxidant, anti-inflammatory and anti-glycation effects.16 Researchers have reported that molecules with imine connections possess an inhibitory effect, which include compound A that shows HPA and HLAG inhibitory effects with IC50 = 58.85 μg mL−1 and IC50 = 57.60 μg mL−1.17 Compound B was reported for its HLAG inhibitory potential (IC50 = 18.51 ± 1.19 μM).18 Similarly, compounds like C,19D,20 and E (ref. 21) were reported to inhibit HLAG enzyme with IC50 values of 1.10 ± 0.10 μM, 12.84 ± 0.52 μM, and 18.0 μM and F (ref. 22) was reported as a PPAR-γ agonist with IC50 = 1.594 ± 0.028 μg ml−1, respectively (Fig. 1).
Fig. 1. Design of some rhodanine–thiazole hybrids.

On the other hand, thiazoles have been reported for their broad range of activities like antidiabetic, anticancer, and anti-inflammatory potential, while marketed antidiabetic agents like pioglitazone and rosiglitazone have a thiazolidinedione head and are prone to possess hepatotoxic effects. Similarly, researchers have explored the possibility of rhodanine as a target for its ability to inhibit postprandial hyperglycemia (HPA and HLAG antagonists) and enhance insulin sensitivity (PPAR-γ agonist). Molecules such as compound G displayed HPA inhibition potential with IC50 = 5.44 μM,23 compound H displayed HLAG inhibition potential with an activity profile of IC50 = 0.24 ± 0.01 μM,24 compound I displayed inhibition of both enzymes with an activity profile of IC50 = 200.50 μM and 170.40 μM (ref. 25) and compound J was found to be a PPAR-γ agonist with (IC50 = 876 nM),26 respectively (Fig. 1).
From the above findings, it is necessary to carry out hybridization and structural modification of existing antidiabetic molecules to develop and carter the need for molecules with better pharmacological response. Thus, herein we report the hybridization of rhodanine and thiazole via imine connection for their activity against postprandial hyperglycemia and enhancing insulin sensitivity.
Chemistry
The synthesis of rhodanine-clubbed thiazole Schiff bases (7a–7l) is shown in Scheme 1. The compounds like 2-hydrazinyl-4-substituted phenyl thiazoles (6a–6f) and benzylidene derivatives (3a–3b) were prepared as per previously reported methods. The rhodanine-clubbed thiazole Schiff base derivatives (7a–7l) were synthesized by refluxing 2-hydrazinyl-4-substituted phenyl thiazoles (6a–6f) with benzylidene derivatives (3a–3b) in methanol with a catalytic amount of glacial acetic acid. The final crude compounds (7a–7l) were recrystallized and dried. The 2D structures of the novel rhodanine–thiazole derivatives are illustrated in Fig. S1.†
Scheme 1. Reagents and conditions: (i) toluene, piperidine acetate, reflux (ii) sodium acetate, water: ethanol (5:5), r.t (iii) methanol, glacial acetic acid, reflux.

Biology
HPA and HLAG inhibition assay
The newly synthesized molecules (7a–7l) were assessed for their inhibition effect on the enzymes responsible for postprandial hyperglycemia. Among the series (7a–7l) analogs showed varying degrees of inhibitory on HLAG with IC50 values ranging from (24.21 ± 1.12 μM to 148.23 ± 1.17 μM) compared to standard drug acarbose (25.41 ± 0.16 μM) and HPA inhibitory effects in the range of (27.13 ± 1.02 μM to 61.13 ± 1.10 μM) as compared to standard drug acarbose (32.63 ± 1.07 μM). The most active inhibitor 7l from the series displayed significant HLAG inhibition (IC50 = 24.21 ± 1.12 μM), followed by compound 7g (IC50 = 29.11 ± 1.02 μM). Compound 7e inhibited HPA enzyme with (IC50 = 29.23 ± 1.21 μM) followed by compound 7f (IC50 = 27.13 ± 1.02 μM). The inhibitory effect of all the compounds is detailed in Table 1. Generally, the synthetic molecules were composed of a thiazole ring, rhodanine moiety, linker, aryl ring, and imine bond. However, the aryl ring and rhodanine ring had different substitutions (R1 and R2) which played roles in the inhibitory potential of the compounds, and variations in the inhibitory activities are attributed to the type of substitution and their respective positions on the aryl and rhodanine parts.
Table 1. In vitro HPA and HLAG inhibitory activities of the synthesized rhodanine–thiazole hybrids (7a–7l).
| Comp. | IC50 values (μM) ± SEMa | |
|---|---|---|
| HPAa | HLAGa | |
| 7a | 61.13 ± 1.10 | 55.21 ± 1.21 |
| 7b | 34.04 ± 1.13 | 105.56 ± 2.16 |
| 7c | 35.03 ± 1.01 | 148.23 ± 1.17 |
| 7d | 36.12 ± 1.07 | 46.01 ± 1.22 |
| 7e | 29.23 ± 1.21 | 33.21 ± 1.12 |
| 7f | 27.13 ± 1.02 | 32.21 ± 1.12 |
| 7g | 42.12 ± 2.01 | 29.11 ± 1.02 |
| 7h | 33.04 ± 1.12 | No inhibition |
| 7i | 44.04 ± 2.13 | 52.01 ± 2.41 |
| 7j | 53. 06 ± 2.08 | 63.24 ± 2.01 |
| 7k | 58. 06 ± 2.07 | 62.15 ± 1.41 |
| 7l | 37.23 ± 1.15 | 24.21 ± 1.12 |
| Acarbose | 32.63 ± 1.07 | 25.41 ± 0.16 |
Values are mean ± SEM of three independent experiments.
PPAR-γ transcription factor assay
To investigate the potential effects of the synthesized rhodanine–thiazole hybrids (7a–7l) on insulin sensitivity and glucose metabolism, PPAR-gamma transcription factor expression was evaluated in HepG2 cells. A dose-dependent increase in PPAR-γ expression was observed for all the compounds within the concentration range of 6.25–100 μM, with derivatives 7e and 7f exhibiting significantly higher levels compared to the control. Pioglitazone (1 μM), a known PPAR-γ agonist, was used as a positive control as mentioned in Fig. 2. These findings suggest that the synthesized compounds may exert their antidiabetic effects, at least in part, through the activation of PPAR-gamma TF expression.
Fig. 2. Transcription factor assay of PPAR-γ from given test compounds 7e and 7f treated as compared to vehicle and Std controls with a RayBio PPAR-γ TF activity assay kit.

Kinetic studies for HPA and HLAG inhibition
The most active compounds of the series i.e.7f (Fig. 3) and 7l (Fig. 4) were selected to determine the mechanism of HPA and HLAG inhibition. The inhibition mode of the enzymes was investigated by analysis of graph fitting with the help of GraphPad Prism 8.0 software. These kinetic studies revealed that all the compounds are competitive type inhibitors for HPA and HLAG as they increase the Km values while Vmax remains unaffected; therefore, these compounds are identified as competitive type inhibitors for HPA and HLAG enzymes (Table 2).
Fig. 3. The mode of inhibition mechanism of HPA by compound 7f: (a) Lineweaver–Burk plot, reciprocal rate of reaction (velocities) vs. reciprocal of substrate of 7f; (b) the secondary plot of Kmvs. different concentrations of compound 7f.

Fig. 4. The mode of inhibition mechanism of HLAG inhibition by 7l: (a) Lineweaver–Burk plot, reciprocal rate of reaction (velocities) vs. reciprocal of substrate of 7l; (b) the secondary plot between Km and different concentrations of compound 7l.

Table 2. Kinetic studies of active compounds for HPA and HLAG inhibition.
| Compound | V max (μM min−1)1 | K m (mM) | AICc | R 2 | Type of inhibition |
|---|---|---|---|---|---|
| 7f (α-amylase) | 142.1 | 28.21 | 110.5 | 0.924 | Competitive |
| 7l (α-glucosidase) | 143.1 | 23.35 | 111.4 | 0.952 | Competitive |
Structure–activity relationship (SAR) of HPA and HLAG inhibitory activities
The inhibitory profiles of compounds 7a–7l against HPA and HLAG were significantly influenced by the nature and position of substituents on the aryl ring. Electron-withdrawing substituents, particularly bromine at the para position, generally enhanced inhibitory potency for both enzymes. This observation suggests that increased electron density withdrawal from the aryl ring may facilitate interactions with critical residues within the enzyme active site. However, electron-donating substituents, such as methoxy, exhibited more complex effects, often improving HLAG inhibition while decreasing HPA inhibition, potentially due to altered electronic and steric properties influencing binding affinity. The introduction of a rhodanine acetic acid moiety (7g–7l) generally led to decreased HPA inhibition compared to their corresponding rhodanine analogs (7a–7f), suggesting that this structural modification may interfere with interactions essential for HPA inhibition. The effects on HLAG inhibition were more variable, indicating that the impact of this structural change is enzyme-specific. Overall, the results highlight the importance of both electronic and steric factors in modulating the inhibitory activity of these compounds (7a–7l). The core structural elements, such as the rhodanine and thiazole moieties, are believed to play a crucial role in these interactions, contributing to the overall inhibitory potential of the compounds. This SAR analysis is illustrated in Fig. 5, emphasizing how these substitutions modulate biological activity.
Fig. 5. Structure–activity relationship (SAR) of novel rhodanine–thiazole hybrids (7a–7l).

Cytotoxicity studies
The safety of the synthesized molecules (7a–7l) was assessed on the normal mouse fibroblast (L929) cell line using MTT (3-(4,5-dimethylthiazo-2-yl)-2,5-diphenyl-tetrazolium bromide) assay. The cell toxicity assay results revealed that the compounds (7a–7l) displayed no cytotoxic effect as shown in Table S1.†
Computational study
PPI network and cluster analysis
The ‘STRING’ database was used to assess protein–protein interaction by subjecting the matched targets (Fig. S2a†). To further analyze the 68 common targets of compounds (7a–7l), find the key sub-networks, and speculate the main targets, the PPI network was further computationally analyzed by clustering (K). The PPI network was divided into 3 clusters (Fig. S2b†). Cluster analysis revealed 3 clusters with cluster 1 possessing the maximum number of genes i.e.42 (ABL1, ACP1, AMY2A, CASP3, CASP7, GAA, CETP, CNR1, CPT1A, CSNK2A2, DHFR, DRD2, DUSP16, EGFR, FGFR1, FGFR2, FLT3, GLP1R, GRB2, GRK6, HSP90AA1, ICAM1, INSR, ITGAL, KIT, LDHA, MAPK1, MAPK14, MAPK8, MET, NR3C1, PDGFRB, PLA2G2A, PLA2G4A, PPARA, PPARG, PRKCD, PTK2, PTPN1, SELE, SLC5A1 and VCP) (Table 3). The score of clusters was higher, such as TNF (degree = 41), CASP3 (degree = 36), EGFR (degree = 35), MMP9 (degree = 31), and PPARG (degree = 30).
Table 3. Cluster analysis of diabetes mellitus.
| CLUSTER ID | Gene count | Bubble | Protein names |
|---|---|---|---|
| CLUSTER 1 | 42 | RED | ABL1, ACP1, AMY2A, CASP3, CASP7, GAA, CETP, CNR1, CPT1A, CSNK2A2, DHFR, DRD2, DUSP16, EGFR, FGFR1, FGFR2, FLT3, GLP1R, GRB2, GRK6, HSP90AA1, ICAM1, INSR, ITGAL, KIT, LDHA, MAPK1, MAPK14, MAPK8, MET, NR3C1, PDGFRB, PLA2G2A, PLA2G4A, PPARA, PPARG, PRKCD, PTK2, PTPN1, SELE, SLC5A1, VCP |
| CLUSTER 2 | 17 | GREEN | BACE1, CA2, CASP1, CES1, CTSA, CTSB, CTSK, CTSL, ELANE, F10, F2, MMP8, MMP9, REN, S100B, SERPINE1, TNF |
| CLUSTER 3 | 7 | BLUE | AR, BCHE, CCKAR, GCK, GYS1, PYGL, PYGM |
Compound mechanism through compound-target network analysis
To elucidate the therapeutic effects of synthesized rhodanine–thiazole compounds in treating diabetes mellitus at the system level, two network analyses including compound-target (C-T) and target-pathway (T-P) analyses were performed. First, a C-T network is presented with the help of Cytoscape 3.7.1. The C-T network showed 196 interactions between 12 compounds and 48 targets. Compound 7f (degree = 19) exhibited the biggest number of interactions with the targets, followed by 7e (degree = 18), 7g (degree = 18) and 7i (degree = 18) and these compounds with high degrees demonstrated that a single compound could target multiple receptors and was responsible for the high interconnectedness of the C-T network. Noteworthy is that the compounds not only targeted key modulators involved in diabetes mellitus (such as AMY2A, PPAR and GAA), but also other targets that participated in diabetes mellitus complications such as PPARG and INSR. Further, most targets such as MAPK8, MTOR, MAPK14 were synergistically regulated by different compounds while some compounds could regulate different targets. These results demonstrated the multitargeting nature of the compounds.
Compound mechanism through target-pathway network analysis
Pathway analysis plays an important role in system pharmacology as it bridges the gaps between receptor–ligand interactions and pharmacodynamic outputs. Because enriched disease pathways could interfere with the correct judgment, only disease-associated pathways were used to construct the T-P network. By integrated KEGG pathway analysis, all the targets and corresponding pathways were obtained and then mapped into the T-P network by Cytoscape 3.7.1. The T-P network showed 116 interactions between 54 targets and 17 disease-associated pathways with P < 0.01. Among these pathways, the MAPK signaling pathway (degree = 17) had the biggest number of connections with the targets, followed by the PPAR signaling pathway (degree = 15), insulin resistance (degree = 11), and the insulin signaling pathway (degree = 10). The roles of these high-degree pathways in diabetes mellitus have been well established.27 Besides, some other pathways also participated in the development of diabetes mellitus, such as the adipocytokine signaling pathway, FoxO signaling pathway, and starch and sucrose metabolism.28 An example of the synergism of compounds that act on pancreatic secretion is glycolysis/gluconeogenesis to treat diabetes mellitus (Fig. 6). In addition to disease associated pathways, the compounds can also influence many non-disease associated pathways, including the (hsa01100) metabolic pathways, (hsa04920) adipocytokine signaling pathway, and (hsa00052) galactose metabolism; because obesity has the potential to develop into diabetes mellitus, it can be deduced that compounds could also prevent the development of obesity to more severe diabetes mellitus.29 Other important disease-associated pathways of the compounds are the (hsa04668) TNF signaling pathway, (hsa05418), fluid shear stress and atherosclerosis, (hsa04520) adherens junction, and (hsa05212) pancreatic cancer. Table S2† shows the specific targets of the compounds in these disease-associated pathways. Taken together, the results indicated that the synthesized compounds could exert their therapeutic effects by influencing multiple pathways and acting on multiple targets in each pathway.
Fig. 6. Compound-disease-target-pathway network construction of compounds (7a–7l).

Thus, the in vitro HPA inhibition and PPAR-γ expression of compound 7f and HLAG inhibition of 7l are evident by the predicted possible interaction with protein-pathways involved in the progression of type II diabetes mellitus and its complications, by network pharmacology and enrichment analysis. Fig. 7 shows the proposed plausible molecular mechanism of compound 7f as a (A) human pancreatic α-amylase (HPA) inhibitor and (B) PPAR-γ inhibitor, and compound 7l as a (C) human lysosomal acid-α-glucosidase (HLAG) inhibitor.
Fig. 7. Probable molecular mechanism of compound 7f as a (A) human pancreatic α-amylase (HPA) inhibitor (hsa00500, hsa04922, hsa00010), and compound 7l as a human lysosomal acid-α-glucosidase (HLAG) inhibitor (hsa00500, hsa04922, hsa00010) and (B) PPAR-γ inhibitor (hsa03320),  showing checkpoints affected by the compounds.

GO and KEGG pathway enrichment analyses of the PPI network
Enrichment analysis of the PPI network was obtained. In GO enrichment analysis, 67 common targets were highly enriched in 746 biological processes (BP), 56 cellular fractions (CC), and 70 molecular functions (MF) by setting p-values less than 0.05. The top 10 significant results for each were taken as shown in Fig. S3a.† Specifically, BP had a tight correlation with response to regulation of cellular response to insulin stimulus with 45 proteins i.e. MAPK1, SERPINE1, GCK, MAPK14, MMP8, FLT3, PDGFRB, CSNK2A2, KDR, BCHE, ICAM1, CPT1A, REN, EGFR, CA2, PPARG, KIT, S100B, CCKAR, DUSP16, INSR, F2, MET, BACE1, PRKCD, HSP90AA1, PTK2, GRK6, VCP, MTOR, DRD2, CNR1, PTPN1, MMP9, ABL1, AR, F10, GRB2, PLA2G2A, PPARA, FGFR1, TNF, FGFR2, CASP1, and ELANE against 3367 background genes. The biological processes also show response to oxygen-containing compounds, response to organic substances, cellular response to insulin stimulus, response to insulin, response to lipids, regulation of insulin secretion, insulin receptor signaling pathway, regulation of cellular response to insulin stimulus, regulation of MAPK cascade, etc.
Similarly, 56 CC were identified as closely correlated with the cytoplasmic vesicles, vesicles, extracellular region, extracellular space, vacuolar lumen, secretory granules, vesicle lumen, secretory vesicles, cell periphery, and cell surface. The cytoplasmic vesicle-acting on a protein (GO: 0140096) scored the lowest false discovery rate of 8.26 × 10⁻¹⁰via the modulation of 33 observed genes i.e. MAPK1, PYGL, SERPINE1, MAPK14, MMP8, FLT3, PDGFRB, CSNK2A2, KDR, SLC5A1, CTSK, EGFR, KIT, DUSP16, INSR, BACE1, PRKCD, HSP90AA1, CTSL, CTSB, ITGAL, VCP, MTOR, DRD2, PTPN1, MMP9, CTSA, GRB2, PLA2G2A, FGFR1, TNF, FGFR2 and ELANE against 2482 background genes at a strength of 0.59. Cytoplasmic vesicles and vesicles facilitate the transport and storage of insulin within beta cells, which is then secreted into the extracellular region and extracellular space to regulate blood glucose levels.30 The vacuolar lumen participates in autophagy to maintain beta cell function by degrading misfolded proteins. Secretory granules and secretory vesicles store and release insulin in response to elevated blood glucose levels, while the vesicle lumen contains insulin ready for secretion. At the cell periphery and cell surface, insulin receptors are activated to promote glucose uptake into cells, thereby preventing diabetes mellitus by maintaining suitable blood glucose levels.31
MF was associated with carbohydrate derivative binding, peptidase activity, protein tyrosine kinase activity, protein kinase activity, phosphotransferase activity, alcohol group as an acceptor, glycogen phosphorylase activity, lipid binding, insulin receptor substrate binding, glucose binding, and enzyme binding. In addition, a total of 159 pathways were enriched by KEGG enrichment analysis, and the disease-related pathways were selected as shown in Fig. S3b.† The results indicated that the compound may regulate diabetes mellitus through insulin resistance, type II diabetes mellitus, glycogen metabolism, and starch and sucrose metabolism as well as through insulin and pancreatic secretion. The compound also regulates signaling pathways such as the AGE-RAGE signaling pathway in diabetic complications AMPK signaling pathway, mTOR signaling pathway, JAK-STAT signaling pathway, PI3K-Akt signaling pathway, PPAR signaling pathway, and insulin signaling pathway (Table S2†).
Pharmacophoric mapping
Based on the interactions between the amino acid residues in the active pocket of PPAR-γ protein (PDB ID 5Y2O) and the co-crystallized ligand with the protein, i.e. 8N6/pioglitazone, we developed a five-feature e-pharmacophore model as shown in Fig. 9. The inter-site angle and inter-site distance are depicted in Fig. 8a and b. Since the developed model had features of a known PPAR-γ protein, it was assumed that the potential PPAR-γ protein should have similar features. The developed model had two aromatic ring features (R10 and R11) at 6.21 Å and an acceptor feature (A3) at 6.21 Å from R10 and 5.74 Å from R11. A3 was at 3.05 Å and 12.87 Å from the hydrophobic group (H9 and H8) while H9 was at 4.56 Å from R11 and 9.12 Å from R10. The angle was computed between three features with the second feature at the centre. The angle between A3–H9 was 96.0°, A3–H9–R11 was 196.7°, R10–H8 was 28.2°, and R10–H8–R11 was 128.8°. Based on this insight, we propose that any ligand with all these three features at this specific distance and angle might be a potential PPAR-γ inhibitor.
Fig. 9. e-Pharmacophore-based design strategy of rhodanine–thiazole derivatives as potential PPAR-γ inhibitors.

Fig. 8. Inter-site angle (a) and inter-site distance (b) between different features of the developed e-pharmacophore model. Pink spheres with arrow, hydrogen bond acceptor (A); orange open circle, aromatic ring (R); solid green spheres, hydrophobic region (H).

Table 4 lists the phase screen score, volume score, align score and vector score. We mapped compounds 7e and 7f on the developed e-pharmacophore model and found that the best compound was 7f with five matches and a phase screen score of 1.28, vector score (0.62), align score (0.97), and volume score (0.50), and 7e (Fig. S4†) with five matches and a phase screen score of 1.25, vector score (0.61), align score (0.96), and volume score (0.48) which includes one hydrogen bond acceptor; this feature is related to the nitrogen atom of the (–N CH) Schiff base and the oxygen atom of the carbonyl group (C O), one hydrogen bond donor corresponds to an amino group (NH), two ring aromatic feature related to the phenyl rings. These chemical features are essential for the PPAR-γ inhibitory activity among the data set of reported molecules. The detailed design strategy is depicted in Fig. 9.
Table 4. Score of the e-pharmacophore hypothesis model.
| Code | Align score | Vector score | Volume score | Phase screen score |
|---|---|---|---|---|
| 7e | 0.96 | 0.61 | 0.48 | 1.25 |
| 7f | 0.97 | 0.62 | 0.50 | 1.28 |
Molecular docking and binding free energy (MM-GBSA) calculation
Molecular docking studies of synthesized rhodanine–thiazole compounds (7a–7l) were performed using the Schrödinger suite 2020-1 in HP 280 G4 MT and visualized using the Maestro interface (Maestro, Schrödinger 2020-1, LLC, NY). The binding affinity of 7a–7l showed the highest binding interactions in the present study with α-amylase (Table S3/Fig. S5†), α-glucosidase (Table S4/Fig. S6†), and PPAR-γ (Table S7/Fig. S3†) proteins. 7e demonstrated binding affinity at −6.21 kcal mol−1 and glide energy of −52.90 kcal mol−1 and has hydrogen bonds with the amino acids HIE201, ASP197, HIE299, and TYR151. 7f demonstrated binding affinity at −6.25 kcal mol−1 and a glide energy of −51.53 kcal mol−1 and has hydrogen bonds with the amino acids HIE201, ASP197, HIE299, and TYR151 (Fig. S8†) respectively, as opposed to standard acarbose, which demonstrated binding affinity at −10.15 kcal mol−1 and a glide energy of −63.80 kcal mol−1 and has hydrogen bonds with the amino acids ARG195, ASP197, LYS200, HIE201, GLU240, TYR151, ILE235, GLU233, and HIE299 in α-amylase protein (Fig. S10†).
Similarly, 7g demonstrated binding affinity at −6.35 kcal mol−1 and a glide energy of −54.17 kcal mol−1 and has hydrogen bonds with the amino acids HIE239, PHE157, GLU304, GLY306, and PRO317. 7l demonstrated binding affinity at −6.45 kcal mol−1 and a glide energy of −54.29 kcal mol−1 and has hydrogen bonds with the amino acids HIE239, PHE157, GLU304, GLY306, and PRO317 (Fig. S9†), as opposed to standard acarbose, which demonstrated binding affinity at −9.83 kcal mol−1 and a glide energy of −58.14 kcal mol−1 and has hydrogen bonds with the amino acids GLU304, PHE157, ASP408, and HIE239 in α-glucosidase protein (Fig. S10†).
Some derivatives, 7e demonstrated binding affinity at −8.23 kcal mol−1 and a glide energy of −60.74 kcal mol−1 and has hydrogen bonds with the amino acids HIE323, SER289, TYR473, and GLU259. 7f demonstrated binding affinity at −8.65 kcal mol−1 and a glide energy of −55.22 kcal mol−1 and has hydrogen bonds with the amino acids HIE323, SER289, TYR473, and GLU259, as opposed to standard pioglitazone, which demonstrated binding affinity at −10.57 kcal mol−1 and a glide energy of −59.11 kcal mol−1 and has hydrogen bonds with the amino acids HIE323, SER289, and TYR473 in PPAR-γ protein (Fig. 10).
Fig. 10. 2D binding orientation of 7e, 7f and pioglitazone in the PPAR-γ binding pocket (PDB ID: 5Y2O).

As can be seen in Table S6,† the Prime MM/GBSA calculations have been very successful in predicting the correct ranking of compounds according to their calculated MMGBSA. We demonstrated the MMGBSA dGbind values of the studied compounds against α-amylase, α-glucosidase and PPAR-γ receptor. Ligand binding in the pocket of 4W93 followed the affinity order 7f > 7e > 7h > 7b > 7c > 7d > 7l > 7g > 7i > 7j > 7k > 7avia MM/GBSA dGbind was predicted to be −61.7, −61.2, −59.1, −53.0, −51.5, −51.4, −50.8, −50.0, −48.4, −48.1, −42.9, −41.2 and in 3A477l > 7g > 7f > 7e > 7d > 7i > 7a > 7k > 7j > 7b > 7c > 7h was predicted to be −63.2, −62.1, −58.0, −57.9, −48.2, −46.1, −44.2, −42.9, −42.1, −40.1, −39.2, −33.3 in 5Y2O compound 7f > 7e was predicted to be −70.7, −69.6 among others which is in good agreement with our experimental results. Among the ten newly designed compounds, 7f has the most negative binding free energy in 4W93 and 5Y2O and 7l in 3A47via the prediction by MM/GBSA, implying that it perhaps possesses the best inhibitory activity.
Molecular dynamics simulation study
A molecular dynamics simulation was conducted to investigate the stability and conformational changes of specific inhibitors within the binding pocket of the α-amylase and PPAR-γ protein specifically. The Desmond program was utilized to analyze interactions during the 100 ns simulation, with key properties such as root mean square deviation (RMSD), root mean square fluctuation (RMSF), and hydrogen bond contacts being assessed. The RMSD values reflect alterations in both protein and ligand conformations relative to the initial reference structure (frame 0) chosen for the simulation.
Compound 7e was analysed by the protein–ligand RMSD plot. The protein structure RMSD to reference C-alpha RMSD and backbone RMSD value showed a maximum deviation of 1.337Å and 1.350 Å (frame 313) respectively. Ligand stability was assessed by ligand RMSD to ligand aligned on protein and ligand aligned on ligand indicating a maximum deviation of 1.029 Å and 0.328 Å (frame 20) in α-amylase protein. The RMSF plot of compound 7e showed HIS101 showed maximum fluctuation of 0.593 Å and 0.547 (frame 101) for C-alpha and protein backbone RMSF respectively. The ligand RMSF plot showed high fluctuation with RMSF values of 2.051 Å and 1.402 Å (frame 27) aligned on protein and aligned on ligand respectively (Fig. S11†). Compound 7f was analysed by the protein–ligand RMSD plot. The protein structure RMSD to reference C-alpha RMSD and backbone RMSD value showed a maximum deviation of 1.173 Å and 1.168 Å (frame 185) respectively. Ligand stability was assessed by ligand RMSD to ligand aligned on protein and ligand aligned on ligand indicating a maximum deviation of 2.642 Å and 1.654 Å (frame 61) in α-amylase protein. The RMSF plot of compound 7f showed LYS200 showed maximum fluctuation of 0.594 Å and 0.572 (frame 200) for C-alpha and protein backbone RMSF respectively. The ligand RMSF plot showed high fluctuation with RMSF values of 2.478 Å and 1.292 Å (frame 29) aligned on protein and aligned on ligand respectively (Fig. S12†).
Compound 7e was analysed by the protein–ligand RMSD plot. The protein structure RMSD to reference C-alpha RMSD and backbone RMSD value showed a maximum deviation of 2.058 Å and 2.200 Å (frame 395) respectively. Ligand stability was assessed by ligand RMSD to ligand aligned on protein and ligand aligned on ligand indicating a maximum deviation of 2.086 Å and 1.008 Å (frame 685) in PPAR-γ protein. The RMSF plot of compound 7e showed TYR473 showed maximum fluctuation of 0.688 Å and 0.811 (frame 260) for C-alpha and protein backbone RMSF respectively. The ligand RMSF plot showed high fluctuation with RMSF values of 1.261 Å and 1.104 (frame 27) Å aligned on protein and aligned on ligand respectively (Fig. 11). Compound 7f was analysed by the protein–ligand RMSD plot. The protein structure RMSD to reference C-alpha RMSD and backbone RMSD value showed a maximum deviation of 2.004 Å and 2.998Å (frame 421) respectively. Ligand stability was assessed by ligand RMSD to ligand aligned on protein and ligand aligned on ligand indicating a maximum deviation of 2.910 Å and 2.111Å (frame 425) in PPAR-γ protein. The RMSF plot of compound 7f showed TYR473 showed maximum fluctuation of 0.770 Å and 0.895 (frame 260) for C-alpha and protein backbone RMSF respectively. The ligand RMSF plot showed high fluctuation with RMSF values of 1.830 Å and 1.101 (frame 21) Å aligned on protein and aligned on ligand respectively (Fig. 12).
Fig. 11. (a) Protein ligand RMSD plot of 7e, (b) protein RMSF plot, (c) protein ligand contact timeline, and (d) ligand RMSF plot over a period of 100 ns within PPAR-γ protein.

Fig. 12. a) Protein ligand RMSD plot of 7f, (b) protein RMSF plot, (c) protein ligand contact timeline, and (d) ligand RMSF plot over a period of 100 ns within PPAR-γ protein.

Intermolecular contacts in molecular dynamics simulation
The stacked bar chart in Fig. 13 and S13† presents the intermolecular contacts between inhibitors and the protein observed throughout the molecular dynamics simulation. This visualization categorizes interactions into distinct types, including hydrogen bonds, hydrophobic interactions, ionic interactions, and water bridges. Each interaction type is further subdivided to provide detailed insights into the nature of the interactions occurring during the simulation. The simulation interaction diagram explores these interactions, and compound 7f is identified as the best-scoring inhibitor, with H-bonds with HIS101, ASN298 water bridges to ASP197, LYS200, HIS299, and ALA307 among others. Hydrophobic interactions are observed with TRP58, TRP59, TYR62, LEU162, LEU165, and ALA198. The 2D interaction of compound 7f has a polar interaction with LYS200, water bridge with GLU240 and π–π stacking with TRP59 amino acids (Fig. S13†), and compound 7e is identified as the best-scoring inhibitor, with H-bonds with HIS101 and water bridges to ASP197, THR163, and GLN63 among others. Hydrophobic interactions are observed with PRO54, TRP58, TRP59, VAL107, LEU165, ILE235, and TRP357. The 2D interaction of compound 7e has a polar interaction with HIS101 and water bridge with ASP197 amino acids in the α-amylase pocket (Fig. S13†).
Fig. 13. a) Protein ligand contacts of compounds 7e and 7f with the respective amino acids of the protein; (b) ligand protein contacts of 7e and 7f with the respective amino acids of the PPAR-γ protein.

Compound 7f is identified as the best-scoring inhibitor, with H-bonds with GLN286, SER289, HIS323, LYS367, HIS449, and TYR473 and water bridges to GLY284, LEU340, SER342, and GLU343 among others. Hydrophobic interactions are observed with ILE262, LEU330, ILE341, MET348, and MET364 (Fig. 13) and the 2D interaction of compound 7f has a polar interaction with HIS323, TYR473, and SER289 amino acids. Compound 7e is identified as the best-scoring inhibitor, with H-bonds with GLN63, HIS101 and water bridges to LEU163, ASP197, and ASP300 among others. Hydrophobic interactions are observed with TRP58, TRP59, TYR62, ILE235, and PHE256. The 2D interaction of compound 7e has a polar interaction with GLN63, π–π stacking with TRP59 and water bridge between ASP197 amino acids and the 2D interaction of compound 7e has a polar interaction with LYS367 and water bridge with TYR327 amino acids in PPAR-γ protein (Fig. 13). Finally the trajectory analysis of two molecules indicates and supports the better stability of compound 7f, attributing to its one hydrogen bond, one water bridge and one π–π interaction throughout the simulation, RMSD was found to be better in compound 7f, when compared to 7e, the ligand RMSF for 7f was indicating better stability, which in turn reflect better orientation, binding and residence of the ligand in the α-amylase binding pocket and similarly in PPAR-γ binding site compound 7f attributing to its three hydrogen bonds throughout the simulation with better RMSD (Fig. 14).
Fig. 14. Contours of HOMO and LUMO of synthesized compounds (7e and 7f).

Density functional theory (DFT) analysis
Optimization of molecular geometries
Optimization of synthesized molecular structures having gas phase energy is shown in Tables S7 and S8.† The study of molecular orbitals (MO) is crucial in quantum chemistry, as it defines chemical behavior. The major molecular orbitals of a compound are the highest occupied molecular orbital (HOMO) and the lowest unoccupied molecular orbital (LUMO). A greater HOMO energy value and lower LUMO energy value correspond to higher electron-donor capacity and lower electron-acceptance resistance, respectively. Chemical qualities such as reactivity, stability, and kinetics are explained using them. Softer molecules tend to show better reactivity, the extent to which a molecule is hard or soft is determined by hardness (η). The chemical reactivity descriptors and energy gap are calculated by the DFT/B3LYP/6-31G (d, p**) method and the values are mentioned in Tables 5 and 6. The FMO's HOMO and LUMO orbitals of novel metabolites (7a–7l) are depicted in Fig. S14.† where the negative and positive phases of the molecule are shown by the color codes of green to red. A smaller HOMO–LUMO energy gap typically indicates molecular reactivity. Compounds 7e and 7f show lower ΔEGAP of (0.0960 eV) and chemical softness of 20.83 eV and 20.82 eV (Fig. S18†). Compounds 7k and 7l have chemical softness values of 20.33 eV and 20.79 eV, which illustrates their reactive nature among all other derivatives.
Table 5. Final energy of geometry optimized structures.
| Compound | ESP mean (kcal mol−1) | Gas phase energy (eV) | Final energy |
|---|---|---|---|
| 7e | 2.88 | −4832.63 | −4832.63 |
| 7f | 2.8 | −2718.94 | −2718.94 |
Table 6. Calculated quantum chemical parameters of synthesized compounds' (7e and 7f) molecular electrostatic potential surface.
| Quantum chemical parameters | 7e | 7f |
|---|---|---|
| E HOMO (eV) | −0.207488 | −0.207478 |
| E LUMO (eV) | −0.11148 | −0.11144 |
| ΔEGAP (eV) | 0.0960 | 0.0960 |
| Hardness (η) | 0.0480 | 0.0480 |
| Dipole moment (μ) | −0.2632 | −0.263 |
| Excitation binding energy (ω) | 0.0016 | 0.0017 |
| Softness (σ) | 20.83 | 20.82 |
Electrostatic potential
The electrostatic potential is a useful tool for determining how electric charge is distributed in a molecule. It sheds light on the electrostatic interactions that occur within the molecule and with its surroundings. The ESP on a molecular surface can be used to identify areas of high electron density (negative potential) and low electron density (positive potential). The ESP may be used to anticipate electrophilic and nucleophilic attack sites, as well as to examine molecular interactions. The MEP gives a visual method to show the relative polarity of the molecule and the ESP values of a molecule illustrated by various colors: red, green, and blue, which represent zones of the most negative, zero, and most positive electrostatic potential, respectively. Blue regions denote the strongest attraction, red zones point out the strongest repulsion, and green areas indicate neutral electrostatic potential. Molecular electrostatic potentials were estimated using the B3LYP technique and a basis set of 6-31G (d, p**) at the optimized geometry. In compounds 7e and 7f (Fig. 15) the carbonyl groups are the most electronegative chemical sites that facilitate the electrophilic attack of amino acids. In addition, the blue areas at N–H groups indicated the most positive sites, where donor atoms of amino acids donate these sites with electrons through the nucleophilic attack. The yellow regions at the aromatic ring and sulphur group denote atoms with moderate electronegativity. The ESP of compounds (7a–7l) is represented in (Fig. S15†).
Fig. 15. MEP map of synthesized compounds (7e and 7f).

ADMET predictions
Table S9† presents the ADMET properties of the compounds, including hydrogen bond donors, hydrogen bond acceptors, hydrophilicity, molecular weight, permeability, binding to human serum albumin, and human oral absorption, as predicted by the Qikprop module of Schrödinger's software. The predictions for Lipinski's Rule of Five and Jorgensen's Rule of Three violations were compared with recommended values. Compounds 7a, 7b, 7d, 7e, 7f, 7g, 7h and 7l adhered to Lipinski's Rule of Five without any violations, while the remaining compounds exhibited at least one violation of this rule. Compounds 7e and 7f each exhibit a hydrogen bond donor value of two, which is within the acceptable range. Their hydrogen bond acceptor values are 3. The log P values of 4.92 for 7e and 4.67 for 7f indicate favorable partition coefficients in biological systems. However, all the synthesized molecules showed great aqueous solubility (QPlogS) scores, falling outside the acceptable range of −6.5 to 0.5. Permeability predictions using the Madin–Darby canine kidney (MDCK) assay revealed good permeability for all the compounds (7a–7l). All the molecules demonstrated satisfactory Caco-2 permeability, making them suitable for oral dosage forms. Additionally, these compounds were predicted to have 100% human oral absorption. ADME predictions using QikProp suggest that the synthesized compounds have a promising pharmacokinetic profile.
Experimental section
Chemistry
General procedure for synthesis of rhodanine–thiazole hybrids (7a–7l)
In the 1st step an equimolar mixture of teraphthaldehyde (1) and rhodanine/rhodanine acetic acid (2a–2b) was refluxed in toluene for 8 h using a Dean stark apparatus, completion of the reaction was monitored by TLC, and precipitates were filtered washed with toluene followed by recrystallization with warm methanol to give benzylidene derivatives (3a–3b).32
In the 2nd step, intermediates were further functionalized by an equimolar mixture of ethanolic solution of substituted phenacyl bromides (1 mol) (4a–4f) and aqueous sodium acetate solution (1.5 mol) containing thiosemicarbazide (1 mol) stirred at room temperature, completion of the reaction was monitored by TLC, and precipitates were evaporated, filtered and followed by recrystallization with warm ethanol to get 2-hydrazinyl-4-substituted phenyl thiazole derivatives (6a–6f).33
In the final step, the 2-hydrazinyl-4-substituted phenyl thiazoles (6a–6f) were reacted and refluxed with benzylidene derivatives (3a–3b) in the presence of methanol and a catalytic amount of glacial acetic acid, completion of the reaction was monitored by TLC, and precipitates were filtered, washed with methanol and diethyl ether and recrystallized to give various rhodanine–thiazole hybrids (7a–7l).34 The purity of the tested compounds was determined by HPLC analysis, performed on a Waters Alliance e2695; the column used was a Phenomenex Luna C18, 250 × 4.6 mm, 5 μ; elution conditions: mobile phase 60 : 40 (CH3OH/H2O); the flow-rate was 1 ml min−1 and the injection volume was 10 μl; peaks were detected at 223 nm.
Spectral data of synthesized 2-thioxothiazolidin-4-one hybrids (7a–7f)
5-(4-((2-(4-Phenylthiazol-2-yl)hydrazono)methyl)benzylidene)-2-thioxothiazolidin-4-one (7a)
Red solid powder; yield: 90%, m.p.: 278–280 °C. FTIR (KBr, cm−1): 3047.66 (N–H), 1680.07 (C O), 1558.55 (C C). 1H NMR [400 MHz, δ ppm, DMSO-d6]: 12.87 (s, 1H, NH), 12.44 (s, 1H, NH), 8.02 (s, 1H, CH), 7.85–7.63 (m, 7H, Ar–H), 7.41–7.27 (m, 4H, Ar–H). 13C NMR [100 MHz, δ ppm, DMSO-d6]: 195.9, 169.9, 168.4, 140.3, 136.9, 135.0, 133.8, 131.6, 131.4, 129.1, 128.1, 127.4, 126.0, 104.6. HRMS (ESI) m/z calcd for C20H14N4OS3 [M + H]+, 422.54; found, 423.0396. HPLC purity: 93.9%.
2-Thioxo-5-(4-((2-(4-(p-tolyl)thiazol-2-yl)hydrazono)methyl)benzylidene)thiazolidin-4-one (7b)
Red solid powder; yield: 92%, m.p.: 280–282 °C. FTIR (KBr, cm−1): 3047.66 (N–H), 1674.28 (C O), 1563.37 (C C). 1H NMR [400 MHz, δ ppm, DMSO-d6]: 13.85 (s, 1H, NH), 12.39 (s, 1H, NH), 8.02 (s, 1H, CH), 7.78–7.63 (m, 7H, Ar–H), 7.27–7.19 (m, 3H, Ar–H), 2.30 (s, 3H, CH3). 13C NMR [100 MHz, δ ppm, DMSO-d6]: 196.0, 169.9, 168.3, 140.2, 137.4, 136.9, 133.8, 132.4, 131.6, 131.4, 129.7, 127.4, 126.0, 103.7, 21.3. HRMS (ESI) m/z calcd for C21H16N4OS3 [M + H] +, 436.57; found, 437.0562. HPLC purity: 80.7%.
5-(4-((2-(4-(4-Fluorophenyl)thiazol-2-yl)hydrazono)methyl)benzylidene)-2-thioxothiazolidin-4-one (7c)
Brown solid powder; yield: 92%, m.p.: 276–278 °C. FTIR (KBr, cm−1): 3095.58 (N–H), 1716.72 (C O), 1558.55 (C C). 1H NMR [400 MHz, δ ppm, DMSO-d6]: 13.87 (s, 1H, NH), 12.43 (s, 1H, NH), 8.026 (s, 1H, CH), 7.78–7.77 (m, 4H, Ar–H), 7.62–7.442 (t, 6H, Ar–H). 13C NMR [100 MHz, δ ppm, DMSO-d6]: 196.0, 169.9, 136.8, 133.8, 132.0, 131.6, 131.4, 128.0, 127.4, 126.1, 121.1, 105.5. 19F NMR (DMSO-d6): δ −114.55. HRMS (ESI) m/z calcd for C21H13FN4OS3 [M + H] +, 440.53; found, 441.0310. HPLC purity: 79.4%.
5-(4-((2-(4-(4-Methoxyphenyl)thiazol-2-yl)hydrazono)methyl)benzylidene)-2-thioxothiazolidin-4-one (7d)
Red solid powder; yield: 95%, m.p.: 279–280 °C. FTIR (KBr, cm−1): 3065.02 (N–H), 1692.61 (C O), 1559.91 (C C). 1H NMR [400 MHz, δ ppm, DMSO-d6]: 13.89 (s, 1H, NH), 12.40 (s, 1H, NH), 8.02 (s, 1H, CH), 7.83–7.58 (m, 7H, Ar–H), 7.18–6.94 (m, 3H, Ar–H), 3.77 (s, 3H, OCH3). 13C NMR [100 MHz, δ ppm, DMSO-d6]: 196.0, 169.8, 168.2, 159.3, 139.7, 136.9, 131.6, 131.4, 127.4, 127.3, 114.4, 102.5, 55.6. HRMS (ESI) m/z calcd for C21H16N4O2S3 [M + H] +, 452.57; found, 453.0522. HPLC purity: 79.0%.
5-(4-((2-(4-(4-Chlorophenyl)thiazol-2-yl)hydrazono)methyl)benzylidene)-2-thioxothiazolidin-4-one (7e)
Red solid powder; yield: 93%, m.p.: 279–280 °C. FTIR (KBr, cm−1): 3095.58 (N–H), 1716.72 (C O), 1558.55 (C C). 1H NMR [400 MHz, δ ppm, DMSO-d6]: 13.86 (s, 1H, NH), 12.42 (s, 1H, NH), 8.02 (s, 1H, CH), 7.86–7.62 (m, 6H, Ar–H), 7.45–7.42 (t, 4H, Ar–H). 13C NMR [100 MHz, δ ppm, DMSO-d6]: 196.0, 169.9, 168.5, 140.4, 136.8, 133.9, 133.8, 132.5, 131.7, 131.6, 131.4, 129.1, 127.7, 127.4, 126.1, 105.5. HRMS (ESI) m/z calcd for C20H13ClN4OS3 [M + H] +, 456.98; found, 457.1530. HPLC purity: 76.2%.
5-(4-((2-(4-(4-Bromophenyl)thiazol-2-yl)hydrazono)methyl)benzylidene)-2-thioxothiazolidin-4-one (7f)
Red solid powder; yield: 94%, m.p.: 280–282 °C. FTIR (KBr, cm−1): 3047.66 (N–H), 1674.28 (C O), 1563.37 (C C). 1H NMR [400 MHz, δ ppm, DMSO-d6]: 13.87 (s, 1H, NH), 12.42 (s, 1H, NH), 8.02 (s, 1H, CH), 7.78–7.69 (m, 5H, Ar–H), 7.62–7.44 (m, 5H, Ar–H). 13C NMR [100 MHz, δ ppm, DMSO-d6]: 196.0, 169.9, 168.4, 140.4, 136.8, 133.8, 132.0, 131.6, 131.4, 128.0, 127.4, 126.1, 121.1, 105.5. HRMS (ESI) m/z calcd for C20H13BrN4OS3 [M + H] +, 501.44; found, 500.9527. HPLC purity: 75.9%.
Spectral data of synthesized 2-(4-oxo-2-thioxothiazolidin-3-yl) acetic acid hybrids (7g–7l)
2-(4-Oxo-5-(4-((2-(4-phenylthiazol-2-yl)hydrazono)methyl)benzylidene)-2-thioxothiazolidin-3-yl) acetic acid (7g)
Yellowish green solid powder; yield: 92%, m.p.: 260–262 °C. FTIR (KBr, cm−1): 3437.30 (–OH str of –COOH), 3028.37 (N–H), 1717.68 (C O), 1603.88 (C C). 1H NMR [400 MHz, δ ppm, DMSO-d6]: 8.70 (s, 1H, NH), 8.5 (s, 1H, CH), 7.86–7.69 (m, 6H, Ar–H), 7.40–7.23 (m, 6H, Ar–H), 4.6 (s, 2H, CH2). 13C NMR [100 MHz, δ ppm, DMSO-d6]: 171.7, 136.7, 133.4, 130.6, 106.9. HRMS (ESI) m/z calcd for C22H16N4O3S3 [M + H] +, 480.58; found, 481.045. HPLC purity: 79.2%.
2-(4-Oxo-2-thioxo-5-(4-((2-(4-(p-tolyl)thiazol-2-yl)hydrazono)methyl)benzylidene)thiazolidin-3-yl) acetic acid (7h)
Yellowish green solid powder; yield: 94%, m.p.: 260–262 °C. FTIR (KBr, cm−1): 3431.51 (–OH str of –COOH), 3026.44 (N–H), 1700.32 (C O), 1602.91 (C C). 1H NMR [400 MHz, δ ppm, DMSO-d6]: 7.87 (s, 1H, CH), 7.80–7.78 (m, 7H, Ar–H), 7.74–7.69 (m, 5H, Ar–H), 4.65 (s, 2H, CH2), 2.49 (s, 3H, CH3). 13C NMR [100 MHz, δ ppm, DMSO-d6]: 167.5, 166.9, 135.3, 132.0, 124.4. HRMS (ESI) m/z calcd for C23H18N4O3S3 [M + H] +, 494.60; found, 495.0707. HPLC purity: 79.9%.
2-(5-(4-((2-(4-(4-Fluorophenyl)thiazol-2-yl)hydrazono)methyl)benzylidene)-4-oxo-2-thioxothiazolidin-3-yl) acetic acid (7i)
Yellowish green solid powder; yield: 91%, m.p.: 253–255 °C. FTIR (KBr, cm−1): 3029.34 (–OH str of –COOH), 3009.08 (N–H), 1716.72 (C O), 1603.88 (C C). 1H NMR [400 MHz, δ ppm, DMSO-d6]: 12.54 (s, 1H, OH), 8.01 (s, 1H, CH), 7.89–7.84 (m, 2H, Ar–H), 7.78–7.76 (m, 2H, Ar–H), 7.69–7.67 (d, 3H, Ar–H), 7.24–7.20 (t, 3H, Ar-H), 4.65 (s, 3H, CH2). 13C NMR [100 MHz, δ ppm, DMSO-d6]: 168.6, 167.6, 166.9, 150.1, 137.1, 133.5, 132.0, 128.2, 127.5, 124.4, 123.1, 115.8, 107.2. 19F NMR (DMSO-d6): δ −114.53. HRMS (ESI) m/z calcd for C22H15FN4O3S3 [M + H] +, 498.57; found, 499.0379. HPLC purity: 82.1%.
2-(5-(4-((2-(4-(4-Methoxyphenyl)thiazol-2-yl)hydrazono)methyl)benzylidene)-4-oxo-2-thioxothiazolidin-3-yl) acetic acid (7j)
Yellowish green solid powder; yield: 93%, m.p.: 279–280 °C. FTIR (KBr, cm−1): 3407.40 (–OH str of –COOH), 3009.08 (N–H), 1713.83 (C O), 1695.50 (C C). 1H NMR [400 MHz, δ ppm, DMSO-d6]: 8.01 (s, 1H, CH), 7.83 (s, 1H, NH), 7.78–7.77 (m, 4H, Ar–H), 7.71–7.63 (m, 3H, Ar–H), 7.17–7.14 (d, 1H, Ar–H), 6.96–6.88 (m, 3H, Ar–H), 4.65 (s, 2H, CH2), 3.77 (m, 3H, OCH3). 13C NMR [100 MHz, δ ppm, DMSO-d6]: 193.3, 167.4, 166.6, 159.1, 150.9, 140.0, 137.2, 132.0, 131.8, 127.3, 127.2, 124.4, 114.4, 114.3, 100.1, 55.6, 46.2. HRMS (ESI) m/z calcd for C23H18N4O4S3 [M + H] +, 510.60; found, 511.05. HPLC purity: 89.5%.
2-(5-(-4-((2-(4-(4-Chlorophenyl)thiazol-2-yl)hydrazono)methyl)benzylidene)-4-oxo-2-thioxothiazolidin-3-yl) acetic acid (7k)
Yellowish solid powder; yield: 94%, m.p.: 250–252 °C. FTIR (KBr, cm−1): 3389.08 (–OH str of –COOH), 3011.01 (N–H), 1717.68 (C O), 1603.88 (C C). 1H NMR [400 MHz, δ ppm, DMSO-d6]: 8.39 (s, 1H, NH), 8.36 (s, 1H, CH), 8.14–8.10 (t, 3H, Ar–H), 8.02–7.8 (m, 4H, Ar–H), 7.60–7.58 (m, 4H, Ar–H), 4.78 (s, 2H, CH2). 13C NMR [100 MHz, MHz, δ ppm, DMSO-d6]: 174.7, 152.2, 149.2, 137.2, 136.7, 133.9, 132.5, 131.8, 129.1, 128.9, 110.7, 19.1. HRMS (ESI) m/z calcd for C22H15ClN4O3S3 [M + H] +, 515.02; found, 515.06. HPLC purity: 83.4%.
2-(5-(−4-((2-(4-(4-Bromophenyl)thiazol-2-yl)hydrazono)methyl)benzylidene)-4-oxo-2-thioxothiazolidin-3-yl) acetic acid (7l)
Yellowish green solid powder; yield: 92%, m.p.: 256–258 °C. FTIR (KBr, cm−1): 3407.40 (–OH str of –COOH), 3028.37 (N–H), 1717.68 (C O), 1508.40 (C C). 1H NMR [400 MHz, δ ppm, DMSO-d6]: 12.42 (s, 1H, OH), 7.97 (s, 1H, CH), 7.79–7.73 (m, 6H, Ar–H), 7.65–7.54 (m, 4H, Ar–H), 7.39–7.37 (d, 1H, Ar–H), 4.62 (s, 2H, CH2). 13C NMR [100 MHz, δ ppm, DMSO-d6]: 168.5, 166.8, 135.3, 134.0, 132.0, 131.8, 128.0, 127.5, 124.3, 122.4, 121.1, 105.6. HRMS (ESI) m/z calcd for C22H15BrN4O3S3 [M + H] +, 559.47; found, 558.95. HPLC purity: 81.4%.
Computation studies
Compound-disease-target-pathway network construction
Using Cytoscape 3.7.1, a network model was generated to explore interactions among components, diseases, targets, and pathways related to α-amylase, α-glucosidase, and PPAR-γ. The model included active compounds and their corresponding interaction targets, followed by analysis from high to low modulation to identify potential protein targets for modification by compounds (7a–7l) for α-amylase, α-glucosidase targets and 7e, 7f for the PPAR-γ target. Using Cytoscape 3.7.1, the target network was examined and filtered. Nodes represent components, diseases, targets, and pathways, while edges represent their interactions. The gene targets of α-amylase, α-glucosidase, and PPAR-γ were collected from GeneCards (https://www.genecards.org/). Genes associated with compounds (7a–7l) targeting diabetes mellitus (DM) were input into the STRING database (https://www.string-db.org/) to uncover protein interactions.32 The resulting protein–protein interaction (PPI) network was visualized and analyzed using Cytoscape software. Key targets for compound modulation were identified by analyzing node connectivity and betweenness with the cytohubba plug-in,35 focusing on nodes surpassing the average in these measures and GO and KEGG enrichment analyses were conducted to assess the biological process, cellular component, molecular function, and signaling pathways associated with the top 10 entries, respectively, based on P-values. Additionally, KEGG enrichment bubble plot analysis was employed to annotate signaling pathways associated with α-amylase, α-glucosidase and PPAR-γ targets.36,37
Pharmacophore modelling
For the present work, we have employed e-pharmacophore modelling based on the receptor–ligand complex of the PPAR-γ protein as reported by J. Zhang et al.38 The e-pharmacophore method generates energetically optimized structure-based pharmacophores and has the advantages of both ligand and structure-based pharmacophore modelling.39,40 The e-pharmacophore model was developed employing the PHASE module of the Maestro suite.41 ‘PHASE’ module has a built-in set of six pharmacophore features like hydrogen bond donor (D), hydrogen bond acceptor (A), hydrophobic group (H), aromatic ring (R), positively ionizable (P), and negatively ionizable (N) were identified in the active site and the complementary features were placed within the binding site in chemically reasonable positions. The screened compounds were ranked based on the phase screen score. The three-dimensional structure of the PPAR-γ receptor complexed with crystal inhibitor 8 N6 (pioglitazone) was obtained from a protein data bank (PDB entry 5Y2O) and was used for structure-based pharmacophore generation followed by pre-processing, removal of water, and energy minimization using the protein preparation wizard of Maestro.42 For all further studies, this energetically minimized protein structure of PPAR-γ was subjected to active site identification. The receptor active site was identified using a sphere whose radius that was adjusted to 9.0 Å, to include the active site and the key residues of the protein involved in interaction with ligands.
Molecular docking studies
The glide extra precision (XP) mode of Schrödinger's software was utilized for docking to identify the binding interactions and orientations of inhibitors within the α-amylase, α-glucosidase and PPAR-γ active sites.43 The XP mode involves the elimination of false positives using an advanced scoring system and extensive flexible sampling. Penalties are incorporated into the scoring function, and the best poses are ranked based on conformational search sampling. Interactions such as hydrogen bonding, hydrophobic effects, and pi–pi stacking interactions are taken into account. All the structures of synthesized ligands (7a–7l) were drawn using Maestro.44 The LigPrep panel of Schrödinger's suite was used for ligand preparation, with energy minimization performed using the Optimized Potentials for Liquid Simulations (OPLS4) force field. Torsional flexibility was introduced to achieve better complementary poses. The crystal structure coordinates of the α-amylase (PDB ID: 4 W93), α-glucosidase (PDB ID: 3A47) and PPAR-γ (PDB ID: 5Y2O) binding sites were retrieved from the Protein Data Bank (https://www.rcsb.org) for in silico studies. The Protein Preparation Wizard of Schrödinger's suite was used to prepare the retrieved proteins. The grid was generated using the co-crystal ligand to define the binding site within the target receptor for docking. The protein was pre-processed by removing water molecules and ligands from the PDB file, assigning bond orders, and generating pKa values at pH 7 ± 2. The protein was then optimized through energy minimization using the OPLS4 force field to obtain a stable structure for further studies.45,46
Molecular dynamics (MD) simulations
Molecular dynamics (MD) simulations were conducted using Desmond to assess the structural behavior of the promising two compounds (7e and 7f) within the α-amylase binding site (PDB ID: 4W93) and PPAR-γ (PDB ID: 5Y2O). Pose viewer files obtained from the docking process served as the starting point for the simulations. The system was prepared by performing energy minimization using the OPLS4 force field and solvated with the TIP3P solvent model in an orthorhombic box with dimensions of 10 Å for each axis. Neutralization was achieved by adding 5 Na+ ions, and the optimal temperature of the human body (310.15 K) membrane model was employed. The simulation was run using an NPT ensemble at 310.15 K for 100 ns, adhering to predefined advanced parameters.47,48
Geometric optimization
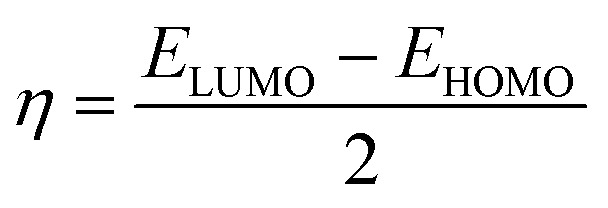
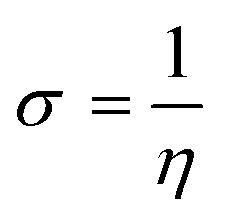
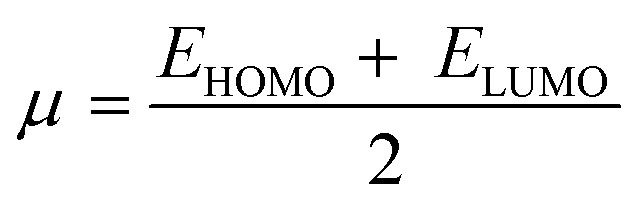
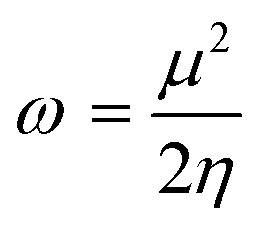
The system's energy minimization process can predict the most stable molecular shape, allowing the calculation of bond lengths, angles, and dihedral angles of compounds (7a–7l). Density functional theory (DFT) is a computational method used in quantum chemistry and materials science to study the electronic structure and properties of molecules. All the synthesized molecules were subjected to geometric optimization using the B3LYP (Becke's three-parameter hybrid functional, Lee–Yang–Parr correlation functional) functional and the 6-31G (d, p) basis set, employing the Jaguar module of Schrödinger's software. Additionally, an electrostatic potential (ESP) map was generated for all the synthesized molecules. Quantum chemical parameters such as the energy gap (ΔEGAP), excitation binding energy (ω), dipole moment (μ), hardness (η), and local softness (σ) were calculated using the highest occupied molecular orbital (EHOMO) and lowest unoccupied molecular orbital (ELUMO) values, following the appropriate equations.49,50
| ΔEGAP = ELUMO − EHOMO | 1 |
 |
2 |
 |
3 |
 |
4 |
 |
5 |
Binding free energy MM/GBSA calculations
The molecular mechanics/generalized born surface area (MM/GBSA) method was used to determine the protein–ligand binding affinity in various systems and estimate the binding free energy of ligands to macromolecules. The MM/GBSA calculations for the inhibitor α-amylase, α-glucosidase and PPAR-γ receptor complexes were performed using the Prime module of Schrödinger's suite, following previously reported methodologies in the literature.51
ADMET predictions
ADMET properties of the synthesized compounds (7a–7l) were calculated using the Qikprop module of Schrodinger's suit.52,53
Biology
Human pancreatic α-amylase (HPA) inhibition assay
The study aimed to evaluate the inhibitory potency of the newly synthesized rhodanine–thiazole compounds 7a–7l against the human pancreatic amylase enzyme. The α-amylase inhibition properties of samples were determined as described in (Poovitha et al., 2016). Porcine pancreatic α-amylase (3 units mL−1) was dissolved in 0.1 M phosphate buffered saline, pH 6.9. Samples at various concentrations (0–100 μg mL−1) were pre-incubated with the enzyme for 10 min at 37 °C. The reaction commenced upon adding the substrate (0.1% starch) to the incubation medium. After 10 min, the reaction was halted by adding 250 μL of dinitro salicylic (DNS) reagent (comprising 1% 3,5-dinitrosalicylic acid, 0.2% phenol, 0.05% Na2SO3, and 1% NaOH in aqueous solution), followed by boiling the reaction mixture for 10 min in a water bath. Subsequently, 250 μL of 40% potassium sodium tartrate solution was added. After cooling to room temperature in a cold-water bath, the absorbance was measured at 540 nm.54
Human lysosomal acid-α-glucosidase (HLAG) inhibition assay
The α-glucosidase inhibitory activity of samples was evaluated using the method described in (Tsujii et al., 1996). α-Glucosidase was dissolved in phosphate buffer (50 mM, pH 6.9) and treated with different concentrations of samples (0–100 μg mL−1) individually for 10 min at 37 °C. The reaction commenced with the addition of 50 μL of 5 mM p-nitrophenyl-α-d glucopyranoside in phosphate buffer. The enzyme reaction proceeded at 37 °C for 30 min. Termination of the reaction occurred by adding Na2CO3 (1 M), followed by measuring the absorbance at 405 nm.55
Using acarbose as a positive control, the percentage of inhibition was determined using the following formula for both α-amylase and α-glucosidase inhibition assays: (OD of blank − OD of test/OD of blank) × 100. The results were represented in IC50 values.
PPAR-γ transcription factor assay
The in vitro transcription factor assay of PPAR-γ from given test compounds 7e and 7f treated as compared to untreated and Std controls with a RayBio PPAR-γ TF activity kit assay was carried out according to the method proposed by Srinivasa MG et al.56
Kinetic study
The mechanism of enzyme inhibition was determined with the help of different concentrations of α-glucosidase (0, 6.05, 12.10, 24.21 mM) for compound 7l and α-amylase (0, 6.78, 13.5, 27.13 mM) for 7f with different concentrations of the inhibitor substrate (p-nitrophenyl R-d-maltoside (NPM)) such as 0, 2, 4, 6, 8 and 10 mM. The enzyme was solubilized in de-ionized water to get the concentration 0.2 mg mL−1 for each well. PIPES buffer was used as adjusted the pH of 7.0 then incubated for 30 min at 25 °C for 1 min time interval. The absorbance was measured via an ELISA reader 96-well plate at 405 nm for 20 min using a spectrophotometer (Gen5, Power wave xs2, BioTek, America). A Lineweaver–Burk plot was generated to identify the type of inhibition and the Michaelis–Menten constant (Km) value was determined from the plot between the reciprocal of the substrate concentration (1/[S]) and the reciprocal of the enzyme rate (1/V) over various inhibitor concentrations. The experimental inhibitor constant (Ki) value was constructed from secondary plots of the inhibitor concentration [I] versus Km values of the α-glucosidase and α-amylase inhibitors determined by graph fitting analysis using Sigma-Plot enzyme kinetic software 14.0 version.57,58
Cytotoxicity studies
To assess the toxicity of the synthesized compounds, an MTT (3-(4,5-dimethylthiazol-2-yl)-2,5-diphenyl-tetrazolium bromide) assay was conducted on the normal mouse L929 cell line, following the methodology described in previously published literature reports.59–61
Conclusion
In this study, a series of novel rhodanine–thiazole hybrids (7a–7l) were designed, synthesized, and characterized. Among these, compounds 7f and 7l exhibited potent HPA and HLAG inhibitory activities, respectively, with mixed-type inhibition kinetics. Notably, compound 7f demonstrated significant PPAR-γ expression, suggesting a potential role in glucose homeostasis. All the compounds (7a–7l) showed no signs of toxicity in the L929 cell line by the MTT assay method. Computational studies, including pharmacophore mapping, molecular docking, and molecular dynamics simulations, provided insights into the binding interactions and stability of these compounds with target proteins (AMY2A, PPAR, and GAA). Furthermore, ADMET analysis indicated favorable drug-like properties. Collectively, these findings highlight the potential of rhodanine–thiazole hybrids as promising lead compounds for the development of novel, multi-target oral antidiabetic agents. Further optimization and in vivo evaluation are warranted to fully explore their therapeutic efficacy.
Data availability
All data included in manuscript.
Author contributions
Shankar Gharge: synthesis, characterization, biological activities, computational studies and original manuscript writing; Shankar G. Alegaon: conceptualisation, methodology and supervision; Shriram D. Ranade: computational studies; Rohini S. Kavalapure: resources; B. R. Prashantha Kumar: resources.
Conflicts of interest
All authors declared that they have no conflict of interest.
Supplementary Material
Acknowledgments
This research was supported by the Department of Pharmaceutical Chemistry at KLE College of Pharmacy and KLE Academy of Higher Education and Research, Belagavi. We gratefully acknowledge the Sophisticated Analytical Instrument Facility (SAIF) at Karnataka University, Dharwad, for conducting the 1H and 13C NMR analyses. Special thanks to Mr. Sachin Gudasi for his contribution to the network pharmacology studies, and Mr. Nikhil Gawas for providing the HPLC% purity data of the compounds. We also extend our appreciation to Honeychem Pharma Research Pvt. Limited, Bangalore, for performing the 19F NMR analysis and HRMS analyses provided Pravin C. Mhaske by Savitribai Phule Pune University, Post-Graduate Department of Chemistry, S. P. Mandali's Sir Parashurambhau College, Tilak Road, Pune-411 030, India.
Electronic supplementary information (ESI) available. See DOI: https://doi.org/10.1039/d4md00689e
References
- Forouhi N. G. Wareham N. J. Epidemiology of diabetes. Medicine. 2010;38:602–606. [Google Scholar]
- International Diabetes Federation, IDF Diabetes Atlas, Brussels, Belgium, 10th edn, 2021, available at: https://www.diabetesatlas.org [Google Scholar]
- Ranade S. D. Alegaon S. G. Khatib N. A. Gharge S. Kavalapure R. S. Kumar B. P. Design, synthesis, molecular dynamic simulation, DFT analysis, computational pharmacology and decoding the antidiabetic molecular mechanism of sulphonamide-thiazolidinhybrids. J. Mol. Struct. 2024:138359. [Google Scholar]
- Srivastava N. Rathour R. Jha S. Pandey K. Srivastava M. Thakur V. K. Sengar R. S. Gupta V. K. Mazumder P. B. Khan A. F. Mishra P. K. Microbial beta glucosidase enzymes: recent advances in biomass conversation for biofuels application. Biomolecules. 2019;9:220. doi: 10.3390/biom9060220. [DOI] [PMC free article] [PubMed] [Google Scholar]
- Salgado J. C. Meleiro L. P. Carli S. Ward R. J. Glucose tolerant and glucose stimulated β-glucosidases–a review. Bioresour. Technol. 2018;267:704–713. doi: 10.1016/j.biortech.2018.07.137. [DOI] [PubMed] [Google Scholar]
- Gharge S. Alegaon S. G. Recent Studies of Nitrogen and Sulfur Containing Heterocyclic Analogues as Novel Antidiabetic Agents: A review. Chem. Biodiversity. 2024;21:202301738. doi: 10.1002/cbdv.202301738. [DOI] [PubMed] [Google Scholar]
- Monsalve F. A. Pyarasani R. D. Delgado-Lopez F. Moore-Carrasco R. Peroxisome proliferator-activated receptor targets for the treatment of metabolic diseases. Mediators Inflammation. 2013;1:549627. doi: 10.1155/2013/549627. [DOI] [PMC free article] [PubMed] [Google Scholar]
- Hu C. Liang B. Sun J. Li J. Xiong Z. Wang S. H. Xuetao X. Synthesis and biological evaluation of indole derivatives containing thiazolidine-2, 4-dione as α-glucosidase inhibitors with antidiabetic activity. Eur. J. Med. Chem. 2024;264:115957. doi: 10.1016/j.ejmech.2023.115957. [DOI] [PubMed] [Google Scholar]
- Li M. Sun J. Liang B. Min X. Hu J. Wu R. Xu X. Thiazolidine-2, 4-dione derivatives as potential α-glucosidase inhibitors: Synthesis, inhibitory activity, binding interaction and hypoglycemic activity. Bioorg. Chem. 2024;144:107177. doi: 10.1016/j.bioorg.2024.107177. [DOI] [PubMed] [Google Scholar]
- Xu X. T. Deng X. Y. Chen J. Liang Q. M. Zhang K. Li D. L. Wu P. P. Zheng X. Zhou R. P. Jiang Z. Y. Ma A. J. Synthesis and biological evaluation of coumarin derivatives as α-glucosidase inhibitors. Eur. J. Med. Chem. 2020;189:112013. doi: 10.1016/j.ejmech.2019.112013. [DOI] [PubMed] [Google Scholar]
- Liang B. Xiao D. Wang S. H. Xu X. Novel thiosemicarbazide-based β-carboline derivatives as α-glucosidase inhibitors: synthesis and biological evaluation. Eur. J. Med. Chem. 2024;275:116595. doi: 10.1016/j.ejmech.2024.116595. [DOI] [PubMed] [Google Scholar]
- Patil S. Alegaon S. G. Gharge S. Ranade S. D. Khatib N. A. Molecular hybridization, synthesis, in vitro α-glucosidase inhibition, in vivo antidiabetic activity and computational studies of isatin based compounds. Bioorg. Chem. 2024;153:107783. doi: 10.1016/j.bioorg.2024.107783. [DOI] [PubMed] [Google Scholar]
- Ranade S. D. Alegaon S. G. Khatib N. A. Gharge S. Kavalapure R. S. Kumar B. P. Reversal of insulin resistance to combat type 2 Diabetes mellitus by newer thiazolidinedione's in fructose induced insulin resistant rats. Eur. J. Med. Chem. 2024:116939. doi: 10.1016/j.ejmech.2024.116939. [DOI] [PubMed] [Google Scholar]
- Gul S. Jan F. Alam A. Shakoor A. Khan A. AlAsmari A. F. Alasmari F. Khan M. Bo L. Synthesis, molecular docking and DFT analysis of novel bis-Schiff base derivatives with thiobarbituric acid for α-glucosidase inhibition assessment. Sci. Rep. 2024;14:3419. doi: 10.1038/s41598-024-54021-z. [DOI] [PMC free article] [PubMed] [Google Scholar]
- Singh V. Palakkeezhillam V. N. Manakkadan V. Rasin P. Valsan A. K. Kumar V. S. Sreekanth A. Recent developments on the potential biological applications of transition metal complexes of thiosemicarbazone derivatives. Polyhedron. 2023;245:116658. [Google Scholar]
- Scheiner S. Halogen bonds formed between substituted imidazoliums and n bases of varying n-hybridization. Molecules. 2017;22:1634. doi: 10.3390/molecules22101634. [DOI] [PMC free article] [PubMed] [Google Scholar]
- Oladipo S. D. Luckay R. C. Olofinsan K. A. Obakachi V. A. Zamias S. J. Adeleke A. A. Badeji A. A. Ogundare S. A. George B. P. Antidiabetes and antioxidant potential of Schiff bases derived from 2-naphthaldehye and substituted aromatic amines: Synthesis, crystal structure, Hirshfeld surface analysis, computational, and invitro studies. Heliyon. 2024;1:10. doi: 10.1016/j.heliyon.2023.e23174. [DOI] [PMC free article] [PubMed] [Google Scholar]
- Sevimli E. Seyhan G. Akkaya D. Sarı S. Barut B. Köksoy B. Effective α-glycosidase inhibitors based on polyphenolic benzothiazole heterocycles. Bioorg. Chem. 2024;147:107366. doi: 10.1016/j.bioorg.2024.107366. [DOI] [PubMed] [Google Scholar]
- Ali Z. Rehman W. Rasheed L. Alzahrani A. Y. Ali N. Hussain R. Emwas A. H. Jaremko M. Abdellattif M. H. New 1, 3, 4-Thiadiazole Derivatives as α-Glucosidase Inhibitors: Design, Synthesis, DFT, ADME, and In Vitro Enzymatic Studies. ACS Omega. 2024;(7):7480–7490. doi: 10.1021/acsomega.3c05854. [DOI] [PMC free article] [PubMed] [Google Scholar]
- Khan H. Jan F. Shakoor A. Khan A. AlAsmari A. F. Alasmari F. Ullah S. Al-Harrasi A. Khan M. Ali S. Design, synthesis, molecular docking study, and α-glucosidase inhibitory evaluation of novel hydrazide–hydrazone derivatives of 3, 4-dihydroxyphenylacetic acid. Sci. Rep. 2024;14:11410. doi: 10.1038/s41598-024-62034-x. [DOI] [PMC free article] [PubMed] [Google Scholar]
- Forozan R. Ghomi M. K. Iraji A. et al., Synthesis, in vitro inhibitor screening, structure–activity relationship, and molecular dynamic simulation studies of novel thioquinoline derivatives as potent α-glucosidase inhibitors. Sci. Rep. 2023;13:7819. doi: 10.1038/s41598-023-35140-5. [DOI] [PMC free article] [PubMed] [Google Scholar]
- Fayed E. A. Thabet A. Abd El-Gilil S. M. Elsanhory H. M. Ammar Y. A. Fluorinated thiazole–thiosemicarbazones hybrids as potential PPAR-γ agonist and α-amylase, α-glucosidase antagonists: Design, synthesis, in silico ADMET and docking studies and hypoglycemic evaluation. J. Mol. Struct. 2024;1301:137374. [Google Scholar]
- Honavar P. M. Shirahatti P. S. Ramu R. Arunodaya H. S. Kumar V. Swamy P. G. Kumar N. Vishwanatha P. Holla B. S. Synthesis, Antidiabetic, Antimicrobial, and Molecular Docking Studies of Some New Rhodanine Acetic Acid Derivatives. Indian J. Heterocycl. Chem. 2020;30:211–216. [Google Scholar]
- Singh V. Singh A. Singh G. Verma R. K. Mall R. Novel benzoxazole derivatives featuring rhodanine and analogs as antihypergycemic agents: synthesis, molecular docking, and biological studies. Med. Chem. Res. 2018;27:735–743. [Google Scholar]
- Wang G. C. Peng Y. P. Xie Z. Z. Wang J. Chen M. Synthesis, α-glucosidase inhibition and molecular docking studies of novel thiazolidine-2, 4-dione or rhodanine derivatives. MedChemComm. 2017;8:1477–1484. doi: 10.1039/c7md00173h. [DOI] [PMC free article] [PubMed] [Google Scholar]
- Choi J. Ko Y. Lee H. S. Park Y. S. Yang Y. Yoon S. Identification of (β-carboxyethyl)-rhodanine derivatives exhibiting peroxisome proliferator-activated receptor γ activity. Eur. J. Med. Chem. 2010;45:193–202. doi: 10.1016/j.ejmech.2009.09.042. [DOI] [PubMed] [Google Scholar]
- Cao R. Tian H. Zhang Y. Liu G. Xu H. Rao G. Tian Y. Fu X. Signaling pathways and intervention for therapy of type 2 diabetes mellitus. MedComm. 2023;4:283. doi: 10.1002/mco2.283. [DOI] [PMC free article] [PubMed] [Google Scholar]
- Kawser Hossain M. Abdal Dayem A. Han J. Yin Y. Kim K. Kumar Saha S. Yang G. M. Choi H. Y. Cho S. G. Molecular mechanisms of the anti-obesity and anti-diabetic properties of flavonoids. Int. J. Mol. Sci. 2016;17:569. doi: 10.3390/ijms17040569. [DOI] [PMC free article] [PubMed] [Google Scholar]
- Moller D. E. New drug targets for type 2 diabetes and the metabolic syndrome. Nature. 2001;414:821–827. doi: 10.1038/414821a. [DOI] [PubMed] [Google Scholar]
- Rorsman P. Renström E. Insulin granule dynamics in pancreatic beta cells. Diabetologia. 2003;46:1029–1045. doi: 10.1007/s00125-003-1153-1. [DOI] [PubMed] [Google Scholar]
- Chen Z. F. Li Y. B. Han J. Y. Wang J. Yin J. J. Li J. B. Tian H. The double-edged effect of autophagy in pancreatic beta cells and diabetes. Autophagy. 2011;7:12–16. doi: 10.4161/auto.7.1.13607. [DOI] [PMC free article] [PubMed] [Google Scholar]
- Gharge S. Alegaon S. G. Ranade S. D. Khatib N. A. Kavalapure R. S. Kumar B. P. Vinod D. Bavage N. B. Design, synthesis of new 2, 4-thiazolidinediones: In-silico, in-vivo anti-diabetic and anti-inflammatory evaluation. Eur. J. Med. Chem. Rep. 2024;11:100151. [Google Scholar]
- Pricopie A. I. Focşan M. Ionuţ I. Marc G. Vlase L. Găină L. I. Vodnar D. C. Simon E. Barta G. Pîrnău A. Oniga O. Novel 2, 4-disubstituted-1, 3-thiazole derivatives: Synthesis, anti-Candida activity evaluation and interaction with bovine serum albumine. Molecules. 2020;25:1079. doi: 10.3390/molecules25051079. [DOI] [PMC free article] [PubMed] [Google Scholar]
- Kavalapure R. S. Alegaon S. G. Venkatasubramanian U. Priya A. S. Ranade S. D. Khanal P. Mishra S. Patil D. Salve P. S. Jalalpure S. S. Design, synthesis, and molecular docking study of some 2-((7-chloroquinolin-4-yl) amino) benzohydrazide Schiff bases as potential Eg5 inhibitory agents. Bioorg. Chem. 2021;116:105381. doi: 10.1016/j.bioorg.2021.105381. [DOI] [PubMed] [Google Scholar]
- Szklarczyk D. Morris J. H. Cook H. Kuhn M. Wyder S. Simonovic M. Santos A. Doncheva N. T. Roth A. Bork P. Jensen L. J. The STRING database in 2017: quality-controlled protein–protein association networks, made broadly accessible. Nucleic Acids Res. 2016;18:937. doi: 10.1093/nar/gkw937. [DOI] [PMC free article] [PubMed] [Google Scholar]
- Chen S. H., Chin C. H., Wu H. H., Ho C. W., Ko M. T. and Lin C. Y., cyto-Hubba: A Cytoscape plug-in for hub object analysis in network biology, in 20th international conference on genome informatics, 2009, pp. 1–2
- Chen L. Chu C. Lu J. Kong X. Huang T. Cai Y. D. Gene ontology and KEGG pathway enrichment analysis of a drug target-based classification system. PLoS One. 2015:0126492. doi: 10.1371/journal.pone.0126492. [DOI] [PMC free article] [PubMed] [Google Scholar]
- Zhang J. Xing Z. Ma M. Wang N. Cai Y. D. Chen L. Xu X. Gene ontology and KEGG enrichment analyses of genes related to age-related macular degeneration. BioMed Res. Int. 2014;1–10:450386. doi: 10.1155/2014/450386. [DOI] [PMC free article] [PubMed] [Google Scholar]
- Neres J. Hartkoorn R. C. Chiarelli L. R. et al., 2-carboxyquinoxalines kill mycobacterium tuberculosis through noncovalent inhibition of DprE1. ACS Chem. Biol. 2015;10:705–714. doi: 10.1021/cb5007163. [DOI] [PubMed] [Google Scholar]
- Salam N. K. Nuti R. Sherman W. Novel method for generating structure-based pharmacophores using energetic analysis. J. Chem. Inf. Model. 2009;49:2356–2368. doi: 10.1021/ci900212v. [DOI] [PubMed] [Google Scholar]
- Loving K. Salam N. K. Sherman W. Energetic analysis of fragment docking and application to structure-based pharmacophore hypothesis generation. J. Comput.-Aided Mol. Des. 2009;23:541–554. doi: 10.1007/s10822-009-9268-1. [DOI] [PubMed] [Google Scholar]
- Dixon S. L. Smondyrev A. M. Knoll E. H. et al., PHASE: a new engine for pharmacophore perception, 3D QSAR model development, and 3D database screening: 1. Methodology and preliminary results. J. Comput.-Aided Mol. Des. 2006;20:647–671. doi: 10.1007/s10822-006-9087-6. [DOI] [PubMed] [Google Scholar]
- Madhavi Sastry G. Adzhigirey M. Day T. et al., Protein and ligand preparation: parameters, protocols, and influence on virtual screening enrichments. J. Comput.-Aided Mol. Des. 2013;27:221–234. doi: 10.1007/s10822-013-9644-8. [DOI] [PubMed] [Google Scholar]
- Ulaganathan V. Talapatra S. K. Rath O. Pannifer A. Hackney D. D. Kozielski F. Structural insights into a unique inhibitor binding pocket in kinesin spindle protein. J. Am. Chem. Soc. 2013;135:2263–2272. doi: 10.1021/ja310377d. [DOI] [PubMed] [Google Scholar]
- Schrodinger software, LLC, New York, NY, 2022 [Google Scholar]
- Zhong H. Tran L. M. Stang J. L. Induced-fit docking studies of the active and inactive states of protein tyrosine kinases. J. Mol. Graphics. 2009;28:336–346. doi: 10.1016/j.jmgm.2009.08.012. [DOI] [PubMed] [Google Scholar]
- Kalva S. Vinod D. Saleena L. M. Combined structure-and ligand-based pharmacophore modeling and molecular dynamics simulation studies to identify selective inhibitors of MMP-8. J. Mol. Model. 2014;20:1–18. doi: 10.1007/s00894-014-2191-y. [DOI] [PubMed] [Google Scholar]
- Itteboina R. Ballu S. Sivan S. K. Manga V. Molecular docking, 3D-QSAR, molecular dynamics, synthesis and anticancer activity of tyrosine kinase 2 (TYK 2) inhibitors. J. Recept. Signal Transduction Res. 2018;38:462–474. doi: 10.1080/10799893.2019.1585453. [DOI] [PubMed] [Google Scholar]
- Harder E. Damm W. Maple J. Wu C. Reboul M. Xiang J. Y. Wang L. Lupyan D. Dahlgren M. K. Knight J. L. Kaus J. W. OPLS3: a force field providing broad coverage of drug-like small molecules and proteins. J. Chem. Theory Comput. 2016;12:281–296. doi: 10.1021/acs.jctc.5b00864. [DOI] [PubMed] [Google Scholar]
- Alzate-Morales J. Bernal C. C. Güiza F. M. Romero Bohórquez A. R. Novel N-allyl/propargyl tetrahydroquinolines: Synthesis via Three-component Cationic Imino Diels–Alder Reaction, Binding Prediction, and Evaluation as Cholinesterase Inhibitors. Chem. Biol. Drug Des. 2016;88:498–510. doi: 10.1111/cbdd.12773. [DOI] [PMC free article] [PubMed] [Google Scholar]
- Gálvez J. Polo S. Insuasty B. Gutiérrez M. Cáceres D. Alzate-Morales J. H. la-Torre De-P. Quiroga J. Design, facile synthesis, and evaluation of novel spiro-and pyrazolo [1, 5-c] quinazolines as cholinesterase inhibitors: Molecular docking and MM/GBSA studies. Comput. Biol. Chem. 2018;74:218–229. doi: 10.1016/j.compbiolchem.2018.03.001. [DOI] [PubMed] [Google Scholar]
- Elkolli M. Chafai N. Chafaa S. Kadi I. Bensouici C. Hellal A. New phosphinic and phosphonic acids: Synthesis, antidiabetic, anti-Alzheimer, antioxidant activity, DFT study and SARS-CoV-2 inhibition. J. Mol. Struct. 2022;1268:133701. [Google Scholar]
- Alegaon S. G. U V. Alagawadi K. R. Kumar D. Kavalapure R. S. Ranade S. D. Priya A. S. Jalalpure S. S. Synthesis, molecular docking and ADME studies of thiazole-thiazolidinedione hybrids as antimicrobial agents. J. Biomol. Struct. Dyn. 2022;40:6211–6227. doi: 10.1080/07391102.2021.1880479. [DOI] [PubMed] [Google Scholar]
- Poovitha S. Parani M. In vitro and in vivo α-amylase and α-glucosidase inhibiting activities of the protein extracts from two varieties of bitter gourd (Momordica charantia L.) BMC Complementary Altern. Med. 2016;16:1–8. doi: 10.1186/s12906-016-1085-1. [DOI] [PMC free article] [PubMed] [Google Scholar]
- Tsujii E. Muroi M. Shiragami N. Takatsuki A. Nectrisine is a potent inhibitor of alpha-glucosidases, demonstrating activities similarly at enzyme and cellular levels. Biochem. Biophys. Res. Commun. 1996;220:459–466. doi: 10.1006/bbrc.1996.0427. [DOI] [PubMed] [Google Scholar]
- Srinivasa M. G. Revanasiddappa B. C. Prabhu A. Rani V. Ghate S. D. Prashantha Kumar B. R. Development of novel thiazolidine-2, 4-dione derivatives as PPAR-γ agonists through design, synthesis, computational docking, MD simulation, and comprehensive in vitro and in vivo evaluation. RSC Med. Chem. 2023;14:2401–2416. doi: 10.1039/d3md00273j. [DOI] [PMC free article] [PubMed] [Google Scholar]
- Qamar R. Saeed A. Saeed M. Shah B. H. Ashraf Z. Abbas Q. Seo S. Y. Synthesis and enzyme inhibitory kinetics of some novel 3-(substituted benzoyl)-2-thioxoimidazolidin-4-one derivatives as α-glucosidase/α-amylase inhibitors. Med. Chem. Res. 2018;27:1528–1537. [Google Scholar]
- Rafique R. Khan K. M. Chigurupati S. Wadood A. Rehman A. U. Karunanidhi A. Hameed S. Taha M. Al-Rashida M. Synthesis of new indazole based dual inhibitors of α-glucosidase and α-amylase enzymes, their in vitro, in silico and kinetics studies. Bioorg. Chem. 2020;94:103195. doi: 10.1016/j.bioorg.2019.103195. [DOI] [PubMed] [Google Scholar]
- Mosmann T. Rapid colorimetric assay for cellular growth and survival: application to proliferation and cytotoxicity assays. J. Immunol. Methods. 1983;65:55–63. doi: 10.1016/0022-1759(83)90303-4. [DOI] [PubMed] [Google Scholar]
- Ranade S. D. Alegaon S. G. Khatib N. A. Gharge S. Kavalapure R. S. Quinoline-based Schiff bases as possible antidiabetic agents: ligand-based pharmacophore modeling, 3D QSAR, docking, and molecular dynamics simulations study. RSC Med. Chem. 2024;15:3162–3179. doi: 10.1039/d4md00344f. [DOI] [PMC free article] [PubMed] [Google Scholar]
- Gharge S. Alegaon S. G. Ranade S. D. Jadhav S. Kavalapure R. S. Design, synthesis, characterization and Antidiabetic evaluation of 3,5-substituted thiazolidinediones: Evidenced by network pharmacology, Molecular docking, dynamic simulation, in vitro and in vivo assessment. Eur. J. Med. Chem. Rep. 2024;12:100213. [Google Scholar]
Associated Data
This section collects any data citations, data availability statements, or supplementary materials included in this article.
Supplementary Materials
Data Availability Statement
All data included in manuscript.