

Abstract
Objective
Patients with ovarian cancer (OC) may develop anti‐Yo‐associated paraneoplastic cerebellar degeneration (PCD)—a cerebellar ataxia associated with tumor‐induced autoimmunity against CDR2 and CDR2L proteins. Dysregulation of circulating exosomal microRNAs (miRNAs) occur in OC. Here, we investigated whether PCD is associated with changes in the exosomal miRNA profiles of OC patients.
Methods
Serum exosomes were isolated from patients with OC (n = 15), patients with OC and anti‐Yo‐associated PCD (n = 14) and healthy controls (HC, n = 15). Small RNA sequencing was used to identify differentially expressed miRNAs. Receiver operating characteristic curves were used to evaluate biomarker sensitivity and specificity, and miRNA target prediction analysis was employed to elucidate gene targets.
Results
OC patients with PCD exhibited a distinct exosomal miRNA expression profile. We detected 103 differentially expressed exosomal miRNAs in PCD patients compared to OC patients without PCD and 139 differentially expressed exosomal miRNAs compared to controls. Particularly miR‐486‐5p, miR‐4732‐5p, miR‐98‐5p and miR‐21‐5p exhibited notable sensitivity and specificity for discriminating PCD patients from both OC patients without PCD and healthy controls. miRNA target prediction showed that several of the differentially expressed miRNAs in PCD patients targeted the CDR2 and CDR2L genes.
Interpretation
Our results demonstrate that OC patients with anti‐Yo‐associated PCD exhibit a distinct exosomal miRNA profile compared to OC patients without PCD. Several of the differentially expressed exosomal miRNAs in PCD patients showed diagnostic potential and may hold relevance for understanding the pathogenesis of PCD.
Introduction
Paraneoplastic cerebellar degeneration (PCD) is a neurodegenerative disease caused by tumor‐induced autoimmunity against neural antigens. 1 It presents typically with ataxia due to the progressive degeneration of Purkinje cells. 2 PCD is characterized by the presence of autoantibodies in both the serum and cerebrospinal fluid, the most common of which is anti‐Yo which is linked primarily to malignancies of ovary and breast. 3 , 4 Anti‐Yo‐associated PCD is very rare. One large‐scale study found that only 0.06% of patients with a suspected paraneoplastic neurological disorder had anti‐Yo autoantibodies. 5 Monstad et al. found that two out of 557 ovarian cancer (OC) patients had anti‐Yo‐associated PCD. 6 Anti‐Yo targets the cerebellar degeneration‐related proteins CDR2 and CDR2L expressed in both cancer cells and Purkinje cells. 7 , 8 , 9 CDR2 appears to be a nuclear protein interacting with nuclear speckle proteins, whereas CDR2L localizes to ribosomes interacting with ribosomal proteins like RPS6. 10 Ovarian and breast tumors in patients with PCD display distinct differences from those found in patients without PCD, including genetic alterations in the CDR2 and/or CDR2L genes, and extensive infiltration by both B and T cells. 11 , 12 The precise mechanisms causing PCD remain elusive.
Exosomes are small (30–150 nm) extracellular vesicles that facilitate intercellular communication by transporting functional proteins, lipids, mRNAs, and non‐coding RNAs between cells. They are important mediators of crosstalk between tumors and the immune system, participating in tumor antigen presentation, activation of immune cells and immunosuppression. 13 MicroRNAs (miRNAs) are short (18–25 nucleotides), single‐stranded non‐coding RNA molecules which regulate gene expression by silencing specific mRNA targets. The sorting of miRNAs into exosomes appears to be a selective process. 14 , 15 Changes in the exosomal miRNA content have been identified in several neurodegenerative diseases, including paraneoplastic autoimmune encephalitis, 16 multiple sclerosis, 17 Parkinson's disease and Alzheimer's disease. 18
Several studies have demonstrated that circulating miRNAs may be diagnostic and prognostic biomarkers for OC. 19 , 20 For example, a recent meta‐analysis identified a panel of upregulated, circulating miRNAs (miR‐21, miR‐125, miR‐141, miR‐145, miR‐205, miR‐328, miR‐200a, miR‐200b, and miR‐200c) in OC patients compared to controls. 21 Using RNA sequencing we investigated whether OC patients with anti‐Yo‐associated PCD have a distinct exosomal miRNA expression profile compared to those without PCD. To the best of our knowledge, the current study is the first to characterizes the exosomal miRNA expression in patients with PCD.
Materials and Methods
Sample material
Serum samples from 15 female patients with OC were obtained from the Bergen Gynecologic Cancer Biobank, Department of Obstetrics and Gynecology, Haukeland University Hospital, Bergen, Norway. None of the OC patients had any symptoms of PCD or other neurological disorders during the disease course. Sera from 15 female patients with OC and anti‐Yo‐associated PCD were obtained from the French National Reference Center for Paraneoplastic Neurological Diseases (PND) collected and stored in the NeuroBioTec Biobank (DC‐2008‐72, BRIF# BB‐0033‐00046) of the Hospices Civils de Lyon, France. Patients with anti‐Yo‐associated PCD were included by the French National Reference Center for PND if—(1) they had PCD diagnosed according to the international guidelines, 2 (2) anti‐Yo antibodies in serum and/or cerebrospinal fluid detected by both immunohistochemistry on rat brain sections and dot blot using commercial tests (RAVO Diagnostika, Freiburg, Germany, and EUROIMMUN, Lübeck, Germany), and (3) histologically proven OC. Serum samples from 15 age‐matched, female healthy controls (HC) were collected from the Department of Immunology and Transfusion Medicine, Haukeland University Hospital, Bergen, Norway. Serum was obtained from whole blood by centrifugation and frozen directly at −80°C without additives. The OC were staged according to the International Federation of Gynecology and Obstetrics staging system from 2014 (updated in 2021). 22 Both the Bergen Gynecologic Cancer Biobank (REK Vest ID 2014/1907) and the present study (REK Vest ID 457336) were approved by the Regional Committee for Medical Research Ethics. Informed consent was obtained from all participants before enrolment in the different biobanks.
RNA extraction, library preparation and sequencing
RNA extraction and sequencing were performed by QIAGEN N.V. Briefly, exosomal RNA was extracted from 500 μL serum using the exoRNeasy Midi kit (QIAGEN, Hilden, Germany) according to the manufacturer's instructions with an elution volume of 14 μL. The library preparation was performed using the QIAseq miRNA Library Kit (QIAGEN). 5 μL total RNA was converted into miRNA libraries. After adapter ligation, unique molecular identifiers were introduced in the reverse transcription step. The cDNA was amplified using PCR (22 cycles) and during the PCR indices were added. Thereafter, the samples were purified. Quality control of the library preparation was performed using capillary electrophoresis with the D1000 DNA ScreenTape (Agilent, California, USA). Based on the quality of the inserts and the concentrations, the libraries were pooled in equimolar ratios. The library pools were quantified using qPCR. The library pools were then sequenced on a NextSeq (Illumina Inc., California, USA) sequencing instrument according to the manufacturer's instructions, generating 75 base pair single‐end reads (1 × 75, 2 × 10). Raw data was de‐multiplexed and FASTQ files for each sample were generated using the bcl2fastq2 software (Illumina Inc.).
Processing of sequencing data
The FASTQ files were processed using miRge3.0 to produce read counts. 23 Briefly, adapter sequences were removed using cutadapt version 4.4. 24 PCR duplicates were corrected for using unique molecular identifiers. Reads were aligned against the miRBase v22.1 library, 25 and GRCh38.p14 using bowtie version 1.3.1. 26 The counts of miRNAs differing in a single base were aggregated by default in miRge3.0.
Differential expression analysis
miRNA count data were filtered for lowly expressed miRNAs by excluding miRNAs having zero counts in more than one third of the samples. Differentially expressed miRNAs were identified using the DESeq2 R package version 1.42.0. 27 p‐values were corrected for multiple hypothesis testing using the false discovery rate (FDR). Adjusted p‐value <0.05 was considered significant. To compare miRNA expression between samples, read counts were normalized by converting to log2 counts per million (CPM). Data processing and plotting was performed using the tidyverse R package version 2.0.0. 28
miRNA target prediction and enrichment analysis
Experimentally verified miRNA–gene interactions were retrieved from reference resource DIANA‐TarBase v9.0. 29 DIANA‐miRPath v4.0 was used for miRNA target prediction and enrichment analysis of target genes. 30 Enrichment analysis was performed using gene sets derived from the Kyoto Encyclopedia of Genes and Genomes (KEGG) database. 31 p‐values were corrected for multiple testing using FDR. Adjusted p‐value <0.05 was considered significant.
Statistical analysis
Statistical analyses were carried out using R version 4.3.3. ANOVA were used to compare the means between all three groups followed by Tukey's honest significance test. Receiver operating characteristics (ROC) curves were created using the pROC R package version 1.18.5. 32 The optimal threshold for determining sensitivity and specificity was calculated using min ((1—sensitivities)2 + (1—specificities)2).
Results
Cohort characteristics
The study population consisted of 15 OC patients (OC group), 15 OC patients with anti‐Yo‐associated PCD (PCD group), and 15 age and sex‐matched healthy controls (HC group) (Table 1). One out of the 15 PCD samples was identified as an outlier using principal component analysis and was, therefore, excluded from further analysis (Fig. S1). The age was similar in all groups (p = 0.28). The time between collecting and analyzing samples from the HC group was much lower than in the OC and PCD groups, but similar between the OC and PCD groups (p = 0.10). All patients in the OC group and 11 out of 14 patients in the PCD group had high‐grade serous carcinoma. Most patients in both groups were diagnosed at FIGO stage III.
Table 1.
Clinical characteristics of study population.
| Control (n = 15) | OC (n = 15) | PCD (n = 14) | |
|---|---|---|---|
| Mean age (range) | 62.6 (55–75) | 66.9 (52–84) | 65.0 (56–71) |
| Histology | |||
| High‐grade serous adenocarcinoma | 15 | 11 | |
| High‐grade endometrioid adenocarcinoma | 0 | 1 | |
| High‐grade papillar cystadenocarcinoma | 0 | 1 | |
| High‐grade endometrioid adenocarcinoma | 0 | 1 | |
| FIGO stage | |||
| I‐II | 2 | 3 | |
| III | 9 | 8 | |
| IV | 4 | 2 | |
| Unknown | 0 | 1 | |
| Autoantibody anti‐Yo | 14 | ||
| Mean storage time of samples in years (range) | 0.1 (0.1–0.1) | 9.3 (7–12) | 7.5 (1.9–17.2) |
Small RNA expression in serum exosomes
We characterized the exosomal RNA expression by sequencing small RNAs extracted from serum. On average, 10.8 M unique reads were obtained for each sample. The most abundant type of small RNA identified in all samples were transfer RNAs. The composition of identified RNAs varied between groups (Fig. 1A): PCD samples were enriched for transfer RNAs compared to OC (p = 0.001) and HC samples (p = 0.025) and PCD samples were depleted for rRNAs compared to OC samples (p = 0.023). The proportion of miRNA reads differed significantly between groups (p < 0.05 for all comparisons), with PCD having the lowest, and HC having the highest number. After excluding miRNAs with low expression, a total of 304 miRNAs were included in the downstream analysis.
Figure 1.
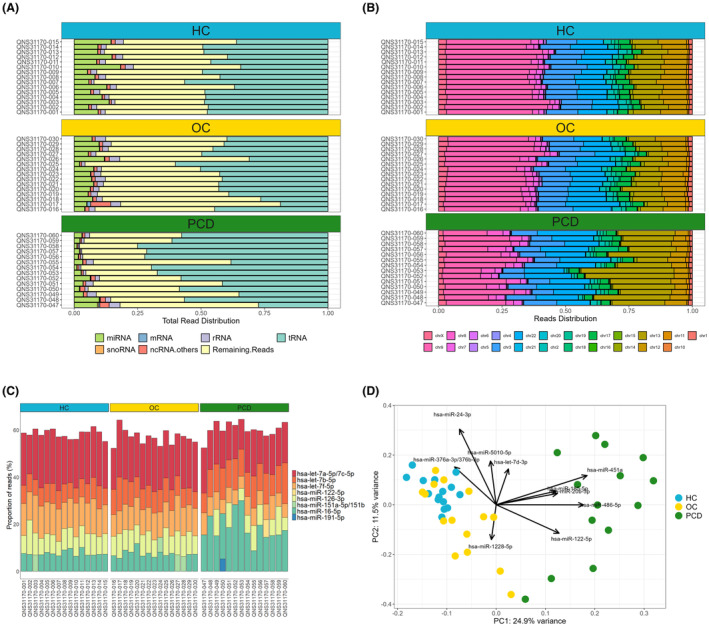
Characterization of exosomal RNA expression. Exosomes were isolated from sera from ovarian cancer (OC) patients, ovarian cancer patients with PCD, and healthy controls (HC). (A) The total read distribution of RNA types detected by small RNA sequencing. (B) The proportion of miRNA reads mapping to each chromosome. (C) The miRNAs with the most reads in each sample. (D) Principal component analysis plot of the miRNA expression. Each point represents a sample and are color‐coded according to sample group. The arrows indicate how strongly each miRNA influences the principal components.
We then investigated the genome location of the detected miRNAs. Most reads mapped to chromosomes 3, 9, 13 and 22, with some variation between the groups (Fig. 1B). In the PCD group, significantly less miRNA reads mapped to chromosomes 3, 9 and 12 compared to the OC and HC groups, whereas significantly more mapped to chromosomes 13 and 22 (p < 0.005 for all comparisons).
In the majority of samples, the most highly expressed miRNAs were let‐7a‐5p/7c‐5p (the sequences of let‐7a‐5p and let‐7c‐5p differs by only one base), let‐7f‐5p, let‐7b‐5p, miR‐16‐5p and miR‐126‐3p (Fig. 1C). These miRNAs accounted for approximately 60% of all miRNA reads in each sample.
Principal component analysis revealed that the PCD samples were separated from the OC and HC samples along the first principal component (Fig. 1D). Using linear regression, we found a significant association between the first principal component (representing the main axis of variation in the dataset) and the condition variable PCD vs the OC and HC groups (p < 2.2e‐16). The OC and HC samples formed partially overlapping clusters along the first and second principal components. The intra‐group variability was highest in the PCD group and lowest in the HC group. The component loadings showed that miR‐451a, miR‐486‐5p, miR‐122‐5p, miR‐20b‐5p and miR‐185‐5p explained the largest amount of variation along the first principal component, and miR‐24‐3p, miR‐5010‐5p, miR‐376a‐3p/376b‐3p, let‐7d‐3p and miR‐1228‐5p explained the largest amount of variation along the second principal component.
Differentially expressed miRNAs in serum exosomes
Next, we analyzed differential expression of exosomal miRNAs. We identified 103 differentially expressed miRNAs between the PCD and OC groups, 139 between the PCD and HC groups, and 16 between the OC and HC groups (Fig. 2A and Table S1). Table 2 summarizes the log2 fold changes and adjusted p‐values for the most significantly differentially expressed miRNAs. The majority (88.3%) of differentially expressed miRNAs identified by comparing PCD and OC patients were also differentially expressed between PCD and HC (Fig. 2B). Out of the 16 differentially expressed miRNAs between OC and HC, 14 were also differentially expressed between PCD and HC, whereas miR‐4488 and miR‐99a‐5p were only differentially expressed between OC and HC. The log2 fold changes of the 14 common miRNAs were larger in the PCD group, except for miR‐483‐5p, miR‐200c‐3p and miR‐100‐5p (Fig. 2C). The majority of the differentially expressed miRNAs when comparing PCD and OC patients, as well as PCD and HC, mapped to chromosomes X, 14 and 17. Most chromosomes showed similar number of up‐ and downregulated miRNAs, except for chromosomes 17, 15, 14, 13, 7 (Fig. S2).
Figure 2.
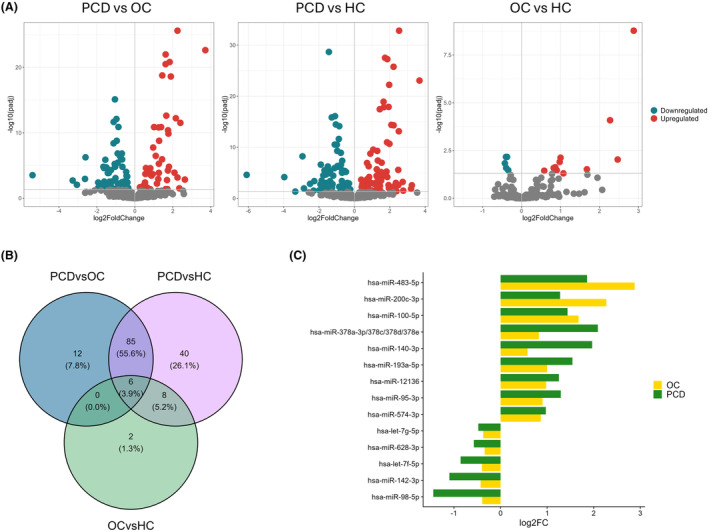
Differentially expressed exosomal miRNAs. (A) Volcano plots of the significantly (FDR <0.05) up‐ (red) and downregulated (blue) miRNAs for each group comparison (panels). (B) Venn diagram of differentially expressed miRNAs between all group comparisons. The intersects represents differentially expressed miRNAs common between group comparisons. (C) Bar plot showing the log2 fold changes (log2FC) of the 14 miRNAs differentially expressed both in OC vs HC and PCD vs HC. HC, healthy controls; OC, ovarian cancer; PCD, paraneoplastic cerebellar degeneration.
Table 2.
Differentially expressed exosomal miRNAs with their associated fold changes and adjusted p‐values.
| Contrast | miRNA | Log2 fold change | Adjusted p‐value |
|---|---|---|---|
| PCD vs OC | hsa‐miR‐486‐5p | 2.25 | 2.52E‐26 |
| hsa‐miR‐451a | 3.71 | 2.38E‐23 | |
| hsa‐miR‐16‐5p | 1.62 | 1.08E‐23 | |
| hsa‐miR‐25‐3p | 1.84 | 1.55E‐21 | |
| hsa‐miR‐185‐5p | 1.62 | 3.29E‐21 | |
| hsa‐miR‐629‐5p | 1.44 | 1.75E‐19 | |
| hsa‐miR‐20b‐5p | 1.90 | 2.51E‐19 | |
| hsa‐miR‐98‐5p | −1.05 | 7.94E‐16 | |
| hsa‐miR‐486‐3p | 1.66 | 2.46E‐13 | |
| hsa‐miR‐15a‐3p | 2.16 | 6.01E‐13 | |
| PCD vs HC | hsa‐miR‐486‐5p | 2.53 | 1.52E‐33 |
| hsa‐miR‐98‐5p | −1.44 | 2.20E‐29 | |
| hsa‐miR‐629‐5p | 1.73 | 3.13E‐28 | |
| hsa‐miR‐185‐5p | 1.86 | 5.62E‐28 | |
| hsa‐miR‐20b‐5p | 2.21 | 1.78E‐26 | |
| hsa‐miR‐451a | 3.68 | 8.81E‐24 | |
| hsa‐miR‐140‐3p | 1.96 | 6.04E‐23 | |
| hsa‐miR‐660‐5p | 1.65 | 1.23E‐19 | |
| hsa‐miR‐486‐3p | 1.93 | 1.28E‐18 | |
| hsa‐miR‐25‐3p | 1.67 | 1.42E‐18 | |
| OC vs HC | hsa‐miR‐483‐5p | 2.88 | 1.68E‐09 |
| hsa‐miR‐200c‐3p | 2.27 | 8.25E‐05 | |
| hsa‐let‐7f‐5p | −0.40 | 6.90E‐03 | |
| hsa‐let‐7g‐5p | −0.37 | 6.90E‐03 | |
| hsa‐miR‐193a‐5p | 1.00 | 7.59E‐03 | |
| hsa‐miR‐4488 | 2.47 | 9.45E‐03 | |
| hsa‐miR‐12136 | 0.98 | 0.011 | |
| hsa‐miR‐142‐3p | −0.43 | 0.015 | |
| hsa‐miR‐574‐3p | 0.87 | 0.024 | |
| hsa‐miR‐378a‐3p/378c/378d/378e | 0.83 | 0.026 |
The table shows the top 10 differentially expressed miRNAs sorted by the adjusted p‐value. See Table S1 for all results. HC, healthy control; OC, ovarian cancer; PCD, paraneoplastic cerebellar degeneration.
Evaluating exosomal miRNAs as diagnostic markers for OC and PCD
Using ROC curves, we assessed the diagnostic performance of exosomal miRNAs for differentiating between OC patients with and without PCD. miR‐486‐5p, miR‐4732‐5p, miR‐98‐5p, miR‐21‐5p, miR‐451a, miR‐486‐3p, miR‐629‐5p, let‐7f‐5p, miR‐16‐5p, and miR‐185‐5p showed the highest area under the curve (AUC) for discriminating PCD patients from OC patients and HC (Fig. 3A). miR‐486‐5p was the best performing miRNA, having a sensitivity and specificity of 100% due to all PCD patients having a higher miR‐486‐5p expression than OC patients and HC. miR‐200c‐3p, miR‐4492, miR‐4488, miR‐505‐5p, miR‐23a‐5p, miR‐342‐5p, miR‐483‐5p, miR‐4433b‐3p, miR‐144‐3p, and miR‐125b‐5p showed the highest AUC for discriminating OC patients from PCD patients and HC (Fig. 3B). The AUC values, sensitivity and specificity of each miRNA are shown in Table 3.
Figure 3.
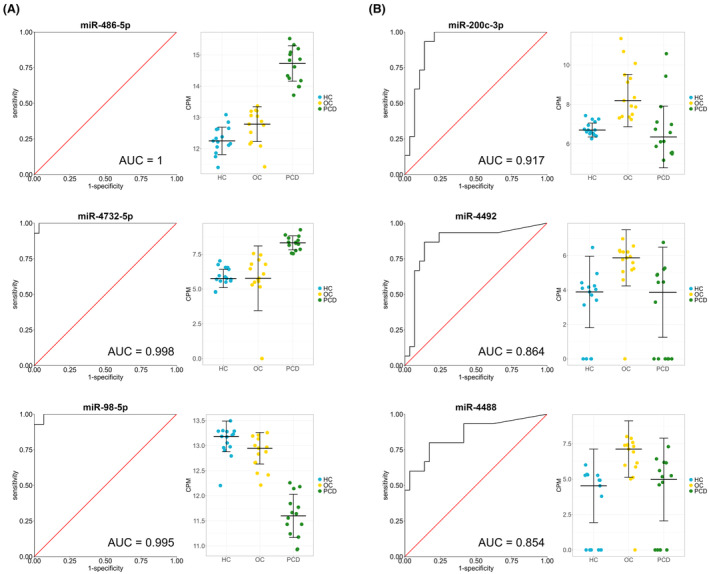
Exosomal miRNAs as biomarkers for ovarian cancer and PCD. ROC curve analysis was performed to assess the diagnostic performance of exosomal miRNAs in discriminating PCD patients from OC patients and healthy controls (A), and OC patients from PCD patients and healthy controls (B). The left panels show the ROC curves where the true positive rate (sensitivity) is plotted against the false positive rate (1—specificity). The right panels show the expression levels as determined by small RNA sequencing and normalized using log2 counts per million (CPM). The horizontal lines indicate the median ± SD. AUC, area under the curve; HC, healthy controls; OC, ovarian cancer; PCD, paraneoplastic cerebellar degeneration.
Table 3.
Receiver operating characteristics curve analysis of exosomal miRNAs for differentiating ovarian cancer patients with and without PCD.
| Contrast | miRNA | AUC | Sensitivity (%) | Specificity (%) |
|---|---|---|---|---|
| PCD vs OC and HC | miR‐486‐5p | 1.000 | 100 | 100 |
| miR‐4732‐5p | 0.998 | 100 | 96.7 | |
| miR‐98‐5p | 0.995 | 100 | 93.3 | |
| miR‐21‐5p | 0.995 | 100 | 93.3 | |
| miR‐451a | 0.993 | 100 | 93.3 | |
| miR‐486‐3p | 0.993 | 100 | 96.7 | |
| miR‐629‐5p | 0.990 | 92.9 | 100 | |
| let‐7f‐5p | 0.988 | 92.3 | 96.7 | |
| miR‐16‐5p | 0.988 | 92.9 | 100 | |
| miR‐185‐5p | 0.988 | 92.9 | 96.7 | |
| OC vs PCD and HC | miR‐200c‐3p | 0.917 | 93.3 | 86.2 |
| miR‐4492 | 0.864 | 86.7 | 86.2 | |
| miR‐4488 | 0.854 | 80.0 | 82.8 | |
| miR‐505‐5p | 0.834 | 73.3 | 79.3 | |
| miR‐23a‐5p | 0.832 | 80.0 | 79.3 | |
| miR‐342‐5p | 0.823 | 66.7 | 79.3 | |
| miR‐483‐5p | 0.823 | 66.7 | 79.3 | |
| miR‐4433b‐3p | 0.818 | 73.3 | 75.9 | |
| miR‐144‐3p | 0.814 | 73.3 | 79.3 | |
| miR‐125b‐5p | 0.811 | 80.0 | 75.9 |
Abbreviations: HC, healthy control; OC, ovarian cancer; PCD, paraneoplastic cerebellar degeneration.
Target‐based miRNA functional analysis
We performed target‐based miRNA functional analysis to investigate potential biological interactions of the exosomal miRNAs. Target genes for the differentially expressed miRNAs were identified using DIANA‐TarBase—a database of experimentally supported miRNA–gene interactions—and enrichment analysis was performed using DIANA‐miRPath. The genes most frequently targeted by upregulated miRNAs derived from the PCD vs OC analysis were AGO2, CLTC, SETD5, SP1, SPTBN1, UBR4, NUFIP2, and SON, whereas downregulated miRNAs targeted DYNC1H1, HUWE1, KMT2A, UBR4, ASH1L, CAND1, KMT2D, and NUFIP2. In the PCD vs HC analysis, the genes most frequently targeted by the upregulated miRNAs were NUFIP2, CLTC, SPTBN1, ADNP, AGO2, CNOT1, PRPF8, and SP1, whereas downregulated miRNAs targeted DYNC1H1, ASH1L, HUWE1, NUFIP2, BIRC6, CLTC, PRPF8, TNPO1, and ZBTB20. In the OC vs HC analysis, the genes most frequently targeted by the upregulated miRNAs were EEF2, FN1, HTT, MED13, MKNK2, NR1D2, and SPTBN1, whereas downregulated miRNAs targeted AGO2, BIRC3, CDK6, HSP90AA1, and HUWE1 (Table S2).
Enrichment analysis of the target genes showed considerable overlap between the three comparisons. Differentially expressed miRNAs consistently targeted genes associated with the cell cycle, signaling pathways (FoxO, Hippo, p53, PI3K‐Akt, HIF‐1, MAPK), various cancers (prostate cancer, hepatocellular carcinoma), proteoglycans, adherens junction, shigellosis, platinum drug resistance, axon guidance, and oocyte meiosis (Fig. 4 and Table S3).
Figure 4.
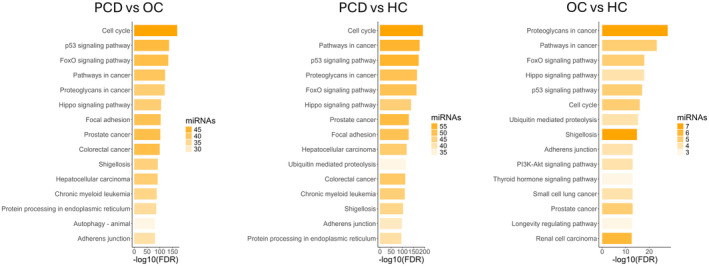
Functional enrichment analysis of the genes targeted by the differentially expressed miRNAs. Enrichment analysis was performed using DIANA‐miRPath on the differentially expressed miRNAs between PCD and OC (n = 103), PCD and healthy controls (n = 139), and OC and healthy controls (n = 16) (panels). The y‐axis represents the enriched KEGG gene sets, the x‐axis represents the false discovery rate (FDR) on the negative log10 scale, and the transparency of the bars represents the number of differentially expressed miRNAs targeting genes in the enriched gene sets. HC, healthy controls; OC, ovarian cancer; PCD, paraneoplastic cerebellar degeneration.
Differentially expressed exosomal miRNAs targeting PCD‐associated CDR2L
We used DIANA‐TarBase to identify miRNAs targeting CDR2 and CDR2L—genes that are associated with the pathogenesis of anti‐Yo‐associated PCD. Of the 103 differentially expressed miRNAs identified in the PCD vs OC analysis, one miRNA (miR‐182‐5p) targeted CDR2, and 23 targeted CDR2L. Of the 139 differentially expressed miRNAs in the PCD vs HC analysis, two (miR‐1‐3p and miR‐182‐5p) targeted CDR2, and 32 targeted CDR2L (Table S4). The miRNAs targeting CDR2L included miR‐486‐5p, miR‐98‐5p, miR‐25‐3p, miR‐20b‐5p, and miR‐16‐5p all of which showed large fold changes between PCD and OC, along with high AUCs in the ROC curve analysis. These miRNAs also targeted RPS6—a potential interaction partner of CDR2L. 10 Enrichment analysis revealed that miR‐486‐5p, miR‐98‐5p, and miR‐16‐5p also targeted genes associated with resistance to EGFR tyrosine kinase inhibitors (MET, RPS6KB1, BCL2, PTEN, NRAS, etc.). Additionally, miR‐98‐5p, miR‐25‐3p, miR‐20b‐5p and miR‐16‐5p targeted genes involved in spinocerebellar ataxia (ATXN1, ATXN3, ATP2A2, MAPK8, NOP56, PIK3CB, PLCB3, PSMC4, etc.) (Table S3). Of the 16 differentially expressed miRNAs between OC and HC, no miRNAs targeted CDR2, while four miRNAs targeted CDR2L (let‐7f‐5p, let‐7g‐5p, miR‐142‐3p, and miR‐98‐5p).
Discussion
We performed RNA sequencing to investigate whether anti‐Yo‐associated PCD alters the exosomal miRNA profiles of OC patients. Our findings showed that OC patients with PCD have a distinct expression profile compared to those without PCD. Further, we identified several miRNAs capable of discriminating PCD patients from both OC patients and controls with a high sensitivity and specificity. These included miR‐486‐5p, miR‐4732‐5p, miR‐98‐5p, and miR‐21‐5p. Several of the differentially expressed miRNAs in PCD patients targeted the CDR2 and CDR2L genes which are associated with the pathogenesis of anti‐Yo‐associated PCD.
Altered exosomal miRNA expression has been reported in several autoimmune and neurodegenerative disorders including paraneoplastic autoimmune encephalitis, 16 myasthenia gravis, 33 multiple sclerosis, 17 Parkinson's disease, and Alzheimer's disease. 18 , 34 Whether changes in miRNAs contribute to disease pathogenesis remains, however, unclear. Similar to PCD, paraneoplastic autoimmune encephalitis is characterized by the presence of underlying malignancy and autoantibodies targeting neuronal antigens, leading to neuroinflammation. Comparing exosomal miRNAs dysregulated in both PCD and paraneoplastic autoimmune encephalitis shows that miR‐15b‐5p, miR‐20b‐5p, miR‐21‐5p, miR‐34a‐5p, miR‐146a‐5p, and miR‐340‐5p are dysregulated in both, with miR‐34a‐5p and miR‐146a‐5p showing dysregulation in the same direction. 16 Interestingly, the anti‐inflammatory miR‐146a‐5p was downregulated in both diseases. miR‐146a is essential for the immune‐suppressive functions of regulatory T cells and mice harboring miR‐146a‐deficient regulatory T cells develop severe autoimmunity. 35 miR‐34a, which was upregulated in both PCD and autoimmune encephalitis, is an important regulator of T cell activation, 36 suggesting that dysregulation of exosomal miRNAs could be a contributor to the aberrant immune responses seen in paraneoplastic neurological syndromes.
The effect of inflammation in PCD is also of interest in understanding the pathogenesis of PCD. Tumor tissue in PCD patients is heavily infiltrated by immune cells. 11 , 12 Ridder et al. demonstrated that peripheral inflammation both altered the miRNA content of exosomes and increased the rate of exosome transfer from hematopoietic cells to Purkinje cells in mice. 37 This suggests that the immune response seen in the tumor tissue of PCD patients may influence the composition of miRNAs in the circulating exosomes and the transfer rate of exosomal miRNAs to the brain.
The CDR2L protein has been identified as the major target of the PCD‐associated autoantibody anti‐Yo, 9 and interaction between anti‐Yo and CDR2L has been shown to cause Purkinje cell death in vitro. 38 , 39 Animal models have, however, failed to demonstrate the pathogenicity of anti‐Yo. 40 , 41 , 42 The altered expression of exosomal miRNAs targeting CDR2L observed in PCD patients is, therefore, of particular interest. In both cancer cells and Purkinje cells, CDR2L colocalizes with ribosomes and interacts with the ribosomal protein RPS6. 10 miR‐486‐5p, miR‐98‐5p, miR‐25‐3p, miR‐20b‐5p, and miR‐16‐5p, which were all highly differentially expressed in PCD patients, were found to target both the CDR2L and RPS6 genes using the DIANA‐TarBase database of experimentally supported miRNA–gene interactions. Although these interactions need validation, they raise the possibility of novel pathways in which exosomal miRNAs may interfere with the expression of CDR2L and thus contribute to Purkinje cell dysfunction. Further, the enrichment analysis showed that several of the dysregulated miRNAs in PCD patients also targeted genes associated with spinocerebellar ataxia—a heterogeneous, neurodegenerative disease that mainly affects the cerebellum causing gait ataxia, nystagmus and dysarthria, 43 similar to the symptoms seen in PCD. 1
The involvement of exosomes in PCD and whether the altered miRNA profiles contribute to pathogenesis are important questions for future research. Establishing the cellular origin of the exosomes and determining which cells contribute to the altered miRNA profiles will be crucial. Immunocapture‐based approaches have been used to isolate exosomes derived from cells of the central nervous system, 44 T cells, 45 and tumor cells. 46 However, isolation of tumor cell‐derived exosomes requires antibodies against tumor‐specific antigens, which can be challenging to identify. Comparative analysis of serum‐ and cerebrospinal fluid‐derived exosomes in PCD would help establish whether the observed changes in miRNAs also occur within the central nervous system. In multiple sclerosis, partial overlap of differentially expressed exosomal miRNAs were found between serum and cerebrospinal fluid, with some miRNAs only altered in the cerebrospinal fluid. 47 Further, uptake of exosomes into Purkinje cells could be explored using organotypic brain slice cultures or Purkinje cell cultures. A detailed characterization of the exosome cargo could identify other factors relevant for PCD pathogenesis. For example, in paraneoplastic autoimmune encephalitis, exosomes derived from serum and cerebrospinal fluid contained specific neuronal autoantigens. 48 Administration of these exosomes to mice resulted in generation of antibodies targeting NMDAR, AMPAR, GABABR, LGI1, and CASPR2, indicating a potential role of exosomes in the development or maintenance of autoimmunity. 48
While the diagnosis of PCD depends on the detection of autoantibodies in serum or cerebrospinal fluid, the widely used commercial immunoassays suffer from a low specificity for anti‐Yo. 49 Although the addition of CDR2L as a diagnostic marker has been shown to improve the specificity, 50 new diagnostic approaches should be explored. Here, we identified several miRNAs capable of discriminating PCD patients from OC patients without PCD and controls with high sensitivity and specificity, suggesting a potential role as biomarkers. Principal component analysis showed high intra‐group variability within the PCD group meaning that the diagnostic performance of miRNAs needs to be tested in larger cohorts of PCD patients including those with different underlying malignancies and autoantibodies, as well as patients with other paraneoplastic neurological syndromes, cerebellar ataxias, and neurodegenerative diseases. Moreover, use of exosomal miRNAs as biomarkers would require rigorous standardization of the methodology since sample source, and methods used for exosome isolation and miRNA quantification can profoundly affect miRNA profiles. 51 , 52 A review of differential expressed miRNAs reported in multiple sclerosis found that only 27.5% of the differential expressed miRNAs were found to be dysregulated in the same direction in at least two independent studies, highlighting the lack of replication between studies. 53
The majority of the differentially expressed miRNAs between OC and HC were also differentially expressed between PCD and HC, suggesting that these miRNAs are associated with the OC. Several of these have previously been found to be dysregulated in OC, including miR‐200c‐3p, 54 miR‐483‐5p, 55 miR‐100‐5p, 56 miR‐574‐3p, and hsa‐let‐7f‐5p. 57 In the current study, miR‐200c‐3p was upregulated in OC patients both with and without PCD, with a larger fold change seen in the OC patients without PCD. Higher levels of miR‐200c have been found to be associated with advanced stage and shorter overall survival in OC patients. 54 Elias et al. showed that the circulating levels of miR‐200c decreased following tumor removal, suggesting that miR‐200c is actively produced by the tumor. 19 However, miR‐200c is not a specific biomarker for OC, as it has been found to be dysregulated in several cancers, including colorectal cancer, 58 pancreatic cancer, 59 and liver cancer. 60 Therefore, miR‐200c by itself is not sufficient in order to discriminate specific pathologies and should be used in conjunction with other biomarkers and clinical information.
In conclusion, our results demonstrate that the exosomal miRNA profiles of OC patients with anti‐Yo‐associated PCD are significantly different from both OC patients without PCD and healthy controls, indicating a potential for exosomal miRNAs as biomarkers for PCD. Several of the differentially expressed miRNAs in PCD targeted the CDR2L gene which may be relevant for understanding the pathogenesis of PCD. Therefore, future studies should explore the potential pathogenic role of exosomes and miRNAs in PCD.
Conflict of Interest
Nothing to report.
Author Contributions
E.T.S., L.C.V.T., L.B., V.D., C.T., and C.A.V. contributed to the conception and design of the study; E.T.S., L.C.V.T., L.B., E.P., and V.D. contributed to the acquisition and analysis of data; E.T.S., L.C.V.T., L.B., S.A., V.D., C.T., and C.A.V. contributed to drafting the manuscript.
Supporting information
Figure S1.
Figure S2.
Table S1.
Table S2.
Table S3.
Table S4.
Captions.
Acknowledgements
We would like to thank Gonzalo S. Nido for technical assistance with the data analysis, and Kadri Madisoo for assisting with the samples from the Bergen Gynecologic Cancer Biobank. We thank Valentin Wucher and Laurence Bindoff for valuable inputs to the manuscript. This work was supported by grants from the Gerda Meyer Nyquist Gulbranson & Gerdt Meyer Nyquist Legacy.
Funding Statement
This work was funded by Gerda Meyer Nyquist Gulbranson & Gerdt Meyer Nyquist Legacy grant 102230101.
Contributor Information
Eirik Tveit Solheim, Email: eirik.t.solheim@uib.no.
Christian A. Vedeler, Email: christian.vedeler@uib.no.
Data Availability Statement
The data that support the findings of this study are available on reasonable request from the corresponding author. The data are not publicly available due to privacy or ethical restrictions.
References
- 1. Venkatraman A, Opal P. Paraneoplastic cerebellar degeneration with anti‐Yo antibodies ‐ a review. Ann Clin Transl Neurol. 2016;3(8):655‐663. [DOI] [PMC free article] [PubMed] [Google Scholar]
- 2. Graus F, Vogrig A, Muñiz‐Castrillo S, et al. Updated diagnostic criteria for paraneoplastic neurologic syndromes. Neurol Neuroimmunol Neuroinflamm. 2021;8(4):e1014. [DOI] [PMC free article] [PubMed] [Google Scholar]
- 3. Loehrer PA, Zieger L, Simon OJ. Update on paraneoplastic cerebellar degeneration. Brain Sci. 2021;11(11):1414. [DOI] [PMC free article] [PubMed] [Google Scholar]
- 4. Ducray F, Demarquay G, Graus F, et al. Seronegative paraneoplastic cerebellar degeneration: the PNS Euronetwork experience. Eur J Neurol. 2014;21(5):731‐735. [DOI] [PubMed] [Google Scholar]
- 5. McKeon A, Tracy JA, Pittock SJ, Parisi JE, Klein CJ, Lennon VA. Purkinje cell cytoplasmic autoantibody type 1 accompaniments: the cerebellum and beyond. Arch Neurol. 2011;68(10):1282‐1289. [DOI] [PubMed] [Google Scholar]
- 6. Monstad SE, Storstein A, Dørum A, et al. Yo antibodies in ovarian and breast cancer patients detected by a sensitive immunoprecipitation technique. Clin Exp Immunol. 2006;144(1):53‐58. [DOI] [PMC free article] [PubMed] [Google Scholar]
- 7. Fathallah‐Shaykh H, Wolf S, Wong E, Posner JB, Furneaux HM. Cloning of a leucine‐zipper protein recognized by the sera of patients with antibody‐associated paraneoplastic cerebellar degeneration. Proc Natl Acad Sci USA. 1991;88(8):3451‐3454. [DOI] [PMC free article] [PubMed] [Google Scholar]
- 8. Eichler TW, Totland C, Haugen M, et al. CDR2L antibodies: a new player in paraneoplastic cerebellar degeneration. PLoS One. 2013;8(6):e66002. [DOI] [PMC free article] [PubMed] [Google Scholar]
- 9. Kråkenes T, Herdlevaer I, Raspotnig M, et al. CDR2L is the major Yo antibody target in paraneoplastic cerebellar degeneration. Ann Neurol. 2019;86(2):316‐321. [DOI] [PubMed] [Google Scholar]
- 10. Herdlevaer I, Kråkenes T, Schubert M, Vedeler CA. Localization of CDR2L and CDR2 in paraneoplastic cerebellar degeneration. Ann Clin Transl Neurol. 2020;7(11):2231‐2242. [DOI] [PMC free article] [PubMed] [Google Scholar]
- 11. Small M, Treilleux I, Couillault C, et al. Genetic alterations and tumor immune attack in Yo paraneoplastic cerebellar degeneration. Acta Neuropathol. 2018;135(4):569‐579. [DOI] [PubMed] [Google Scholar]
- 12. Peter E, Treilleux I, Wucher V, et al. Immune and genetic signatures of breast carcinomas triggering anti‐Yo–associated paraneoplastic cerebellar degeneration. Neurol Neuroimmunol Neuroinflamm. 2022;9(5):e200015. [DOI] [PMC free article] [PubMed] [Google Scholar]
- 13. Barros FM, Carneiro F, Machado JC, Melo SA. Exosomes and immune response in cancer: friends or foes? Front Immunol. 2018;9:730. [DOI] [PMC free article] [PubMed] [Google Scholar]
- 14. Goldie BJ, Dun MD, Lin M, et al. Activity‐associated miRNA are packaged in Map1b‐enriched exosomes released from depolarized neurons. Nucleic Acids Res. 2014;42(14):9195‐9208. [DOI] [PMC free article] [PubMed] [Google Scholar]
- 15. Guduric‐Fuchs J, O'Connor A, Camp B, et al. Selective extracellular vesicle‐mediated export of an overlapping set of microRNAs from multiple cell types. BMC Genomics. 2012;13:357. [DOI] [PMC free article] [PubMed] [Google Scholar]
- 16. Li Y, Gu J, Mao Y, et al. Cerebrospinal fluid extracellular vesicles with distinct properties in autoimmune encephalitis and herpes simplex encephalitis. Mol Neurobiol. 2022;59(4):2441‐2455. [DOI] [PMC free article] [PubMed] [Google Scholar]
- 17. Ebrahimkhani S, Vafaee F, Young PE, et al. Exosomal microRNA signatures in multiple sclerosis reflect disease status. Sci Rep. 2017;7(1):14293. [DOI] [PMC free article] [PubMed] [Google Scholar]
- 18. Gui Y, Liu H, Zhang L, Lv W, Hu XY. Altered microRNA profiles in cerebrospinal fluid exosome in Parkinson disease and Alzheimer disease. Oncotarget. 2015;6(35):37043‐37053. [DOI] [PMC free article] [PubMed] [Google Scholar]
- 19. Elias KM, Fendler W, Stawiski K, et al. Diagnostic potential for a serum miRNA neural network for detection of ovarian cancer. elife. 2017;6:6. [DOI] [PMC free article] [PubMed] [Google Scholar]
- 20. Gahlawat AW, Witte T, Haarhuis L, Schott S. A novel circulating miRNA panel for non‐invasive ovarian cancer diagnosis and prognosis. Br J Cancer. 2022;127(8):1550‐1556. [DOI] [PMC free article] [PubMed] [Google Scholar]
- 21. Frisk NLS, Sørensen AE, Pedersen OBV, Dalgaard LT. Circulating microRNAs for early diagnosis of ovarian cancer: a systematic review and meta‐analysis. Biomolecules. 2023;13(5):871. [DOI] [PMC free article] [PubMed] [Google Scholar]
- 22. Berek JS, Renz M, Kehoe S, Kumar L, Friedlander M. Cancer of the ovary, fallopian tube, and peritoneum: 2021 update. Int J Gynaecol Obstet. 2021;155(Suppl 1):61‐85. [DOI] [PMC free article] [PubMed] [Google Scholar]
- 23. Patil AH, Halushka MK. miRge3.0: a comprehensive microRNA and tRF sequencing analysis pipeline. NAR Genom Bioinform. 2021;3(3):lqab068. [DOI] [PMC free article] [PubMed] [Google Scholar]
- 24. Martin M. Cutadapt removes adapter sequences from high‐throughput sequencing reads. EMBnet J. 2011;17(1):3. [Google Scholar]
- 25. Kozomara A, Birgaoanu M, Griffiths‐Jones S. miRBase: from microRNA sequences to function. Nucleic Acids Res. 2019;47(D1):D155‐D162. [DOI] [PMC free article] [PubMed] [Google Scholar]
- 26. Langmead B, Trapnell C, Pop M, Salzberg SL. Ultrafast and memory‐efficient alignment of short DNA sequences to the human genome. Genome Biol. 2009;10(3):R25. [DOI] [PMC free article] [PubMed] [Google Scholar]
- 27. Love MI, Huber W, Anders S. Moderated estimation of fold change and dispersion for RNA‐seq data with DESeq2. Genome Biol. 2014;15(12):550. [DOI] [PMC free article] [PubMed] [Google Scholar]
- 28. Wickham H, Averick M, Bryan J, et al. Welcome to the Tidyverse. J Open Source Softw. 2019;4(43):1686. [Google Scholar]
- 29. Skoufos G, Kakoulidis P, Tastsoglou S, et al. TarBase‐v9.0 extends experimentally supported miRNA–gene interactions to cell‐types and virally encoded miRNAs. Nucleic Acids Res. 2023;52(D1):D304‐D310. [DOI] [PMC free article] [PubMed] [Google Scholar]
- 30. Tastsoglou S, Skoufos G, Miliotis M, et al. DIANA‐miRPath v4.0: expanding target‐based miRNA functional analysis in cell‐type and tissue contexts. Nucleic Acids Res. 2023;51(W1):W154‐W159. [DOI] [PMC free article] [PubMed] [Google Scholar]
- 31. Kanehisa M, Furumichi M, Sato Y, Kawashima M, Ishiguro‐Watanabe M. KEGG for taxonomy‐based analysis of pathways and genomes. Nucleic Acids Res. 2023;51(D1):D587‐D592. [DOI] [PMC free article] [PubMed] [Google Scholar]
- 32. Robin X, Turck N, Hainard A, et al. pROC: an open‐source package for R and S+ to analyze and compare ROC curves. BMC Bioinformatics. 2011;12(1):77. [DOI] [PMC free article] [PubMed] [Google Scholar]
- 33. Xu H, Bao Z, Liang D, et al. Plasma exosomal miR‐106a‐5p expression in myasthenia gravis. Muscle Nerve. 2020;61(3):401‐407. [DOI] [PubMed] [Google Scholar]
- 34. Wang L, Zhang L. Circulating Exosomal miRNA as diagnostic biomarkers of neurodegenerative diseases. Front Mol Neurosci. 2020;13:53. [DOI] [PMC free article] [PubMed] [Google Scholar]
- 35. Lu L‐F, Boldin MP, Chaudhry A, et al. Function of miR‐146a in controlling Treg cell‐mediated regulation of Th1 responses. Cell. 2010;142(6):914‐929. [DOI] [PMC free article] [PubMed] [Google Scholar]
- 36. Taheri F, Ebrahimi SO, Shareef S, Reiisi S. Regulatory and immunomodulatory role of miR‐34a in T cell immunity. Life Sci. 2020;262:118209. [DOI] [PubMed] [Google Scholar]
- 37. Ridder K, Keller S, Dams M, et al. Extracellular vesicle‐mediated transfer of genetic information between the hematopoietic system and the brain in response to inflammation. PLoS Biol. 2014;12(6):e1001874. [DOI] [PMC free article] [PubMed] [Google Scholar]
- 38. Greenlee JE, Clawson SA, Hill KE, et al. Anti‐Yo antibody uptake and interaction with its intracellular target antigen causes Purkinje cell death in rat cerebellar slice cultures: a possible mechanism for paraneoplastic cerebellar degeneration in humans with gynecological or breast cancers. PLoS One. 2015;10(4):e0123446. [DOI] [PMC free article] [PubMed] [Google Scholar]
- 39. Panja D, Vedeler CA, Schubert M. Paraneoplastic cerebellar degeneration: Yo antibody alters mitochondrial calcium buffering capacity. Neuropathol Appl Neurobiol. 2019;45(2):141‐156. [DOI] [PMC free article] [PubMed] [Google Scholar]
- 40. Tanaka K, Tanaka M, Onodera O, Igarashi S, Miyatake T, Tsuji S. Passive transfer and active immunization with the recombinant leucine‐zipper (Yo) protein as an attempt to establish an animal model of paraneoplastic cerebellar degeneration. J Neurol Sci. 1994;127(2):153‐158. [DOI] [PubMed] [Google Scholar]
- 41. Graus F, Illa I, Agusti M, Ribalta T, Cruz‐Sanchez F, Juarez C. Effect of intraventricular injection of an anti‐Purkinje cell antibody (anti‐Yo) in a Guinea pig model. J Neurol Sci. 1991;106(1):82‐87. [DOI] [PubMed] [Google Scholar]
- 42. Faure F, Yshii L, Renno T, et al. A pilot study to develop paraneoplastic cerebellar degeneration mouse model. Cerebellum (London, England). 2024;23(1):181‐196. [DOI] [PubMed] [Google Scholar]
- 43. Sullivan R, Yau WY, O'Connor E, Houlden H. Spinocerebellar ataxia: an update. J Neurol. 2019;266(2):533‐544. [DOI] [PMC free article] [PubMed] [Google Scholar]
- 44. Hornung S, Dutta S, Bitan G. CNS‐derived blood exosomes as a promising source of biomarkers: opportunities and challenges. Front Mol Neurosci. 2020;13:38. [DOI] [PMC free article] [PubMed] [Google Scholar]
- 45. Theodoraki MN, Hoffmann TK, Whiteside TL. Separation of plasma‐derived exosomes into CD3((+)) and CD3((−)) fractions allows for association of immune cell and tumour cell markers with disease activity in HNSCC patients. Clin Exp Immunol. 2018;192(3):271‐283. [DOI] [PMC free article] [PubMed] [Google Scholar]
- 46. Sharma P, Ludwig S, Muller L, et al. Immunoaffinity‐based isolation of melanoma cell‐derived exosomes from plasma of patients with melanoma. J Extracell Vesicles. 2018;7(1):1435138. [DOI] [PMC free article] [PubMed] [Google Scholar]
- 47. Mohammadinasr M, Montazersaheb S, Molavi O, et al. Multiplex analysis of cerebrospinal fluid and serum exosomes MicroRNAs of untreated relapsing remitting multiple sclerosis (RRMS) and proposing noninvasive diagnostic biomarkers. NeuroMolecular Med. 2023;25(3):402‐414. [DOI] [PubMed] [Google Scholar]
- 48. Gu J, Jin T, Li Z, et al. Exosomes expressing neuronal autoantigens induced immune response in antibody‐positive autoimmune encephalitis. Mol Immunol. 2021;131:164‐170. [DOI] [PubMed] [Google Scholar]
- 49. Déchelotte B, Muñiz‐Castrillo S, Joubert B, et al. Diagnostic yield of commercial immunodots to diagnose paraneoplastic neurologic syndromes. Neurol Neuroimmunol Neuroinflamm. 2020;7(3):e701. [DOI] [PMC free article] [PubMed] [Google Scholar]
- 50. Erikstad KI, Herdlevaer I, Peter E, et al. A cerebellar degeneration‐related protein 2‐like cell‐based assay for anti‐Yo detection in patients with paraneoplastic cerebellar degeneration. Eur J Neurol. 2023;30(6):1727‐1733. [DOI] [PubMed] [Google Scholar]
- 51. Nasu M, Khadka VS, Jijiwa M, Kobayashi K, Deng Y. Exploring optimal biomarker sources: a comparative analysis of exosomes and whole plasma in fasting and non‐fasting conditions for liquid biopsy applications. Int J Mol Sci. 2024;25(1):371. [DOI] [PMC free article] [PubMed] [Google Scholar]
- 52. Van Deun J, Mestdagh P, Sormunen R, et al. The impact of disparate isolation methods for extracellular vesicles on downstream RNA profiling. J Extracell Vesicles. 2014;3:24858. [DOI] [PMC free article] [PubMed] [Google Scholar]
- 53. Piket E, Zheleznyakova GY, Kular L, Jagodic M. Small non‐coding RNAs as important players, biomarkers and therapeutic targets in multiple sclerosis: a comprehensive overview. J Autoimmun. 2019;101:17‐25. [DOI] [PubMed] [Google Scholar]
- 54. Meng X, Müller V, Milde‐Langosch K, Trillsch F, Pantel K, Schwarzenbach H. Diagnostic and prognostic relevance of circulating exosomal miR‐373, miR‐200a, miR‐200b and miR‐200c in patients with epithelial ovarian cancer. Oncotarget. 2016;7(13):16923‐16935. [DOI] [PMC free article] [PubMed] [Google Scholar]
- 55. Yu X, Zhang X, Bi T, et al. MiRNA expression signature for potentially predicting the prognosis of ovarian serous carcinoma. Tumour Biol. 2013;34(6):3501‐3508. [DOI] [PubMed] [Google Scholar]
- 56. Pan C, Stevic I, Müller V, et al. Exosomal microRNAs as tumor markers in epithelial ovarian cancer. Mol Oncol. 2018;12(11):1935‐1948. [DOI] [PMC free article] [PubMed] [Google Scholar]
- 57. Liu J, Yoo J, Ho JY, et al. Plasma‐derived exosomal miR‐4732‐5p is a promising noninvasive diagnostic biomarker for epithelial ovarian cancer. J Ovarian Res. 2021;14(1):59. [DOI] [PMC free article] [PubMed] [Google Scholar]
- 58. Kang E, Jung SC, Nam SK, et al. Tissue miR‐200c‐3p and circulating miR‐1290 as potential prognostic biomarkers for colorectal cancer. Sci Rep. 2022;12(1):2295. [DOI] [PMC free article] [PubMed] [Google Scholar]
- 59. Paik WH, Song BJ, Kim HW, Kim HR, Hwang JH. MicroRNA‐200c as a prognostic biomarker for pancreatic cancer. Korean J Gastroenterol. 2015;66(4):215‐220. [DOI] [PubMed] [Google Scholar]
- 60. de la Cruz‐Ojeda P, Schmid T, Boix L, et al. miR‐200c‐3p, miR‐222‐5p, and miR‐512‐3p constitute a biomarker signature of sorafenib effectiveness in advanced hepatocellular carcinoma. Cells. 2022;11(17):2673. [DOI] [PMC free article] [PubMed] [Google Scholar]
Associated Data
This section collects any data citations, data availability statements, or supplementary materials included in this article.
Supplementary Materials
Figure S1.
Figure S2.
Table S1.
Table S2.
Table S3.
Table S4.
Captions.
Data Availability Statement
The data that support the findings of this study are available on reasonable request from the corresponding author. The data are not publicly available due to privacy or ethical restrictions.